
The Daily Shot: 27-Oct-21
• The United States
• Canada
• The United Kingdom
• The Eurozone
• Europe
• Asia – Pacific
• China
• Emerging Markets
• Cryptocurrency
• Energy
• Equities
• Rates
• Global Developments
• Food for Thought
The United States
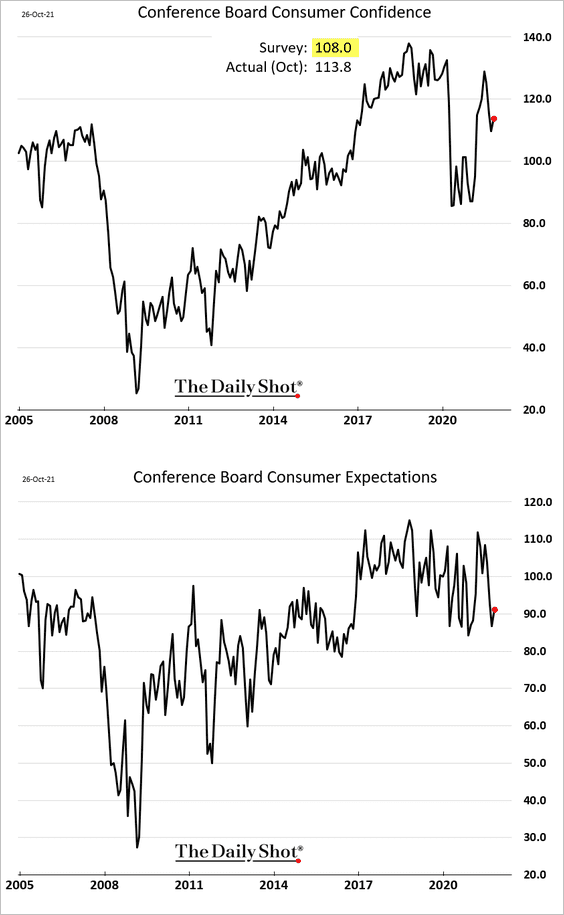
1. The Conference Board’s consumer sentiment index unexpectedly improved this month despite elevated prices and product shortages/delays.
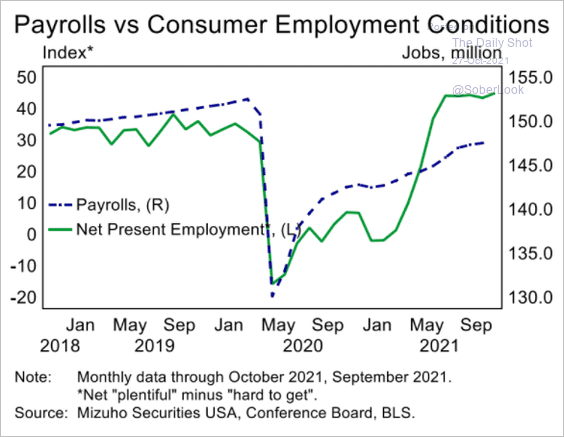
• The labor differential (“jobs plentiful” – “jobs hard to get”) hit the highest level in over two decades, …
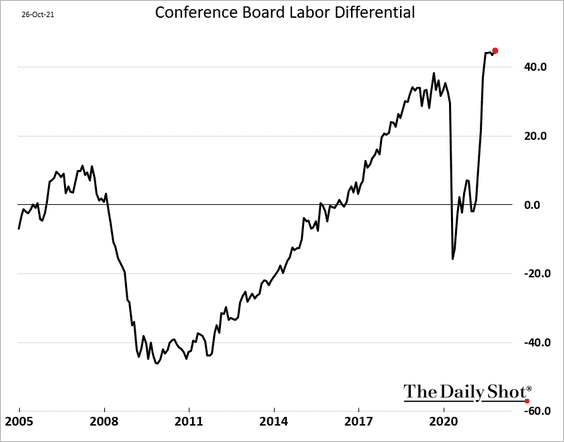
… pointing to strength in the labor market.
 Source: Mizuho Securities USA
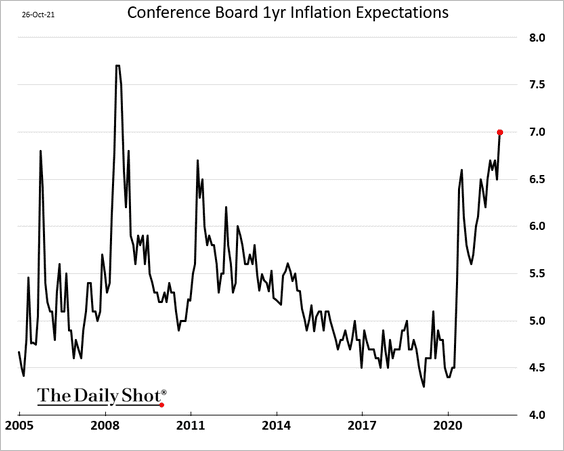
• The Conference Board’s measure of consumer inflation expectations climbed to the highest level since 2008.
——————–
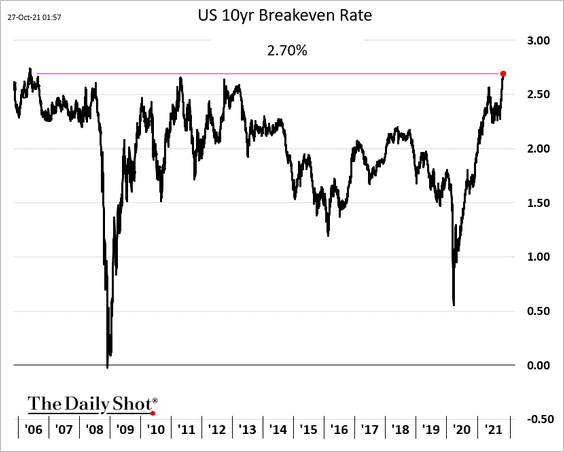
2. Market-based inflation expectations are climbing as well. The 10yr breakeven rate reached 2.7% for the first time since 2006.
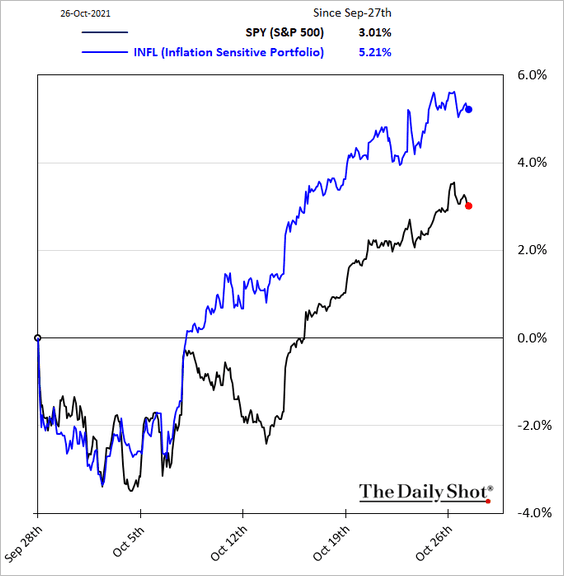
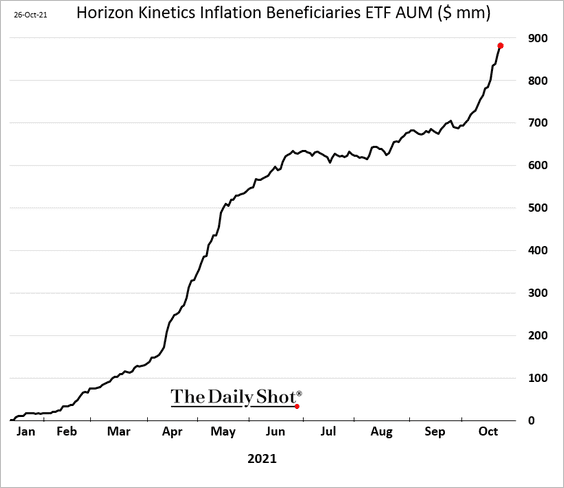
The stock market is also betting on higher inflation. The Horizon Kinetics Inflation Beneficiaries ETF has been outperforming.
The ETF, which was launched at the beginning of the year, is approaching $900 mm in AUM.
——————–
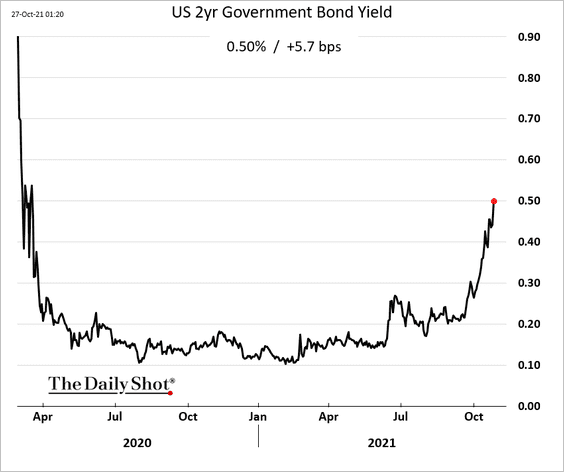
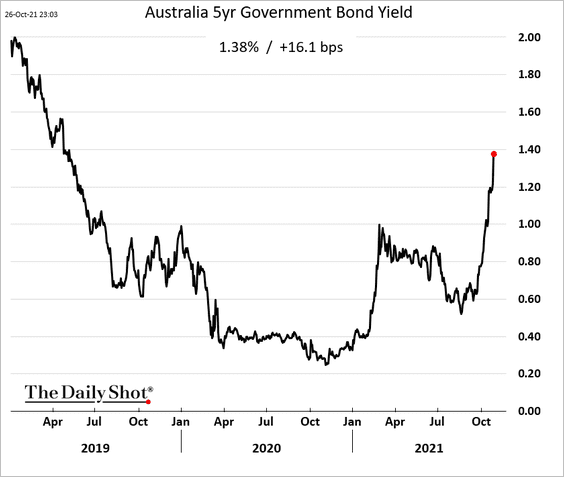
3. Today’s inflation data from Australia is boosting bond yields around the world. The 2yr Treasury yield hit 0.5% for the first time since April of 2020.
4. Economists continue to upgrade their inflation forecasts while lowering growth expectations for next year.
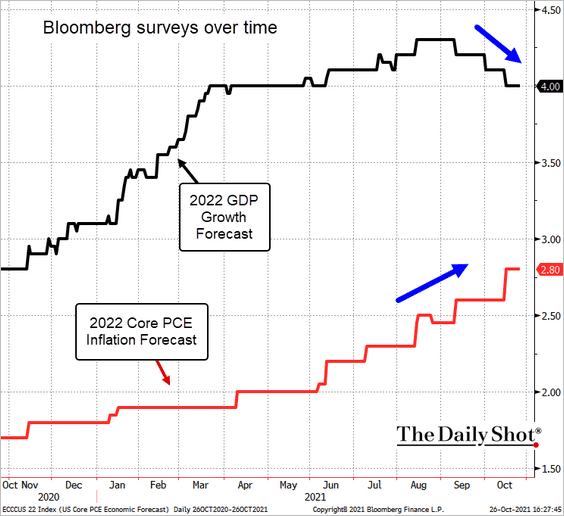 Source: @TheTerminal, Bloomberg Finance L.P.; h/t Alpine Macro
5. The Richmond Fed’s regional manufacturing report showed a rebound in factory activity this month.
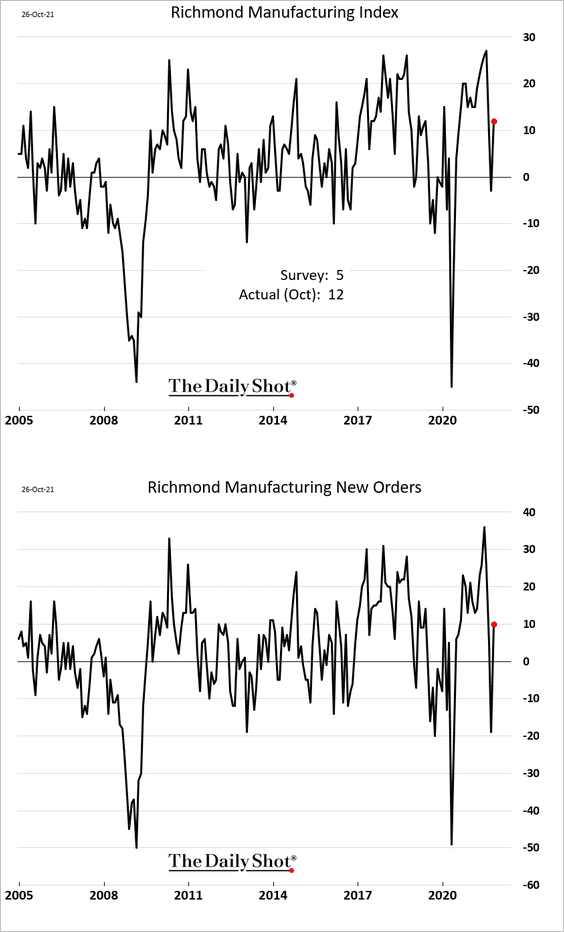
• Supply bottlenecks are at extreme levels.
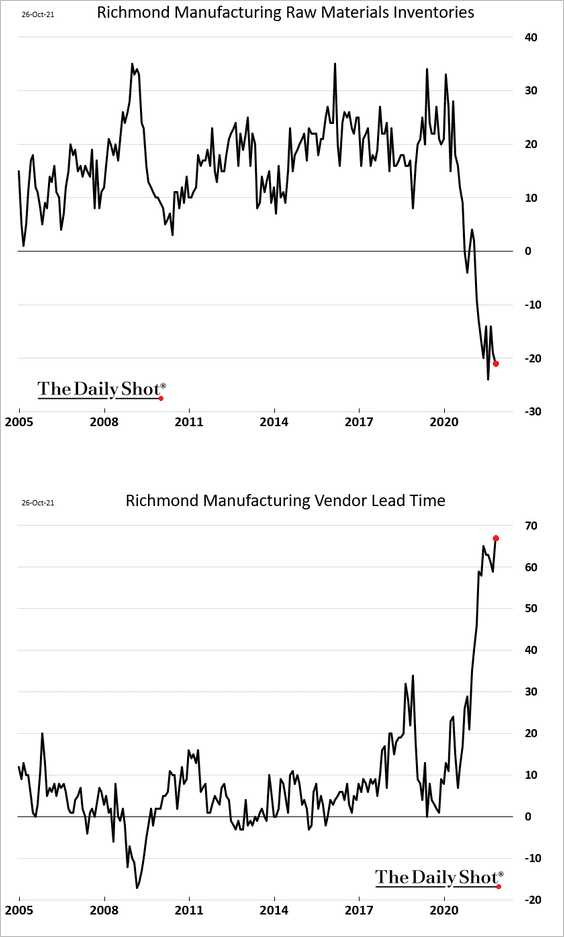
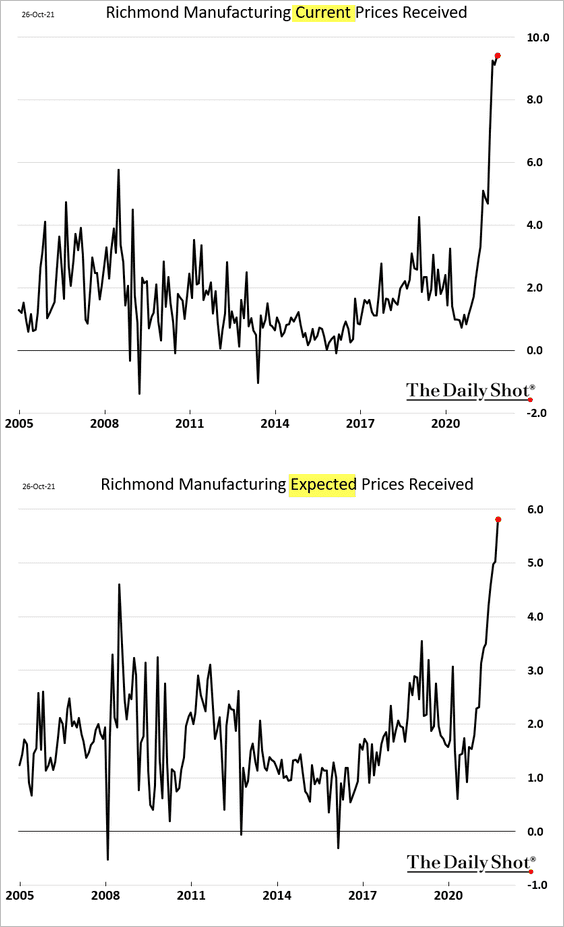
• Manufacturers are rapidly boosting prices and expect to keep doing so in the months ahead.
——————–
6. Next, we have some updates on the housing market.
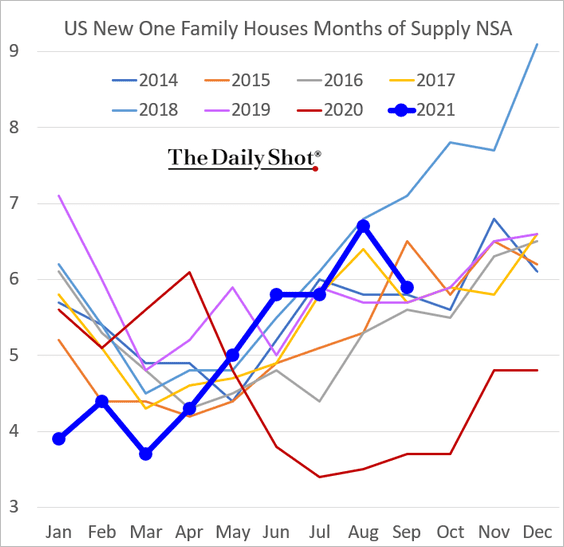
• New housing sales rebounded last month.
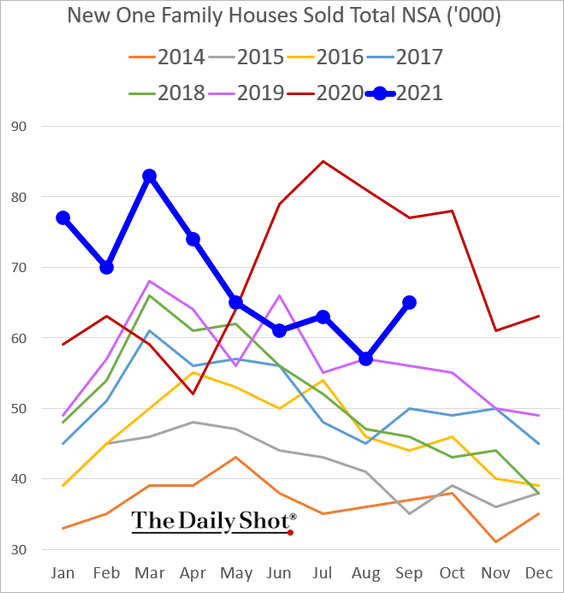
– Inventories are back near 2019 levels.
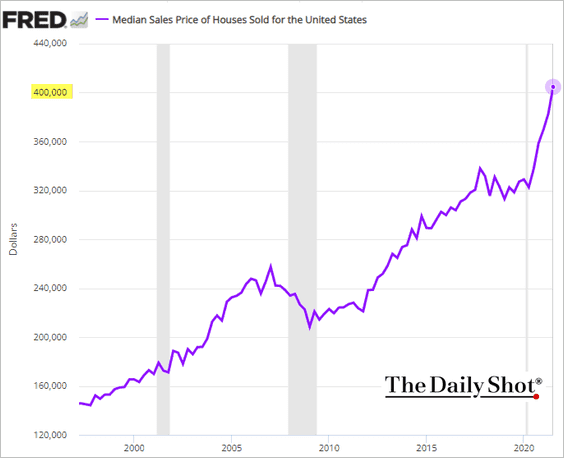
– The median price of a new home continues to soar.
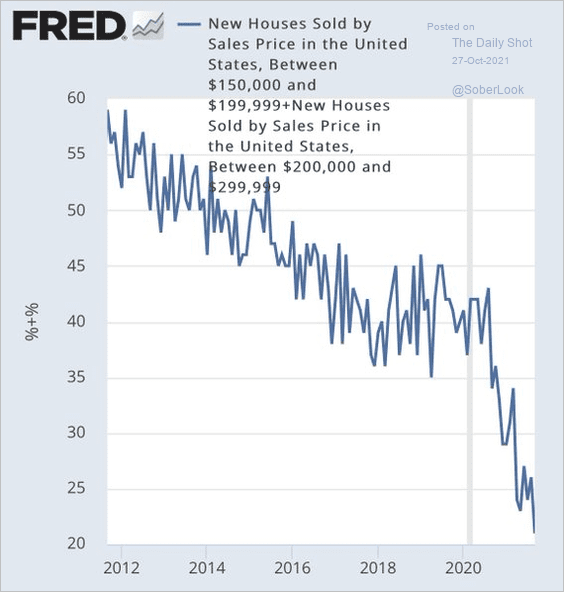
The percentage of new homes priced under $300k is dwindling quickly.
 Source: @conorsen
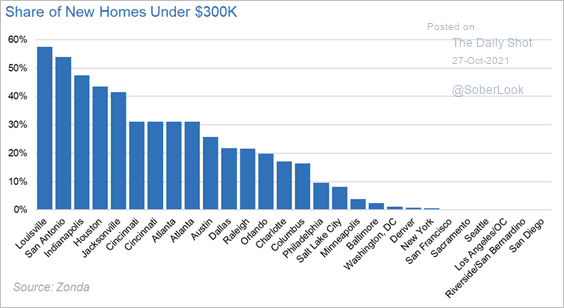 Source: @AliWolfEcon
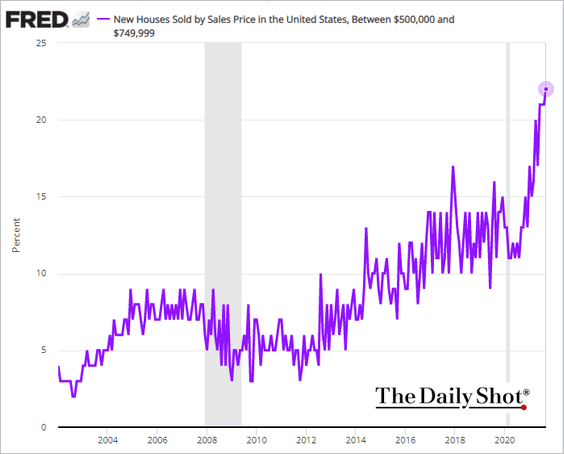
The share of homes above $500k is surging.
– The share of completed homes sold remains relatively low.
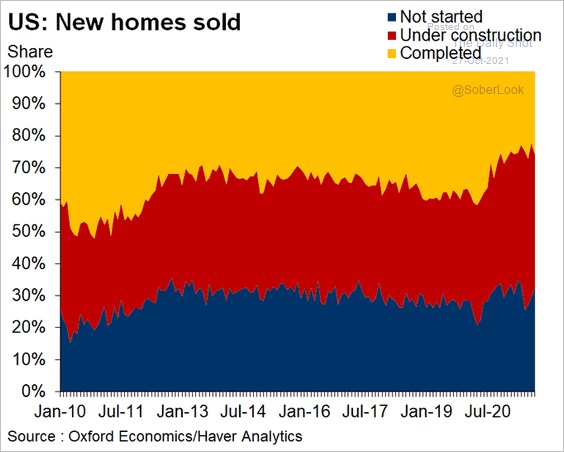 Source: @GregDaco
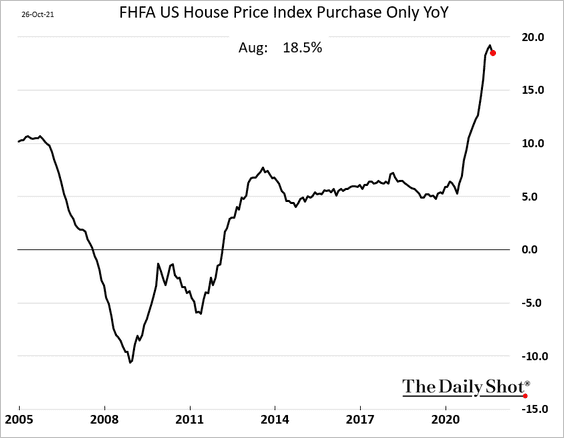
• Home price appreciation appears to have peaked near 20% in August.
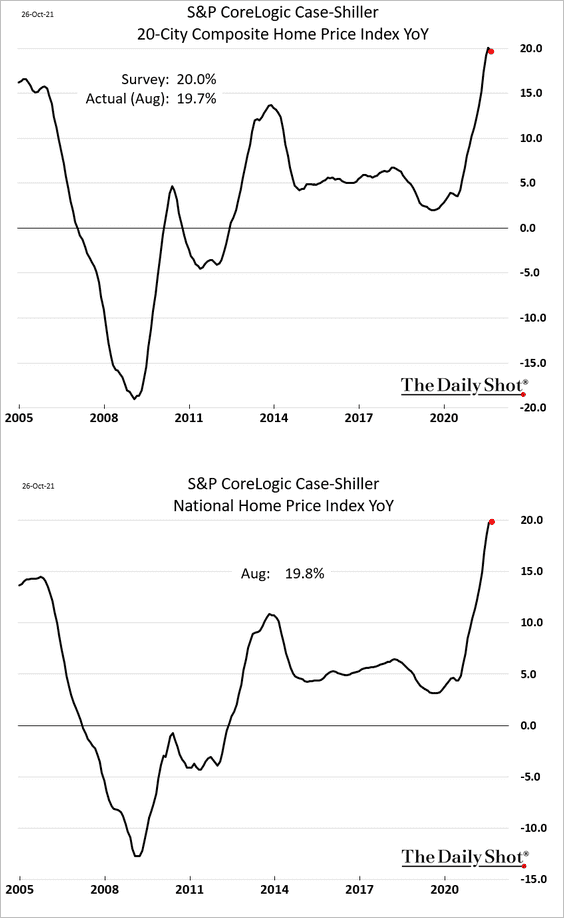
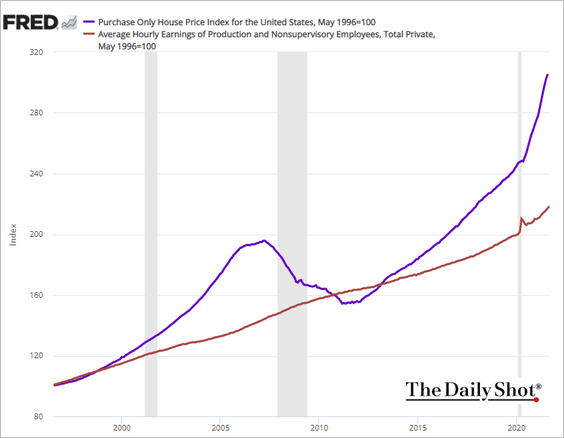
– The gap between home prices and wages keeps widening.
——————–
7. Despite the termination of the emergency unemployment benefits, companies continue to struggle with labor shortages.
 Source: Reuters Read full article
Here is the breakdown by industry for small businesses.
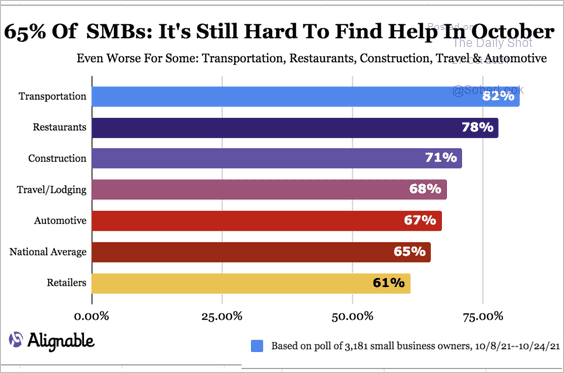 Source: Alignable
——————–
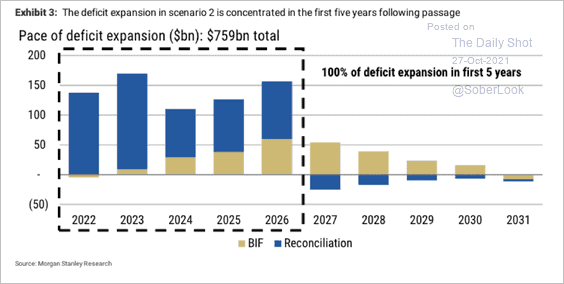
8. This chart shows Morgan Stanley’s projections for deficit expansion under the reconciliation bill (BIF = bipartisan infrastructure bill).
 Source: Morgan Stanley Research
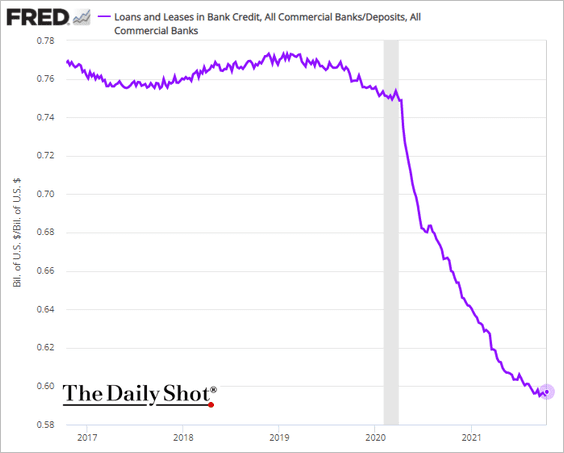
9. Is the loan-to-deposit ratio in the US banking system finally bottoming?
Back to Index
Canada
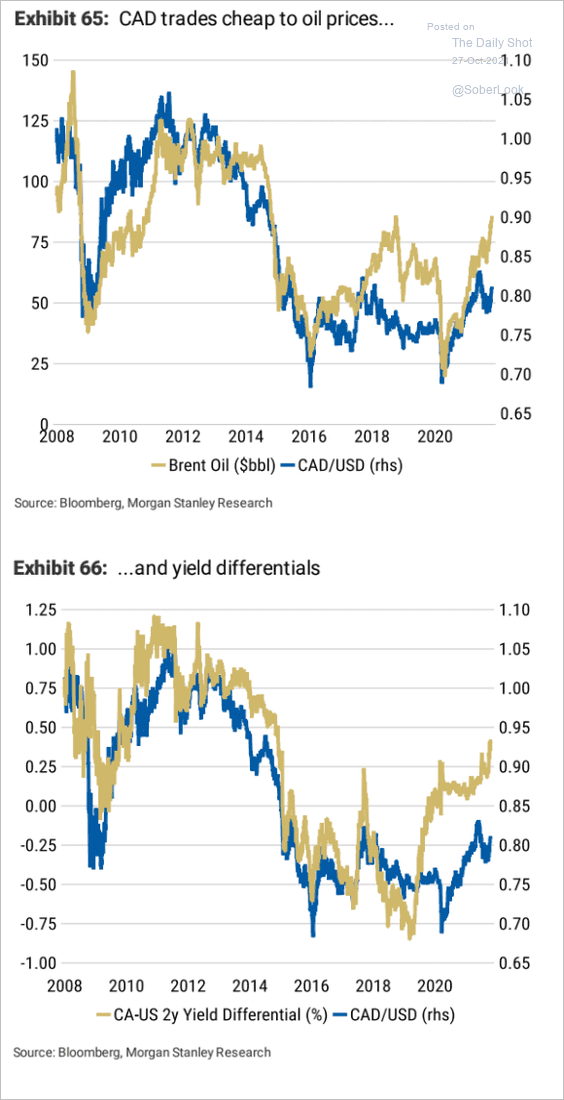
1. Both oil prices and rate differentials point to further gains for the loonie.
 Source: Morgan Stanley Research
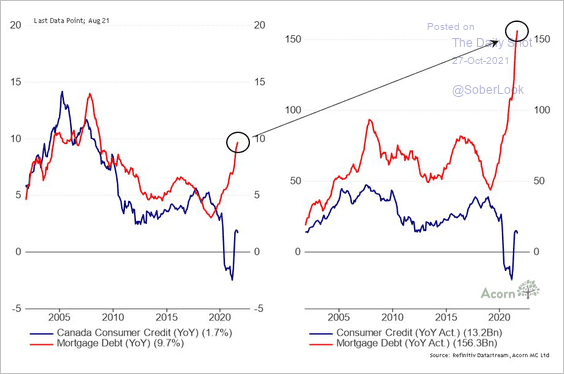
2. Mortgage lending accelerated since the start of the pandemic.
 Source: @RichardDias_CFA
Back to Index
The United Kingdom
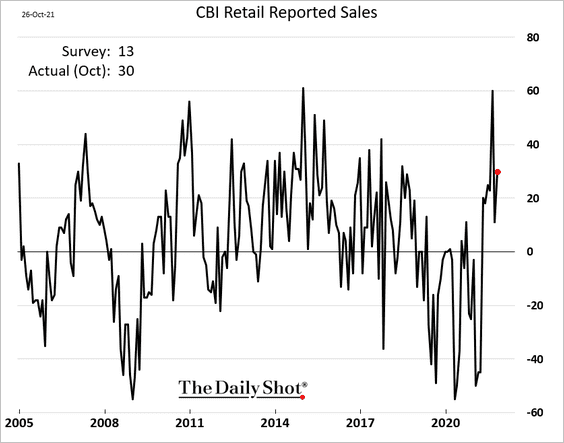
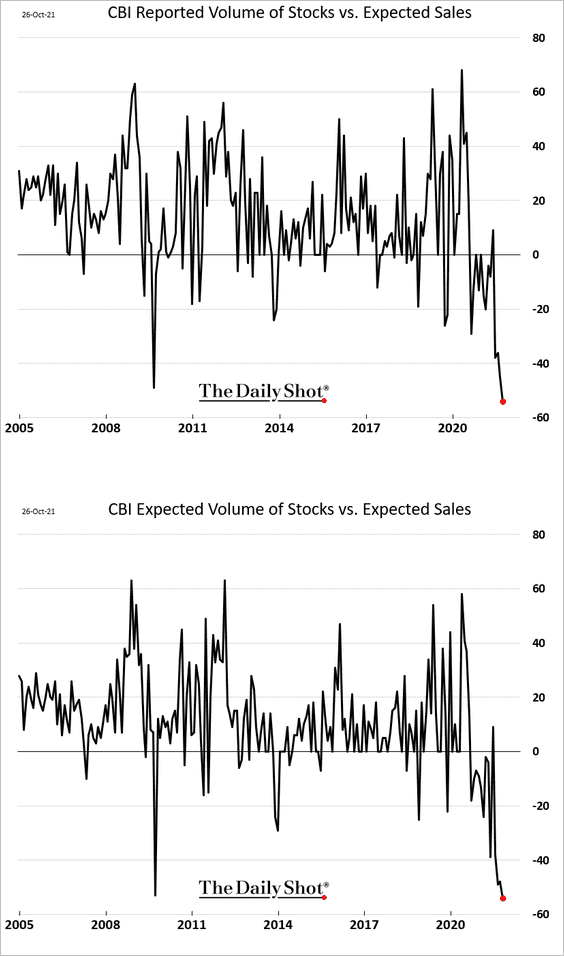
1. The CBI retail sales index surprised to the upside.
But inventory-to-sales ratios hit record lows.
 Source: Statista Read full article
——————–
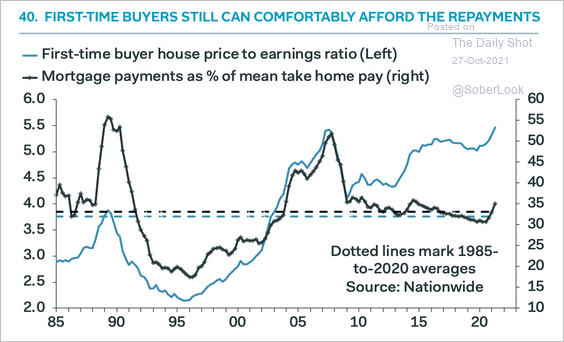
2. Here is the UK housing market in a single chart. Affordability, if one uses prices, is deteriorating, but if one uses mortgage payments, it is improving.
 Source: Pantheon Macroeconomics
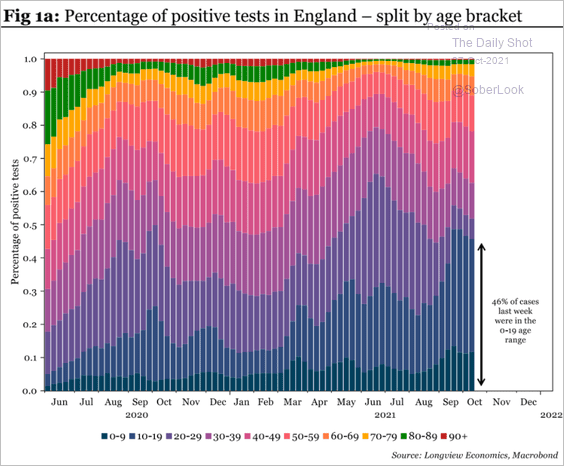
3. Below is a look at COVID positivity rates by age.
 Source: Longview Economics
Back to Index
The Eurozone
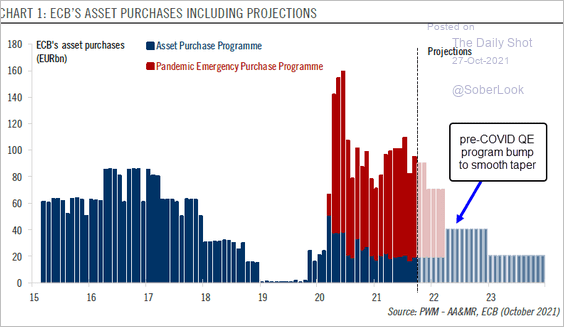
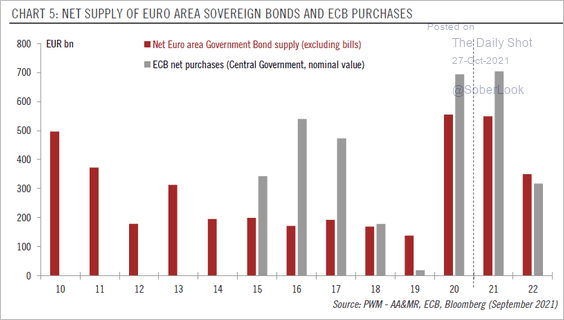
1. Here is the QE taper projection from Pictet Wealth Management.
 Source: @fwred
Next year’s government debt issuance should exceed the ECB’s purchases.
 Source: @fwred
——————–
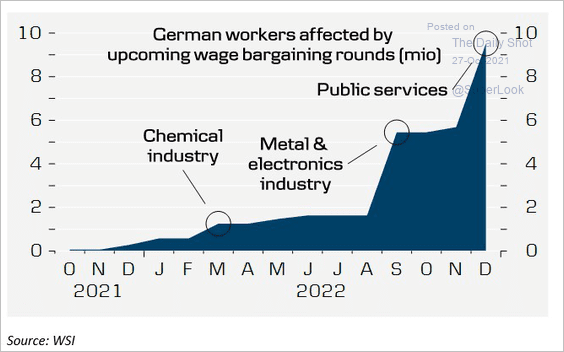
2. This chart shows the number of German workers affected by wage bargaining negotiations next year. The outcome will have a substantial impact on inflation.
 Source: @aila_mihr, Danske Bank
Back to Index
Europe
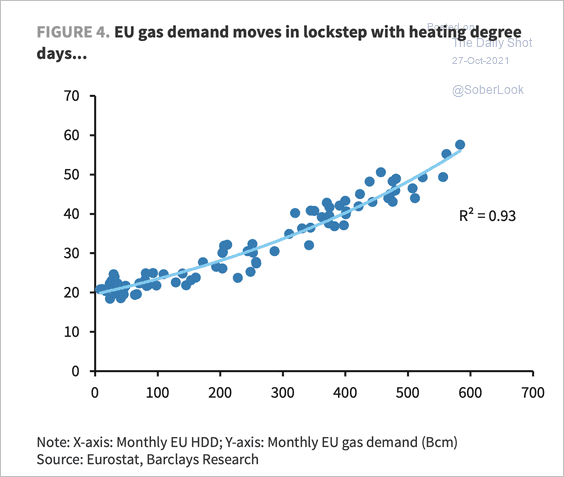
1. EU gas demand depends mainly on the weather. The current supply situation, according to Barclays, suggests that even a mild winter will lead to continued high gas prices.
 Source: Barclays Research
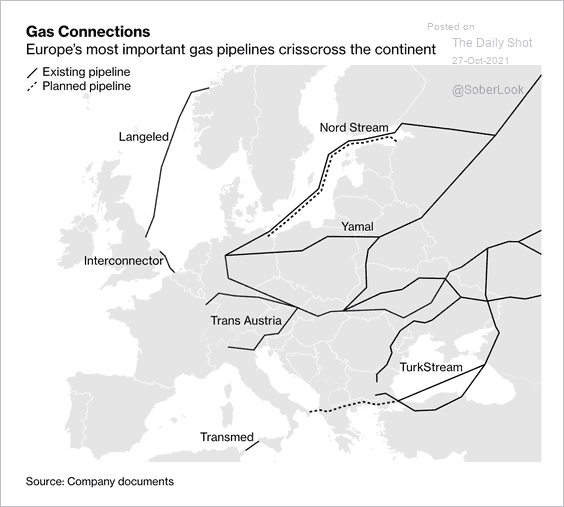
This map shows Europe’s most important pipelines.
 Source: @BBGVisualData Read full article
——————–
2. The EU is generally viewed favorably by member states.
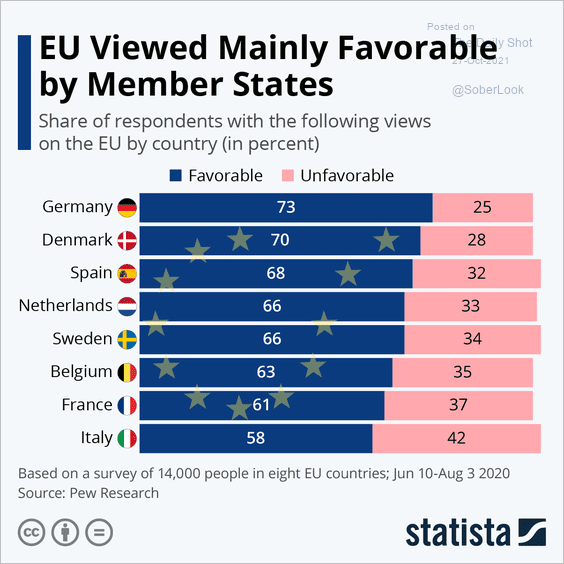 Source: Statista
3. Which country does the EU favor the most?
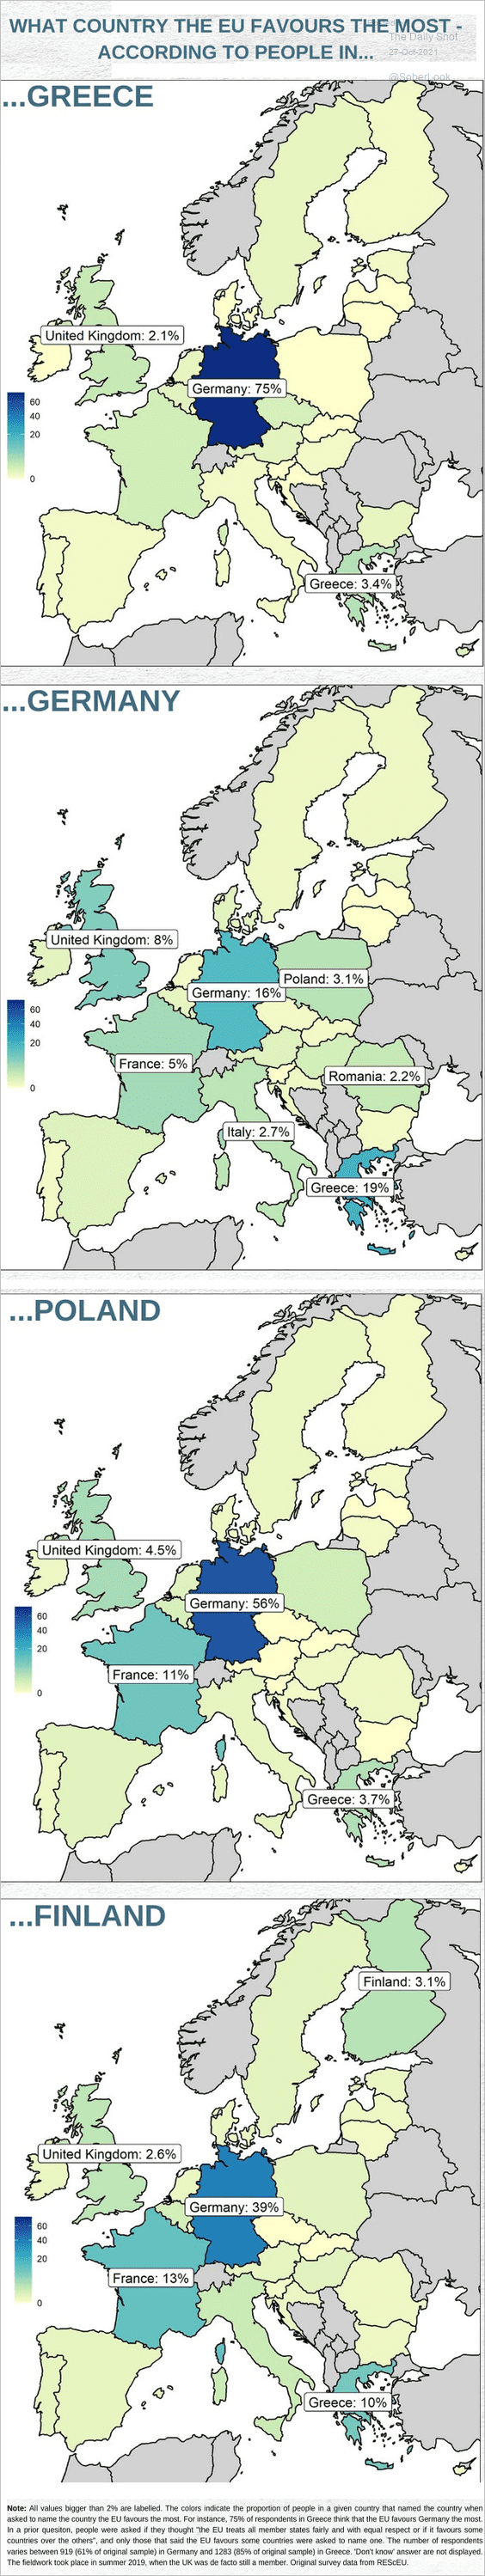 Source: @page_eco, @UTS_Economics
Back to Index
Asia – Pacific
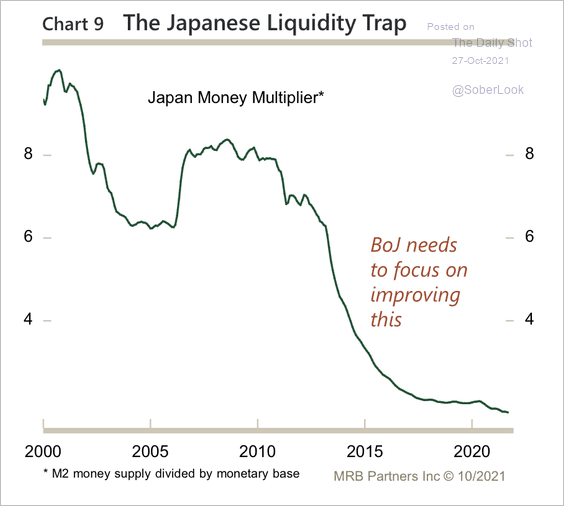
1. Liquidity continues to be trapped in Japan’s banking system and has not translated to credit growth and economic activity (2 charts).
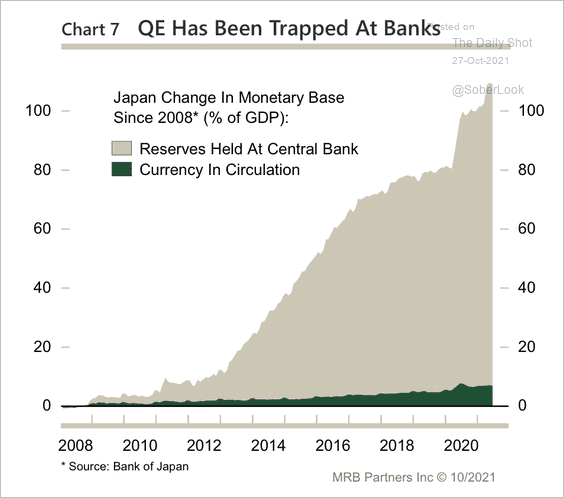 Source: MRB Partners
 Source: MRB Partners
——————–
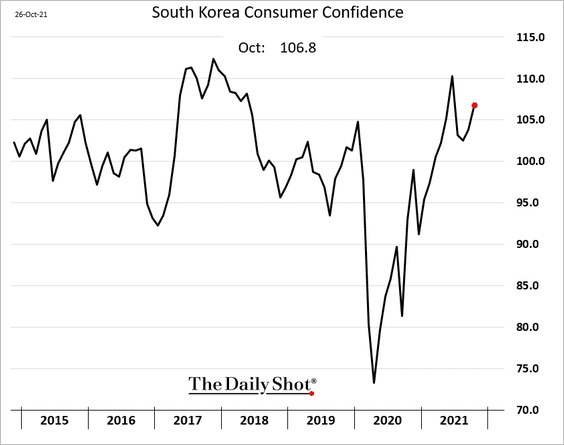
2. South Korea’s consumer confidence rebounded this month.
3. Australia’s core CPI surprised to the upside, jarring bond markets around the world today.
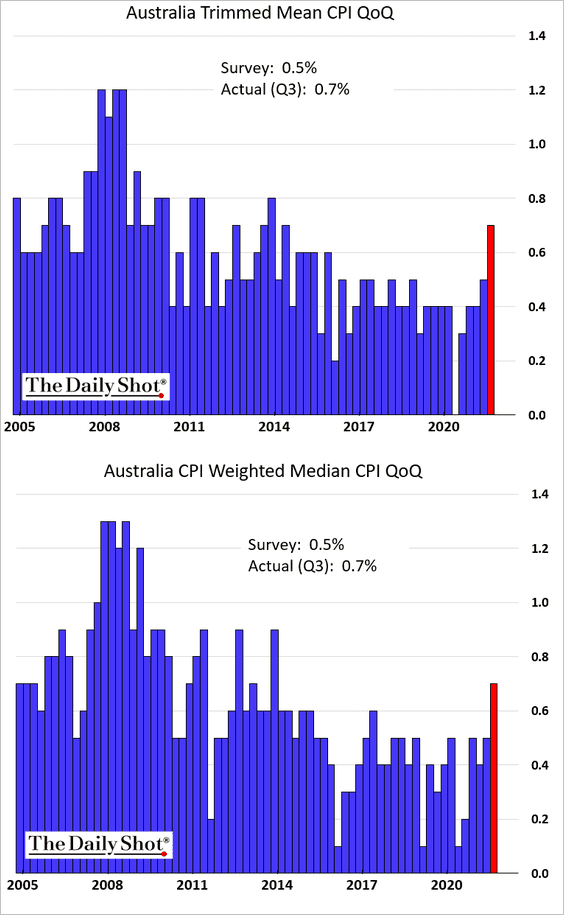
 Source: Reuters Read full article
——————–
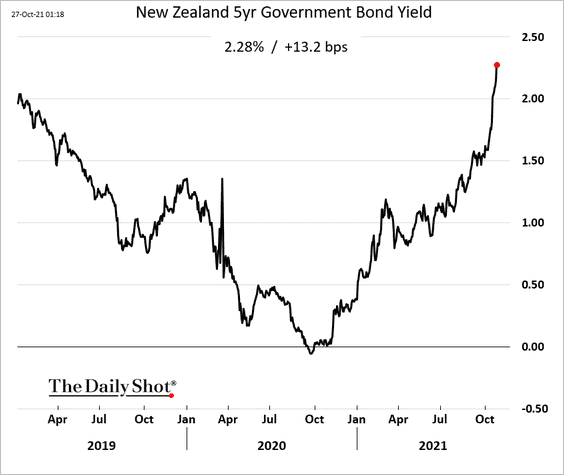
4. New Zealand’s 5yr bond yield climbed to a multi-year high.
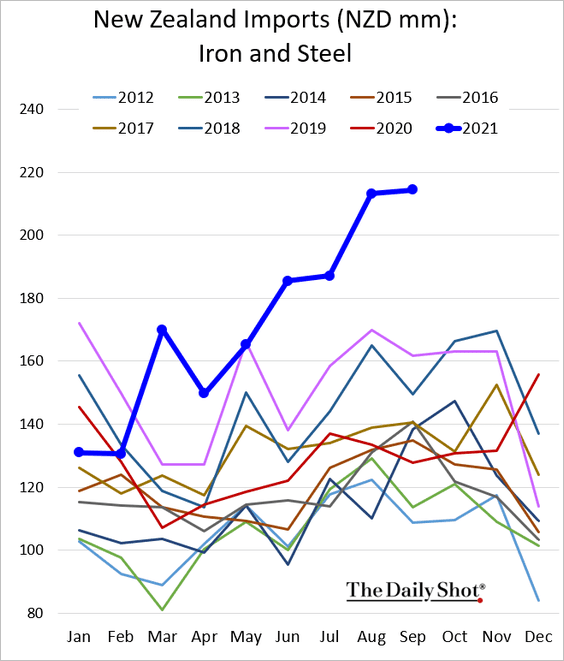
New Zealand’s trade deficit hit a record high, driven by a surge in imports.
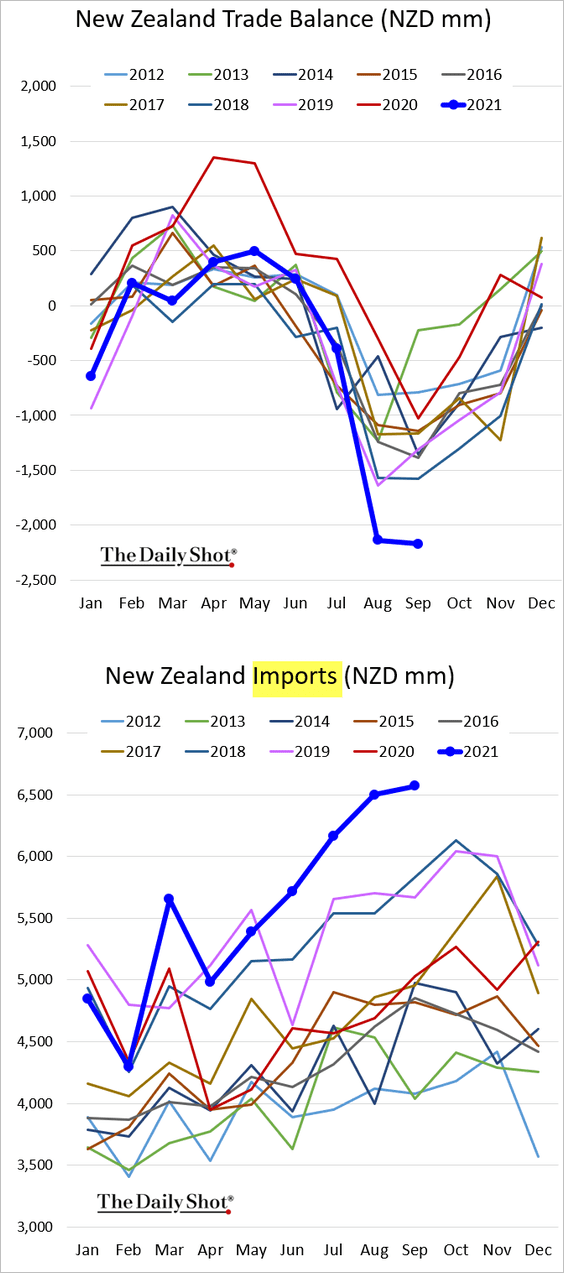
Imports have been boosted by substantial price gains, especially in commodities.
Back to Index
China
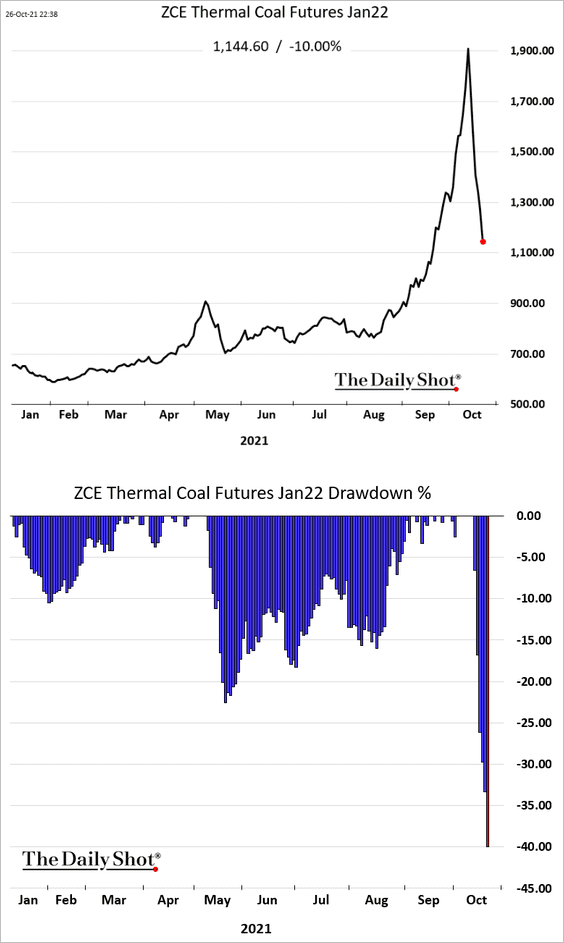
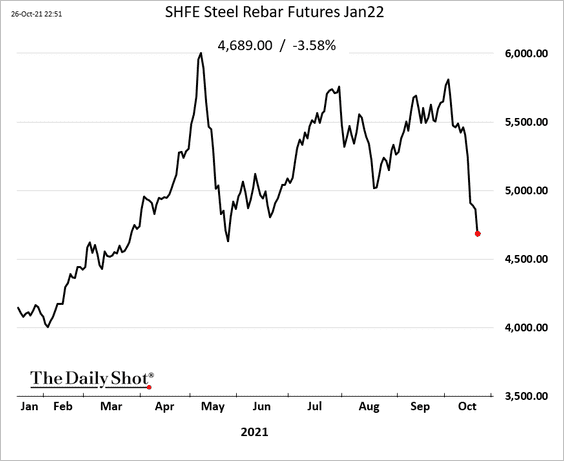
1. Thermal coal prices are down 40% from the highs.
Coking coal prices are also down sharply …
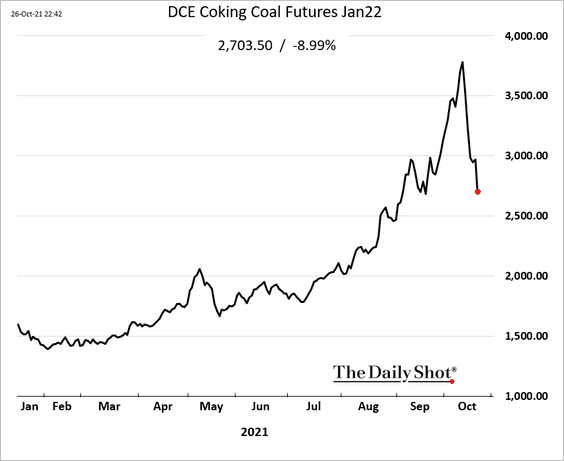
… feeding into steel prices, which have been falling despite sharp declines in steel output.
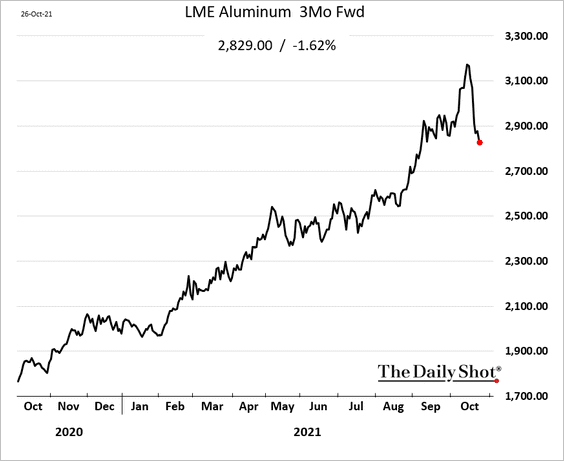
China’s declining industrial commodity prices have been felt globally. Here is aluminum in London.
——————–
2. Chinese semiconductor output is flying – up 40% so far this year.
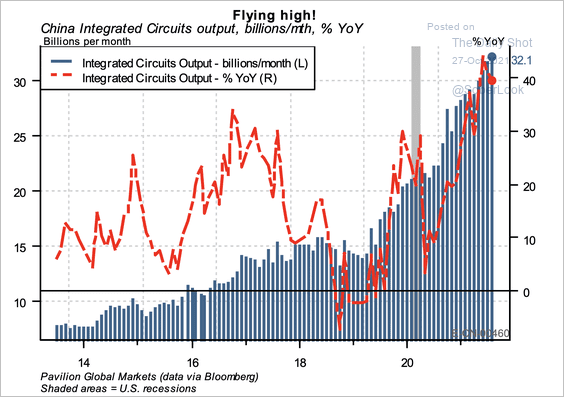 Source: Pavilion Global Markets
In 2020 China overtook Taiwan as the biggest buyer of semiconductor manufacturing equipment. This is likely to continue, fuelled by a recent tax holiday.
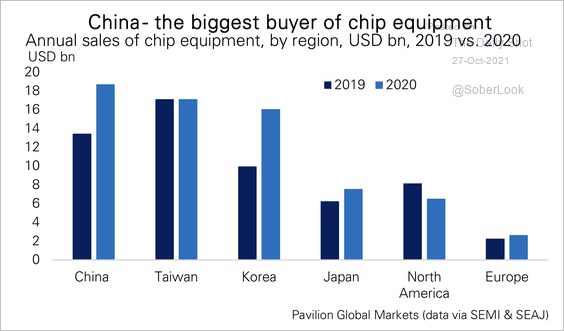 Source: Pavilion Global Markets
——————–
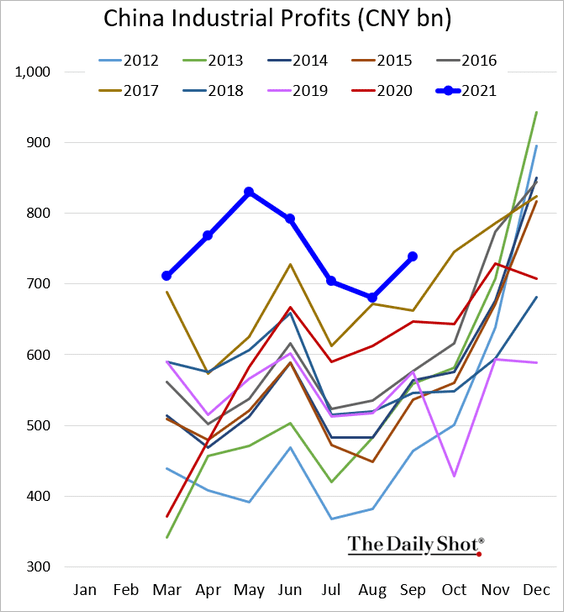
3. Industrial profits remain strong.
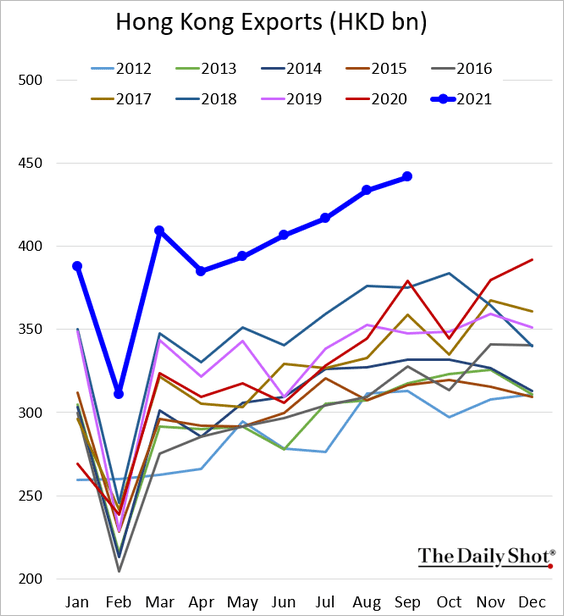
4. Hong Kong’s exports hit a record high.
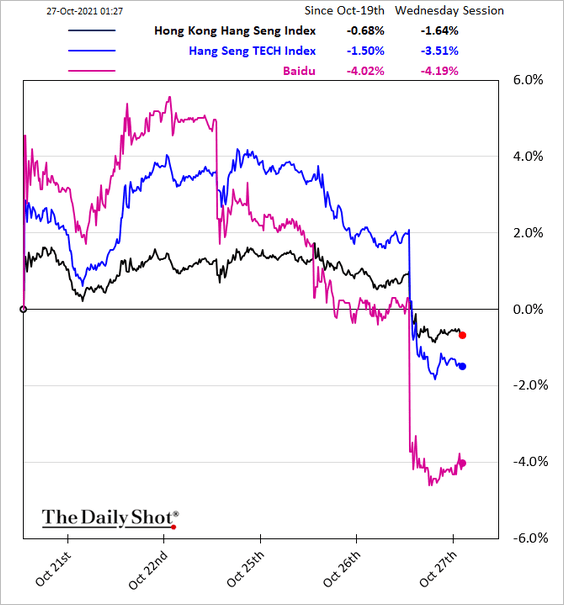
5. Tech shares are under pressure again.
Back to Index
Emerging Markets
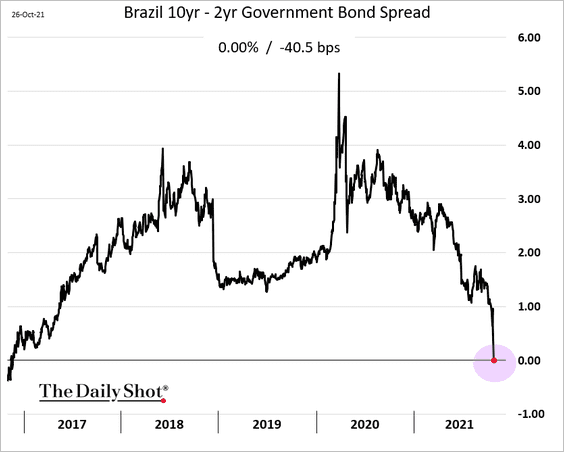
1. Let’s begin with Brazil.
• Short-term rates continue to surge, …
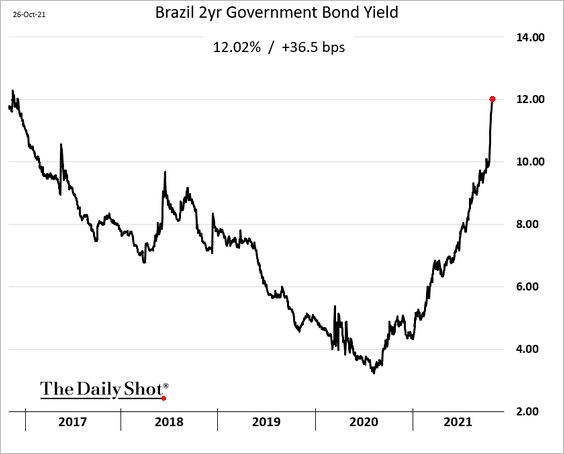
… as the yield curve is about to invert.
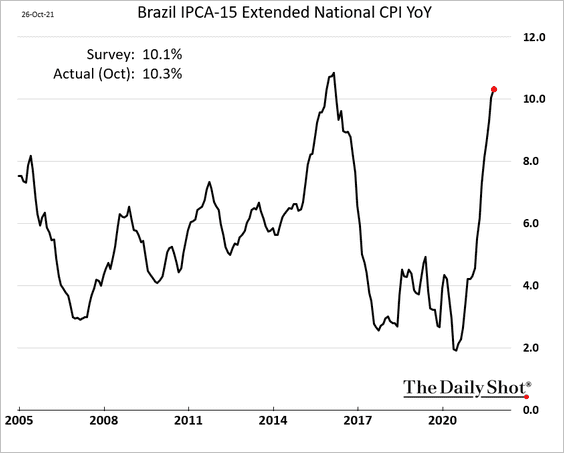
• Inflation is now firmly above 10%.
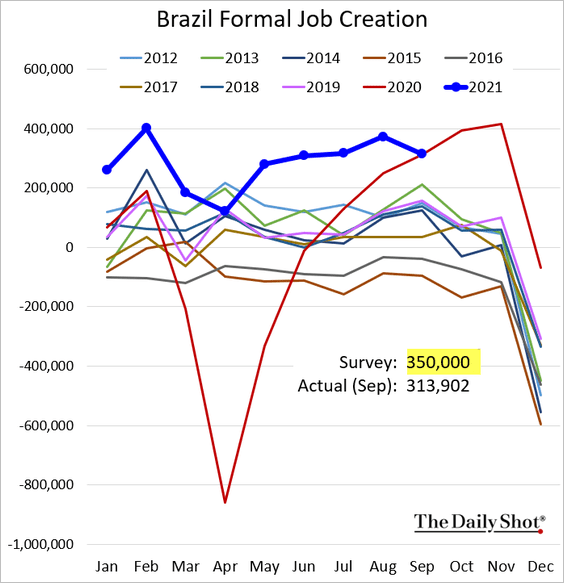
• Formal job creation surprised to the downside.
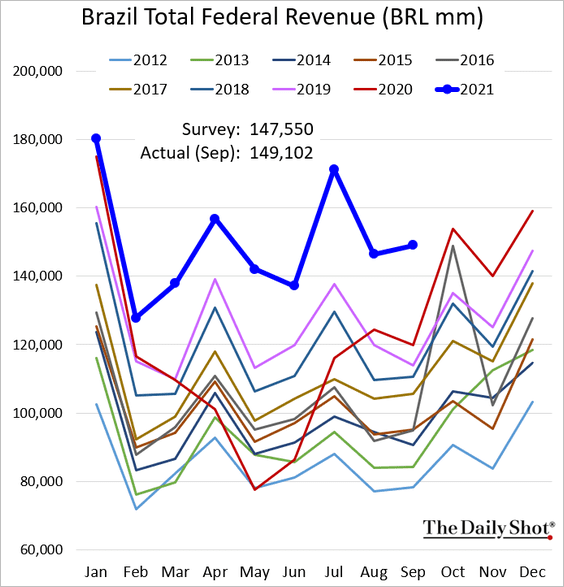
• Federal tax collections have been strong.
——————–
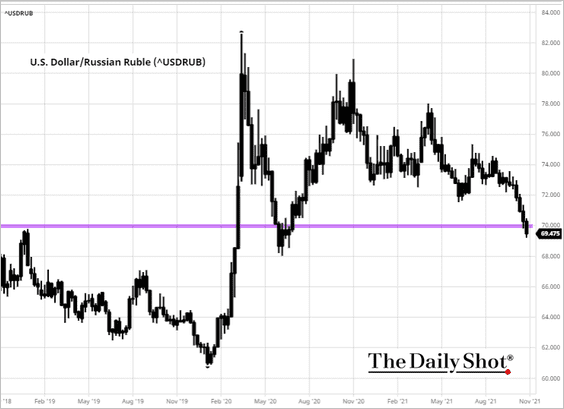
2. USD/RUB dipped below 70 as the ruble continues to rally.
 Source: barchart.com
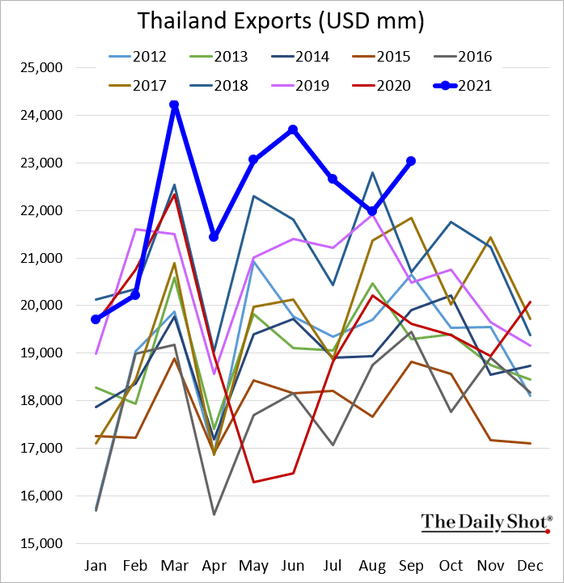
3. Thai exports remain robust.
4. Financial conditions across emerging markets, though still accommodating, are tightening and starting to diverge.
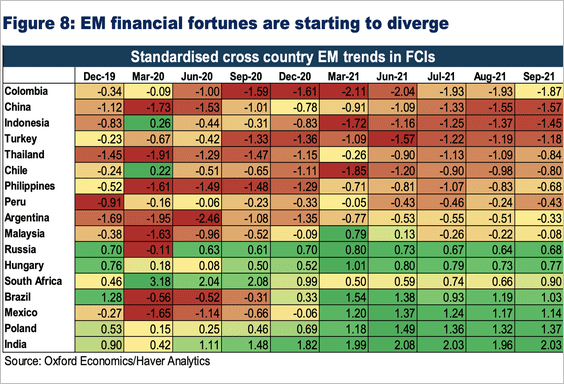 Source: Oxford Economics
5. EM growth has been lagging the US since the start of the pandemic.
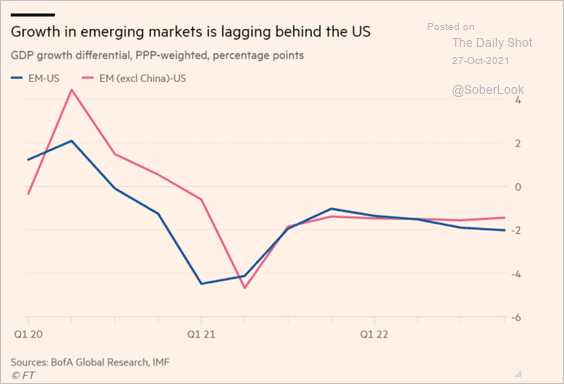 Source: @financialtimes Read full article
Back to Index
Cryptocurrency
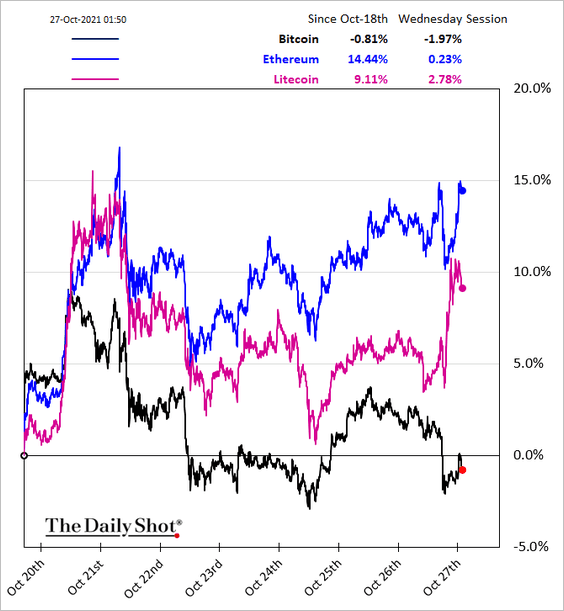
1. Litecoin (LTC) has outperformed other large cryptocurrencies over the past week.
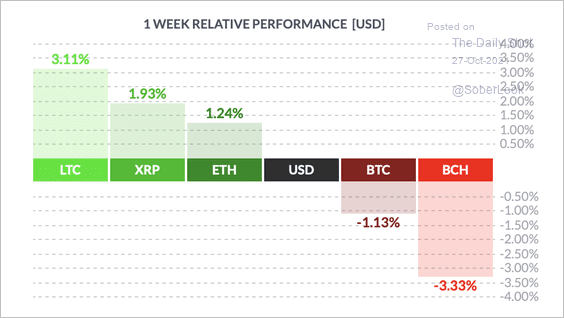 Source: FinViz
——————–
2. Blockchain data show long-term bitcoin holders are starting to take some profits, albeit not as extreme relative to extreme levels seen at the end of a bull market phase.
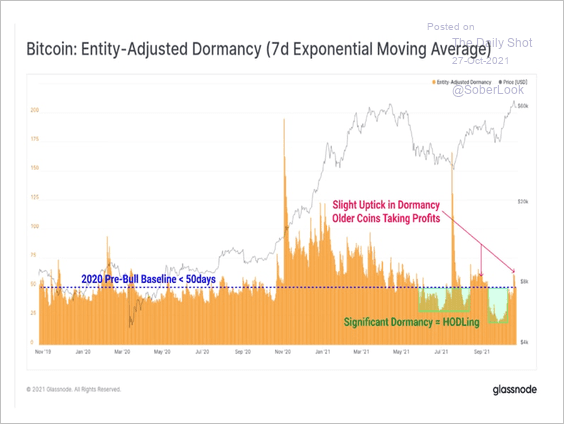 Source: Glassnode Read full article
3. The total balance of bitcoin on exchanges continues to decline, which suggests traders are holding coins in wallets instead of making them available to trade on an exchange. Some analysts interpret this as less demand to sell at the moment.
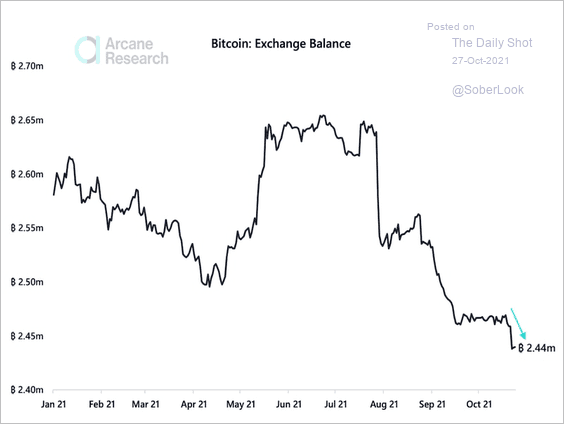 Source: Arcane Research
4. The Economist auctioned off the NFT of its “Down the rabbit hole” cover page. Proceeds will go to charity.
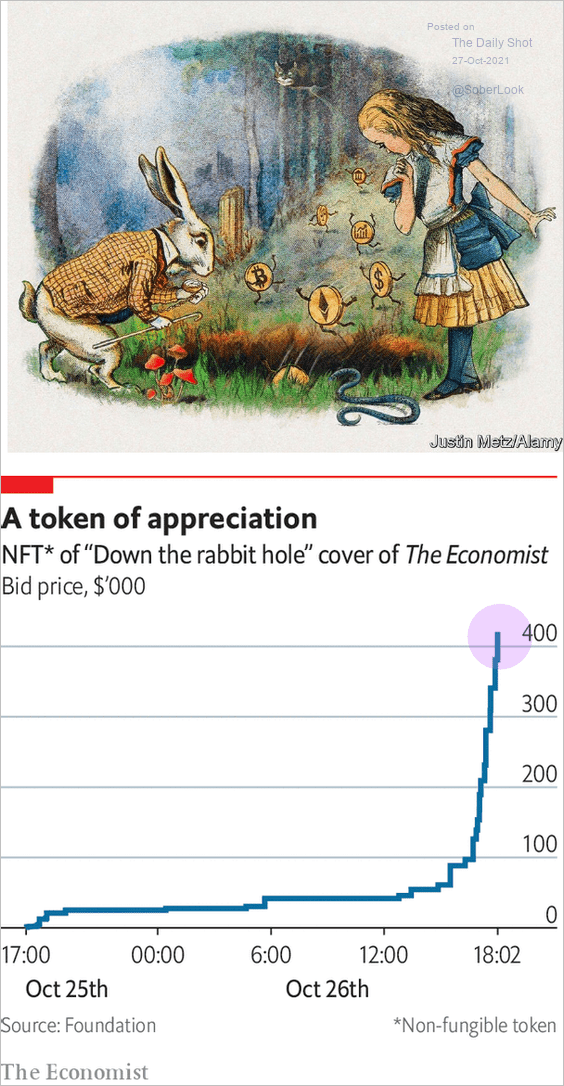 Source: The Economist Read full article
Back to Index
Energy
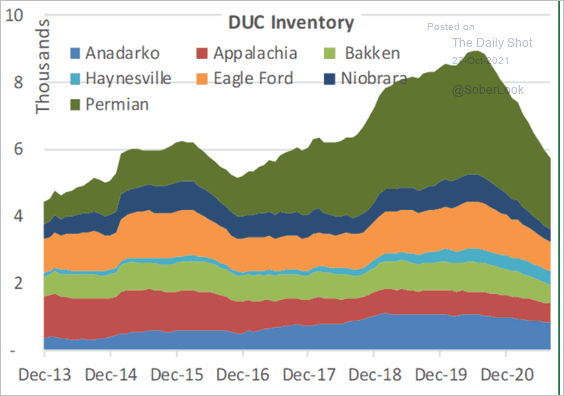
1. The US DUC inventory (drilled uncompleted wells) continues to shrink.
 Source: Cornerstone Macro
2. This chart shows WTI crude oil seasonality going back to 1986.
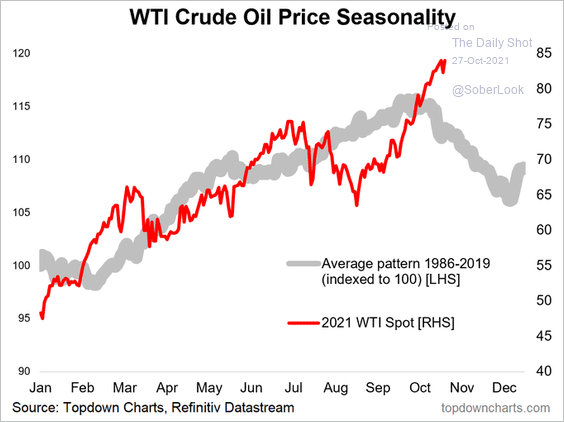 Source: @Callum_Thomas, @topdowncharts
3. Who are the winners and losers of the natural gas crisis?
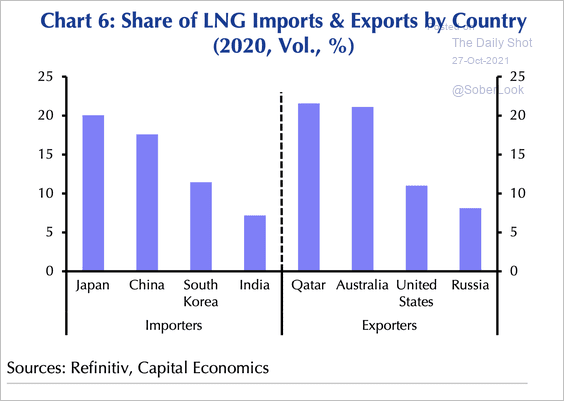 Source: Capital Economics
Back to Index
Equities
1. The broad equity market has been flat in recent months.
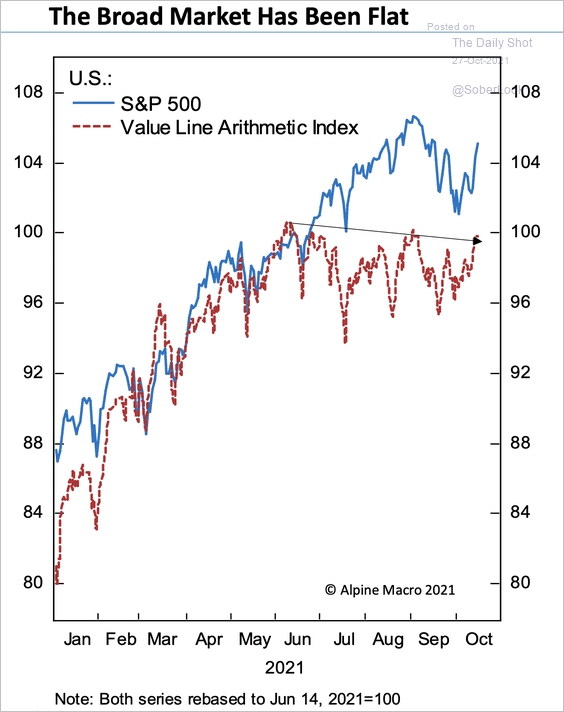 Source: Alpine Macro
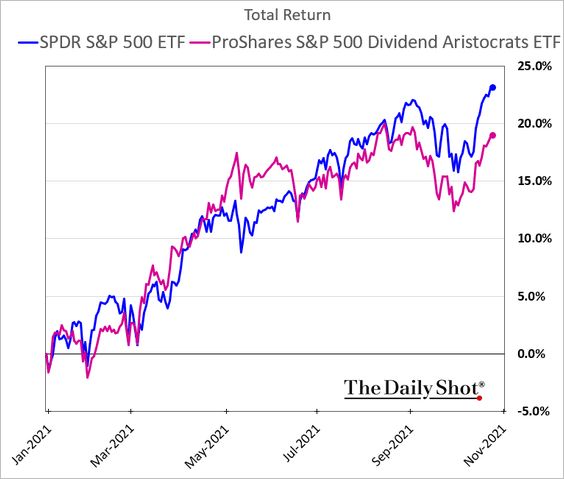
2. Dividend growers have underperformed since August.
3. Equity positioning rose markedly over the last two weeks …
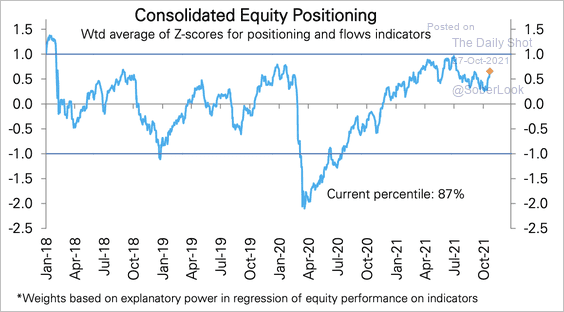 Source: Deutsche Bank Research
… driven by discretionary investor positioning. Systematic strategy positioning fell slightly.
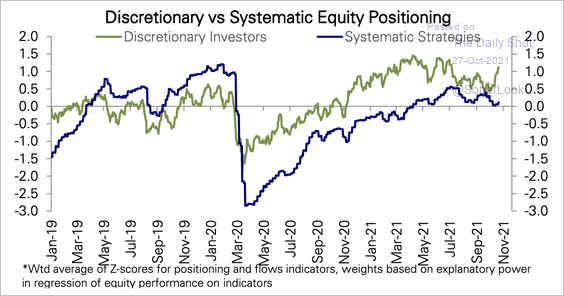 Source: Deutsche Bank Research
Hedge funds reduced their equity exposure this month.
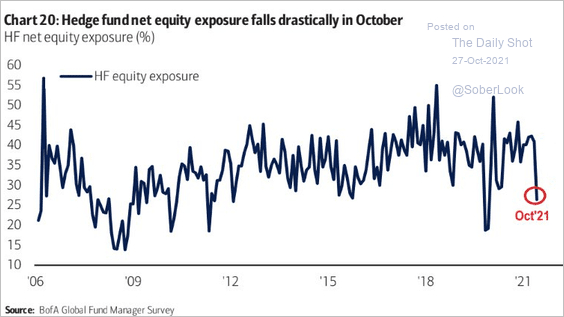 Source: BofA Global Research
——————–
4. Many analysts continue to warn that equity valuations are nearing bubble territory.
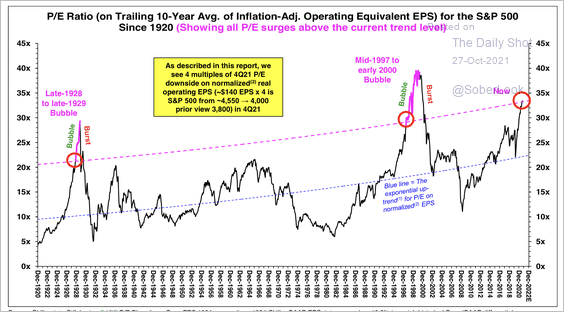 Source: Stifel
• Stocks also appear stretched relative to commodities, which typically favors value over growth sectors.
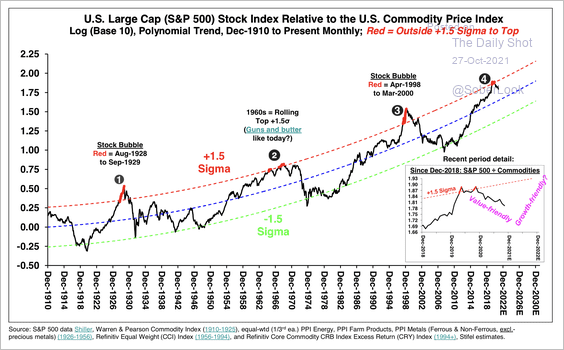 Source: Stifel
• On an equal-weighted basis, cyclicals appear stretched relative to defensives, which typically leads to broader valuation compression.
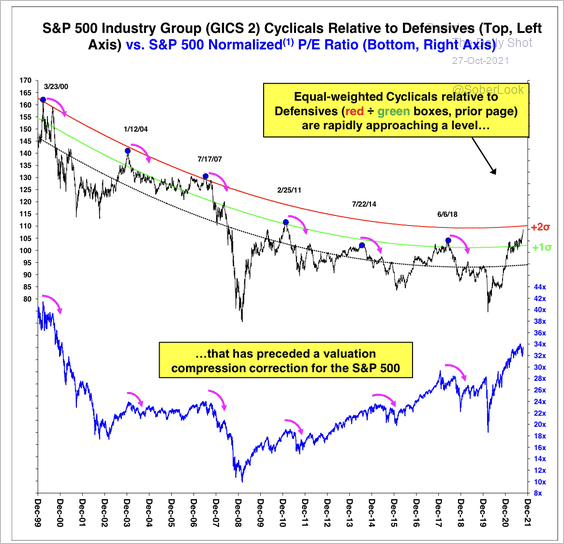 Source: Stifel
——————–
5. It’s worth remembering that a pullback of the kind we saw in September historically happens every 2-3 months.
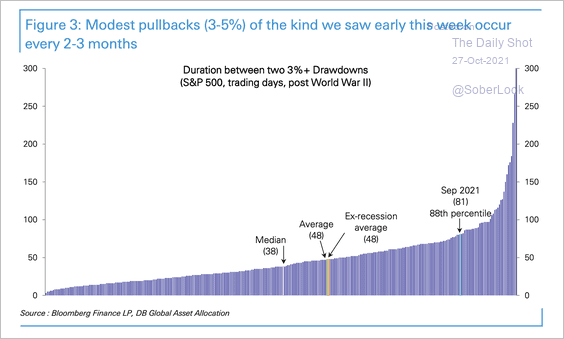 Source: Deutsche Bank Research
6. The stock market appears to be pricing in improvements in supply chain bottlenecks.
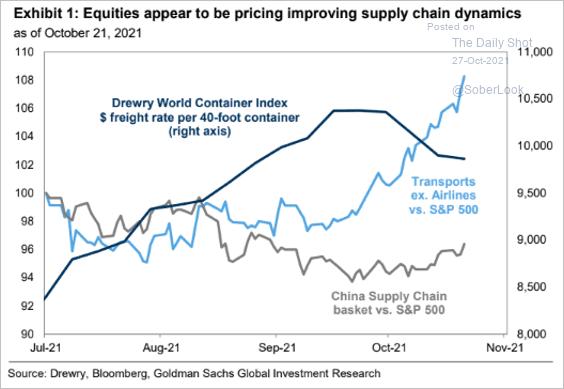 Source: Goldman Sachs
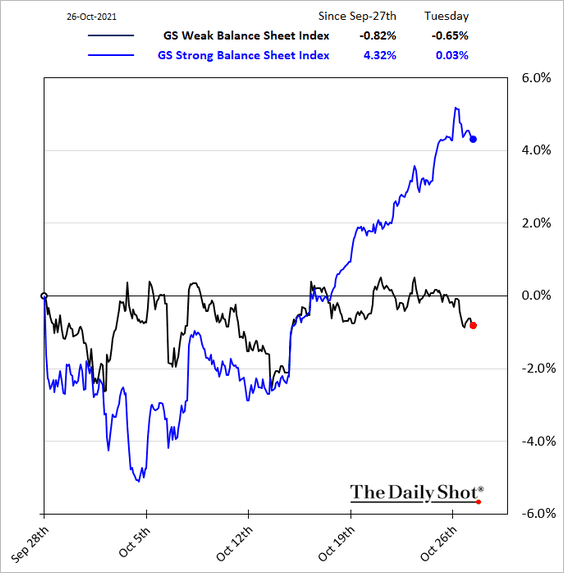
7. Companies with strong balance sheets have been outperforming in recent days.
8. Options traders are gearing up for another debt ceiling showdown.
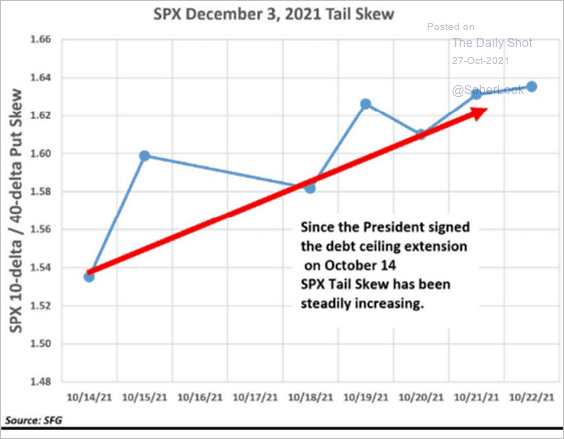 Source: Chris Murphy, Susquehanna International Group
Back to Index
Rates
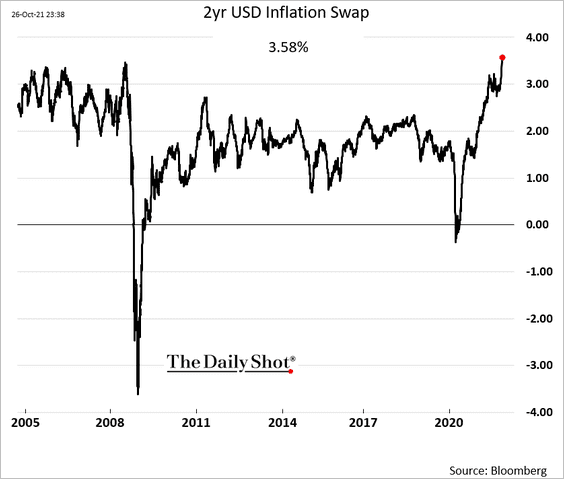
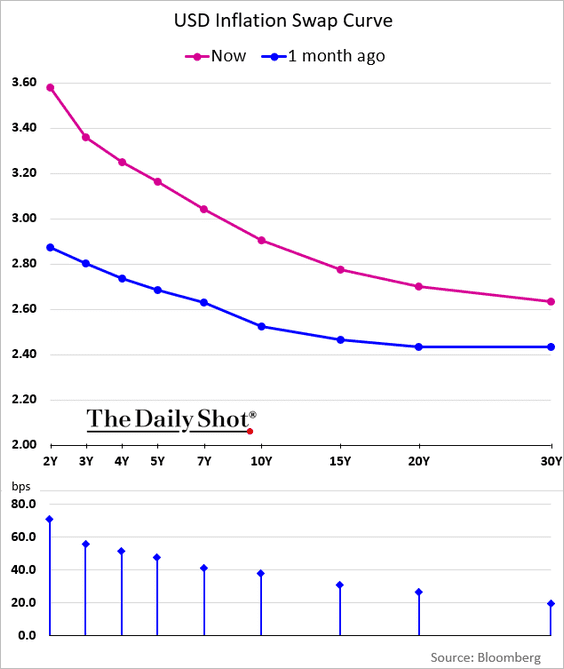
1. US short-term inflation expectations are rising faster than longer-term ones, with the inflation curve becoming increasingly inverted.
——————–
2. The nominal yield curve has been flattening. That hasn’t been the case with the real curve.
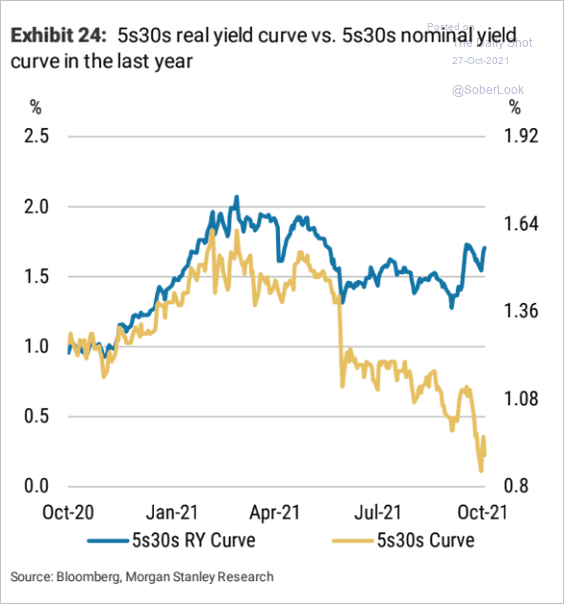 Source: Morgan Stanley Research
3. The recent rise in the 5-year Treasury yield is similar to the “reopening trade” in February and March.
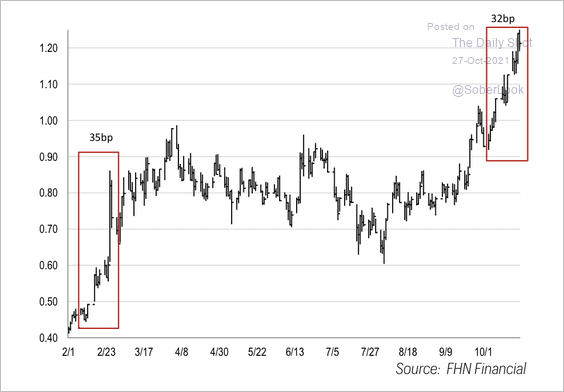 Source: FHN Financial
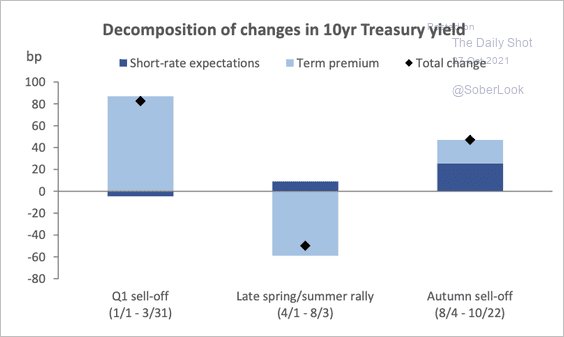
4. Unlike earlier in the year, the recent increase in yields is supported by higher short-rate expectations and is less dependent on term premium recovery.
 Source: Deutsche Bank Research
Back to Index
Global Developments
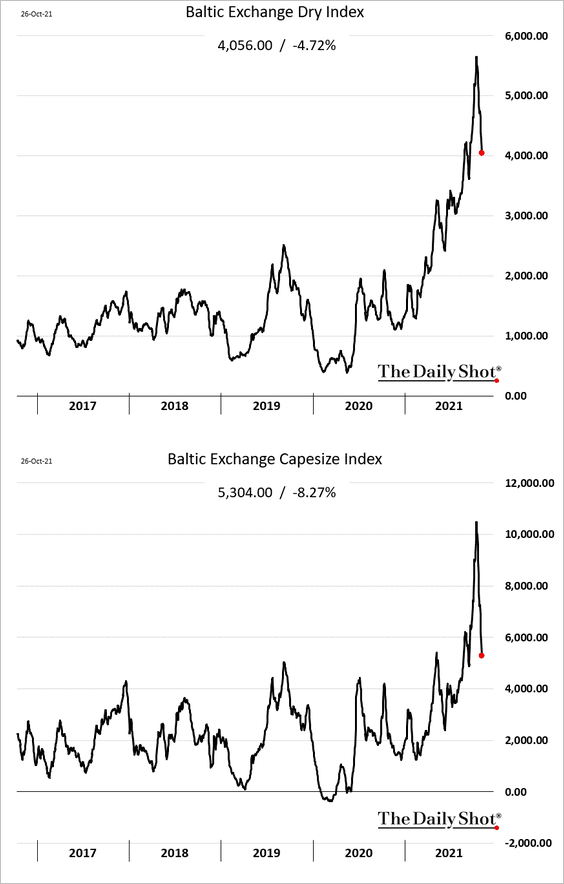
1. Dry bulk shipping costs are tumbling, partly driven by Beijing’s pressuring the coal market and sending ferrous futures sharply lower.
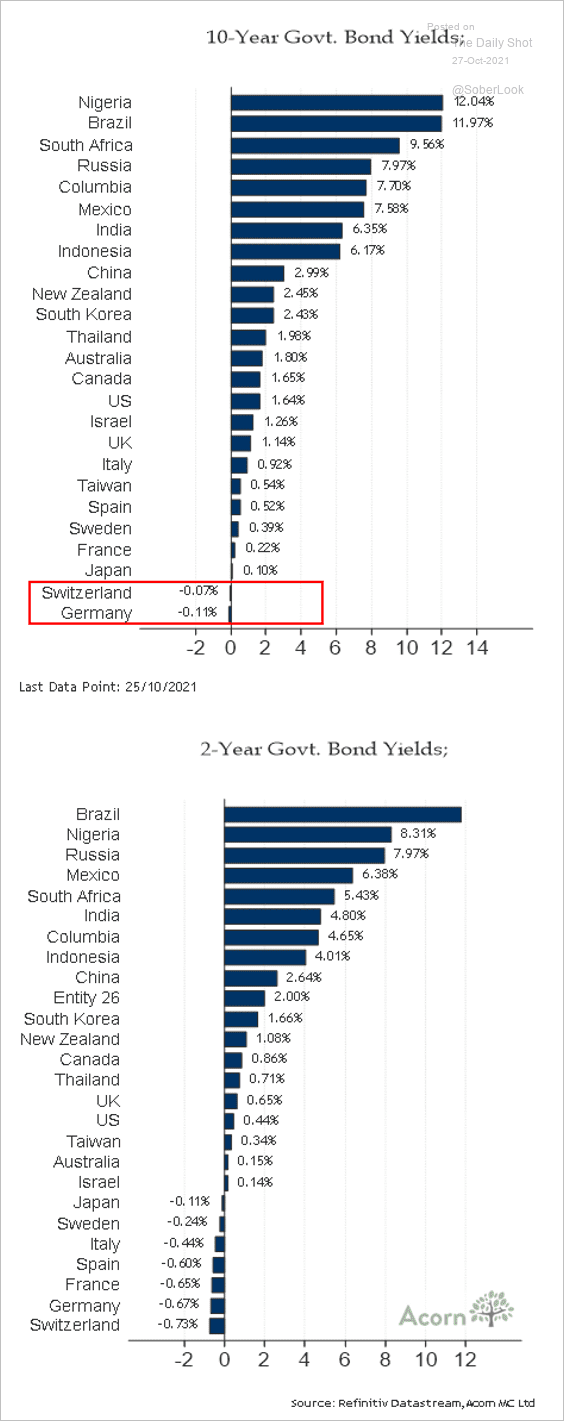
2. Which countries still have negative bond yields?
 Source: @RichardDias_CFA
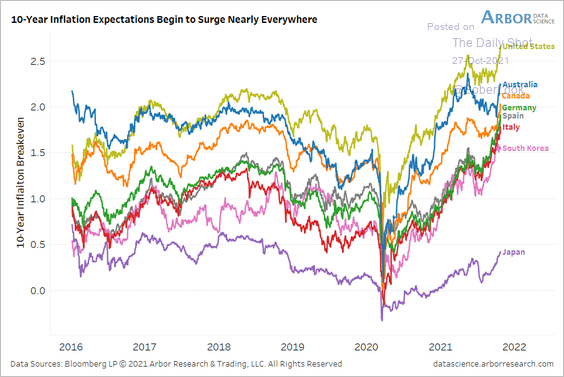
3. Inflation expectations are climbing around the world, …
 Source: Arbor Research & Trading
… as energy prices surge.
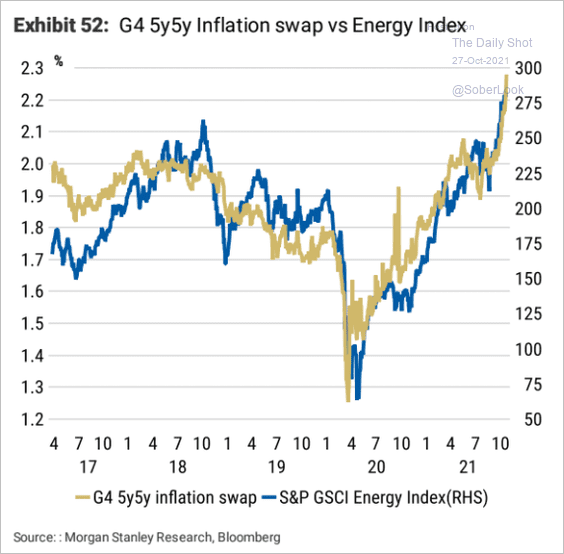 Source: Morgan Stanley Research
——————–
4. This scatterplot shows yield volatility vs. expected months until the first rate hike.
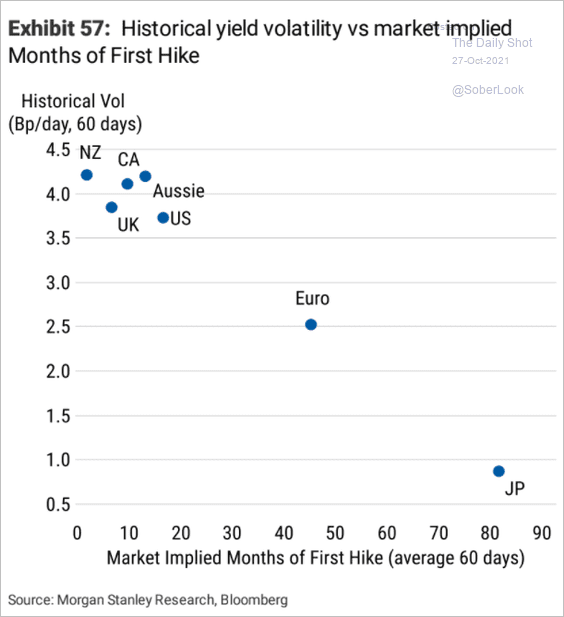 Source: Morgan Stanley Research
5. There is no shortage of economic challenges ahead.
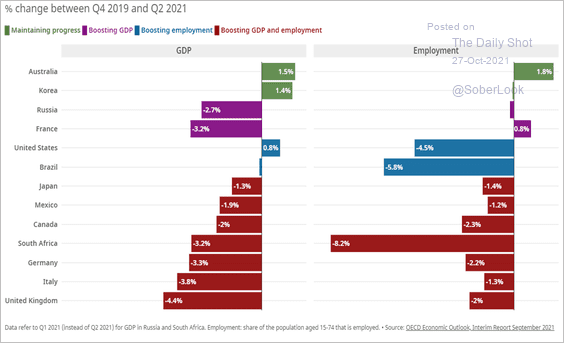 Source: OECD Read full article
——————–
Food for Thought
1. Market capitalization of global automakers:
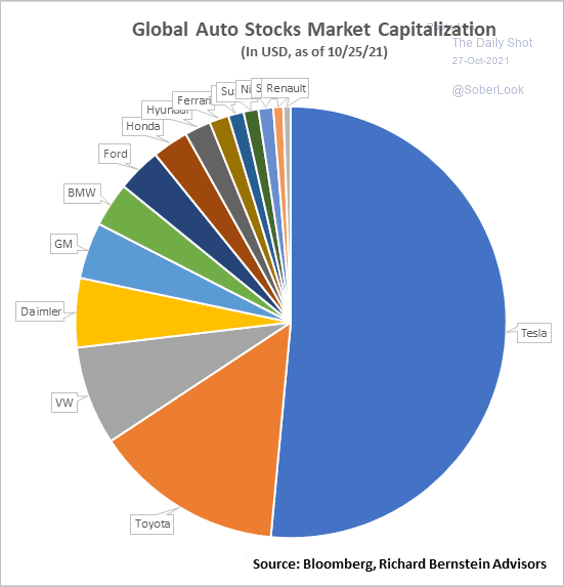 Source: @RBAdvisors
2. German car production:
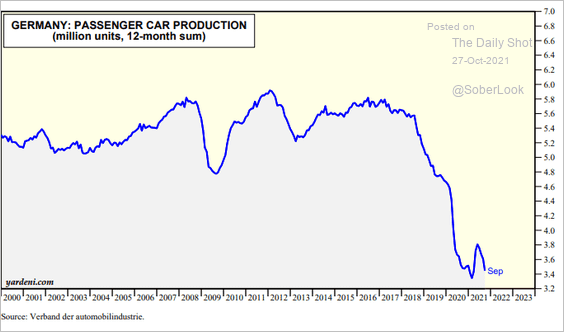 Source: Yardeni Research
3. Spending time on Facebook:
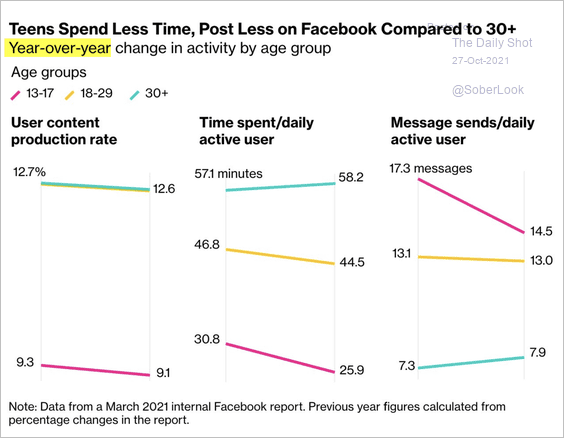 Source: @BBGVisualData Read full article
4. Changes in the number of Americans not working:
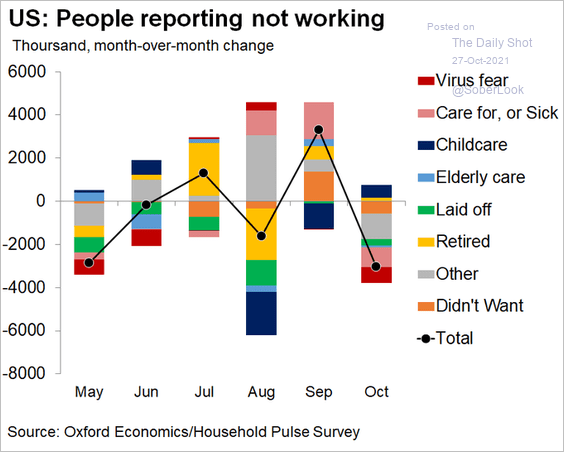 Source: @GregDaco, @Census
5. Demand for less-skilled workers:
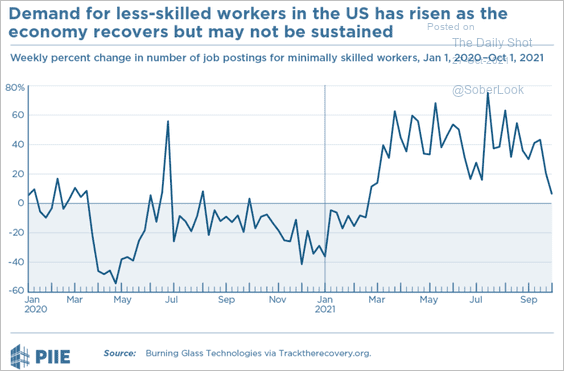 Source: PIIE Read full article
6. Access to paid sick days by region:
 Source: EPI Read full article
7. The “billionaire tax” impact on the ten wealthiest Americans:
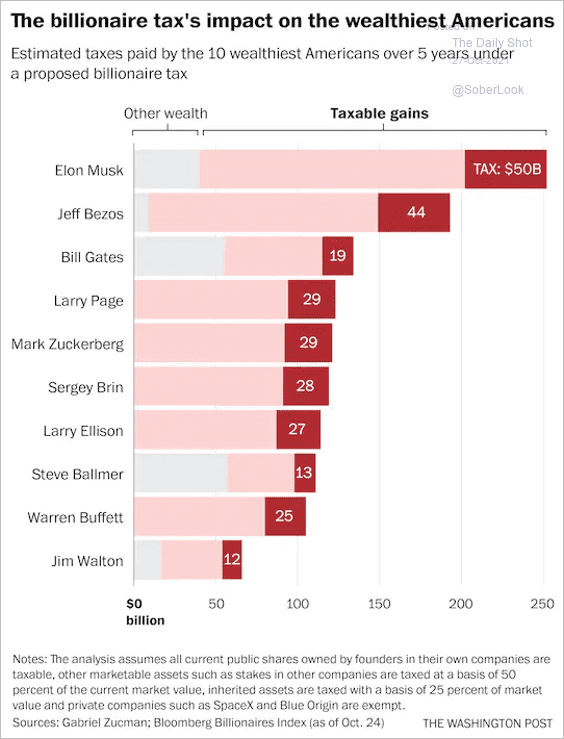 Source: The Washington Post Read full article
8. US corporate tax revenue and tax rate:
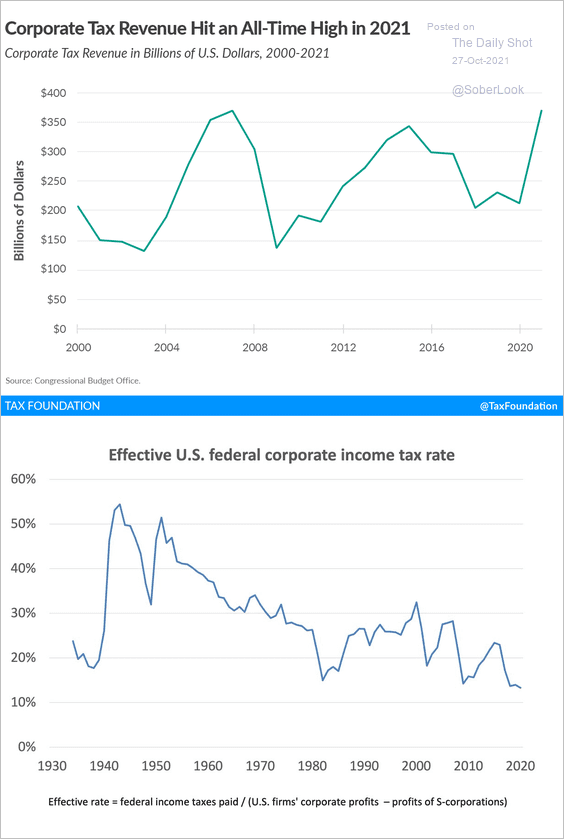 Source: @gabriel_zucman Read full article
9. Pokemon profits:
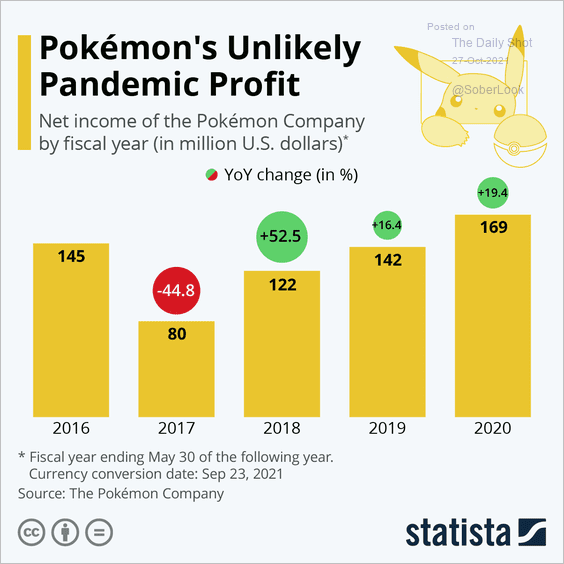 Source: Statista
——————–
Back to Index