
The Daily Shot: 01-Nov-21
• The United States
• Canada
• The United Kingdom
• The Eurozone
• Asia – Pacific
• China
• Emerging Markets
• Commodities
• Energy
• Equities
• Rates
• Global Developments
• Food for Thought
The United States
1. Short-term Treasury yields continue to climb …
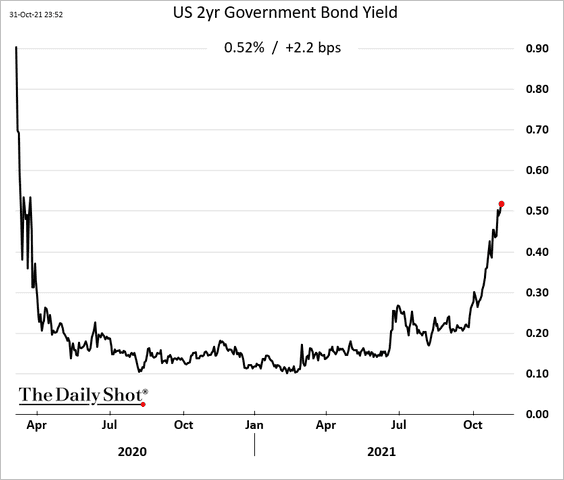
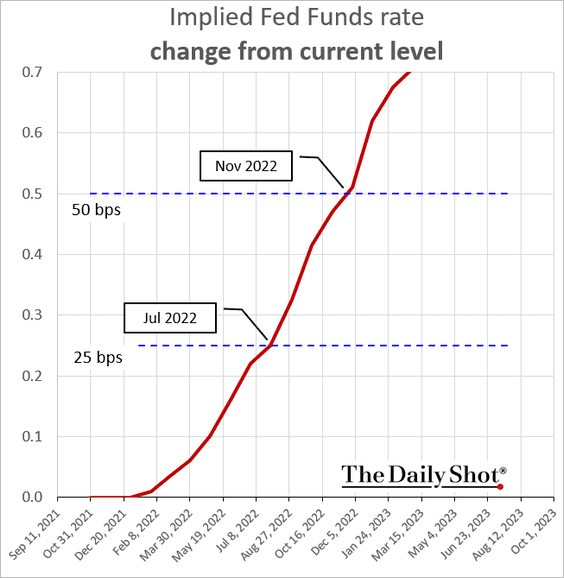
… as the market prices in a more aggressive rate hike schedule next year.
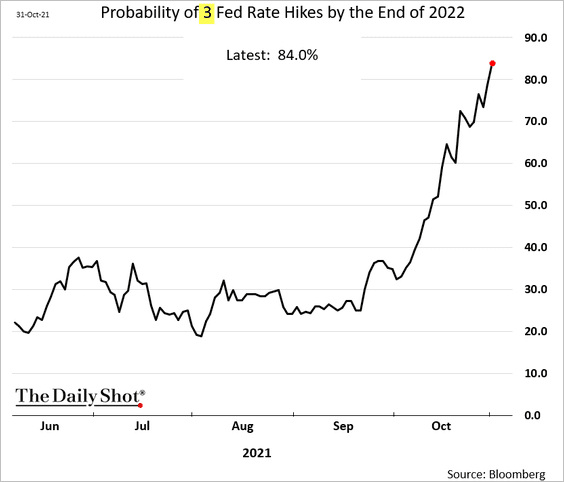
The first hike is now priced in for next July. Interestingly, risk markets (such as stocks) are ignoring this trend for now.
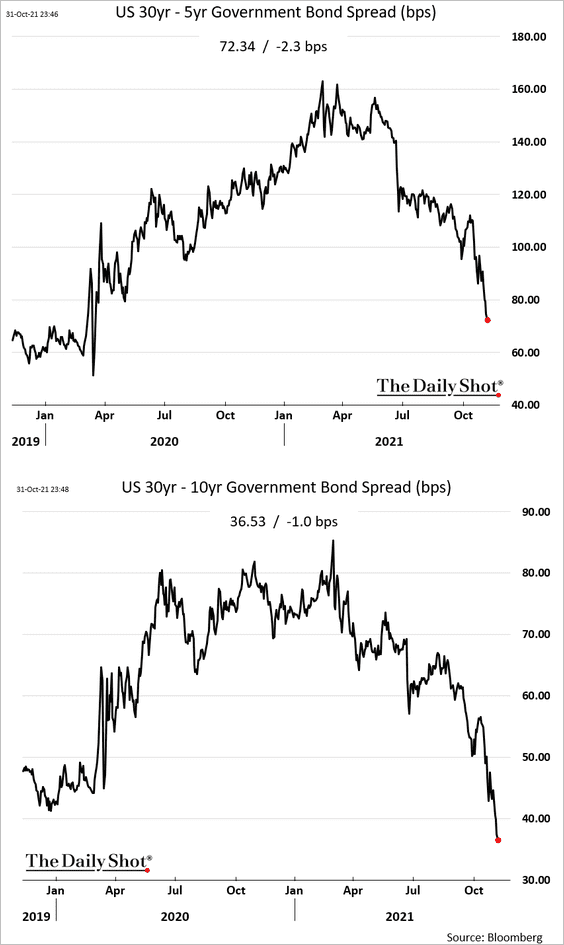
The Treasury curve continues to flatten in the long end.
——————–
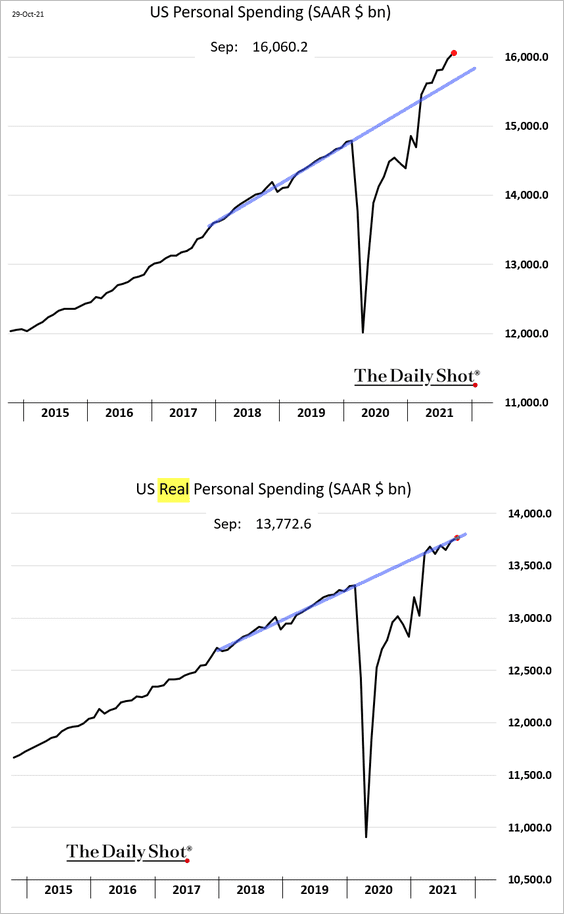
2. Consumer spending has been robust, running well above the pre-COVID trend. However, adjusted for inflation, the spending trajectory looks less impressive.
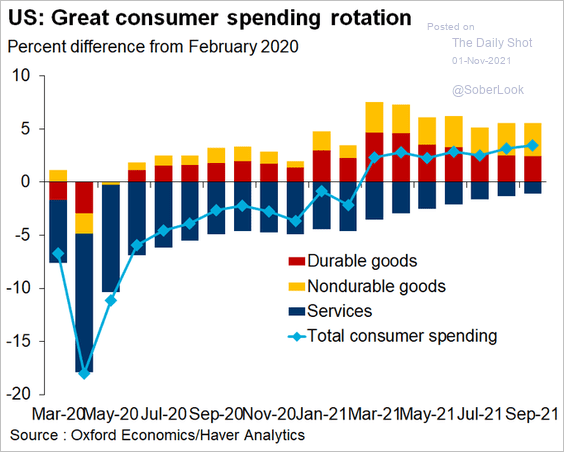
Here is the attribution of changes in spending since February of 2020.
 Source: @GregDaco
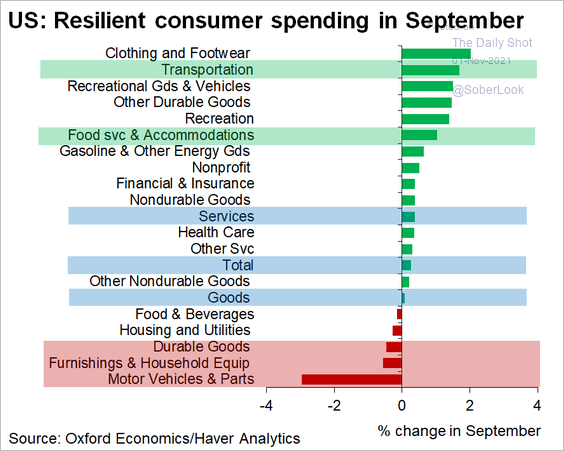
Automobiles remain a drag on consumption.
 Source: @GregDaco
——————–
3. Personal income is approaching the pre-COVID trend.
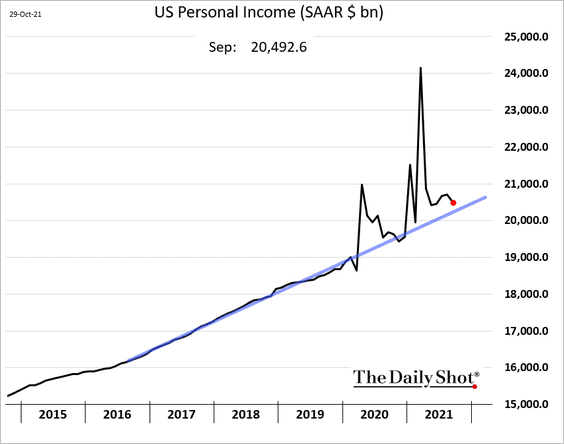
• Excluding government support, incomes continue to grow.
![]() Source: @tracyalloway; Barclays Research
Source: @tracyalloway; Barclays Research
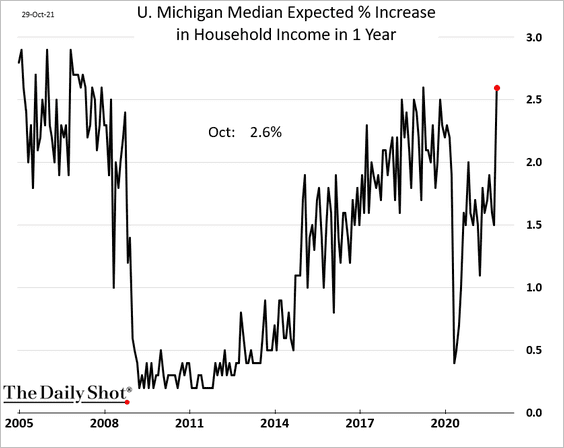
By the way, households are optimistic about their incomes one year out, according to the U. Michigan survey.
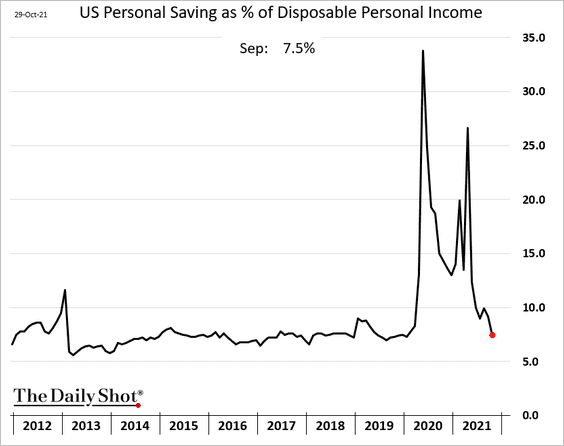
• The US savings rate is back to a more typical level.
——————–
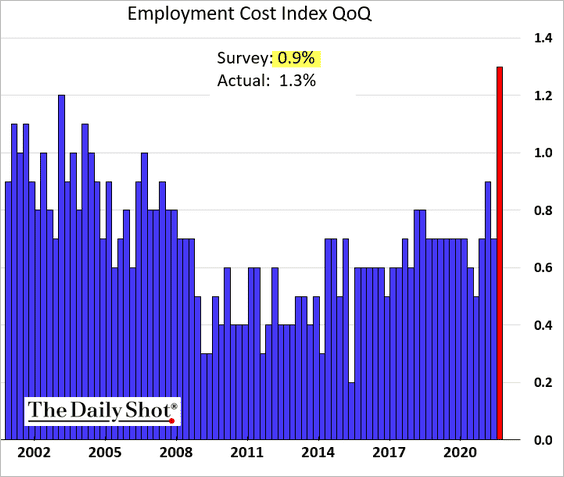
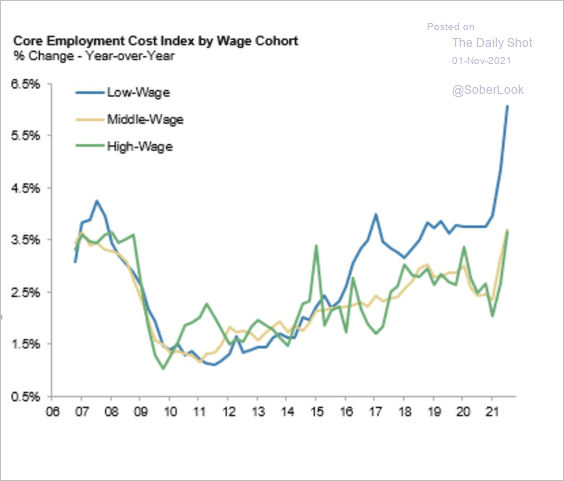
4. The Employment Cost Index (ECI) jumped by most on record last quarter, exceeding expectations.
• The biggest ECI gains came from wage increases …
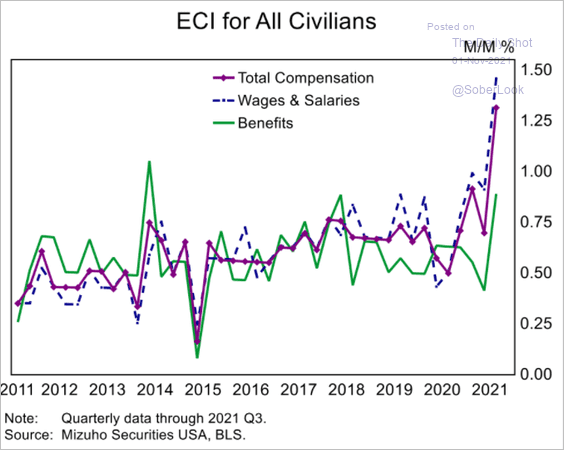 Source: Mizuho Securities USA
… and low-wage employees.
 Source: @acemaxx, @MorganStanley
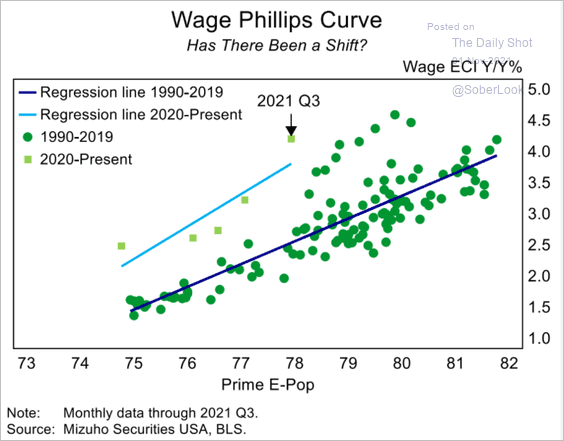
• Here is the relationship between ECI and prime-age employment-to-population ratio.
 Source: Mizuho Securities USA
——————–
5. Next, we have some updates on inflation.
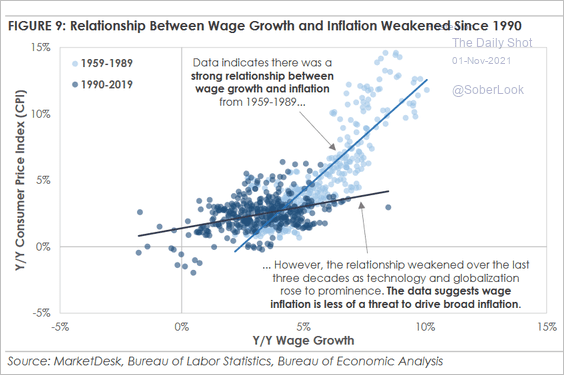
• The relationship between wage growth and inflation has been weak in recent decades.
 Source: MarketDesk Research
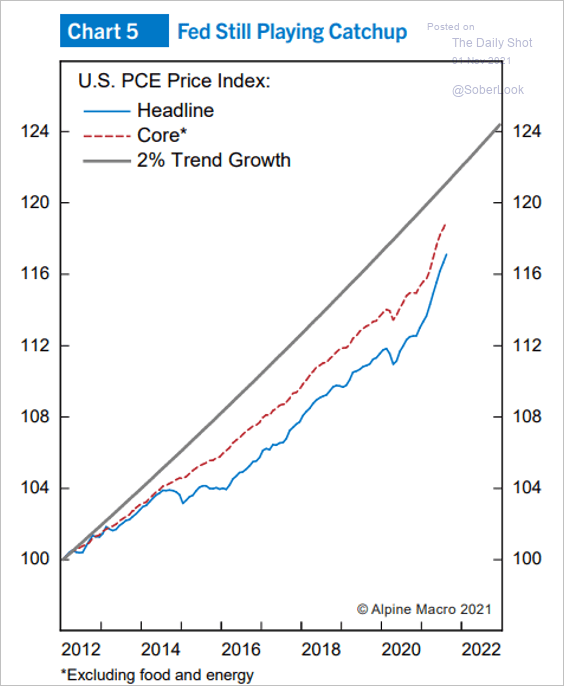
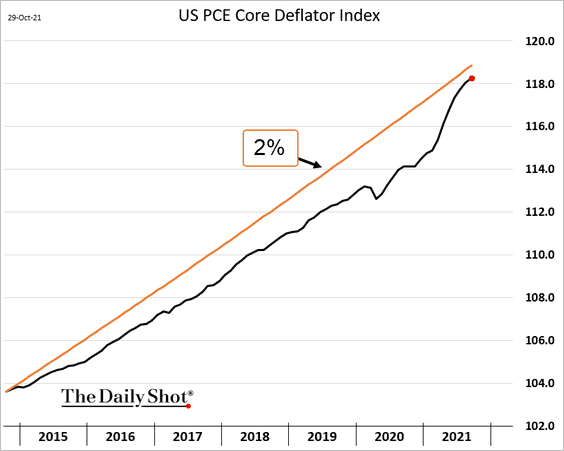
• When will inflation hit the Fed’s price target. It depends on the range.
 Source: Alpine Macro
• Inflation has been surprising to the upside (a global trend).
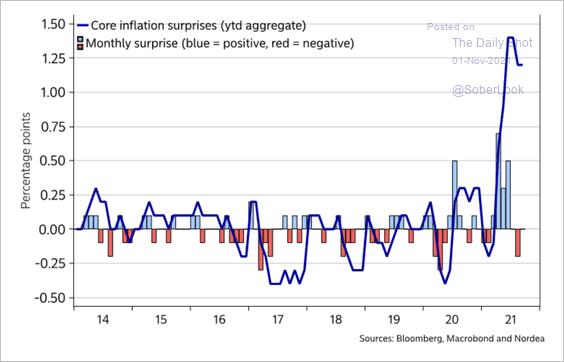 Source: Nordea Markets
——————–
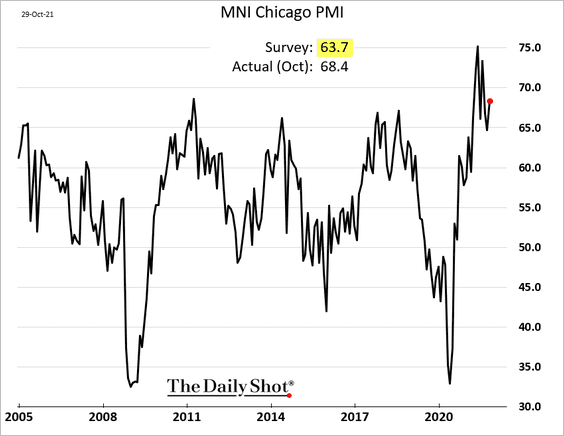
6. The Chicago PMI (Chicago-area business activity) surprised to the upside in October. This report bodes well for the ISM report at the national level.
Back to Index
Canada
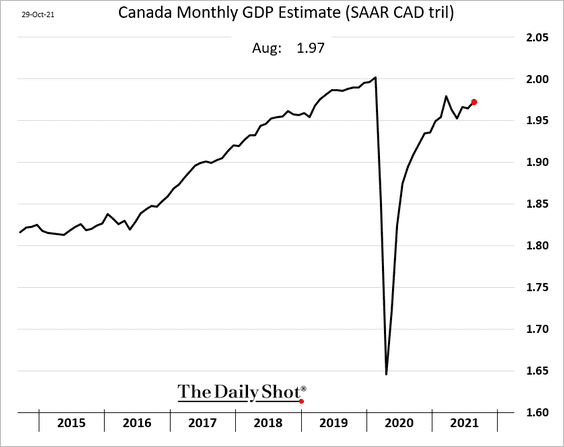
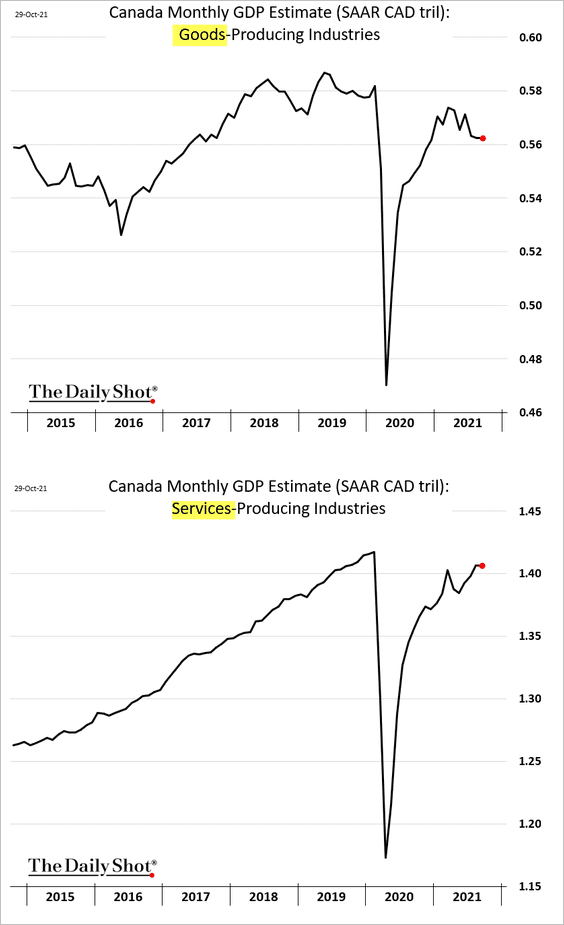
1. The August GDP estimate was softer than expected.
Goods and services output trends have diverged recently.
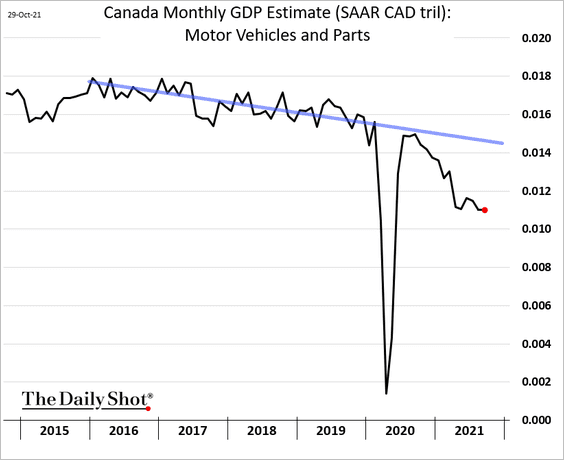
Vehicles production continues to trend lower.
——————–
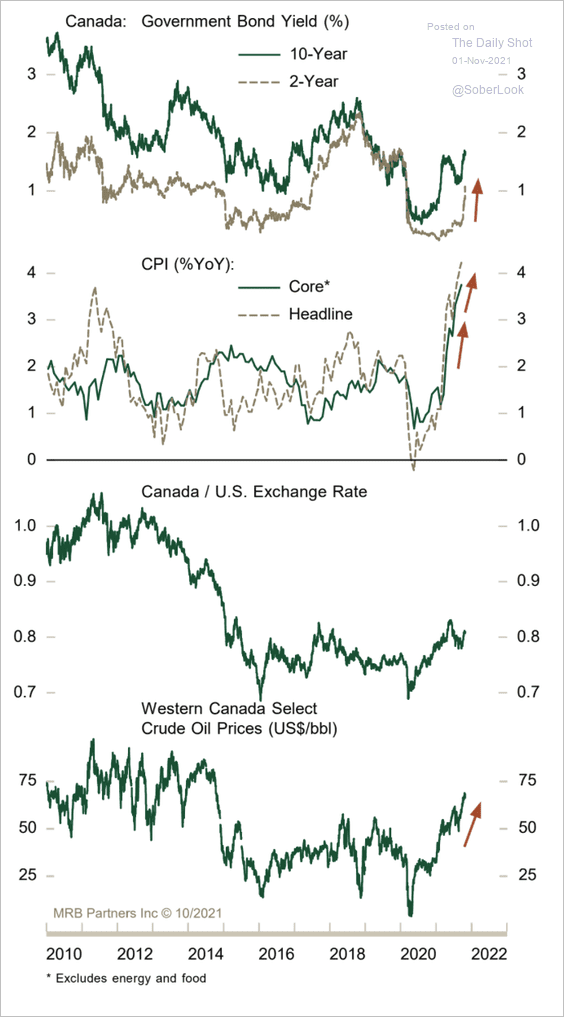
2. For now, the Canadian dollar appears to be well supported by higher rate expectations and oil prices.
 Source: MRB Partners
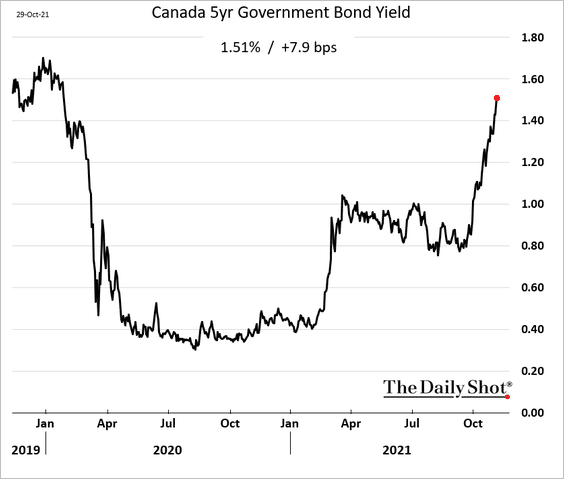
3. Bond yields keep climbing.
Back to Index
The United Kingdom
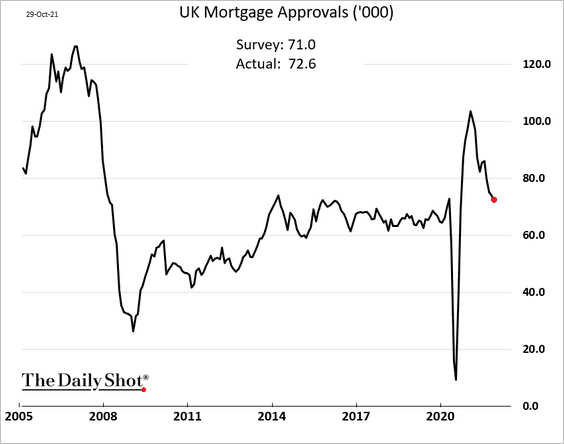
1. Mortgage approvals, which have been trending lower, came in a bit stronger than expected.
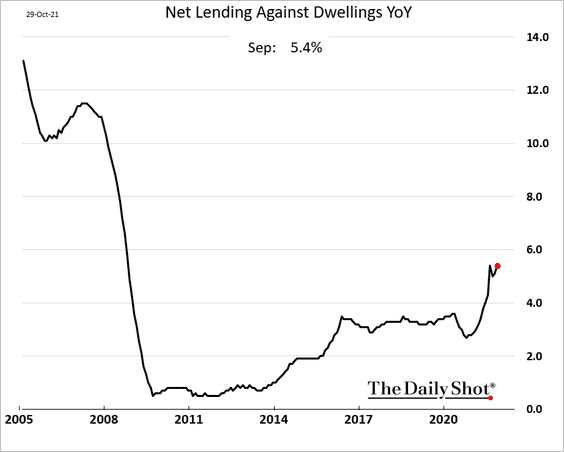
Here is the year-over-year change in housing credit.
——————–
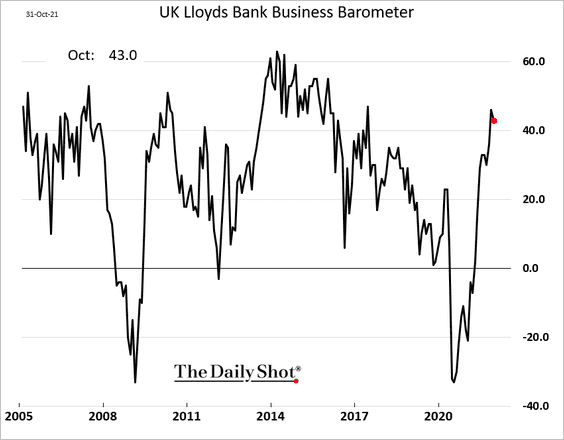
2. Business sentiment remains robust.
3. The government has reduced its public-sector borrowing forecast.
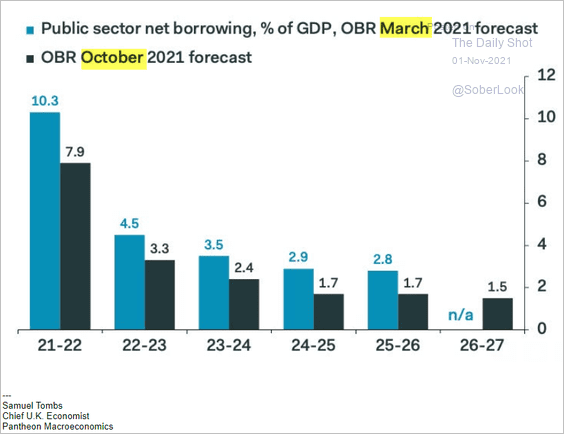 Source: Pantheon Macroeconomics
Back to Index
The Eurozone
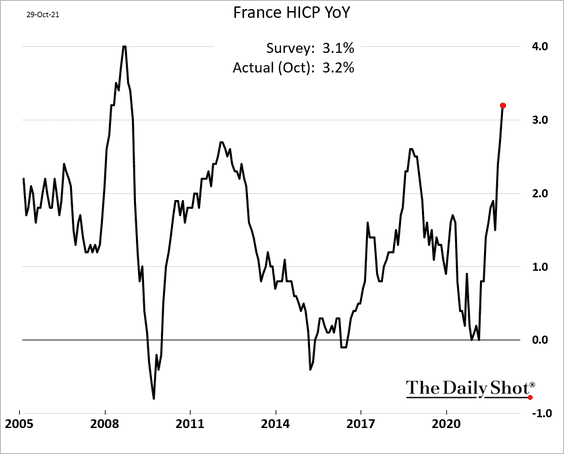
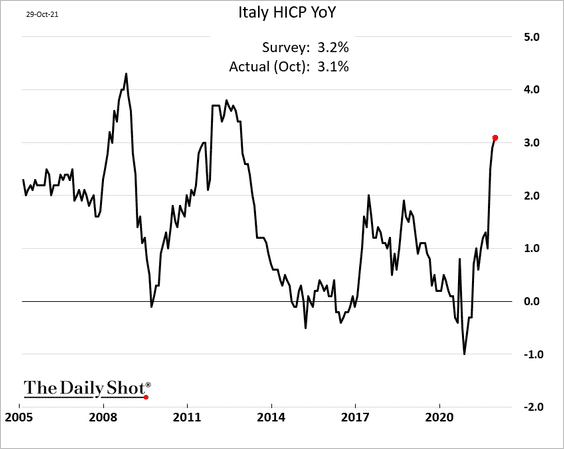
1. Inflation surprised to the upside in October. We already saw data from Spain and Germany. Below, we have France, Italy, and the Eurozone.
• France:
• Italy:
• The Eurozone:
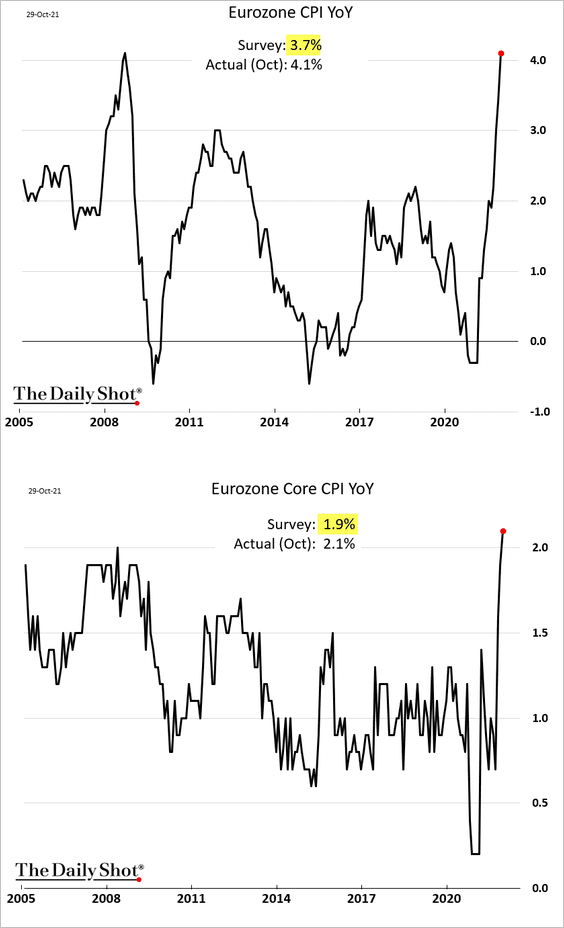
These inflation readings are the reason the market does not believe Christine Lagarde’s dovish comments.
 Source: Nordea Markets
——————–
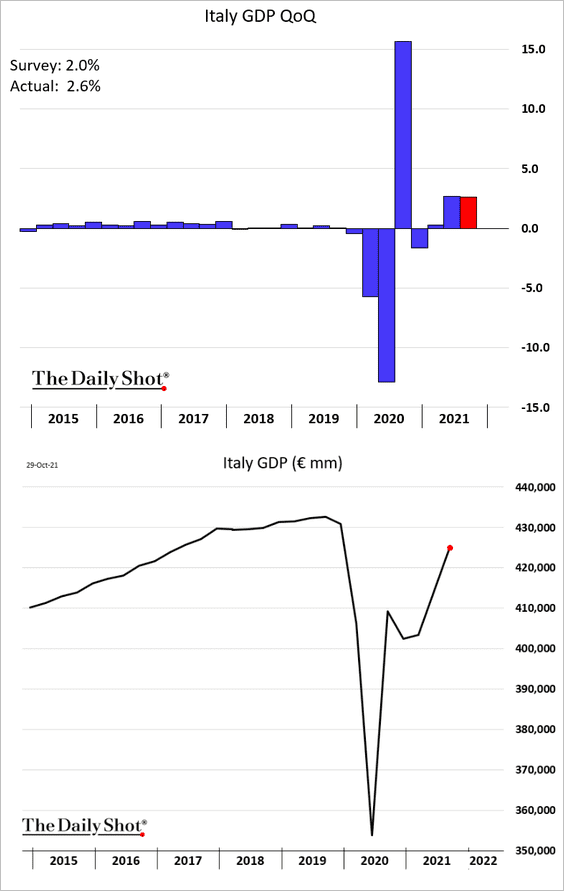
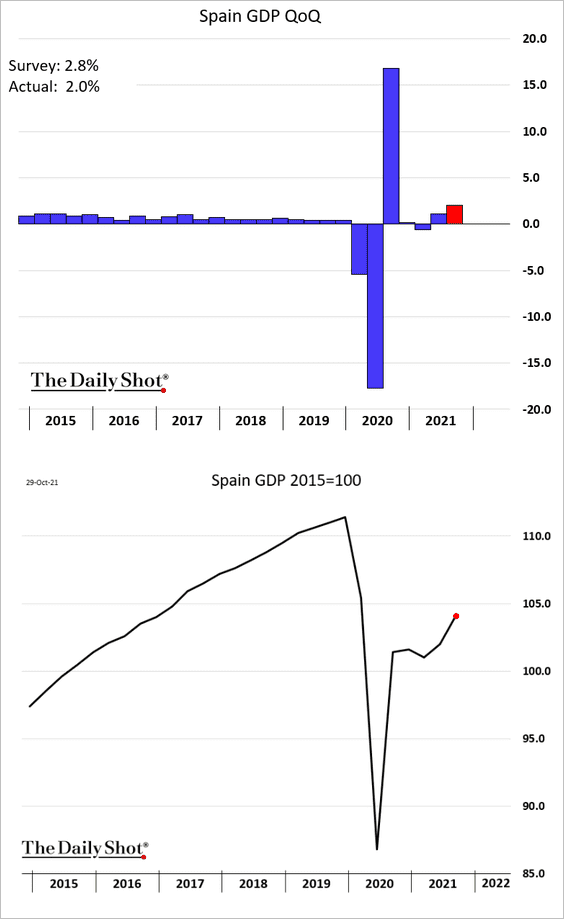
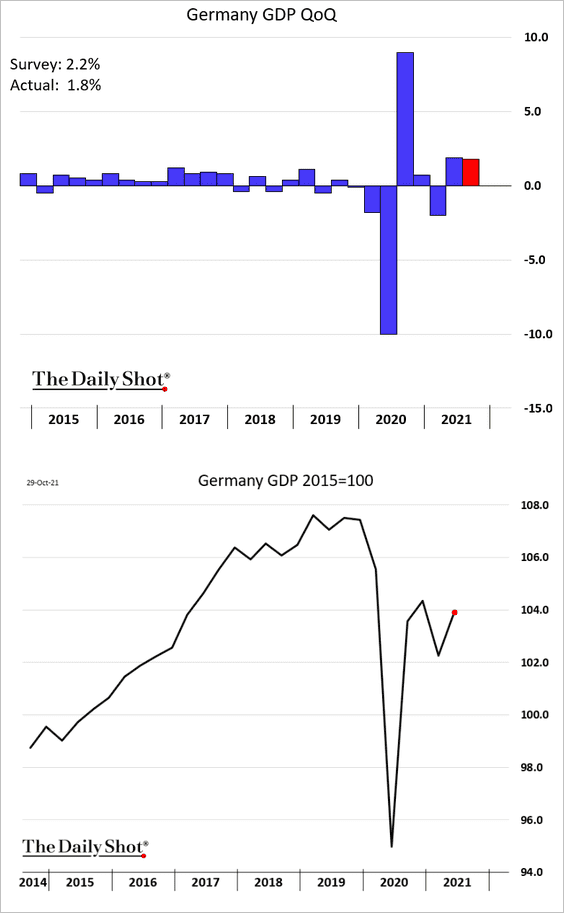
2. Next, we have some updates on the Q3 GDP growth.
• Italy: better than expected; strong recovery.
• Spain: long recovery ahead.
• Germany: below consensus; it will take time to get to pre-COVID levels.
• France: has fully recovered, boosted by government spending. Domestic demand has been robust.
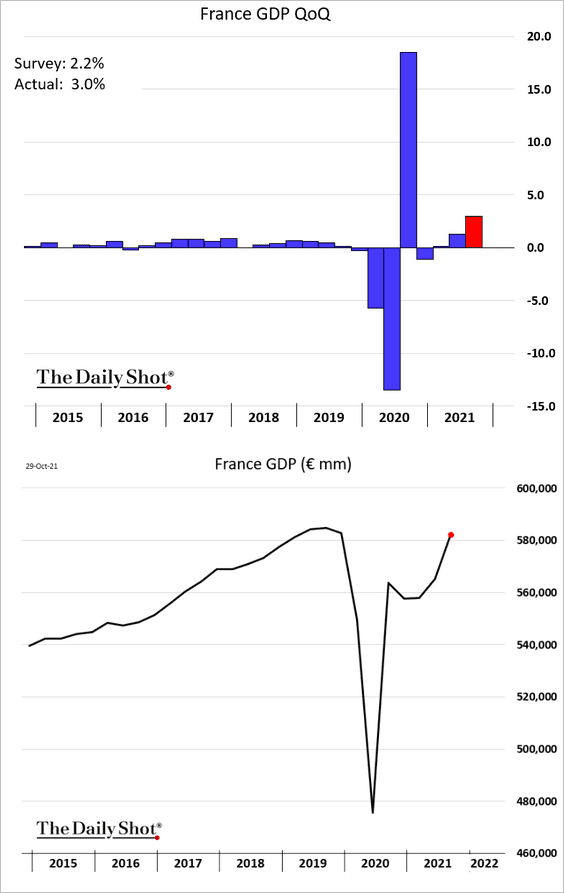
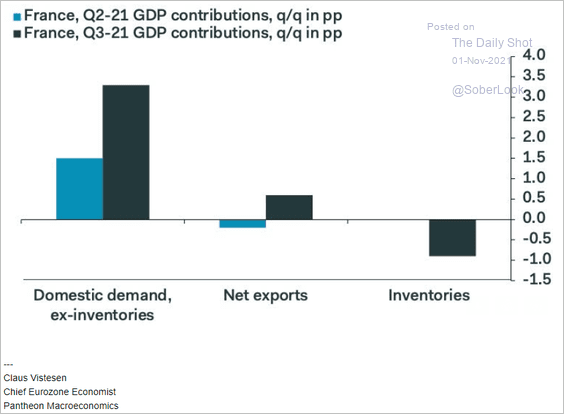 Source: Pantheon Macroeconomics
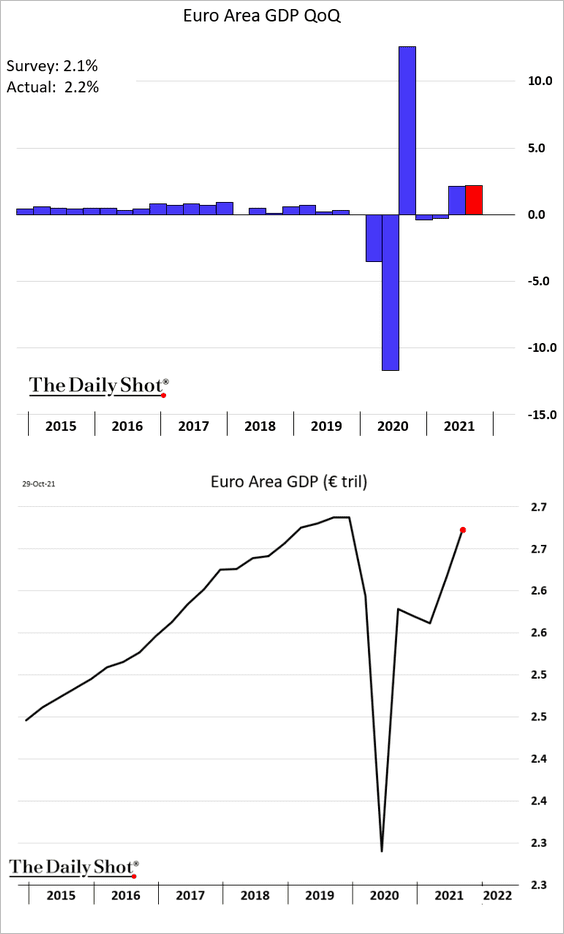
• The Eurozone: the recovery is nearly complete.
——————–
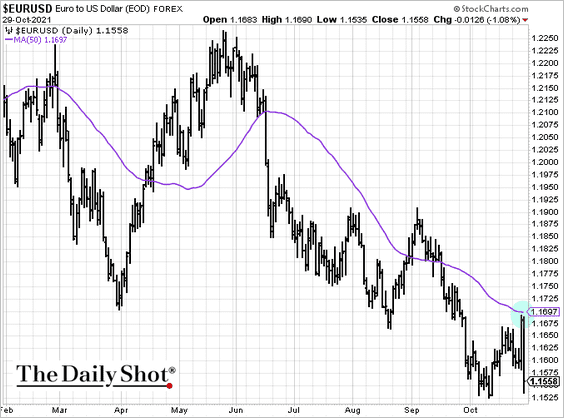
3. The euro held resistance at the 50-day moving average, tumbling in Friday.
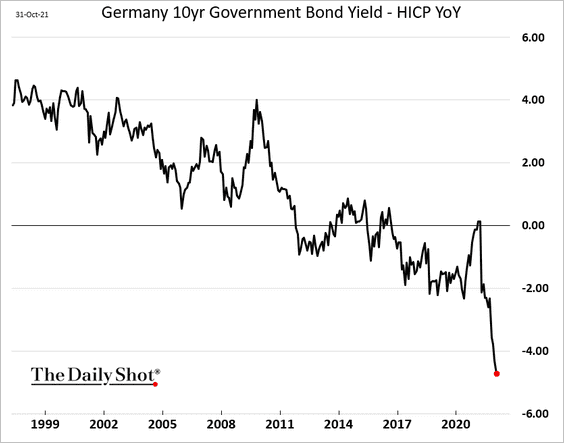
4. This chart shows the 10yr Bund yield adjusted for inflation.
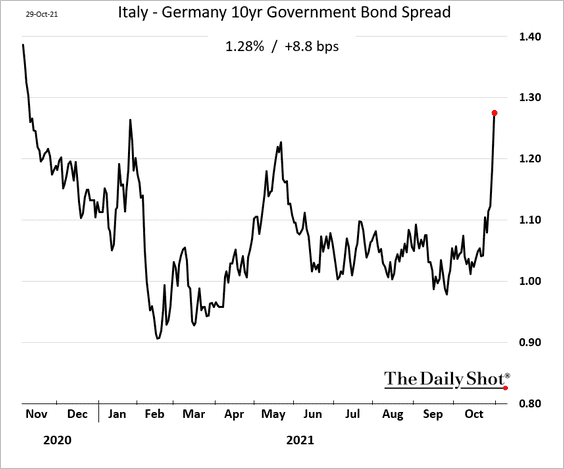
5. The spread between Italy and Germany has been widening.
Back to Index
Asia – Pacific
1. Taiwan’s GDP growth was a bit softer than expected last quarter.
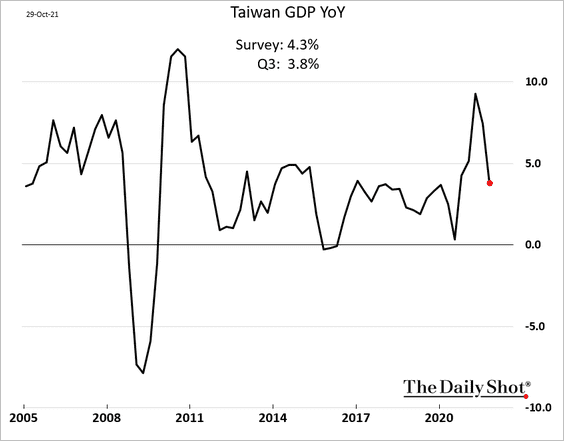
Manufacturing growth has moderated but is holding up.
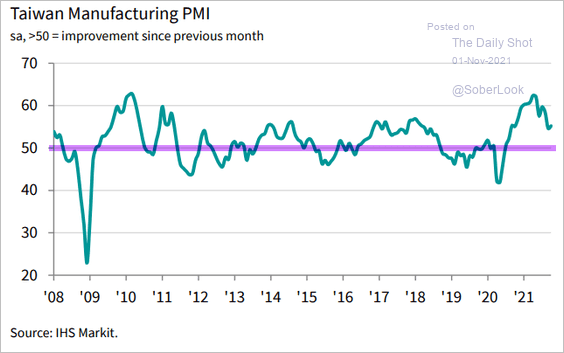 Source: IHS Markit
——————–
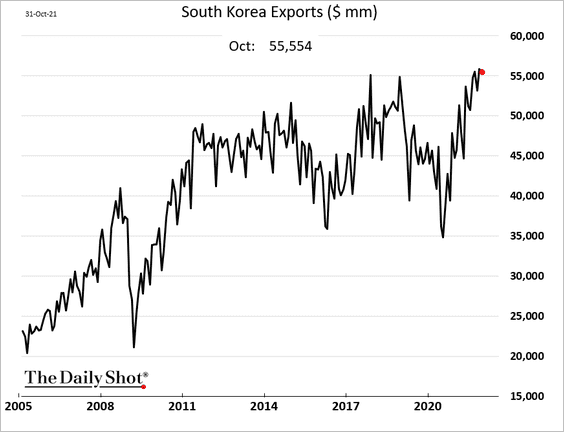
2. South Korea’s manufacturing growth has stalled.
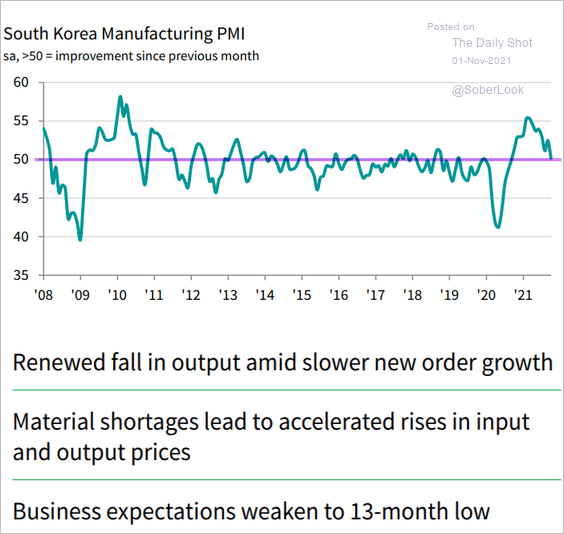 Source: IHS Markit
Exports remain robust.
——————–
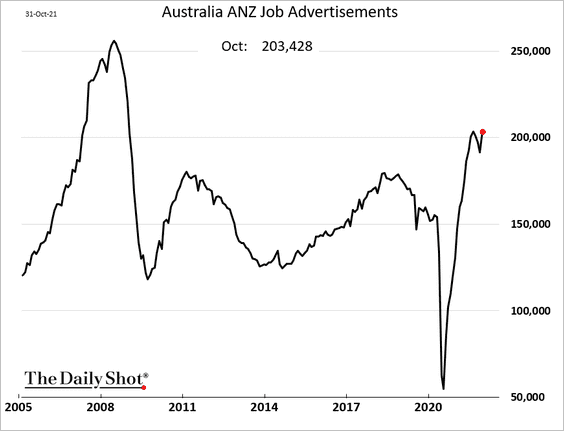
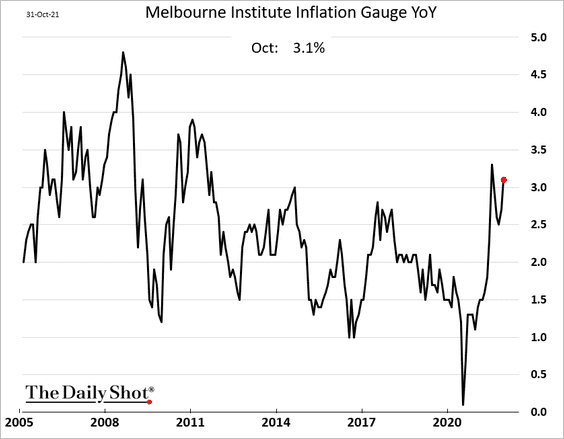
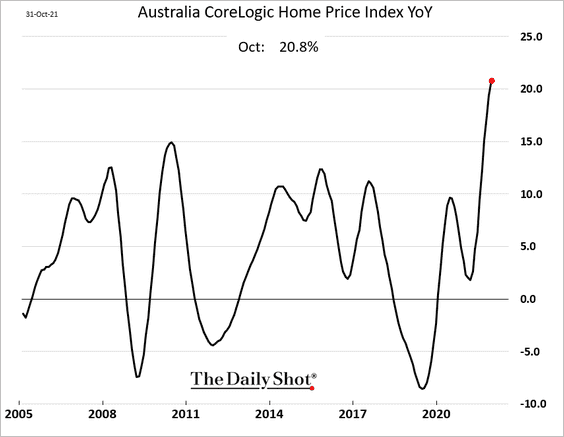
3. Next, we have some updates on Australia.
• Job openings rebounded in October.
• The Melbourne Institute Inflation Gauge is back above 3%.
• Home prices continue to surge.
Back to Index
China
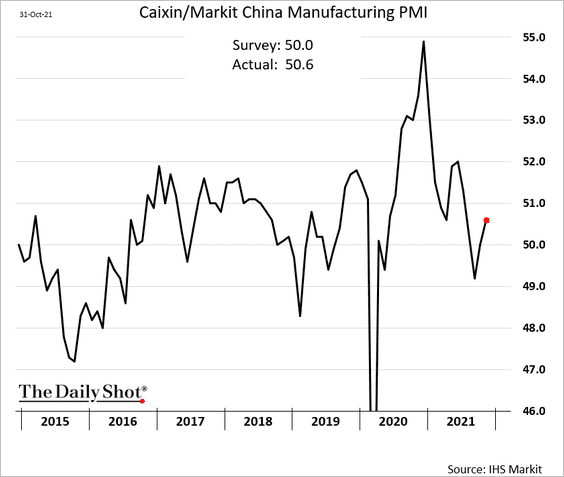
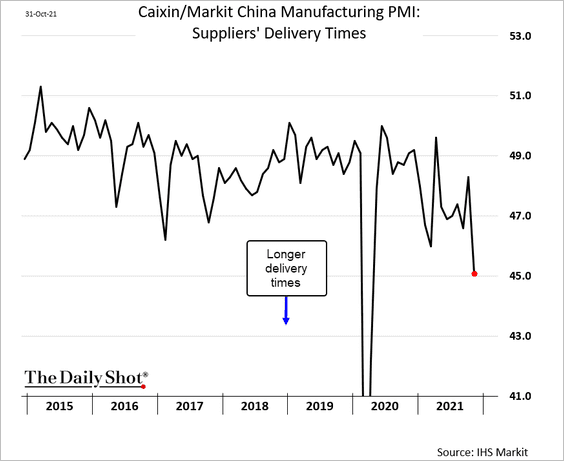
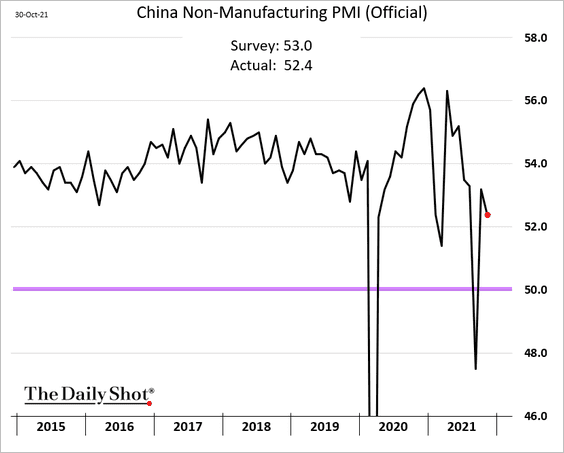
1. The PMI measures were mixed again.
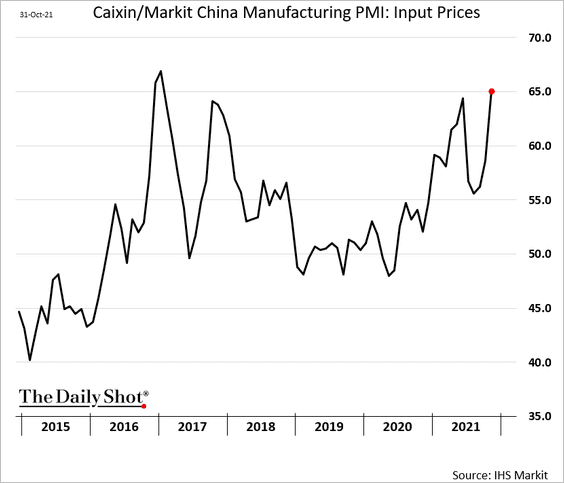
• The Markit PMI improved in October.
– Supplier bottlenecks worsened.
– And input prices accelerated.
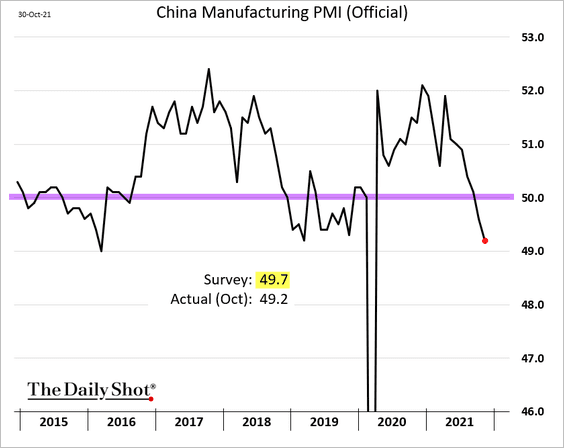
• The official manufacturing PMI showed a contraction in factory activity. This report also showed surging input prices and supplier delays.
• Services remain in growth territory.
——————–
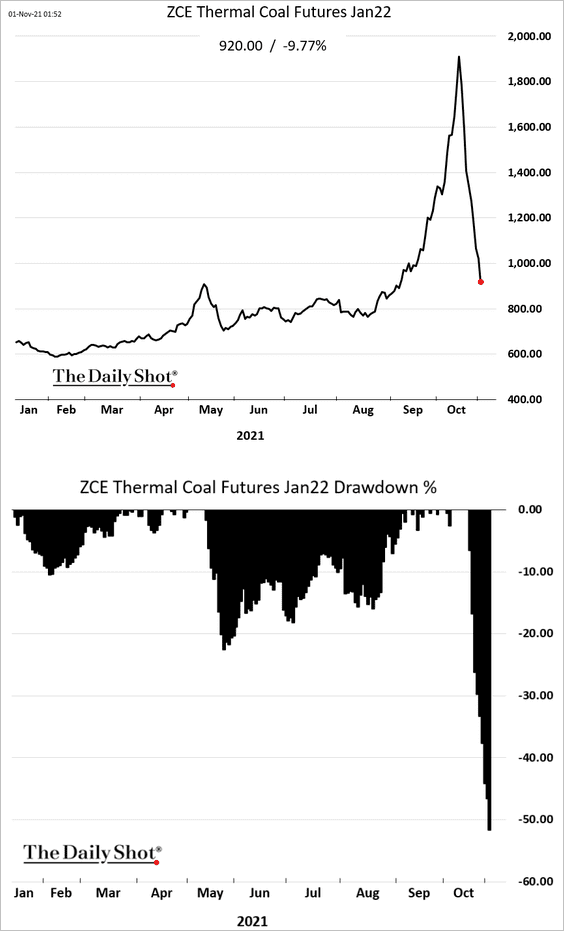
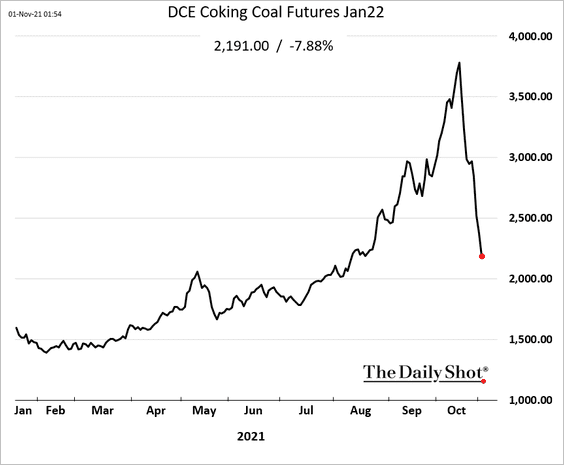
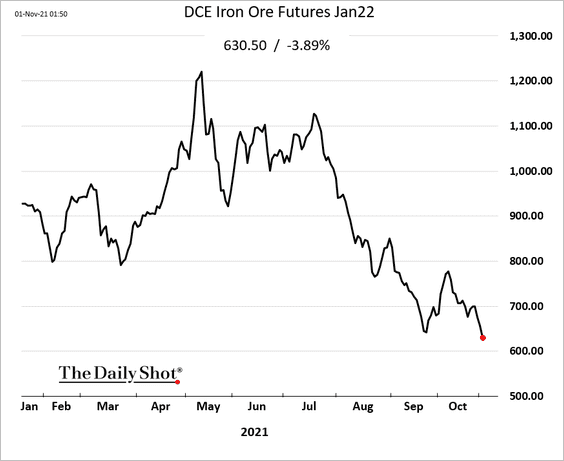
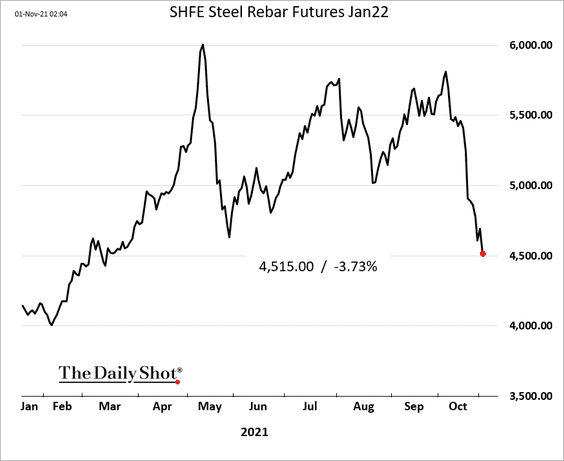
2. Coal prices continue to tumble, dragging ferrous commodities lower.
• Thermal coal:
• Metallurgical coal:
• Iron ore:
• Steel rebar:
——————–
3. Real estate developers continue to struggle.
• More downgrades:
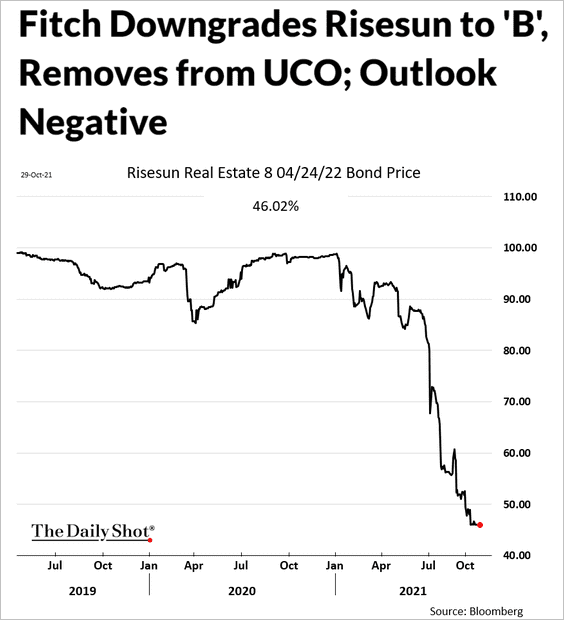 Source: Fitch Ratings Read full article
• Creditor actions (Oceanwide defaulted a few months ago):
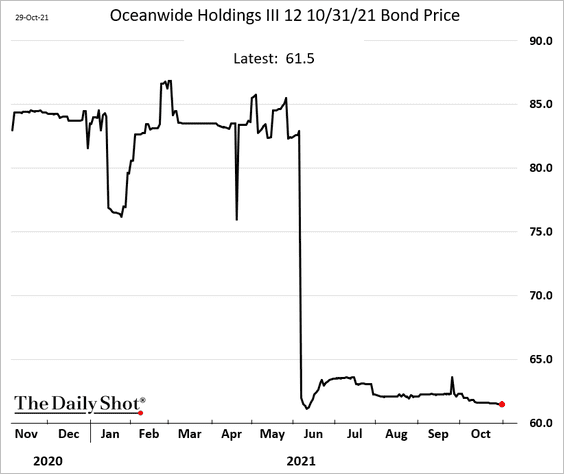
 Source: Bisnow Read full article
• USD-denominated HY bonds remain under pressure.
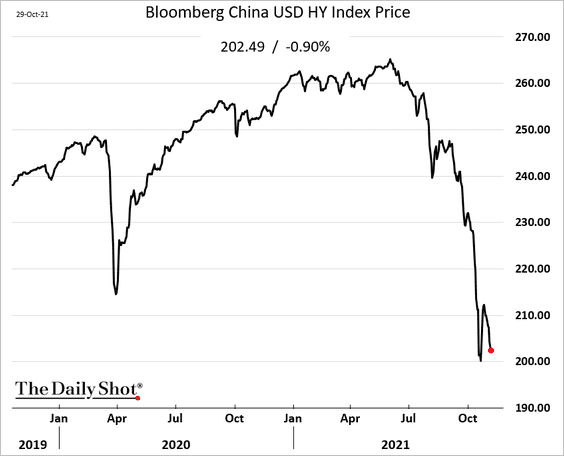
The HY market is nearly shut now.
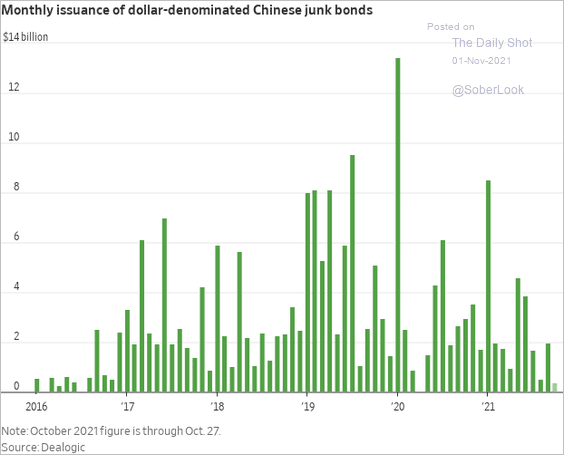 Source: @WSJ Read full article
• China’s property market has been cooling (2 charts).
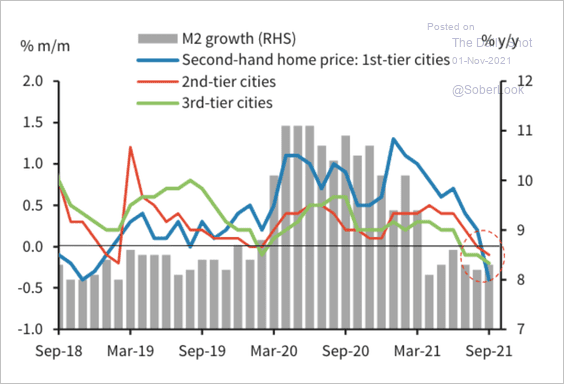 Source: JP Morgan Research
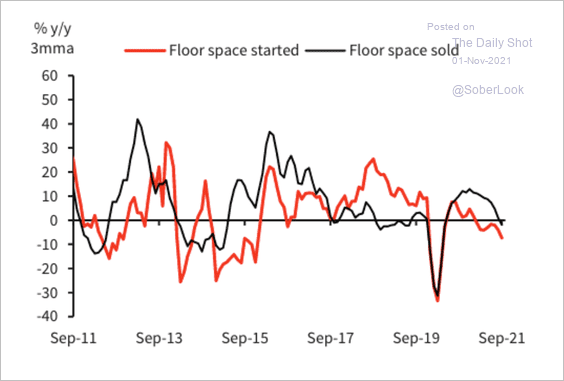 Source: Variant Perception
Back to Index
Emerging Markets
1. Manufacturing activity across EM Asia is rebounding (PMI > 50).
• India:
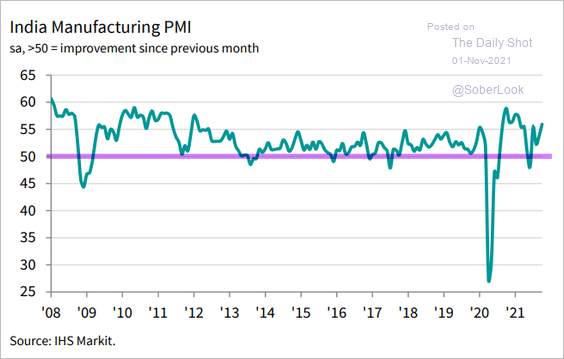 Source: IHS Markit
• Thailand:
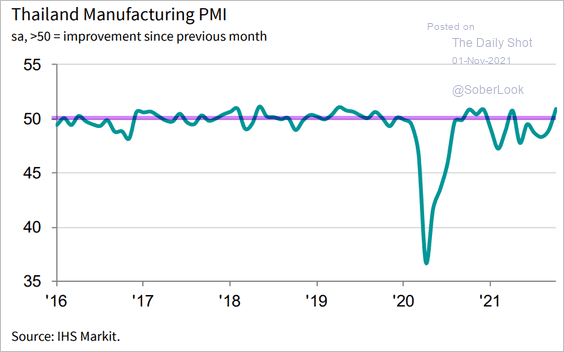 Source: IHS Markit
• Indonesia (spectacular rebound):
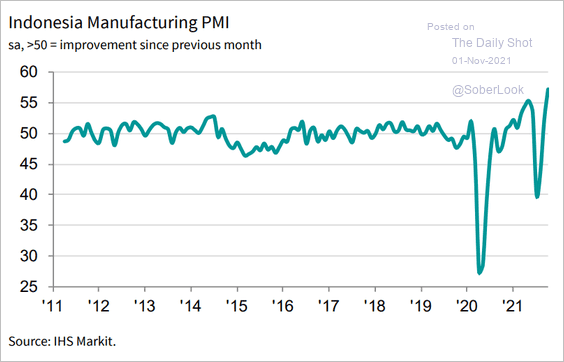 Source: IHS Markit
• Malaysia:
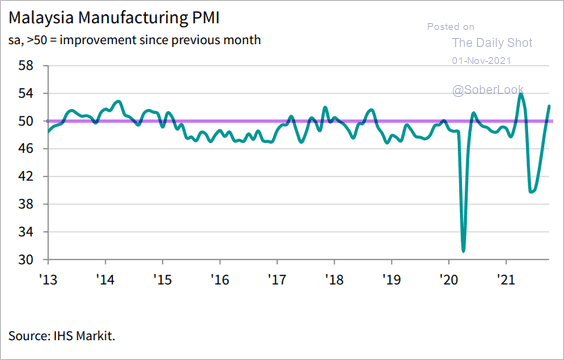 Source: IHS Markit
——————–
2. Next, we have some updates on Brazil.
• Brazil is facing significant price increases across most sectors.
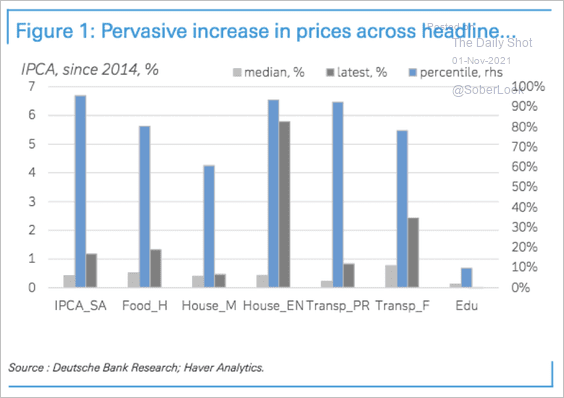 Source: Deutsche Bank Research
• Inflation volatility is at the highest level since 2003.
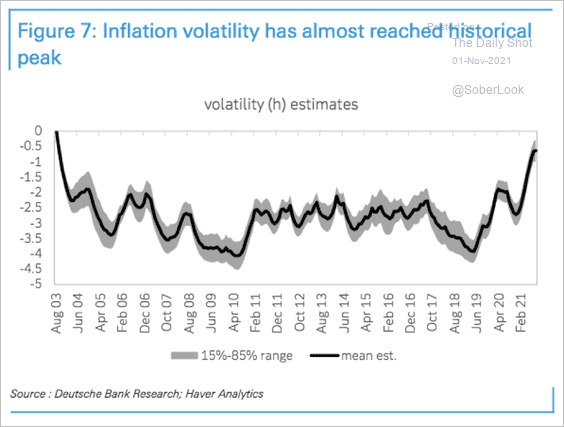 Source: Deutsche Bank Research
• This chart shows a breakdown of cyclical inflation in Brazil. Food and dwellings are the largest contributors.
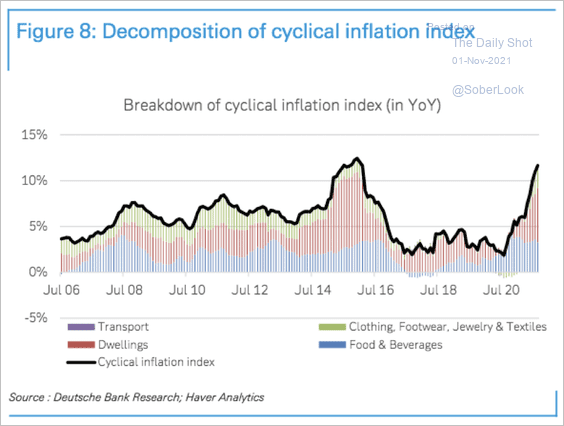 Source: Deutsche Bank Research
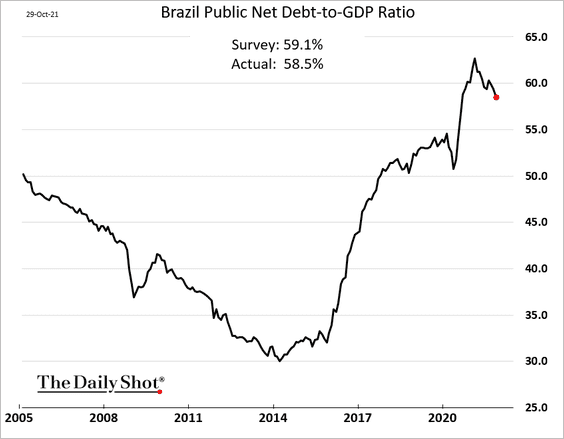
• The debt-to-GDP ratio continues to moderate.
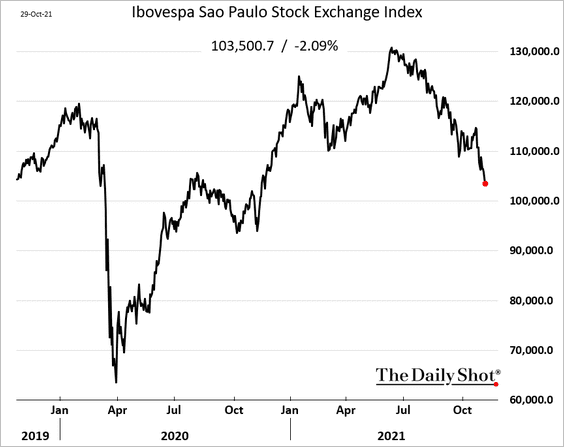
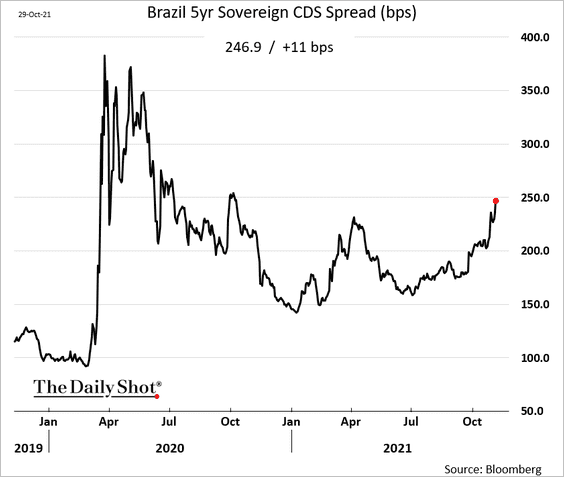
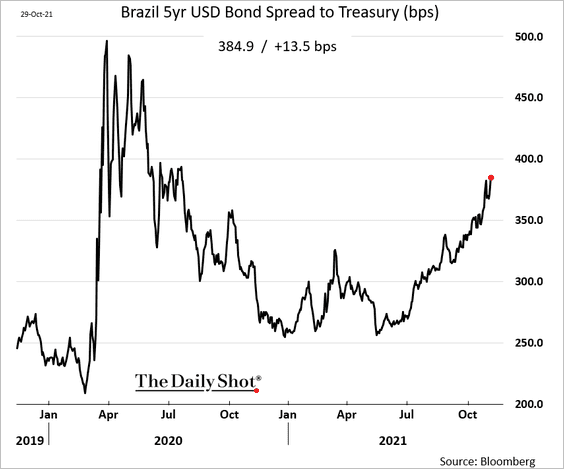
• Brazil’s markets are struggling.
– Equities:
– Sovereign CDS spread:
– USD-denominated bond spread:
——————–
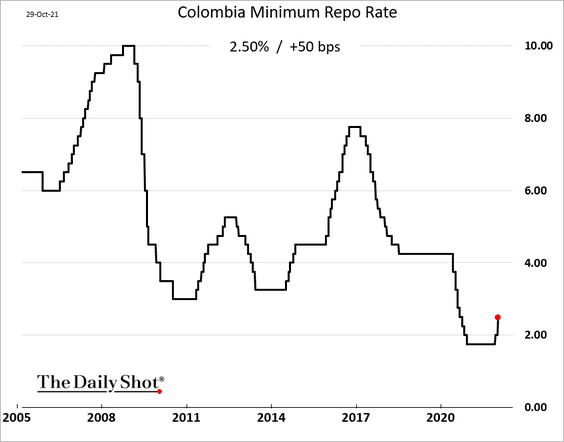
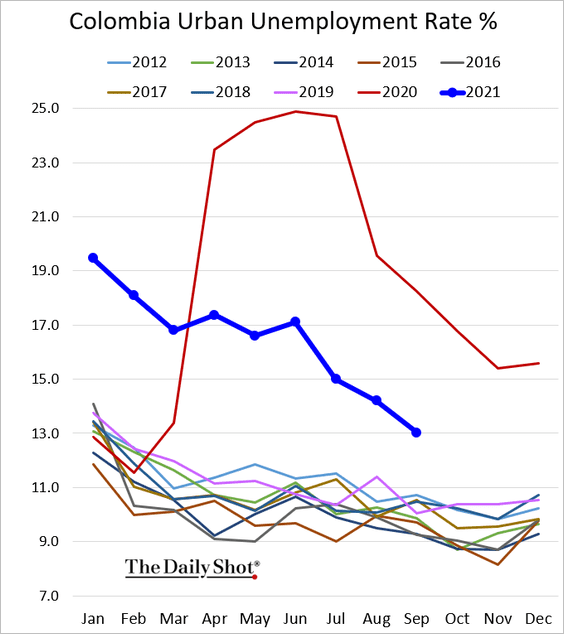
3. Colombia’s central bank unexpectedly hiked by 50 bps.
The nation’s unemployment rate is declining quickly.
Back to Index
Commodities
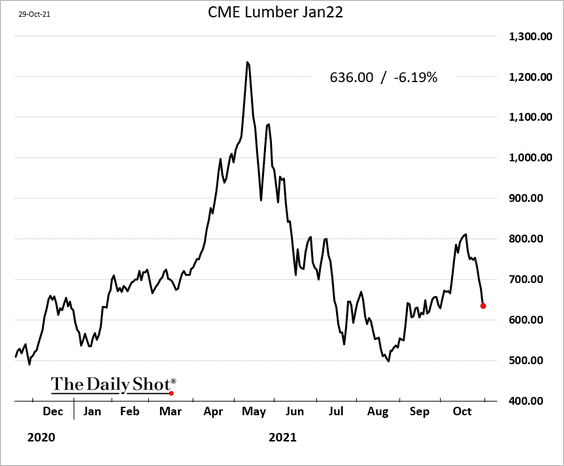
1. The rebound in US lumber futures is fading.
2. Average daily trading volume and open interest in aluminum futures rose sharply over the past few months.
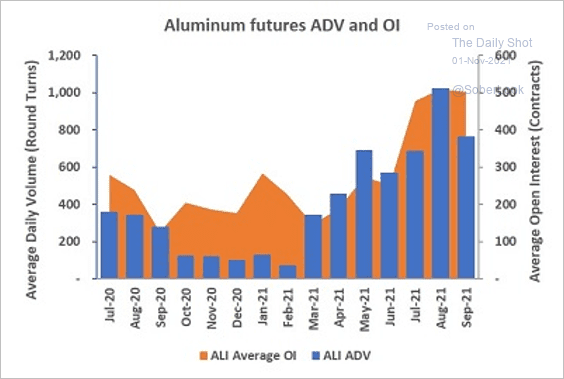 Source: CME Group
3. Memory chip prices have been moderating.
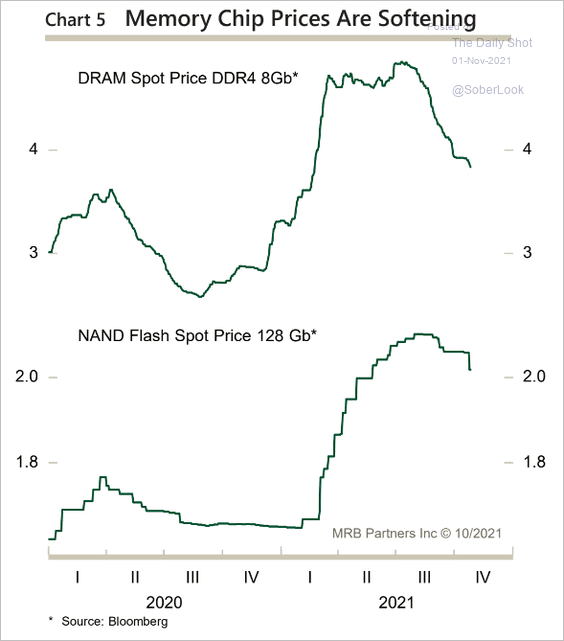 Source: MRB Partners
Back to Index
Energy
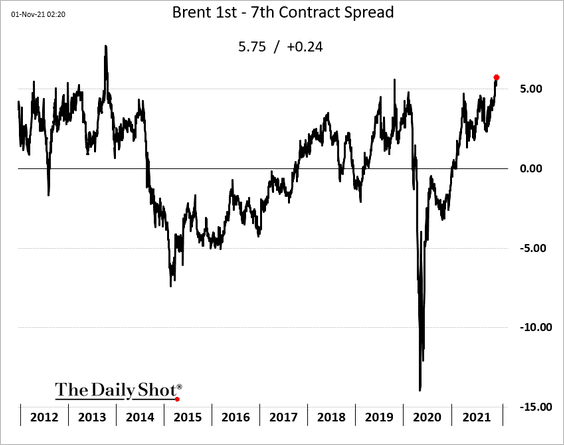
1. Brent continues to move deeper into backwardation.
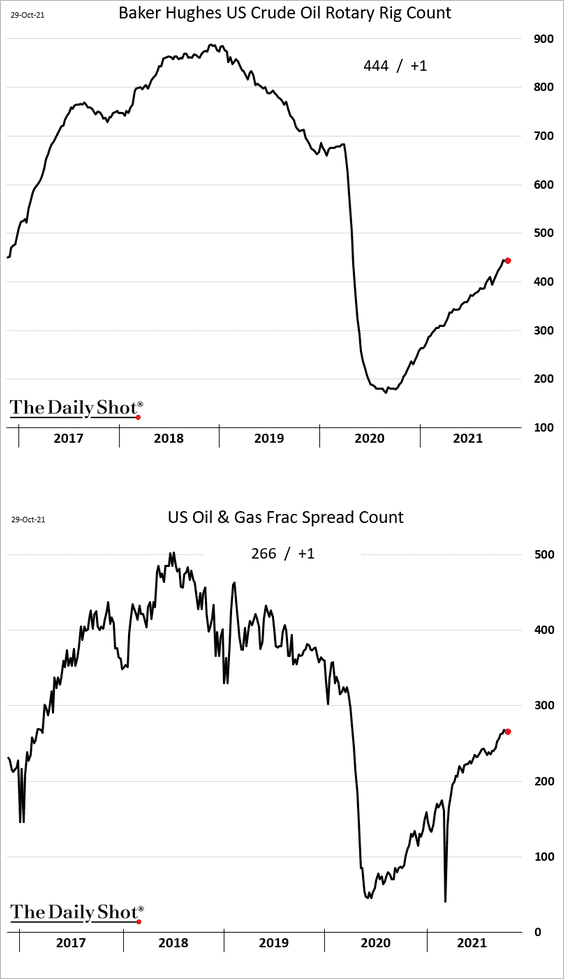
2. The recovery in US drilling activity has slowed in recent weeks.
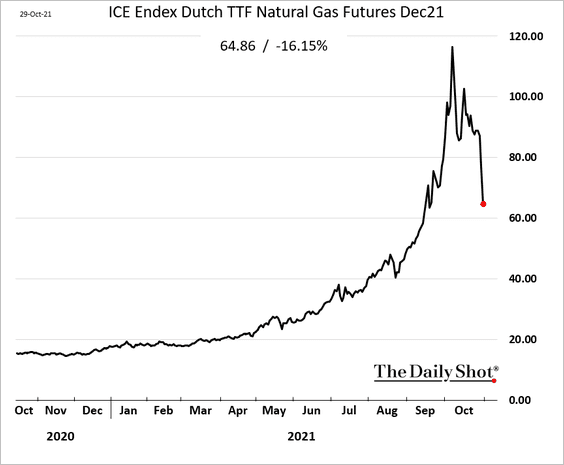
3. European natural gas futures are tumbling.
By the way, Gazprom’s storage facilities in Germany have been nearly empty.
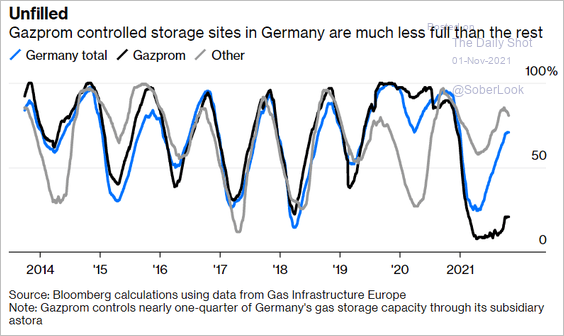 Source: Bloomberg Read full article
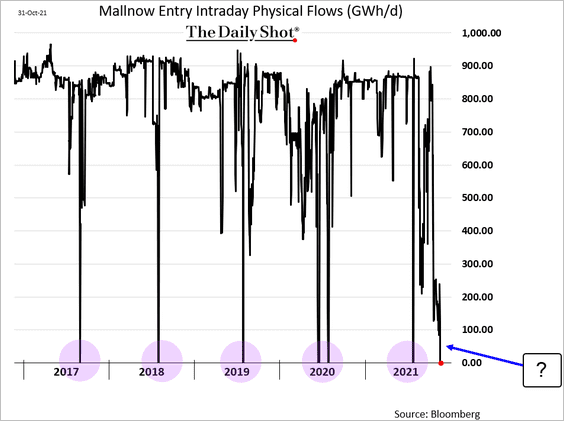
Russian natural gas flows into Germany have collapsed.
Back to Index
Equities
1. Earnings continue to exceed expectations.
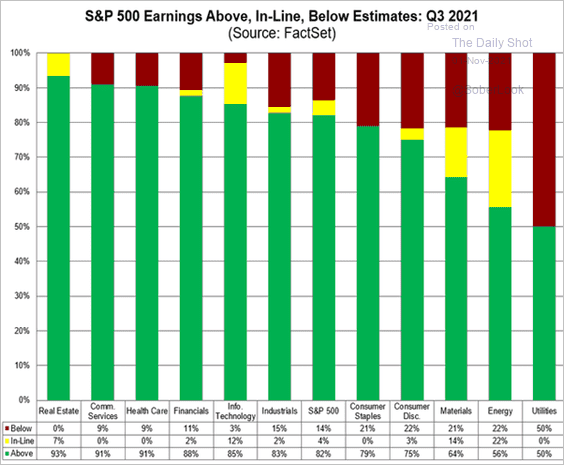 Source: @FactSet Read full article
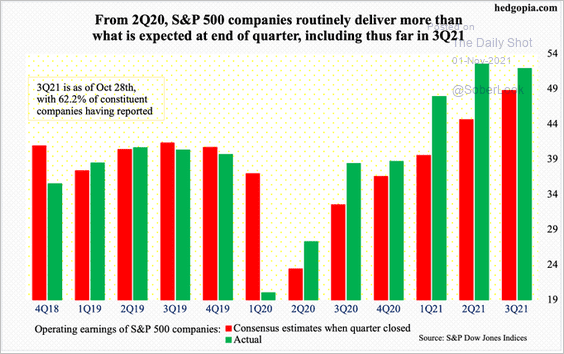 Source: @hedgopia
——————–
2. For now, companies have been able to maintain high profit margins despite supply chain disruptions, wage increases, and rising input prices.
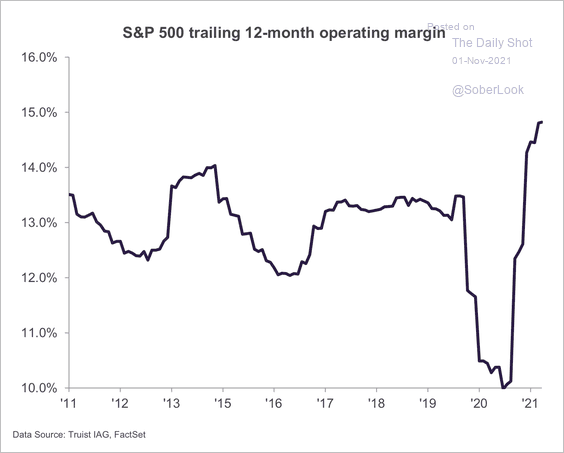 Source: Truist Advisory Services
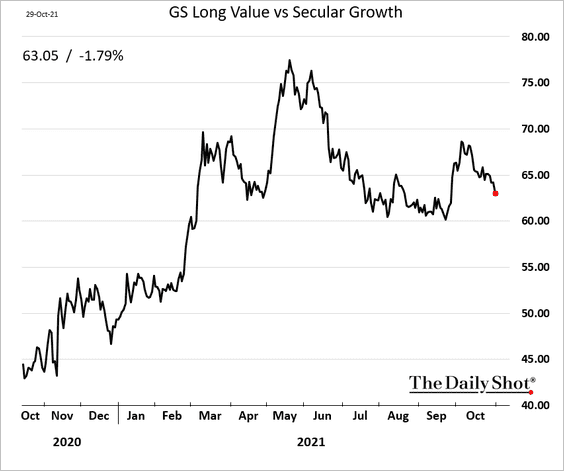
3. The rebound in value stocks relative to growth has stalled.
4. Most investors feel relatively bullish on equities, according to a survey by JPMorgan.
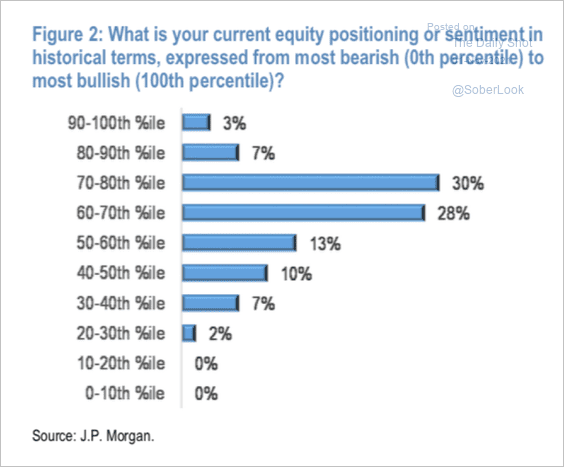 Source: JP Morgan Research
And 67% of respondents are expected to increase their exposure to equities over the coming weeks.
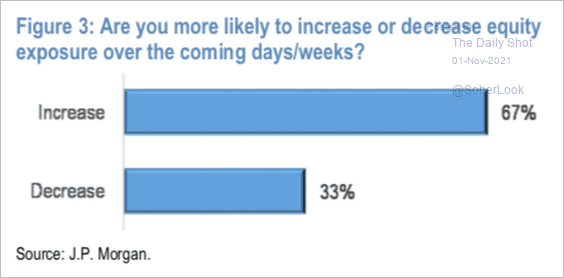 Source: JP Morgan Research
• Merrill Lynch private clients’ equity allocations hit a new high.
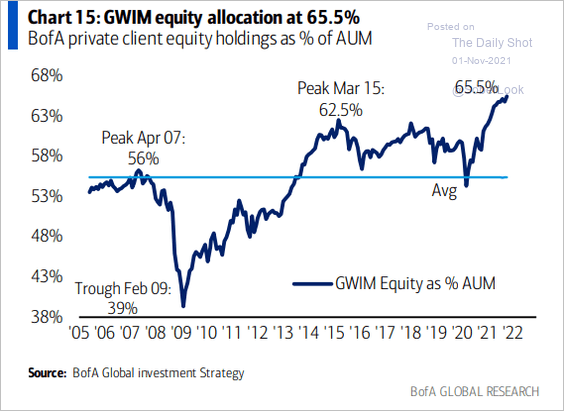 Source: @Callum_Thomas, @MikeZaccardi
• Family offices are bullish as well.
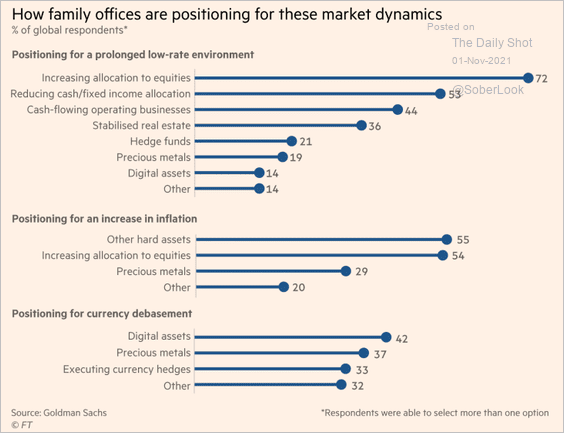 Source: @financialtimes Read full article
• Even the more bearish investors have been bullish.
 Source: @LizYoungStrat, @Callum_Thomas, @topdowncharts
——————–
5. The volume of call options on Nasdaq 100 stocks has been surging (boosted by Tesla).
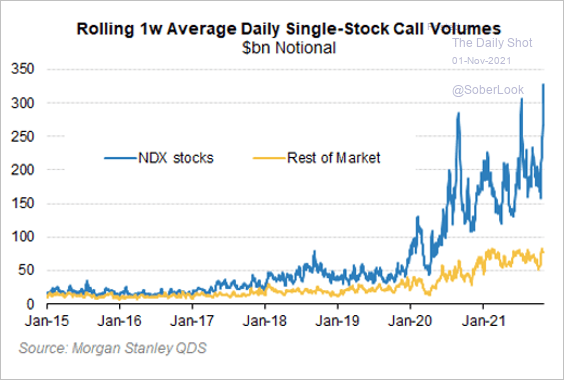 Source: @TommyThornton; Morgan Stanley Research
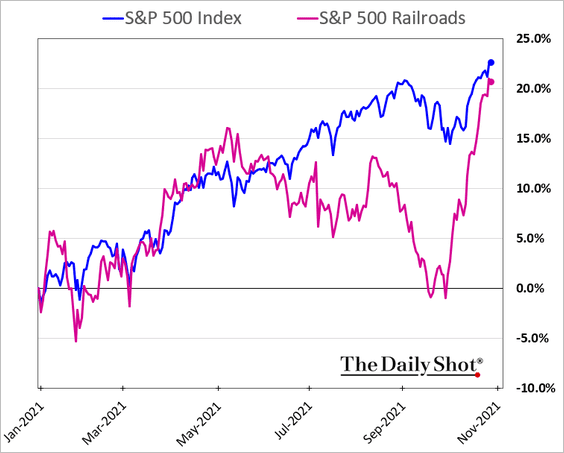
6. It’s been a good month for railroads.
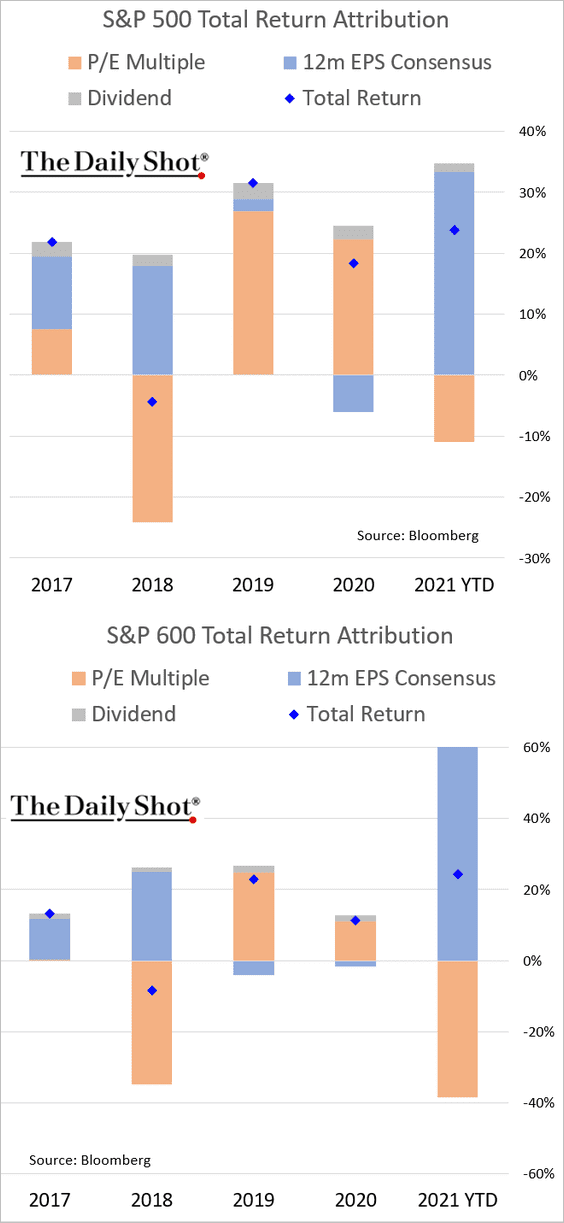
7. Here is the updated return attribution for the S&P 500 and S&P 600 (small caps).
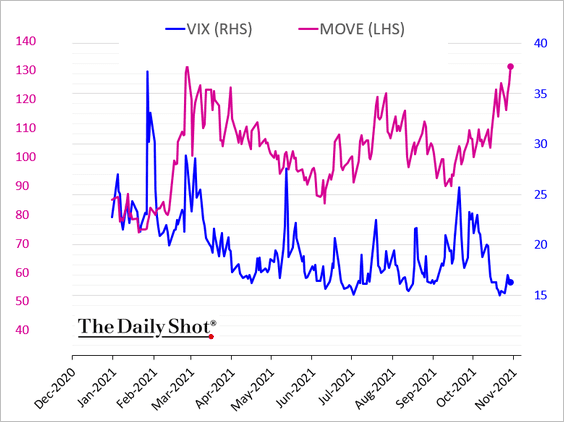
8. Treasury market implied volatility (MOVE) continues to diverge from equity vol (VIX). Something has to give.
Back to Index
Rates
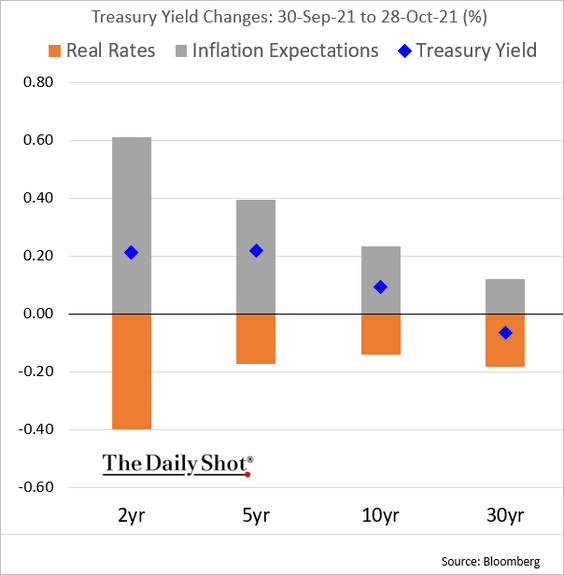
1. This chart shows the attribution of Treasury moves in October.
2. Yield curves have been flattening. MRB Partners expects the resumption of a bear steepening trend once it is clear that underlying inflation will be stickier than most expect.
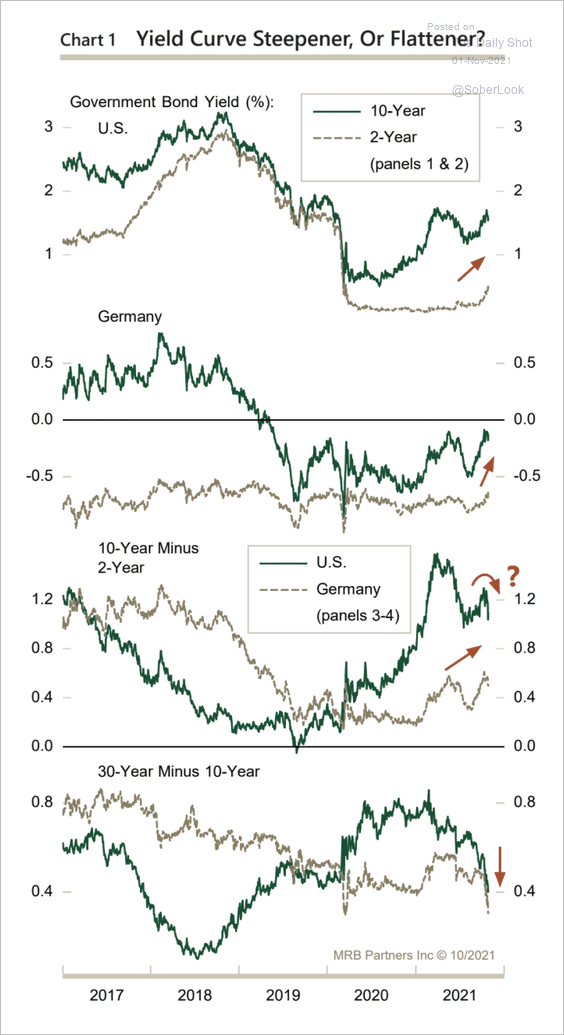 Source: MRB Partners
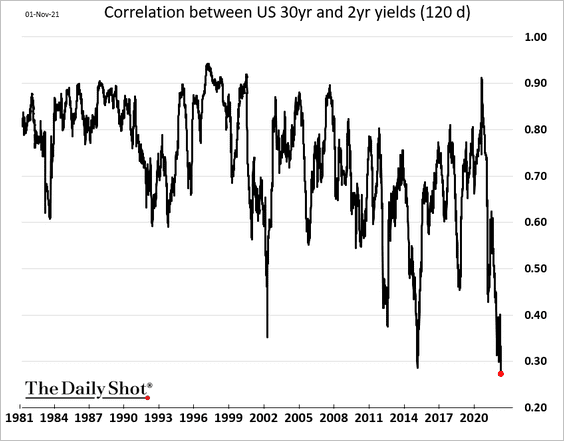
3. The correlation between short- and long-term Treasury yields has broken down.
Back to Index
Global Developments
1. Here is a look at year-to-date and month-to-date returns across asset classes (2 charts).
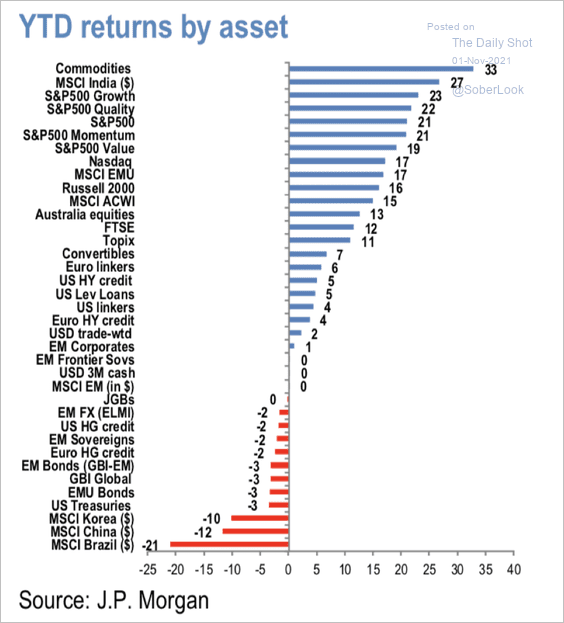 Source: JP Morgan Research
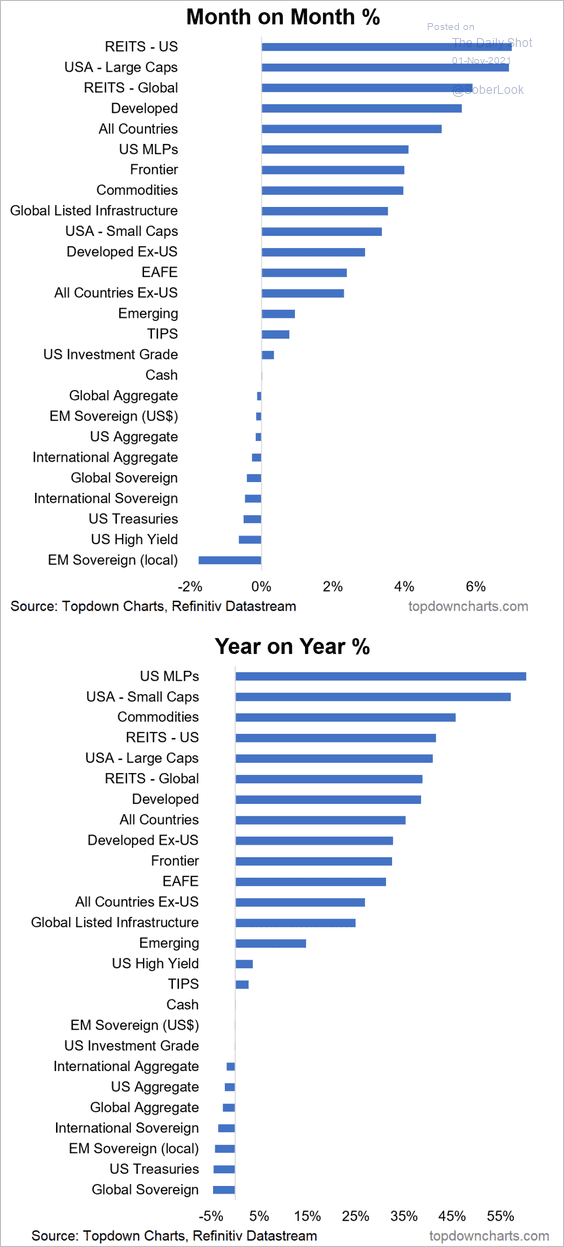 Source: @Callum_Thomas, @topdowncharts
——————–
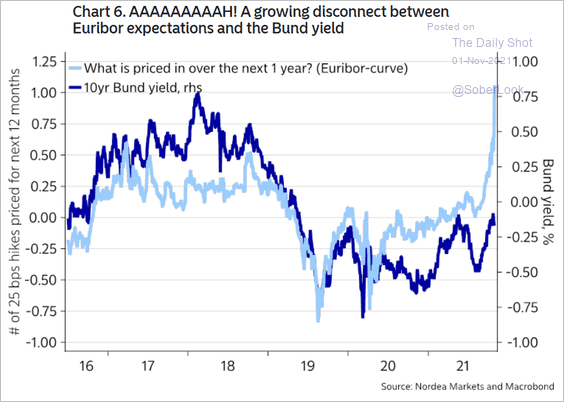
2. Rate hike expectations have exploded as inflation spikes around the world.
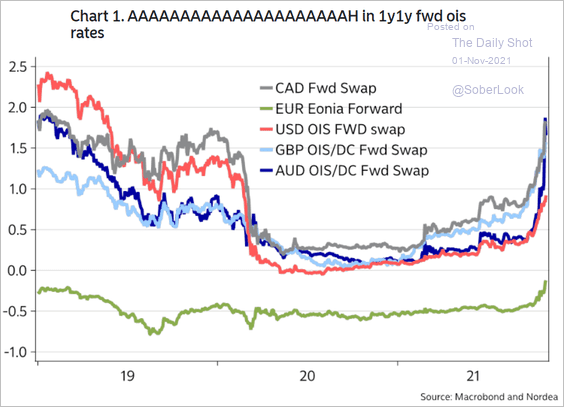 Source: Nordea Markets
——————–
3. Here is a look at the dollar’s performance vs. various currencies year-to-date.
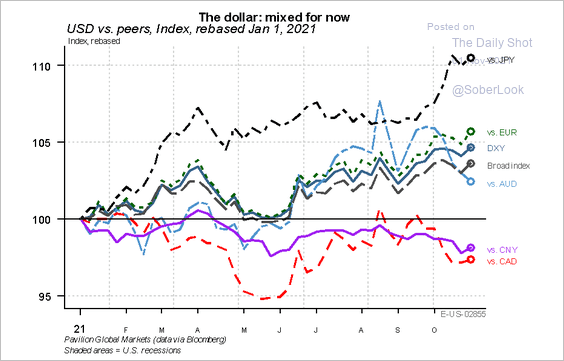 \
\
——————–
Food for Thought
1. Breakfast prices:
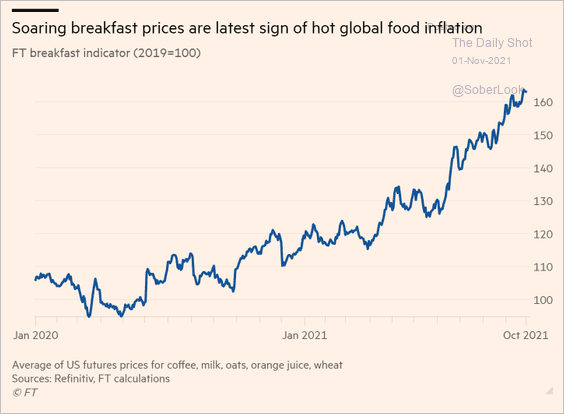 Source: @financialtimes Read full article
2. Views on buying American-made products:
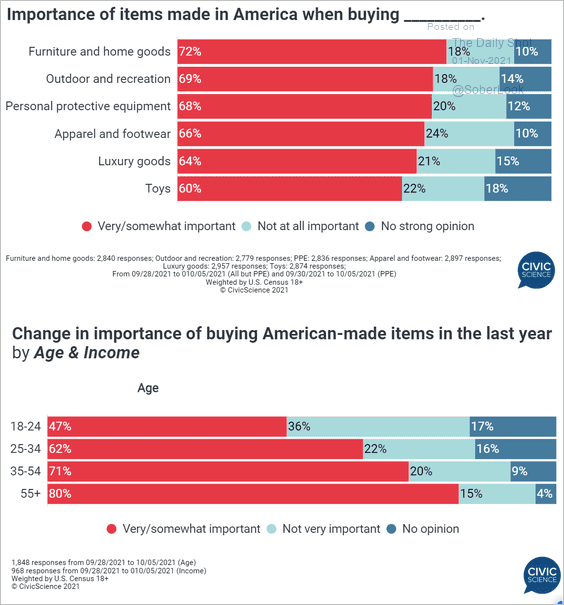 Source: @CivicScience
3. Top sovereign wealth funds:
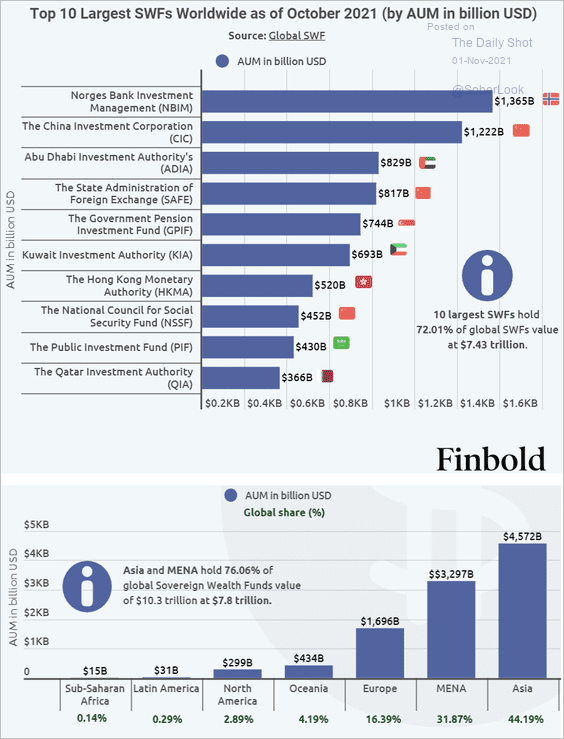 Source: Finbold Read full article
4. Getting hounded for a debt you don’t owe:
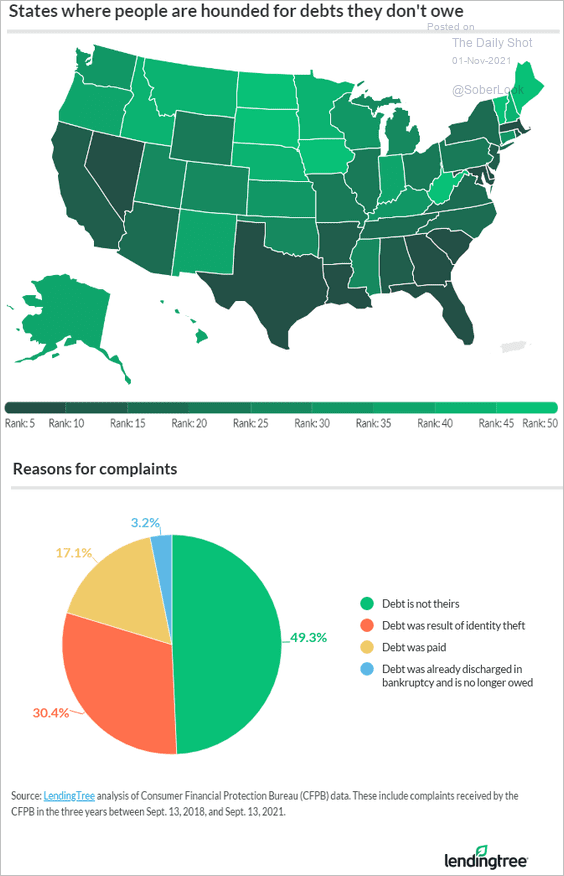 Source: LendingTree Read full article
5. Growth in the number of households over the past decade:
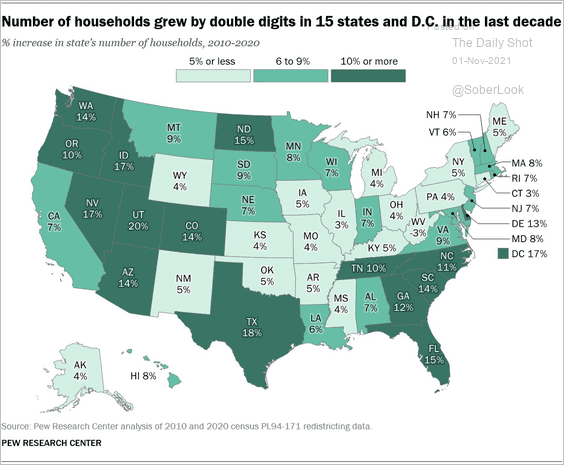 Source: @r_fry1 Read full article
6. “This weekend” or “next weekend”?
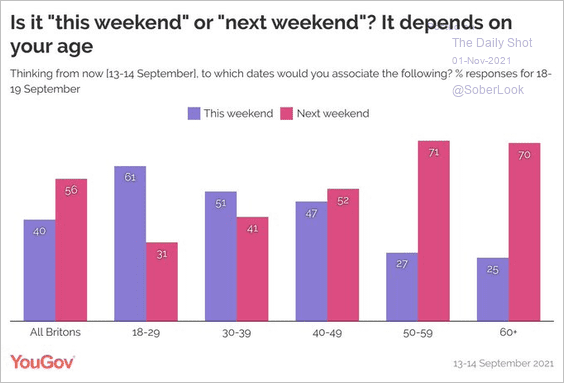 Source: @YouGov Read full article
——————–
Back to Index