
The Daily Shot: 08-Nov-21
• The United States
• Canada
• The Eurozone
• China
• Emerging Markets
• Cryptocurrency
• Commodities
• Energy
• Equities
• Credit
• Rates
• Global Developments
• Food for Thought
The United States
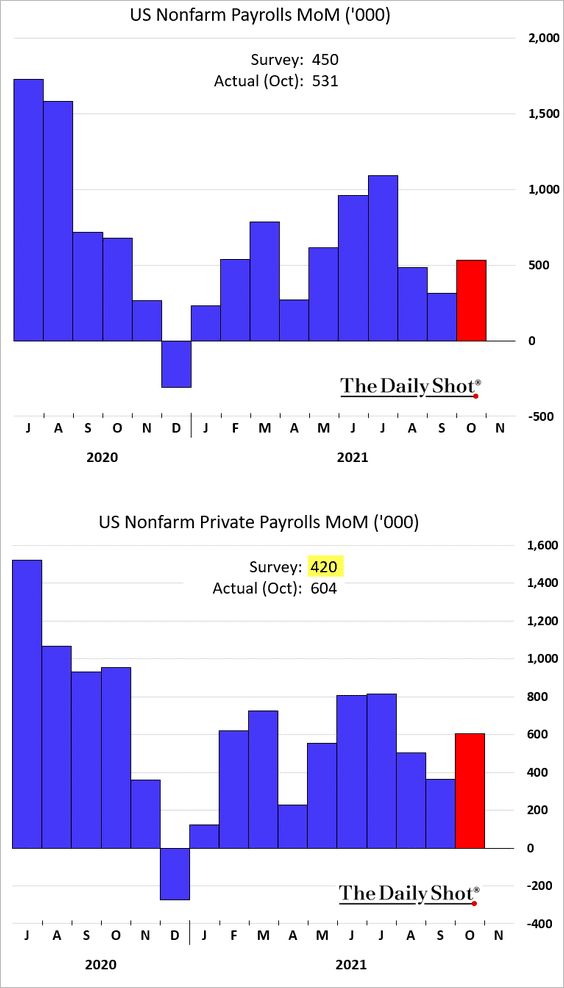
1. The payrolls report surprised to the upside, with over 600k private-sector jobs created in October. Moreover, there was a 235k upward revision to earlier data.
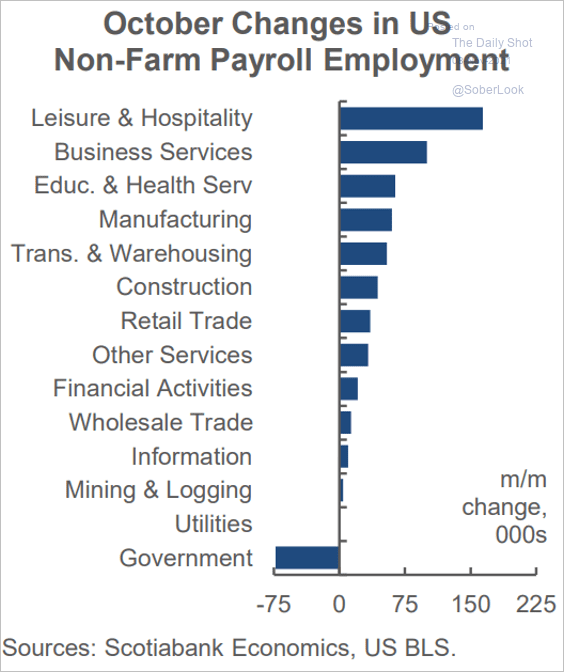
• Here is the breakdown by sector.
 Source: Scotiabank Economics
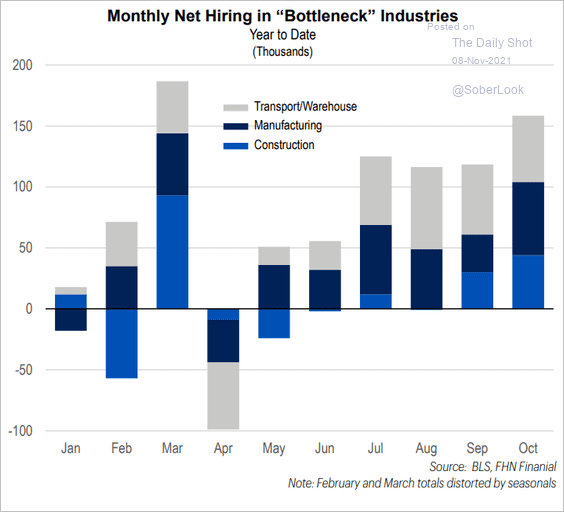
• “Bottleneck” industries saw rapid hiring, …
 Source: FHN Financial
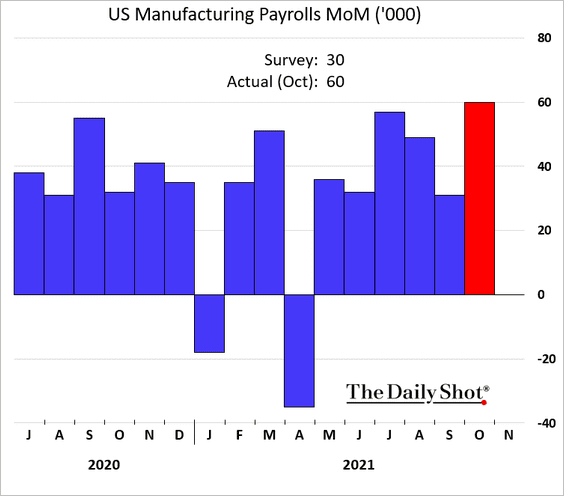
… with manufacturing gains substantially exceeding forecasts.
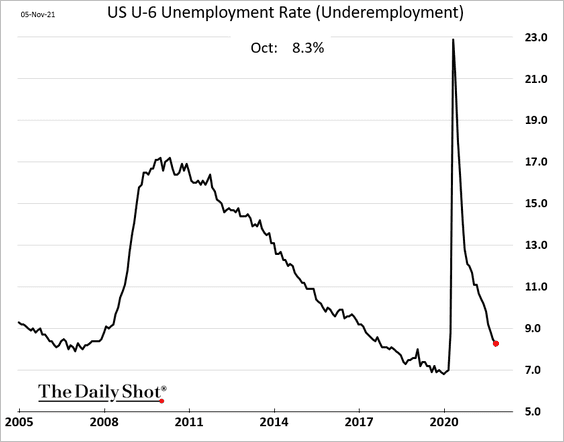
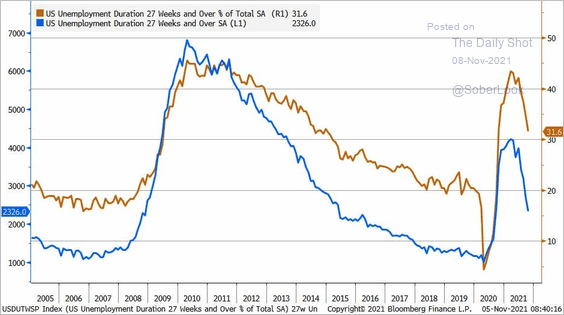
• The unemployment rate continues to trend lower.
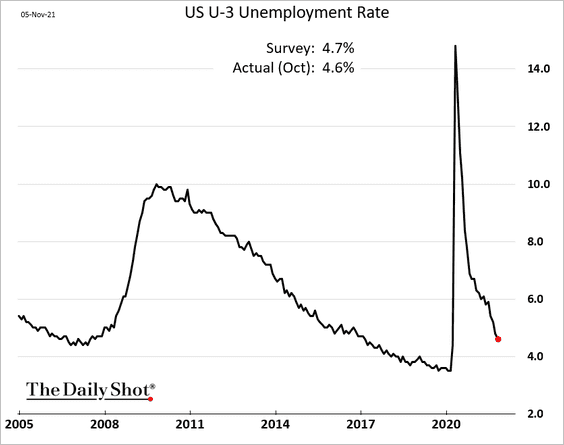
Underemployment and long-term unemployment (2nd chart) also declined.
 Source: @LizAnnSonders
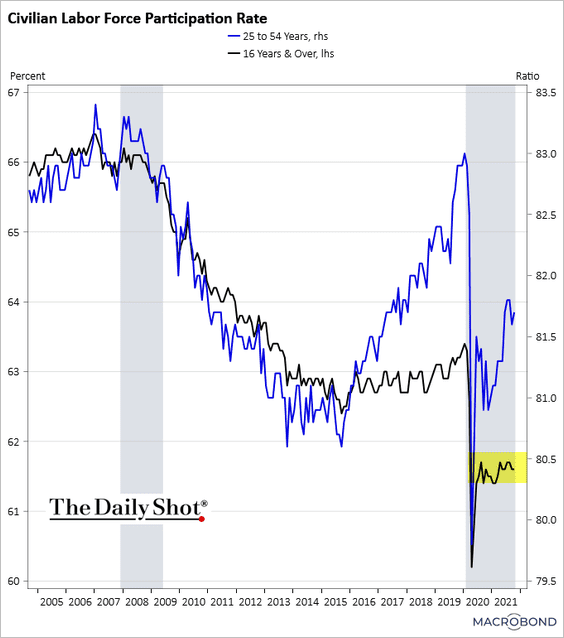
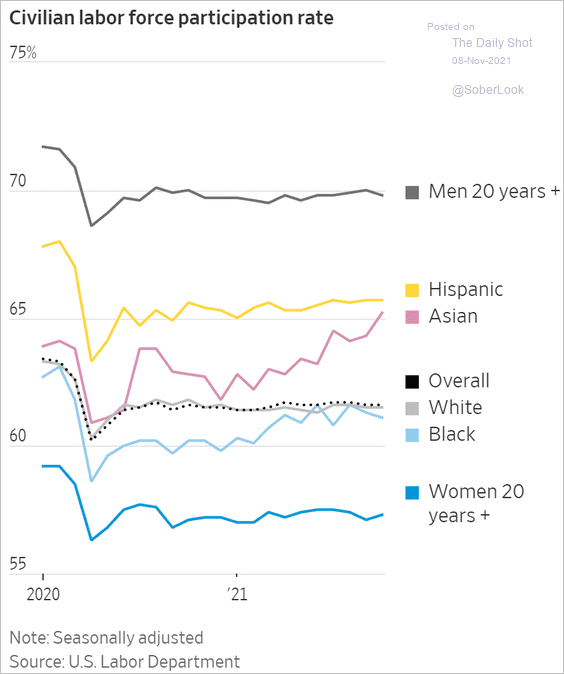
• Labor force participation remains depressed relative to pre-COVID levels.
 Source: Chart and data provided by Macrobond
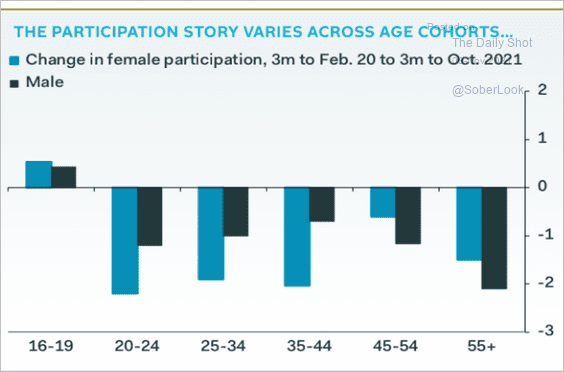
The two charts below show participation trends by demographic cohort.
 Source: @WSJ Read full article
 Source: Pantheon Macroeconomics
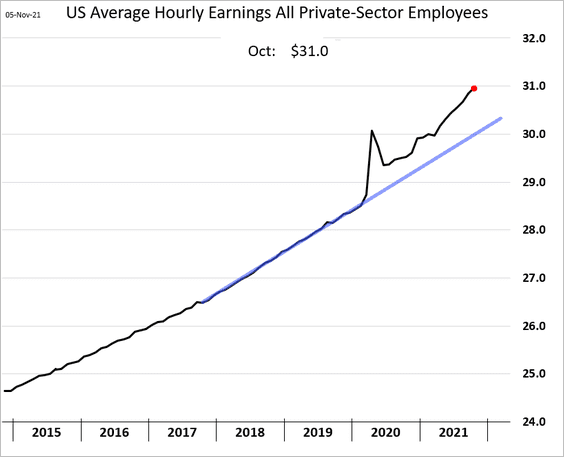
• Wage growth remains well above the pre-pandemic trend.
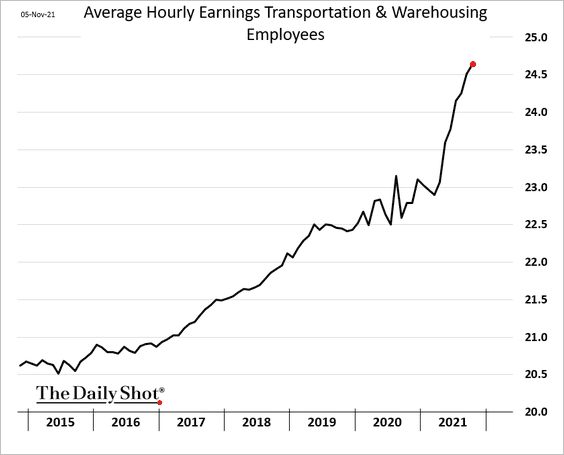
This chart shows average hourly earnings in transportation and warehousing.
• Finally, we have the leaders and laggards compiled by Bloomberg.
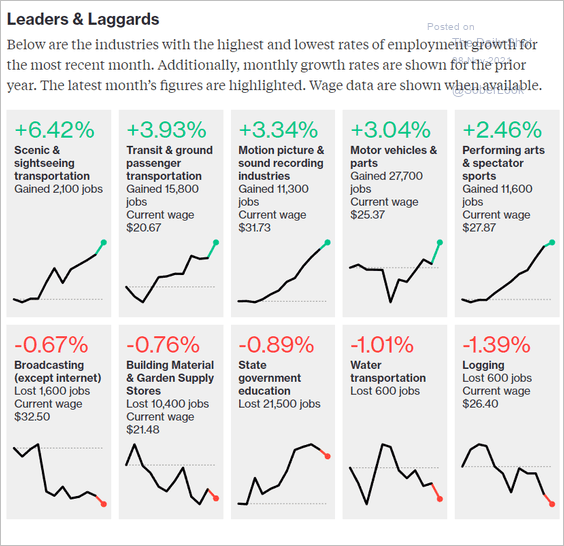 Source: Bloomberg Read full article
——————–
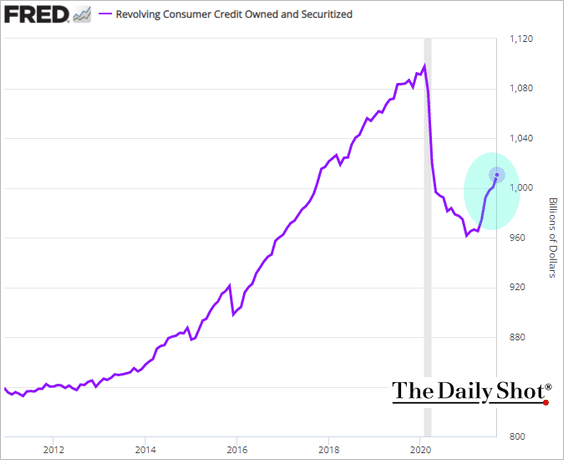
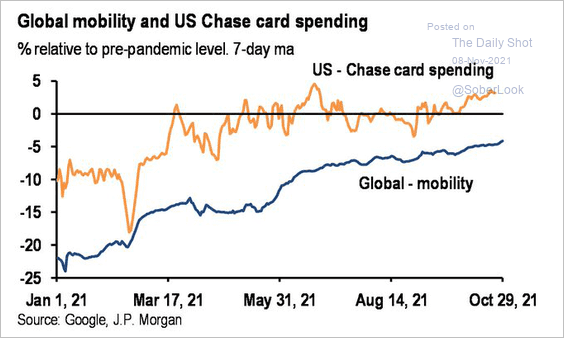
2. Consumer credit has been rebounding as Americans tapped their credit cards. The second chart shows card spending data from Chase.
 Source: JP Morgan; @carlquintanilla
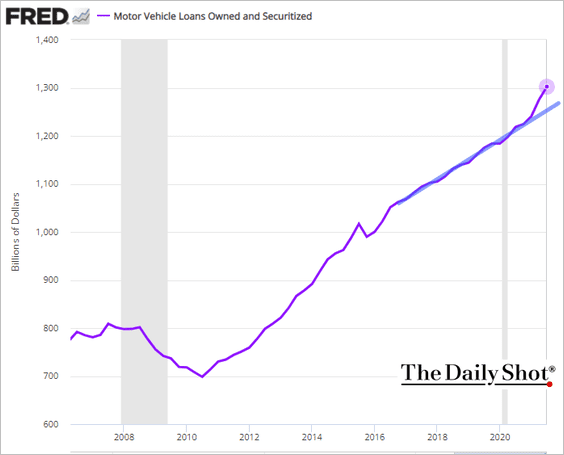
• Despite softer vehicle sales, auto loan growth has been well above the pre-COVID trend.
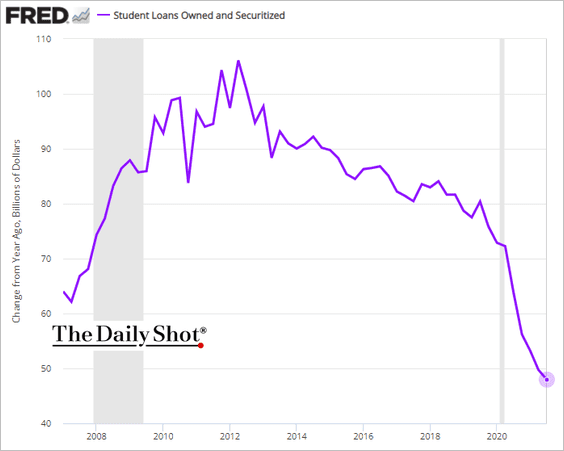
• Growth in student loans continues to slow (the y-axis shows year-over-year changes in loan balances).
——————–
3. Public firms increasingly mention supply and labor issues on earnings calls.
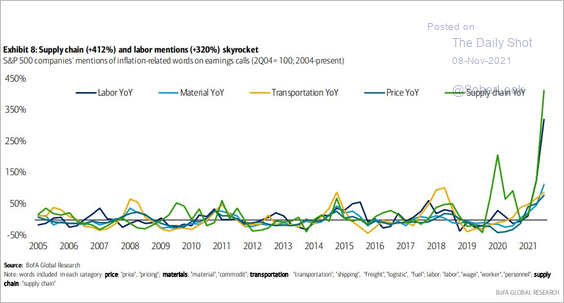 Source: BofA Global Research
When will supply chain issues ease? Here is a survey from Evercore ISI.
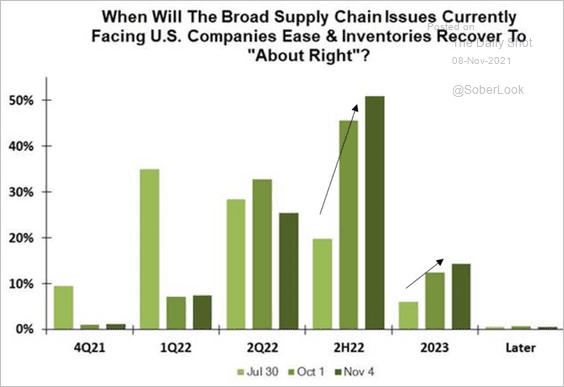 Source: Evercore ISI
——————–
4. US industrial production has room to grow before reaching capacity.
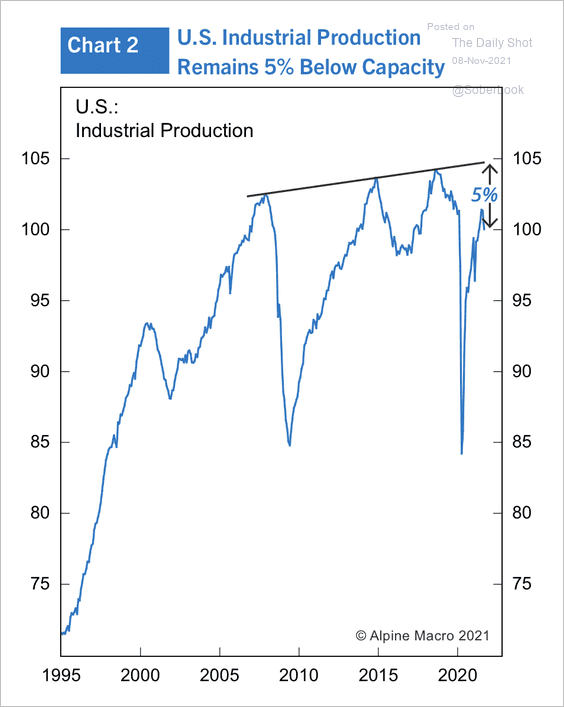 Source: Alpine Macro
5. The Dodge Momentum Index, which tracks planned non-residential construction projects, hit a multi-year high last month.
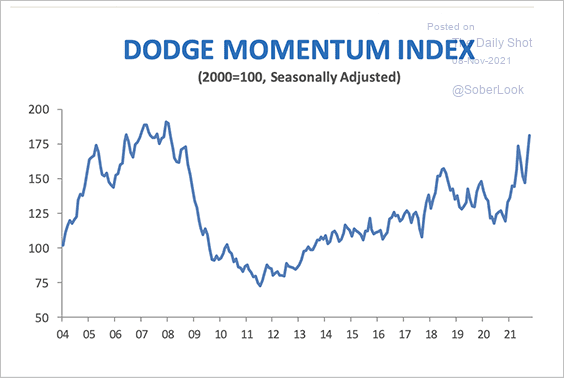 Source: Dodge Construction Network
Warehouse construction is surging.
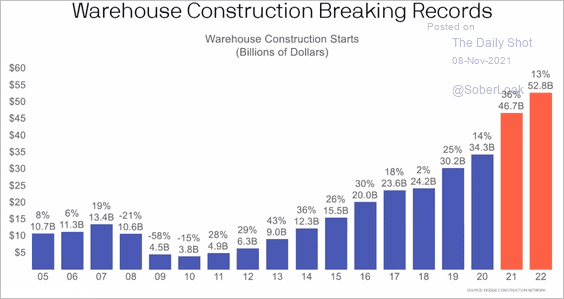 Source: Dodge Construction Network
Back to Index
Canada
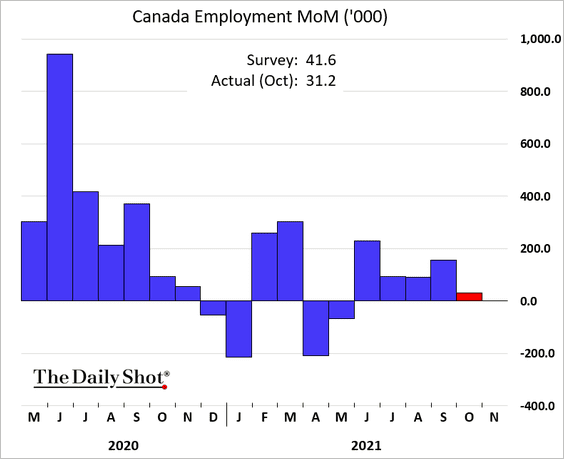
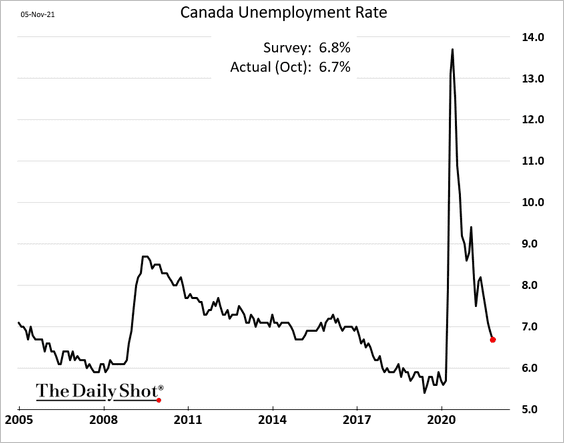
1. The employment report was a bit softer than expected.
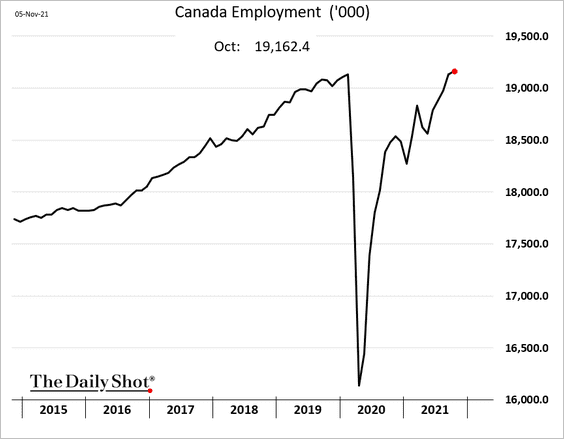
But total employment is now firmly above pre-COVID levels.
The unemployment rate continues to drop.
——————–
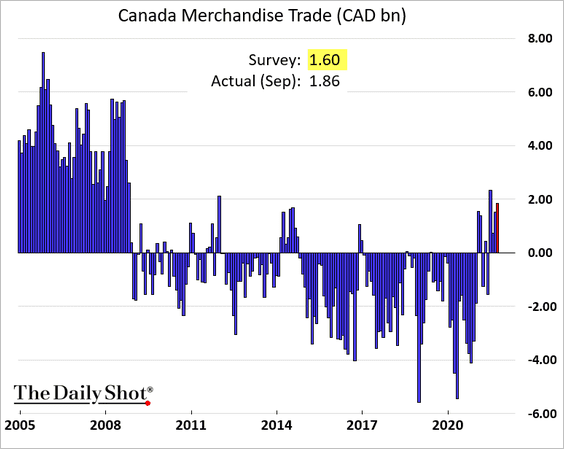
2. Canada’s trade remains in surplus amid robust demand from the US and elevated energy prices.
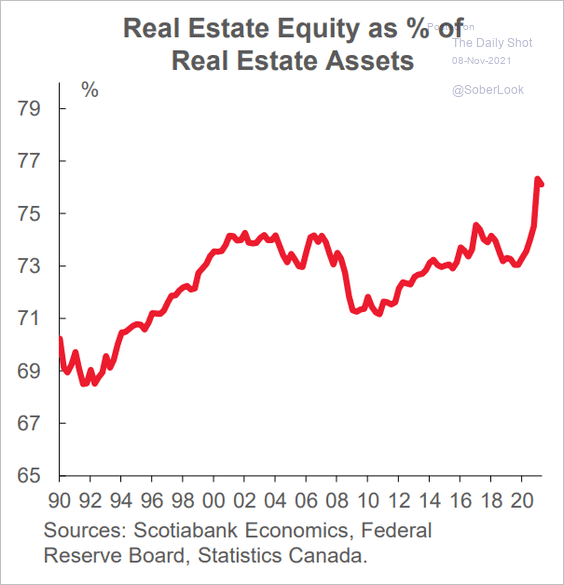
3. Housing equity surged with home prices over the past two years.
 Source: Scotiabank Economics
Back to Index
The Eurozone
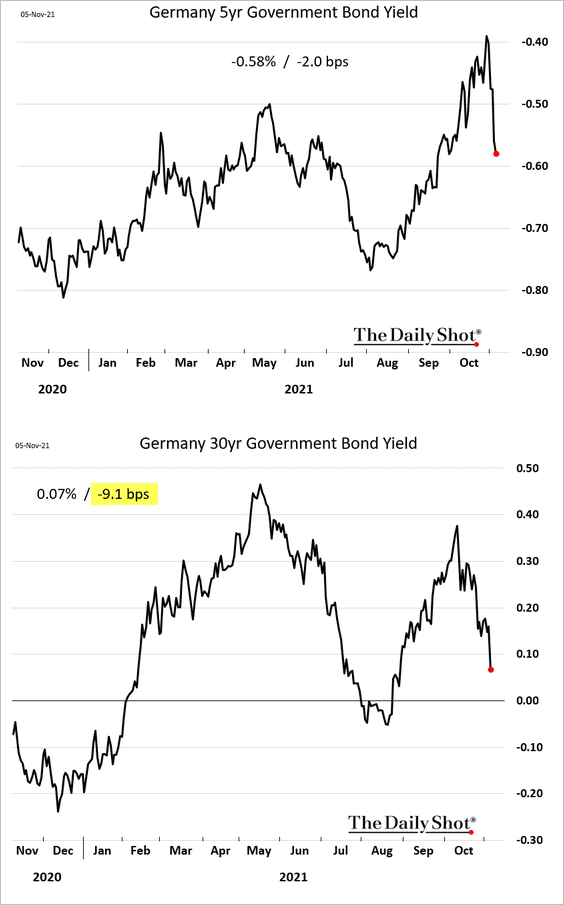
1. Bund yields dipped further on Friday, with the biggest declines in longer maturities.
2. Here are some additional updates on Germany.
• The latest decline in manufacturing output wasn’t just about autos.
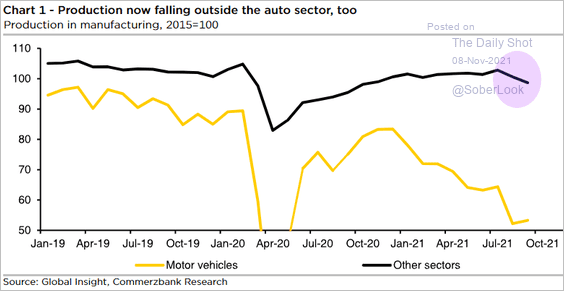 Source: Commerzbank Research
However, truck toll data point to a rebound in October.
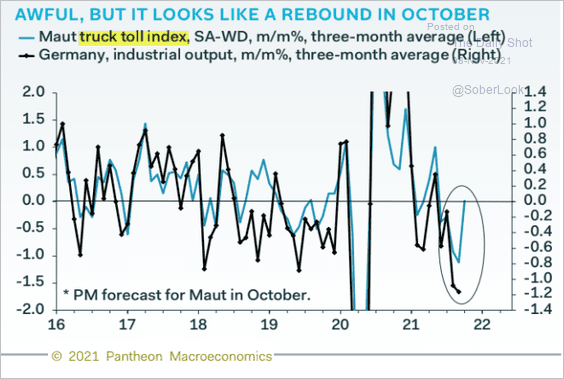 Source: Pantheon Macroeconomics
• This chart shows Germany’s capital account balance and the international investment position.
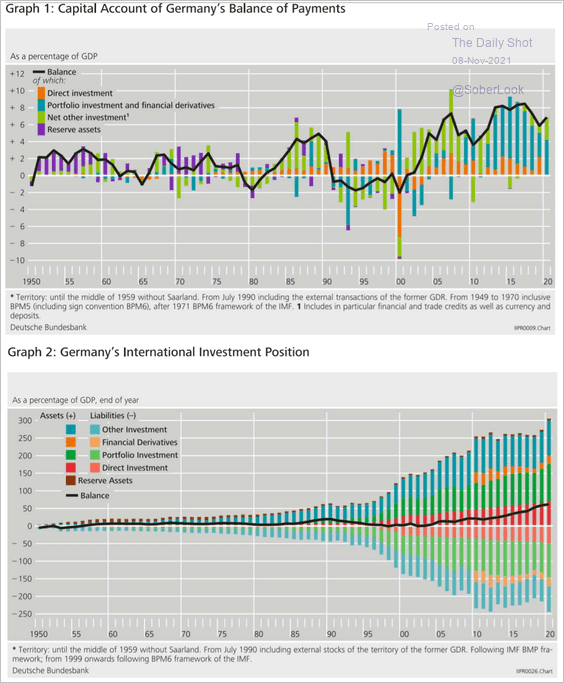 Source: BIS Read full article
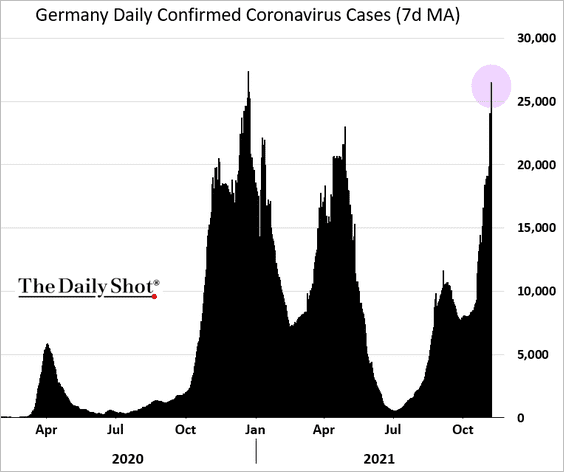
• COVID cases are surging again.
——————–
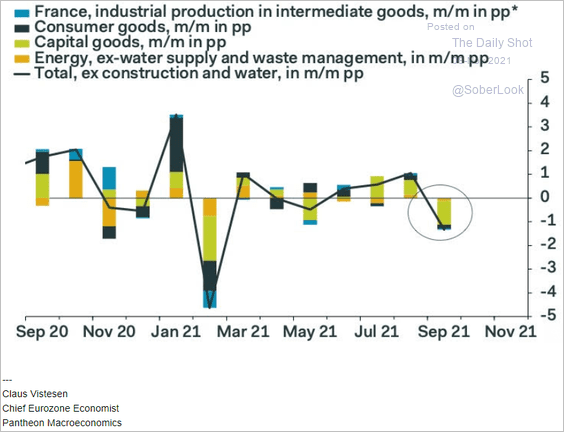
3. French industrial production also declined in September, …
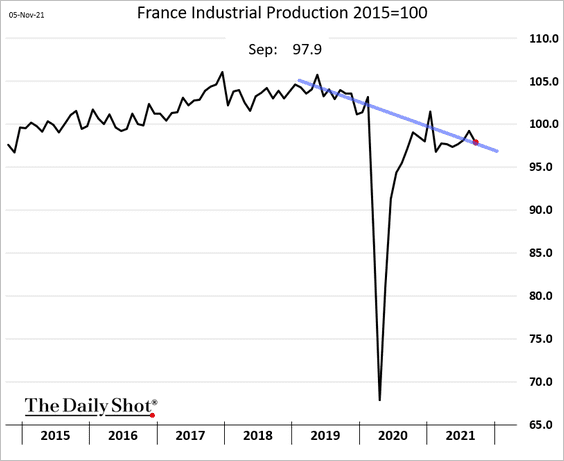
… driven by capital goods.
 Source: Pantheon Macroeconomics
——————–
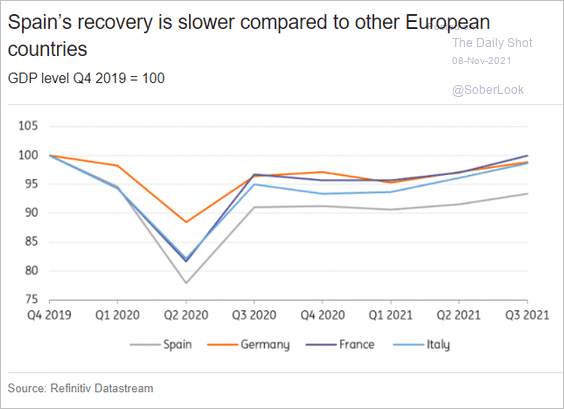
4. Spain’s industrial production has been stable.
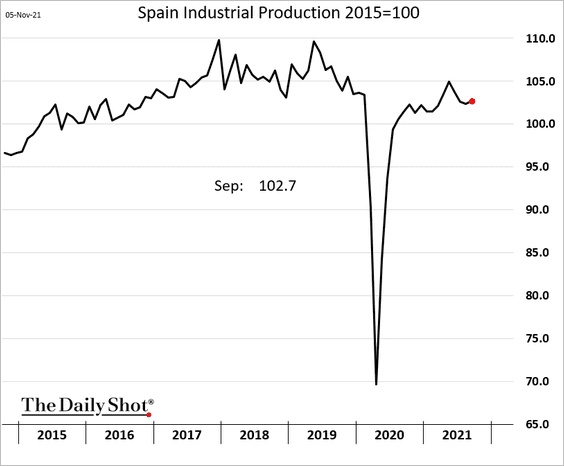
The nation’s economic recovery continues to lag.
 Source: ING
——————–
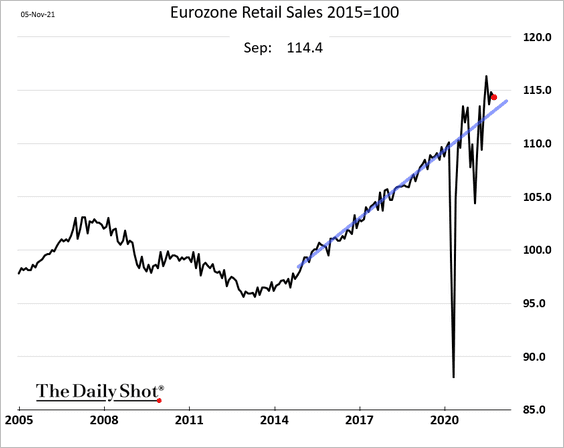
5. Italian retail sales have been steadily climbing.
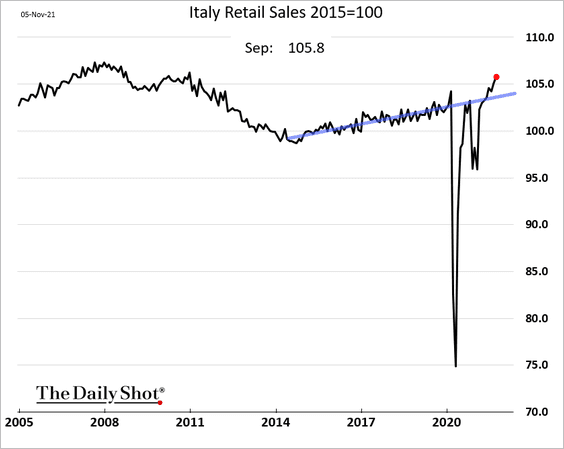
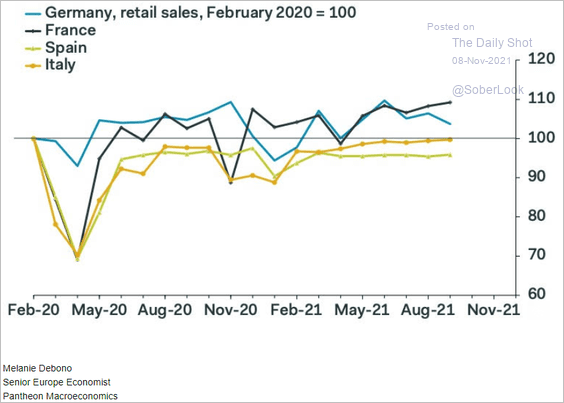
At the Eurozone level, sales declined, driven by weakness in Germany (2nd chart).
 Source: Pantheon Macroeconomics
——————–
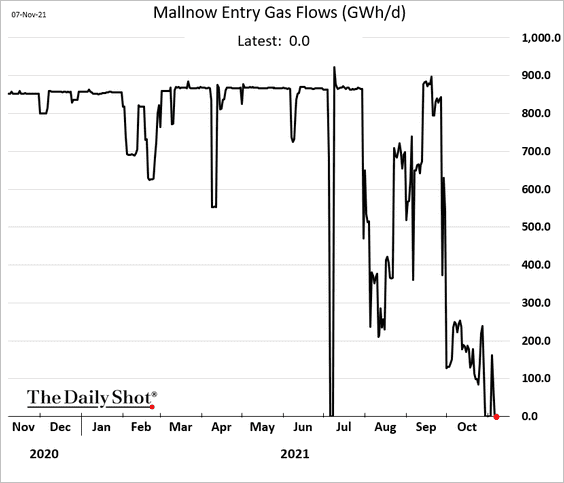
6. At this point, there is no Russian natural gas flowing to Germany via Poland.
By the way, this chart shows euro-area expenditures for natural gas.
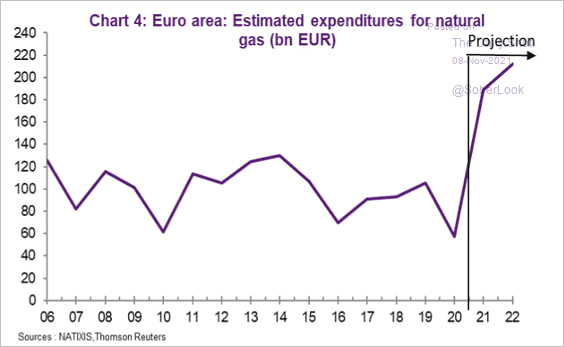 Source: Natixis
Back to Index
China
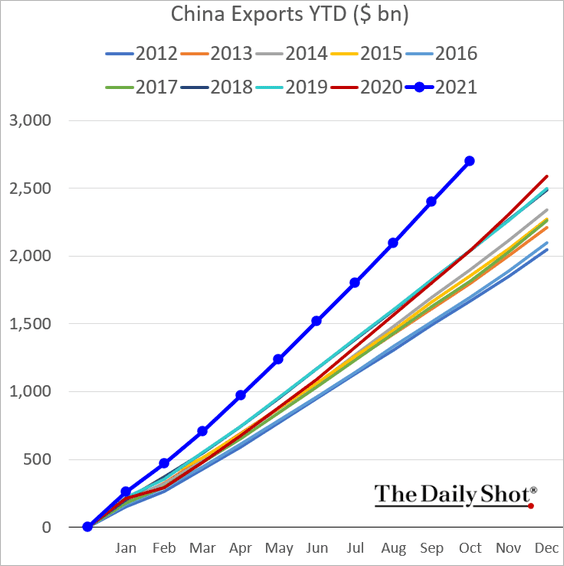
1. China’s trade surplus hit a record high, …
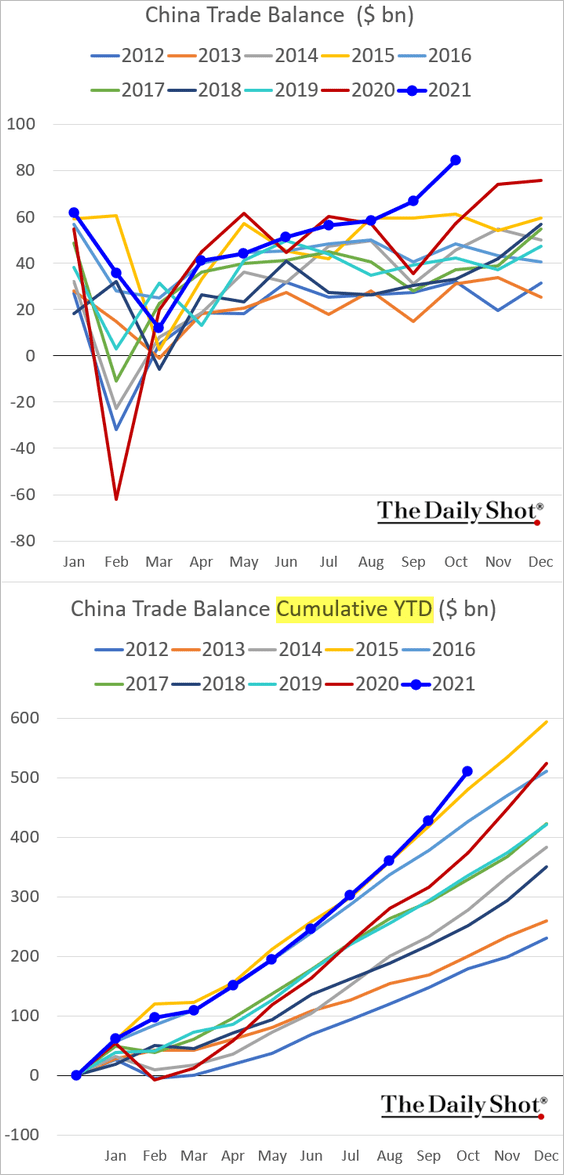
… as exports remain exceptionally strong.
——————–
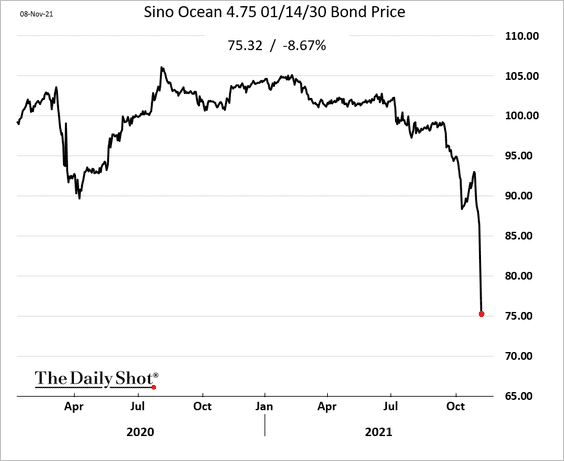
2. Next, we have some updates on the real estate sector.
• The Sino-Ocean Group is rated investment-grade by US agencies. It’s a state-owned enterprise. And yet, the company’s bonds are tumbling.
 Source: @TheTerminal, Bloomberg Finance L.P.
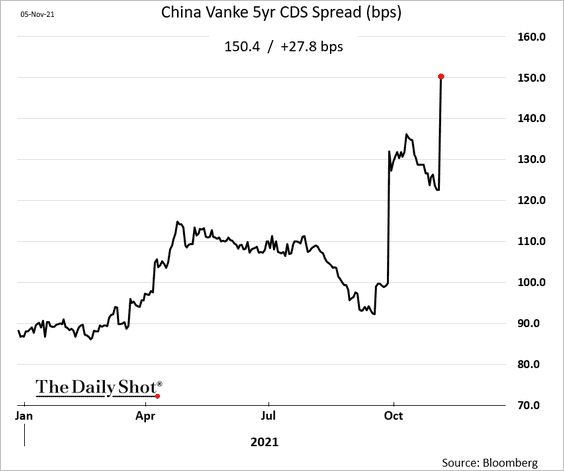
• China Vanke is not leveraged compared to many of its peers. Still, the CDS spread is widening as traders use it to hedge exposure in the sector.
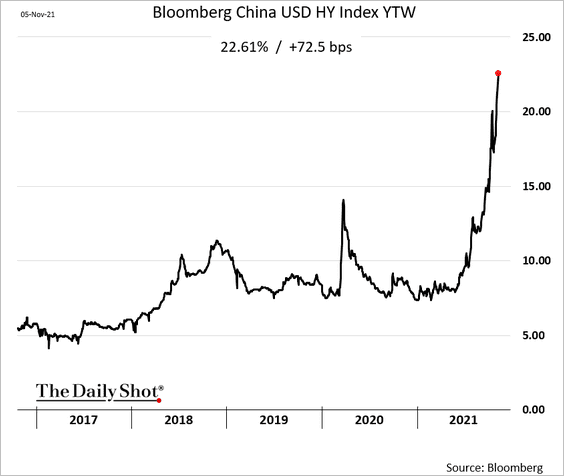
• The overall USD-denominated HY index yield is nearing 23%.
• Property sales have deteriorated.
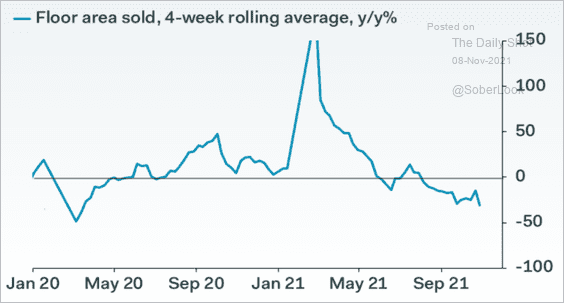 Source: Pantheon Macroeconomics
• Construction slowdown has been a drag on China’s GDP.
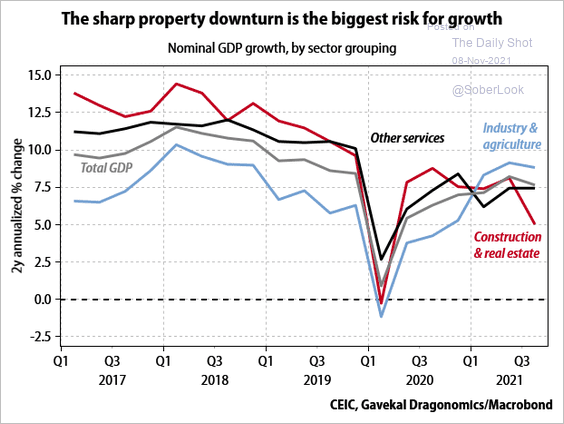 Source: Gavekal Research
——————–
3. Financial/macro conditions have tightened.
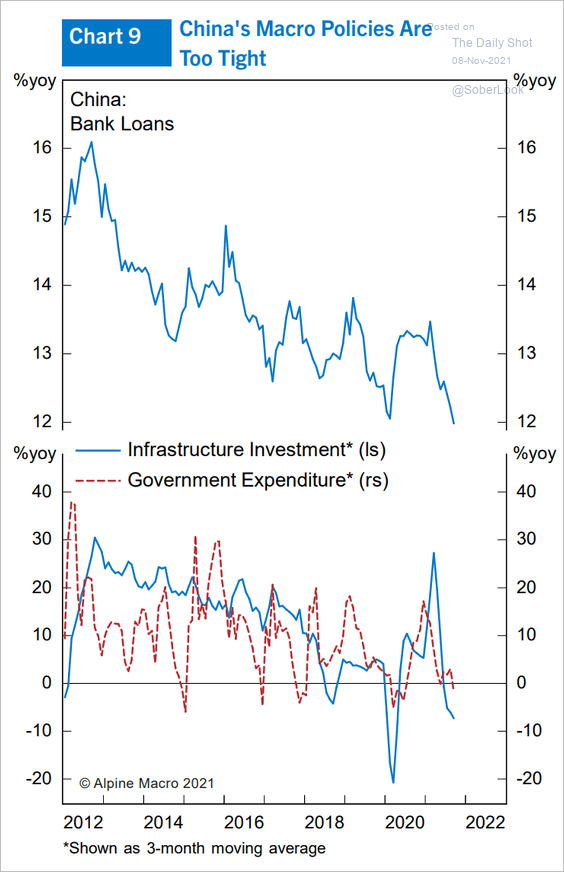 Source: Alpine Macro
4. China’s household wealth exploded over the past 20-30 years.
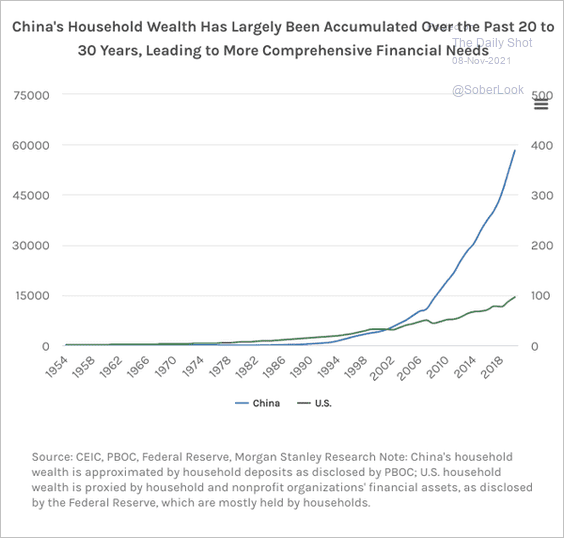 Source: @acemaxx, @MorganStanley
Back to Index
Emerging Markets
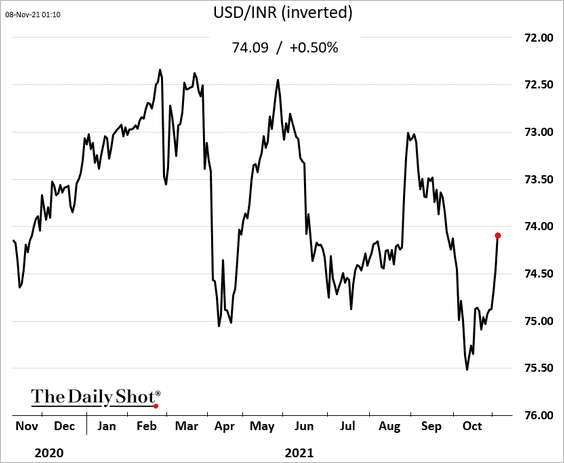
1. The Indian rupee is rebounding.
2. The top four countries comprise 74% of the MSCI EM Index. And they are all net commodity and energy importers (a drag on performance in the current environment).
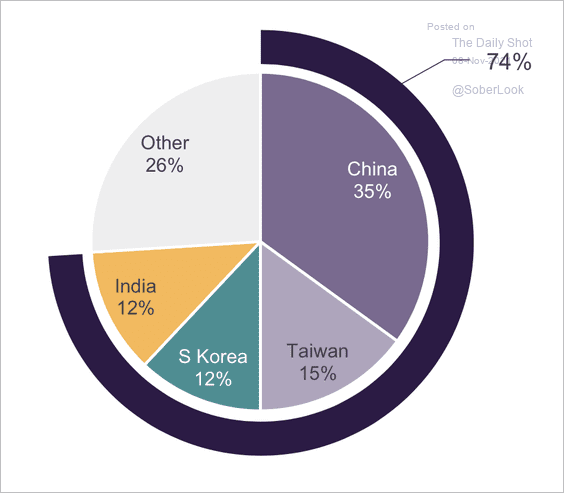 Source: Truist Advisory Services
3. EM bonds have been less responsive to global factors this year compared to the 2013-14 taper tantrum (2 charts).
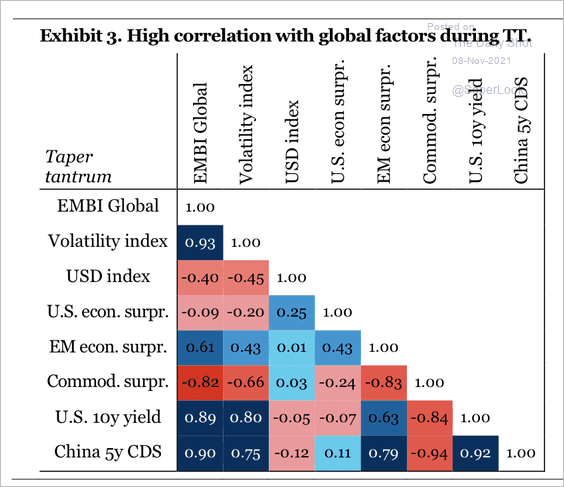 Source: IIF
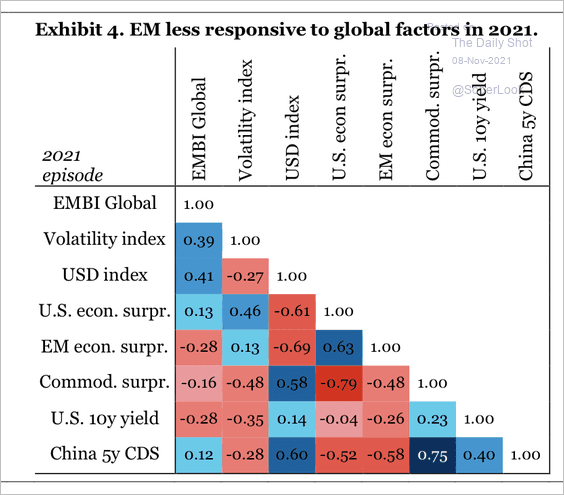 Source: IIF
Back to Index
Cryptocurrency
1. Cryptos are surging today, …
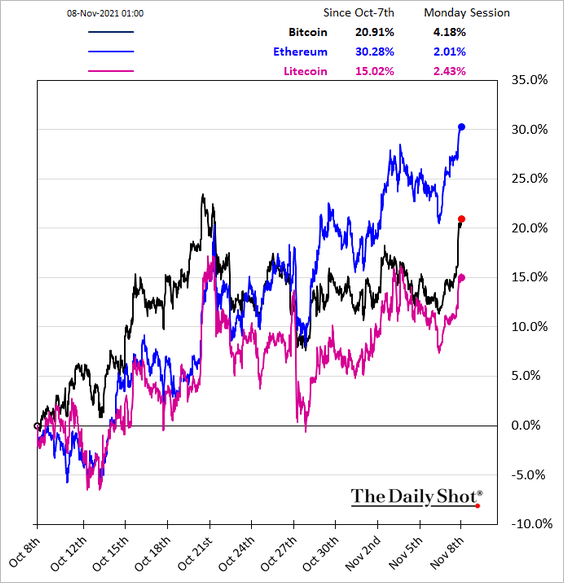
… as ether hits another record high.
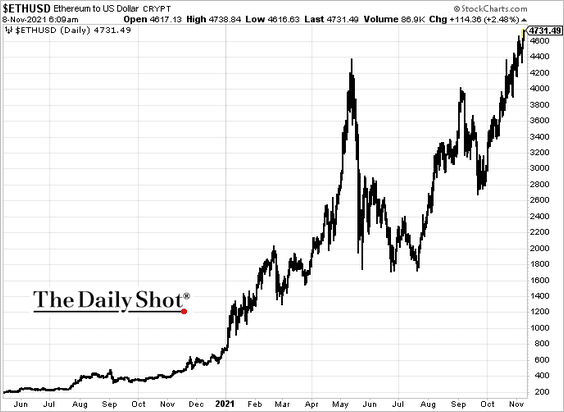
 Source: Reuters Read full article
——————–
2. The total crypto market value is now above $2.5 trillion.
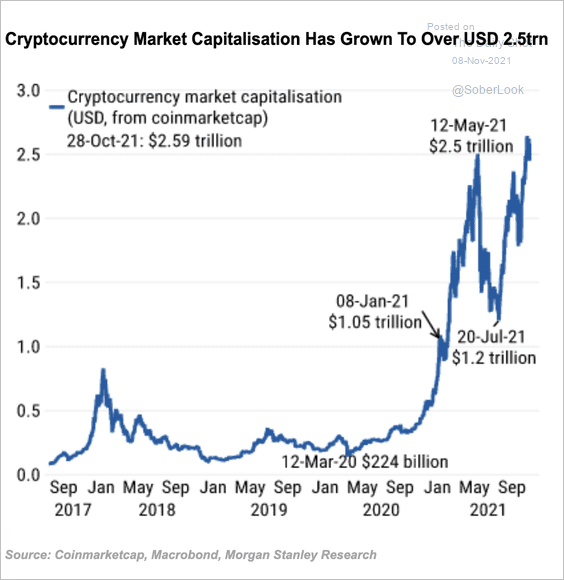 Source: @acemaxx, @MorganStanley
3. Bitcoin’s average funding rate, or the cost of holding long positions in the perpetual futures market, remained slightly positive over the past week. This reflects bullish sentiment among traders.
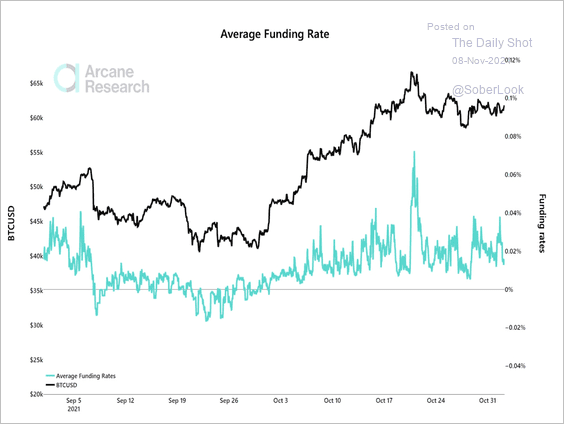 Source: Arcane Research Read full article
4. Bitcoin’s options volume relative to spot volumes has stayed in a range of 30% to 50% since June. Ether’s options market appears to have more modest ranges.
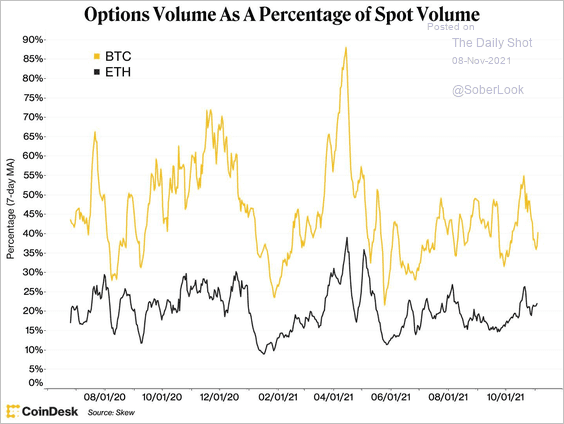 Source: CoinDesk Read full article
5. Bitcoin’s correlation with the S&P 500 continued to rise over the past month, while the cryptocurrency’s correlation with long-term Treasury debt has declined.
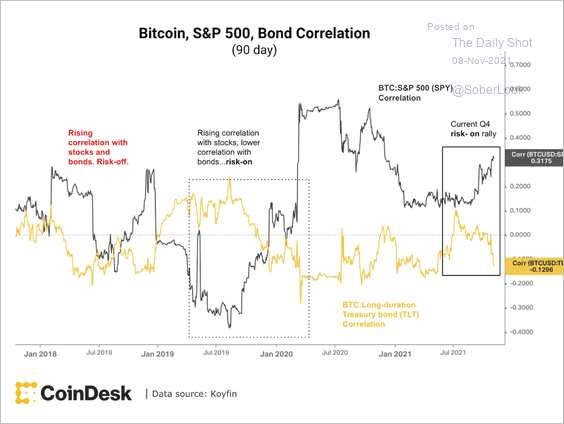 Source: CoinDesk Read full article
Back to Index
Commodities
Here are some updates on gold.
• Gold jumped last week as the Fed and the BoE ended up being more dovish than expected.
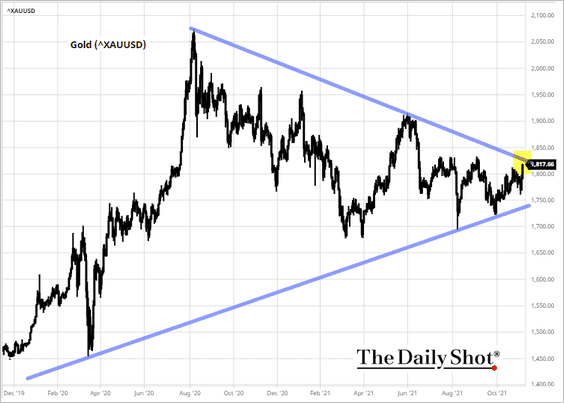
 Source: Reuters Read full article
• Gold sentiment has been bearish over the past year.
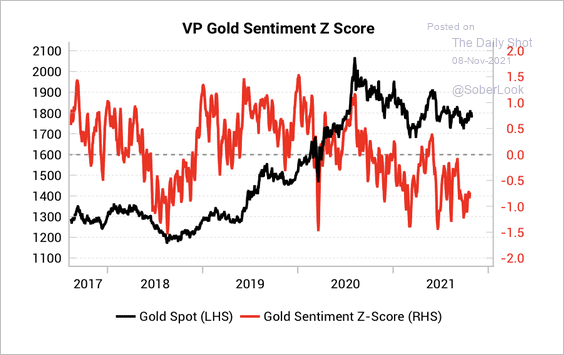 Source: Variant Perception
• CTA’s are very short gold, similar to levels seen before gold’s short-squeeze at the start of 2020.
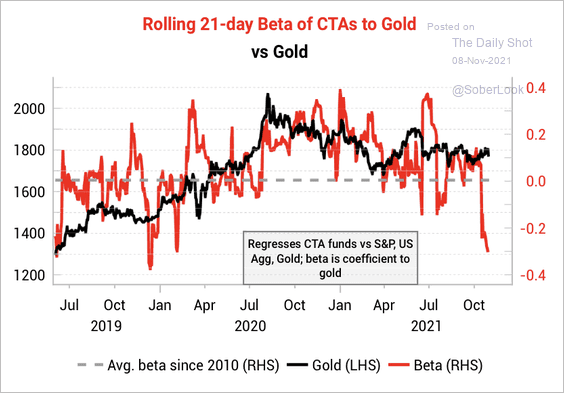 Source: Variant Perception
• Gold is entering a seasonally positive period, particularly in January.
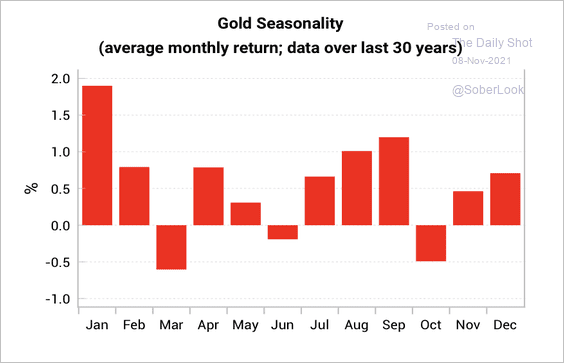 Source: Variant Perception
Back to Index
Energy
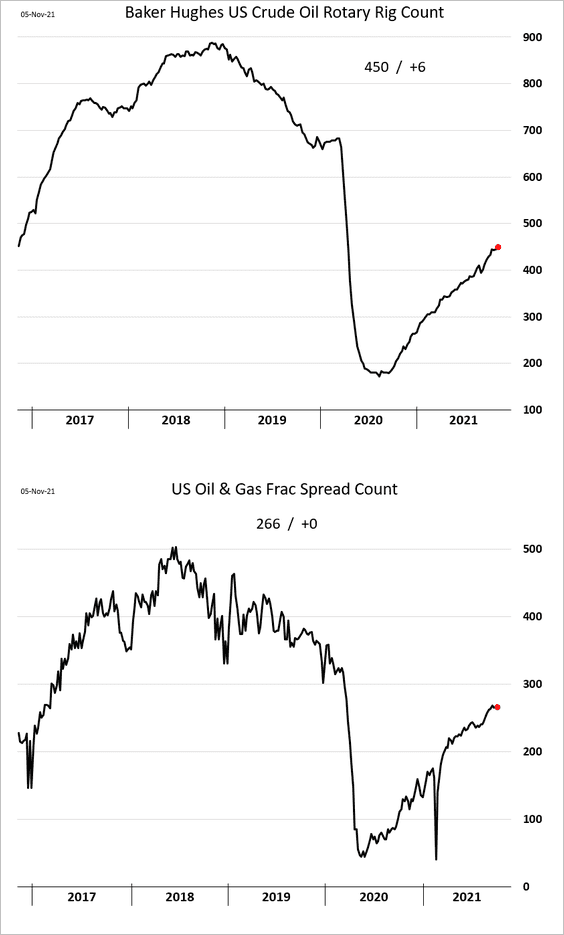
1. US rigs increased last week, but the frac spread count was flat.
2. DUC inventories continue to dwindle.
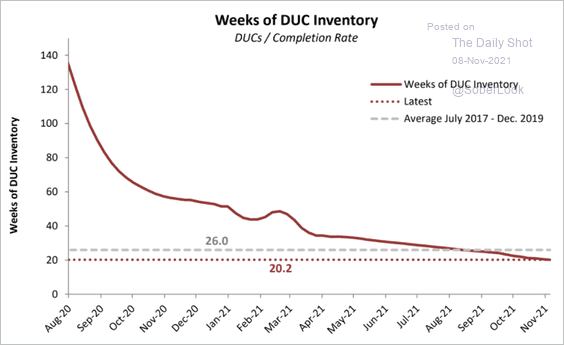 Source: Princeton Energy Advisors
3. OECD crude oil inventories are expected to keep tightening going into the year-end.
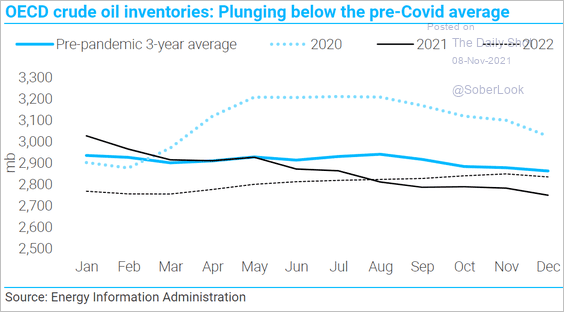 Source: TS Lombard
4. Additional Canada-US pipeline capacity should reduce oil shipped by rail.
 Source: EIA Read full article
5. Here is an illustration of global LNG flows.
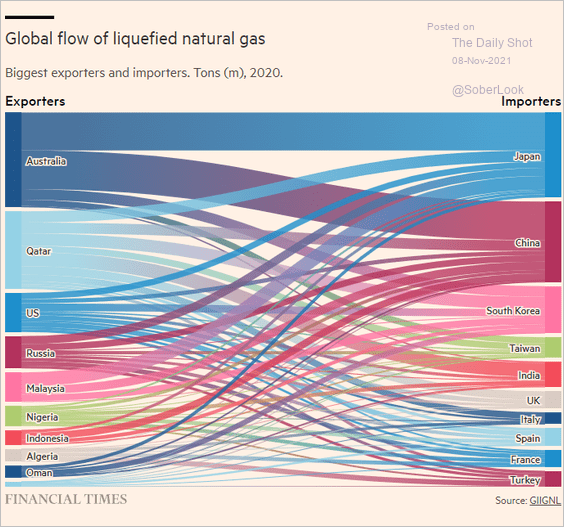 Source: @financialtimes Read full article
Back to Index
Equities
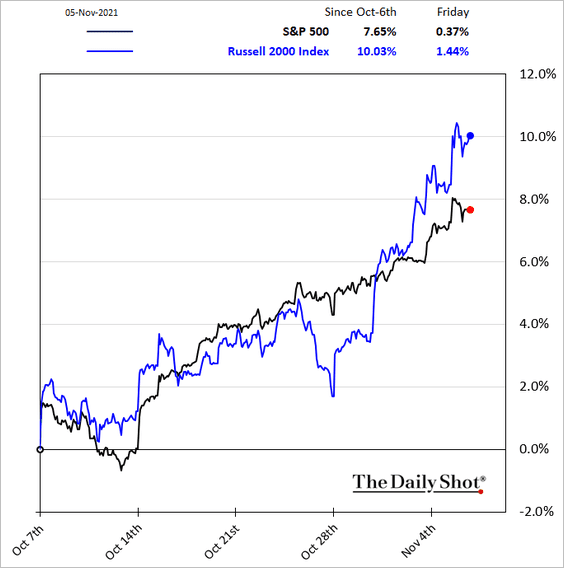
1. Small caps continue to outperform.
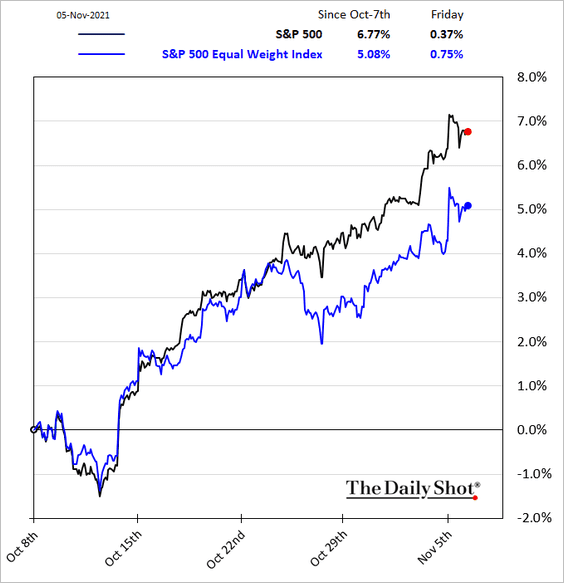
• However, the equal-weight index is still lagging.
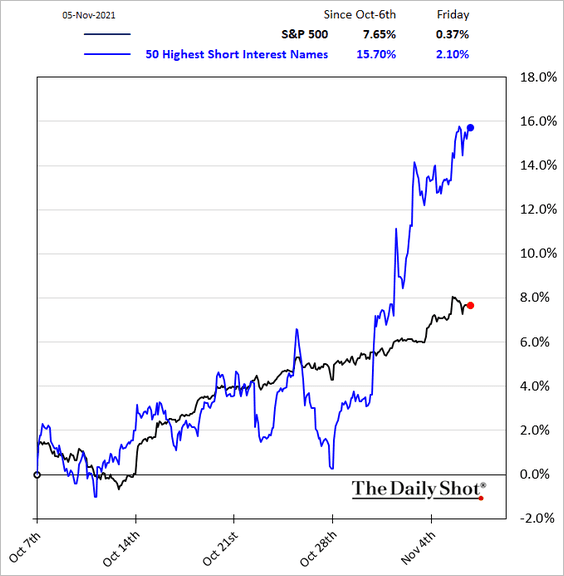
• Some of the small-cap gains have been driven by short-covering.
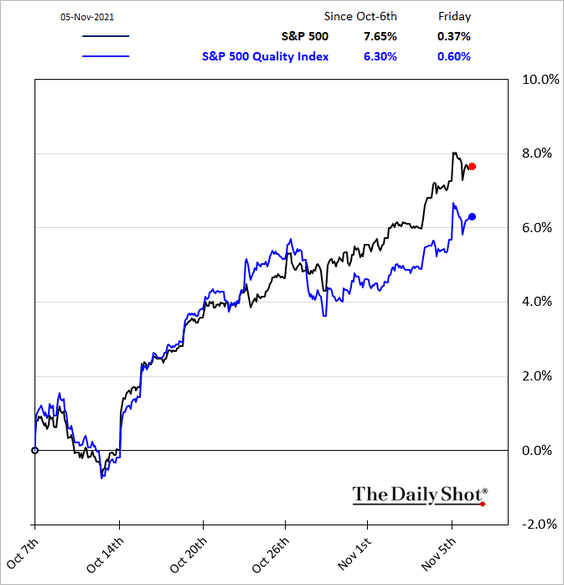
2. The S&P 500 quality factor has been underperforming (similar pattern to the equal-weight index above).
3. The Nasdaq 100 forward price-to-sales ratio hit a new high.
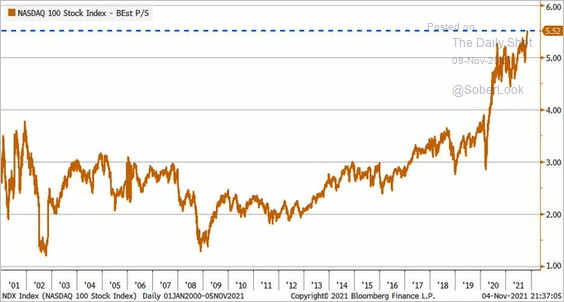 Source: @LizAnnSonders
Here is a long-term chart of S&P 500 price-to-sales stats.
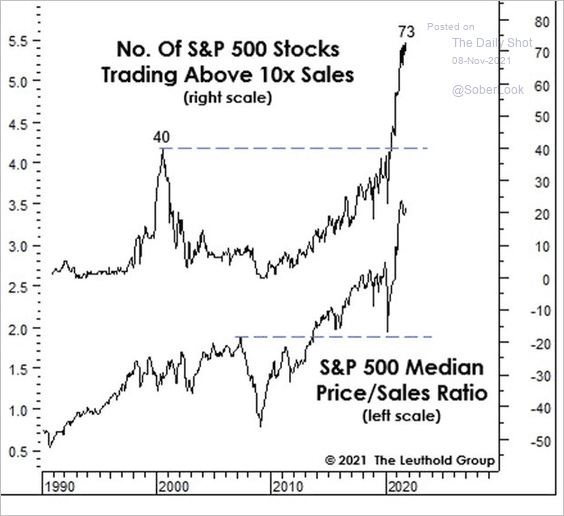 Source: @MebFaber, @LeutholdGroup
——————–
4. CNN’s Fear & Greed index is now deep in greed territory.
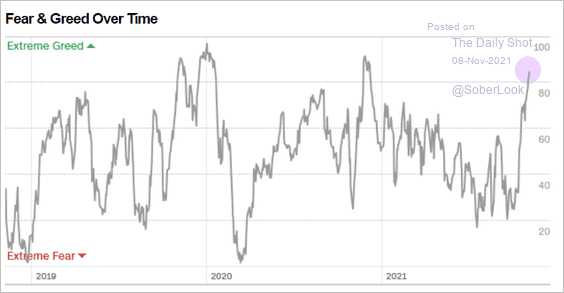 Source: CNN Business
5. Share buyback activity exceeded $1 trillion year-to-date.
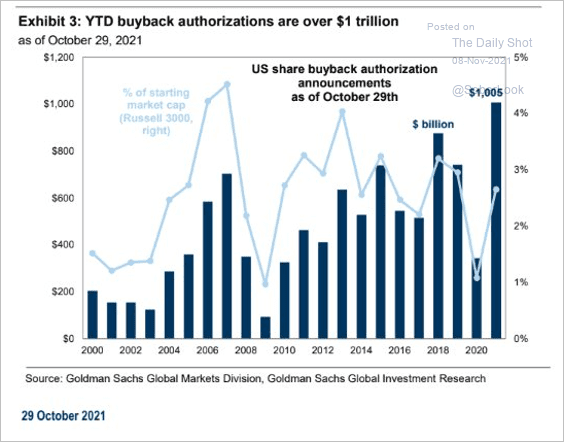 Source: Goldman Sachs
6. How did the S&P 500 perform 12 months before and after the Fed’s first rate hike?
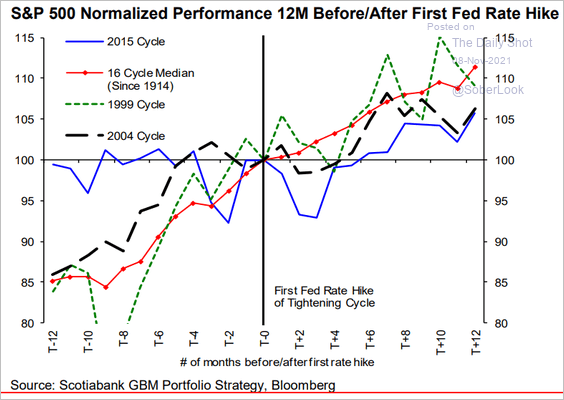 Source: Hugo Ste-Marie, Portfolio & Quantitative Strategy Global Equity Research, Scotia Capital
7. Stock investors are increasingly concerned about inflation, according to a survey from Evercore ISI.
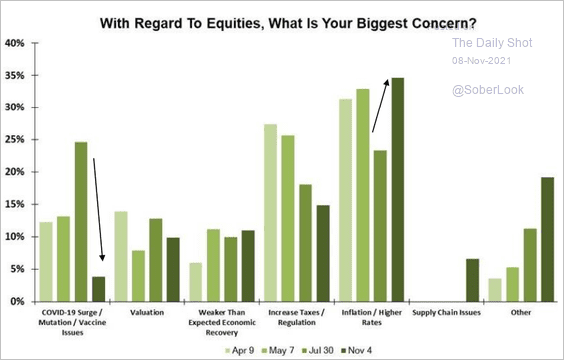 Source: Evercore ISI
8. Options activity is surging. With all the gamma exposure in the market, the downward gap isn’t going to be pretty.
• Total call option volume:
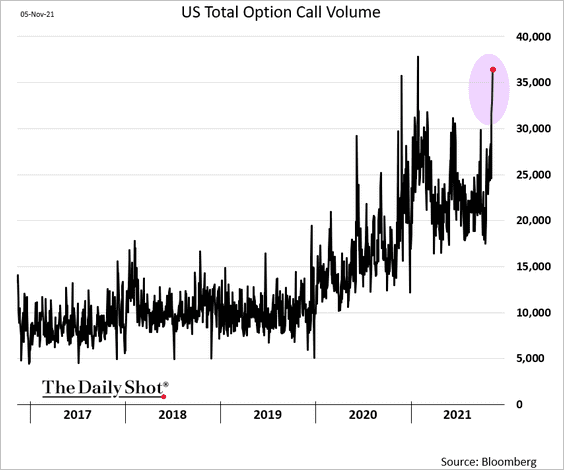
• The daily notional value of all single-stock options trades:
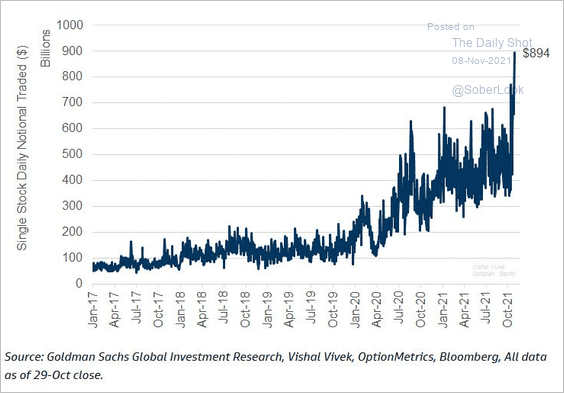 Source: Goldman Sachs; @MichaelGoodwell
——————–
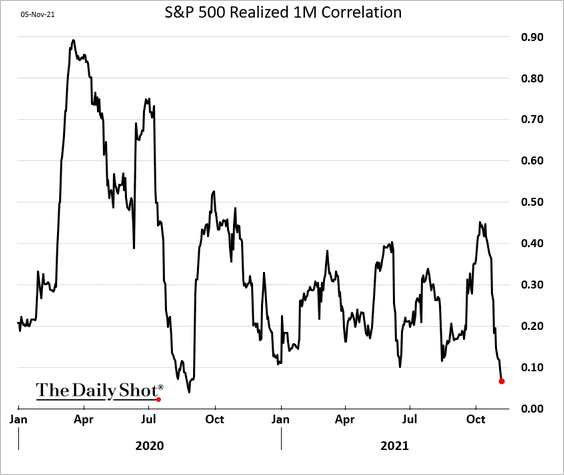
9. Realized S&P 500 correlation continues to tumble.
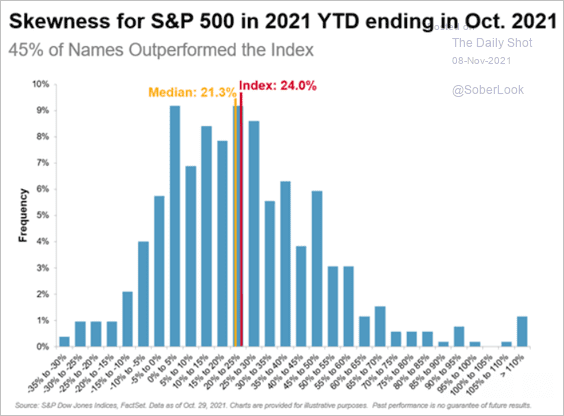
10. Finally, here is the year-to-date performance distribution of all the S&P 500 members.
 Source: S&P Global Market Intelligence
Back to Index
Credit
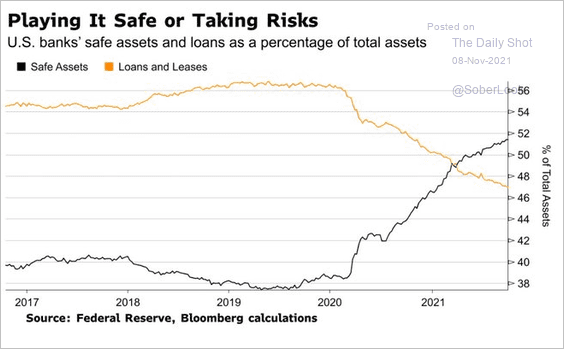
1. With banks’ balance sheets increasingly dominated by reserves and Treasuries/MBS, loan growth has been slow.
 Source: @lisaabramowicz1, @EDexheimer, @theterminal
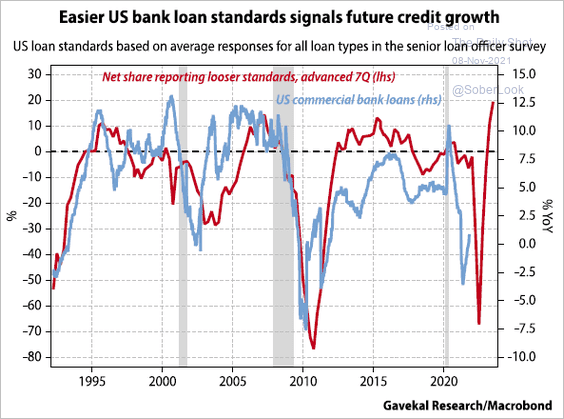
But easy credit standards point to improvements in bank lending.
 Source: Gavekal Research
——————–
2. Capital markets have been happy to provide credit where banks did not.
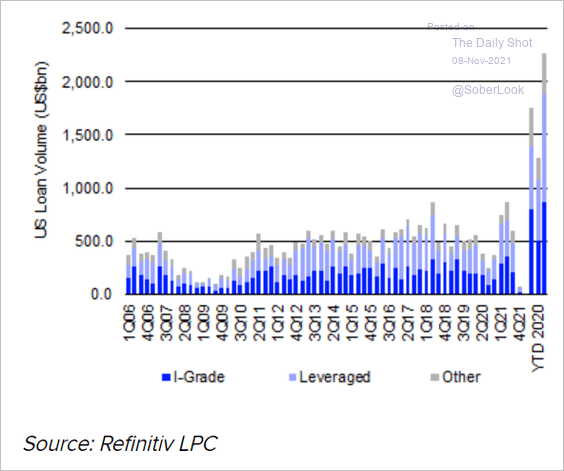 Source: @LPCLoans Read full article
3. Corporate debt issuance in Europe has been robust.
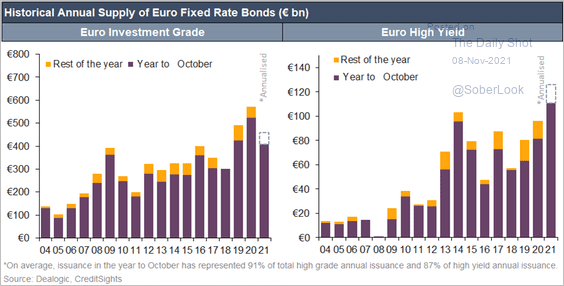 Source: CreditSights
4. US high-yield interest coverage has surged and is now back above pre-pandemic levels.
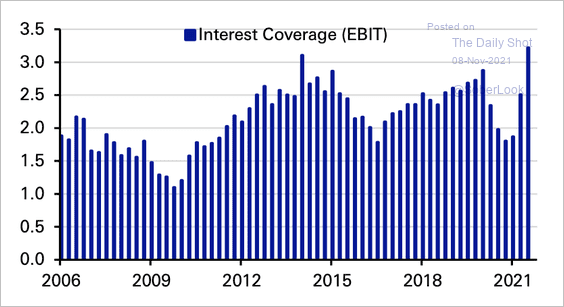 Source: Deutsche Bank Research
Leverage remains elevated among US high-yield issuers.
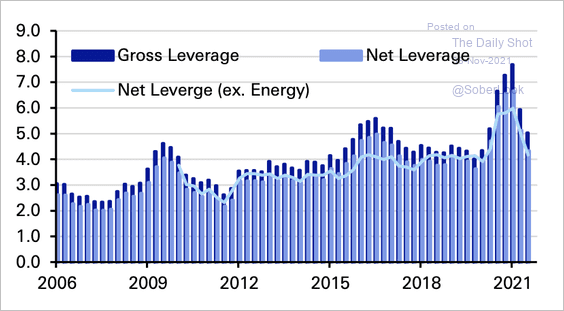 Source: Deutsche Bank Research
——————–
5. A record number of companies issues US HY debt for the first time.
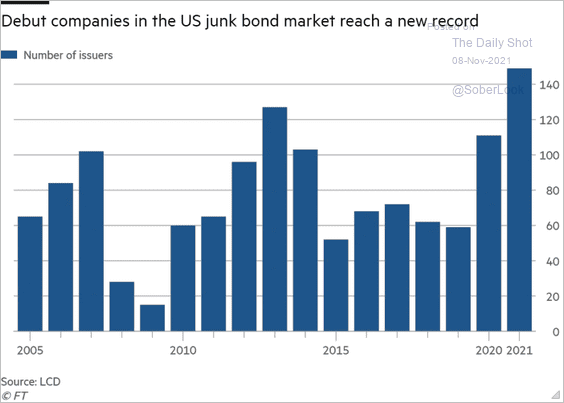 Source: @financialtimes Read full article
Back to Index
Rates
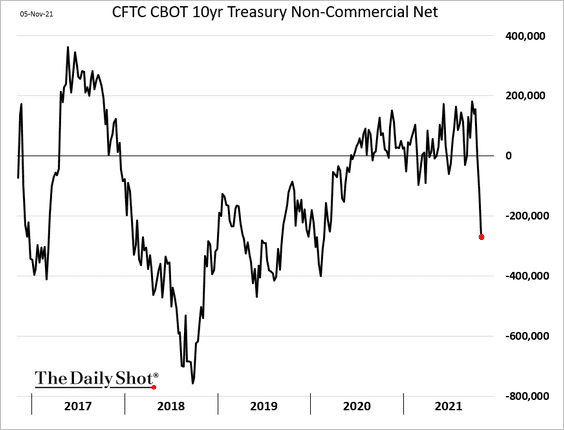
1. Speculative accounts have rapidly reversed their views on longer-dated Treasuries.
2. 2-7 year Treasury auctions saw the largest increase during the pandemic.
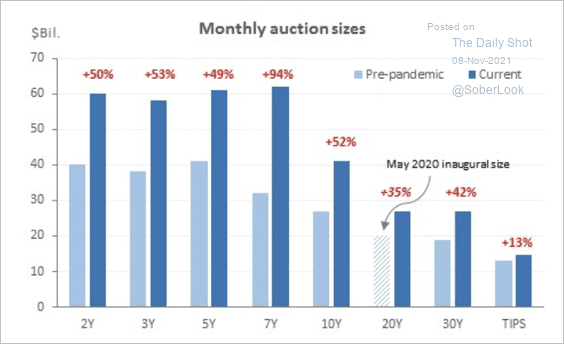 Source: Deutsche Bank Research
• 7-year and 20-year auctions have been comparatively weaker in the last year.
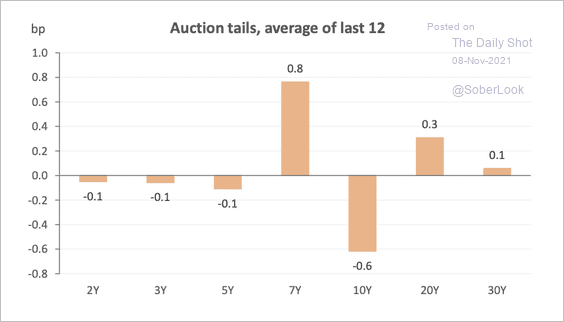 Source: Deutsche Bank Research
• Treasury bill supply is expected to rise sharply over the next two months under Deutsche Bank’s baseline forecast.
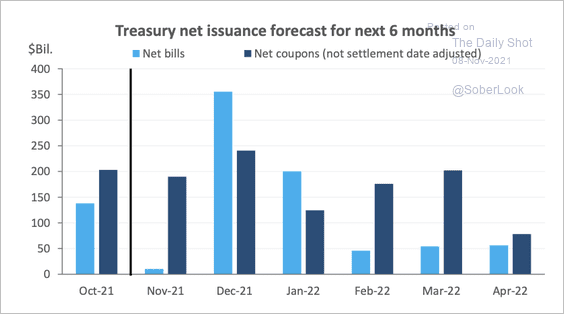 Source: Deutsche Bank Research
——————–
3. Treasury borrowing next year is expected to be higher than previously forecast because of the debt ceiling.
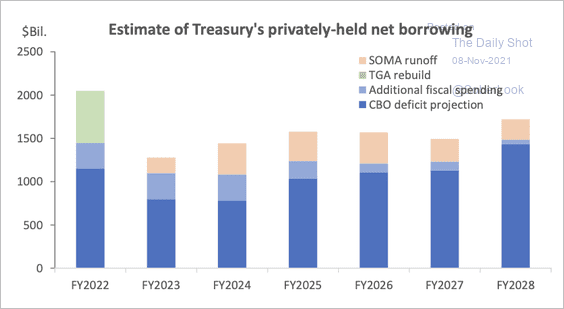 Source: Deutsche Bank Research
4. Liquidity in the 2yr US and German debt futures has deteriorated amid increased volatility.
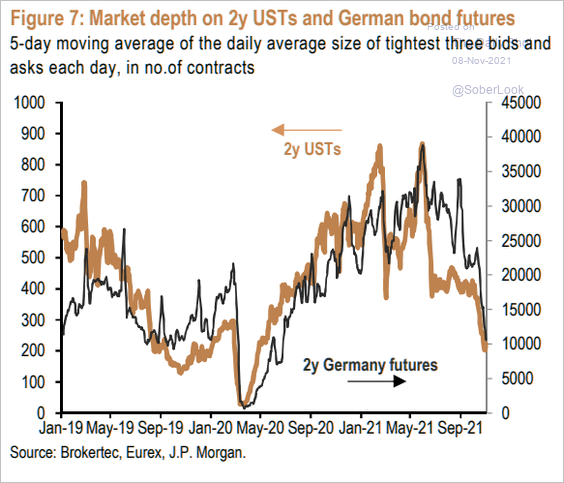 Source: JP Morgan Research; @themarketear
5. More flattening ahead for Treasuries?
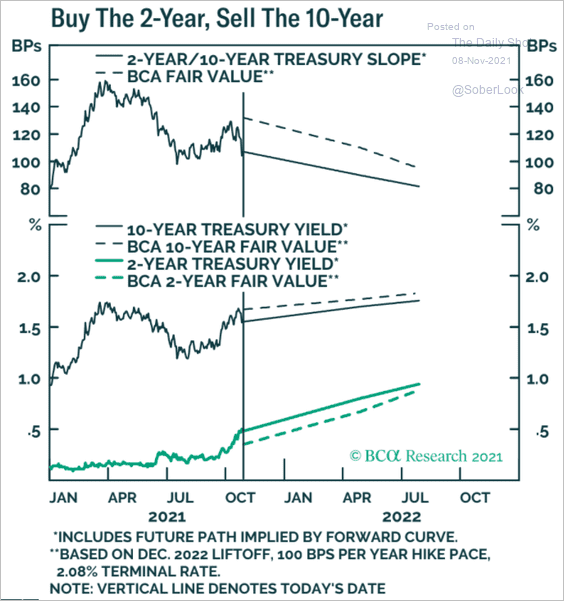 Source: BCA Research
6. Could a higher US working-age population boost real yields?
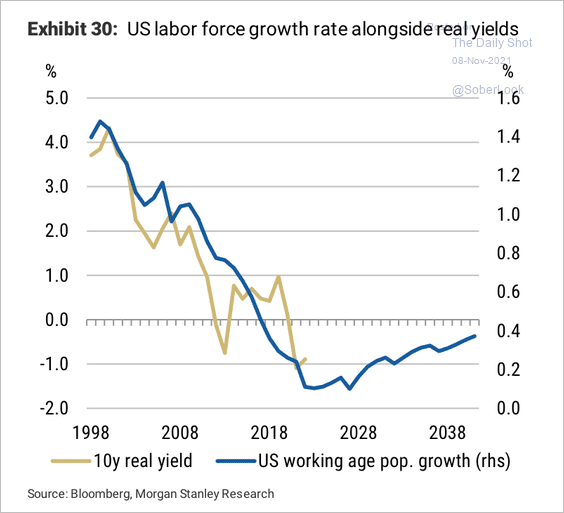 Source: Variant Perception
Back to Index
Global Developments
1. QE programs have been a tailwind for property prices.
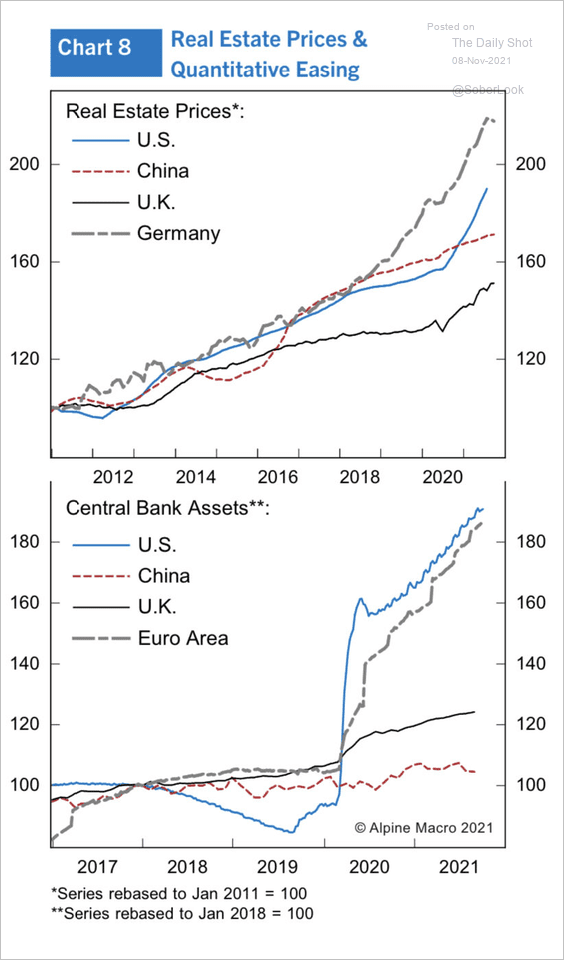 Source: Alpine Macro
2. The recovery in world trade has been faster than expected.
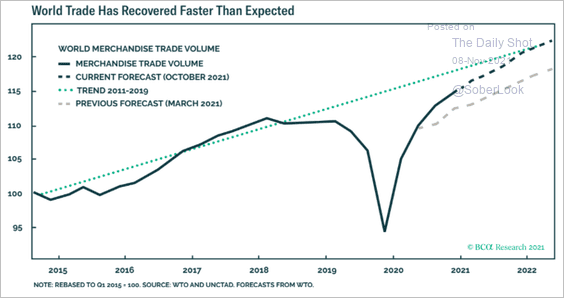 Source: BCA Research
3. Who are the relative winners and losers of higher energy prices.
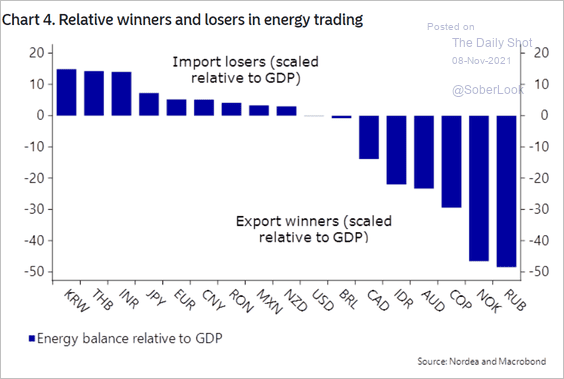 Source: Nordea Markets
4. A new Covid variant emerging remains the top concern among businesses surveyed by Fitch.
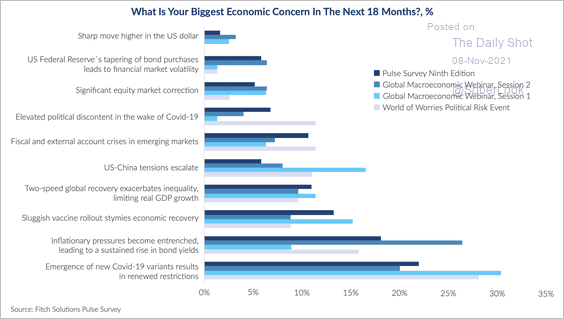 Source: Fitch Solutions Macro Research
5. Deleveraging has been a drag on growth for much of the post-financial crisis recovery, but this has now ended.
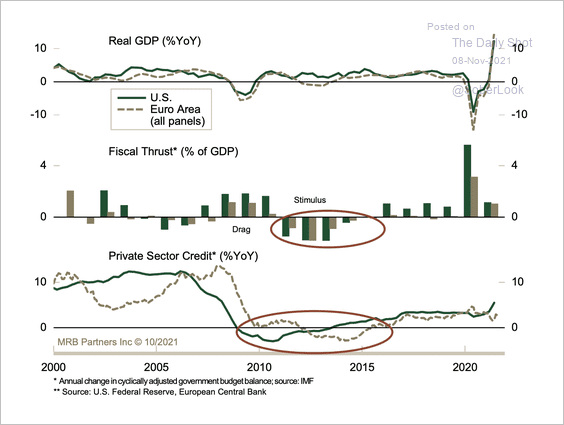 Source: MRB Partners
6. Finally, we have the distribution of global consumption growth.
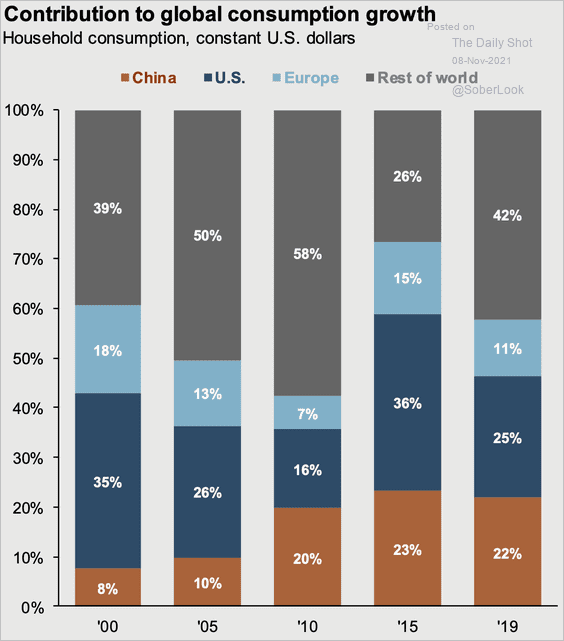 Source: J.P. Morgan Asset Management
——————–
Food for Thought
1. Monthly payments per recipient via US federal programs:
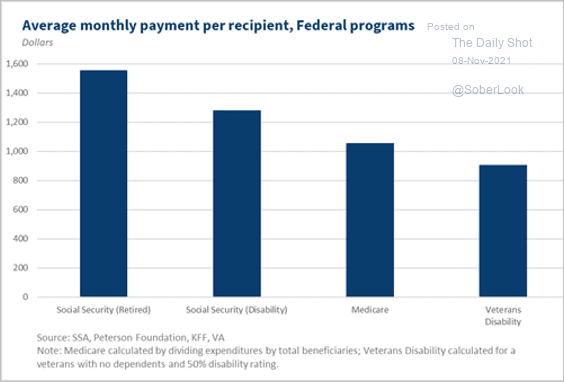 Source: The White House Read full article
2. US political ideology map:
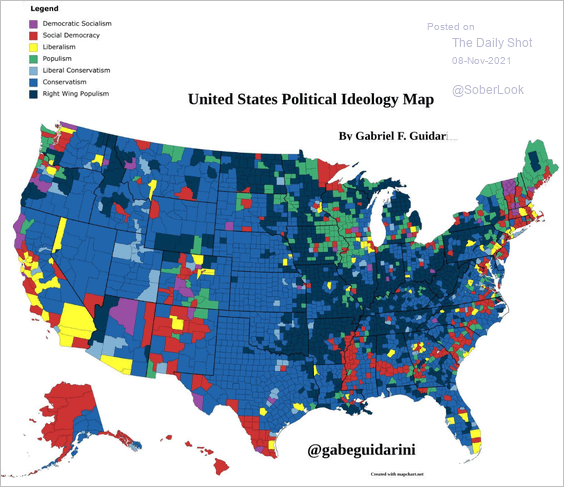 Source: @GabeGuidarini
3. Rising energy efficiency around the world:
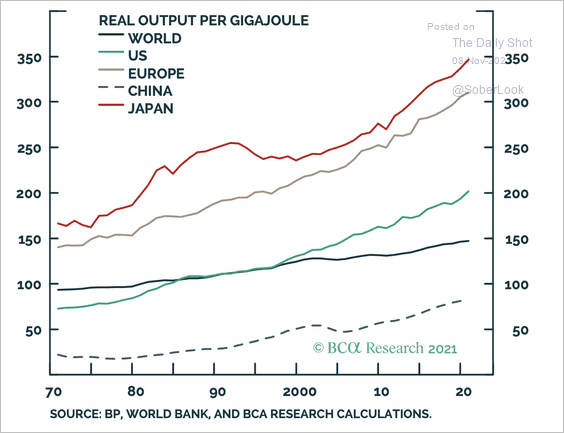 Source: BCA Research
4. Mac computers as a share of Apple’s revenue:
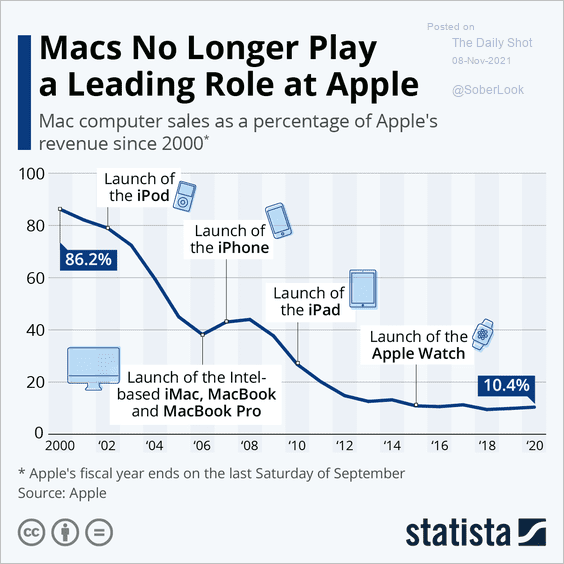 Source: Statista
5. Title count among major streaming services:
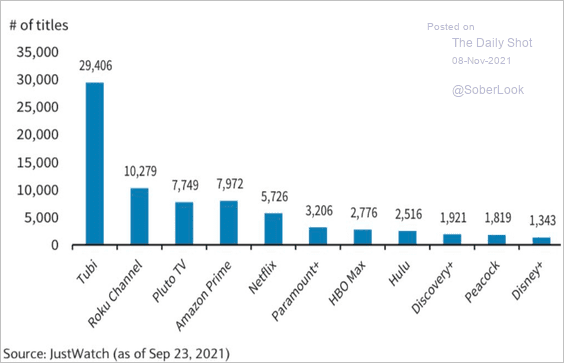 Source: Barclays Research; @carlquintanilla
6. The best cities for working remotely:
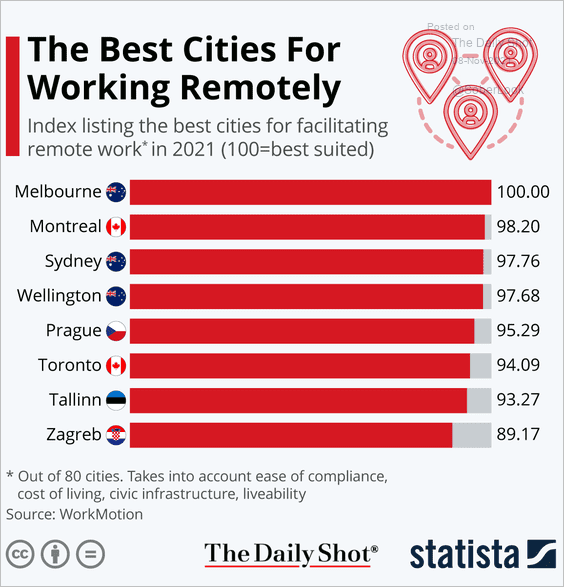 Source: Statista
7. Phillip Morris e-cigarette sales (share of total):
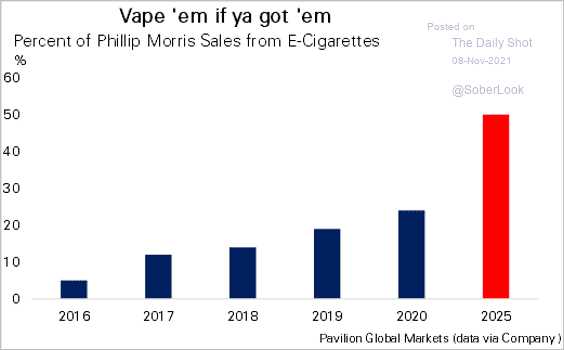 Source: Pavilion Global Markets
8. COVID impact on the performance of professional soccer players:
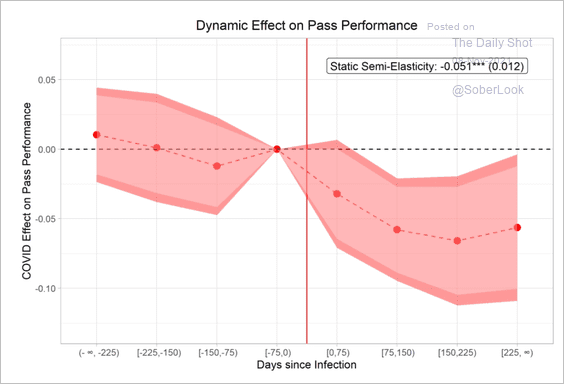 Source: @florianederer, @schmal_w, @jjreade Read full article
9. How far along are you in your holiday shopping?
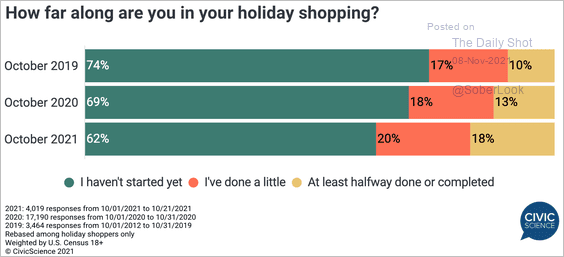 Source: @CivicScience
10. Most expensive Banksy artworks:
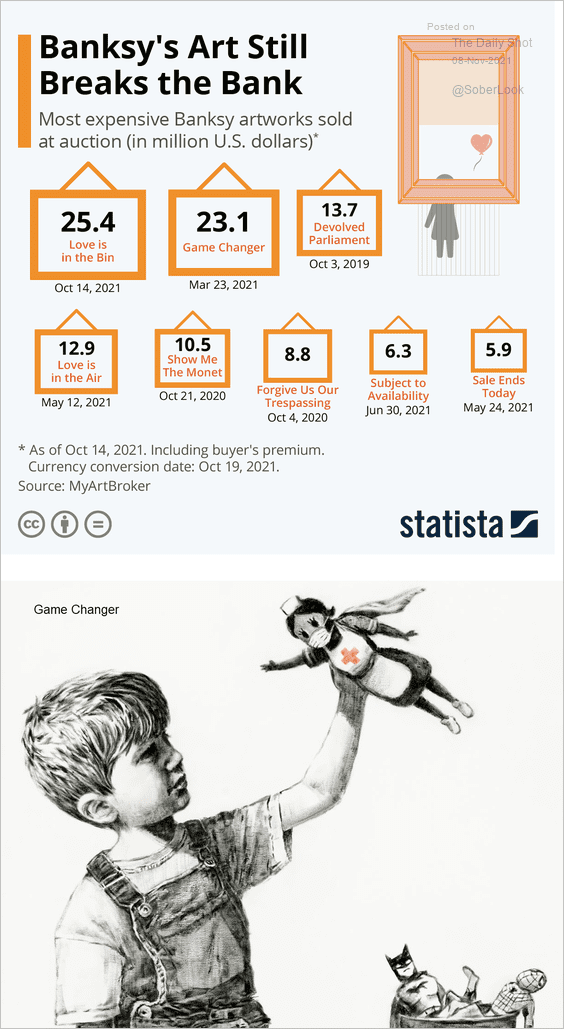 Source: Statista
——————–
Back to Index