
The Daily Shot: 09-Nov-21
• The United States
• The United Kingdom
• Europe
• Asia – Pacific
• China
• Emerging Markets
• Cryptocurrency
• Commodities
• Energy
• Equities
• Rates
• Global Developments
• Food for Thought
The United States
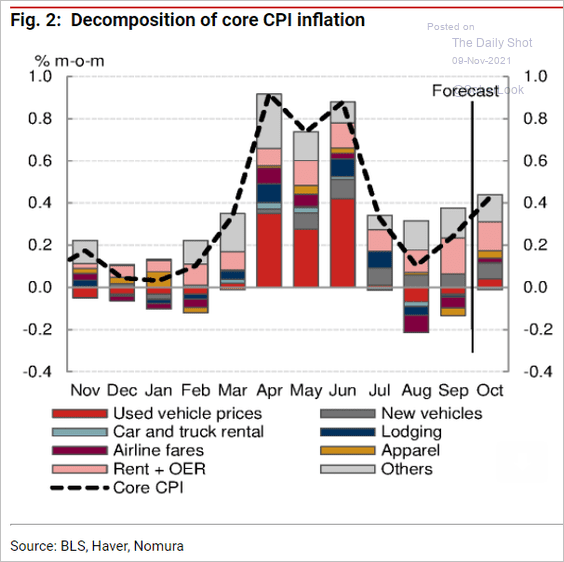
1. Let’s begin with some updates on inflation.
• Nomura expects an uptick in the October CPI report, boosted by shelter and vehicle prices.
 Source: Nomura Securities
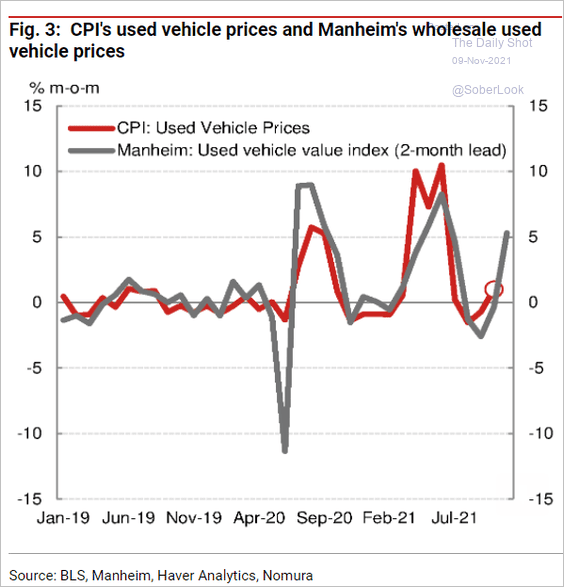
– Wholesale used car prices lead the CPI component by two months.
 Source: Nomura Securities
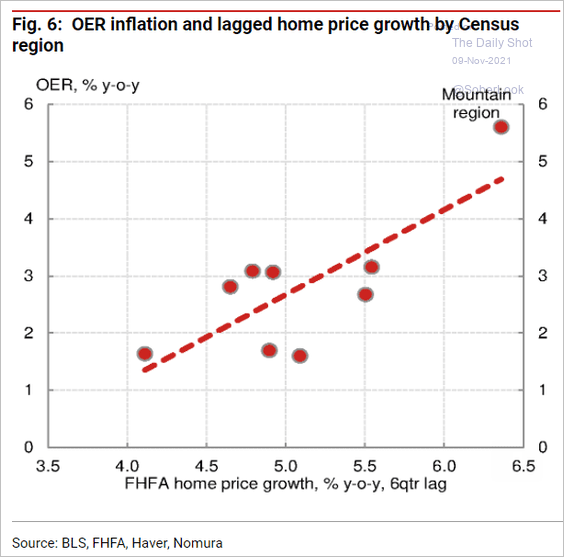
– Home price gains will drive owners’ equivalent rent (OER) higher.
 Source: Nomura Securities
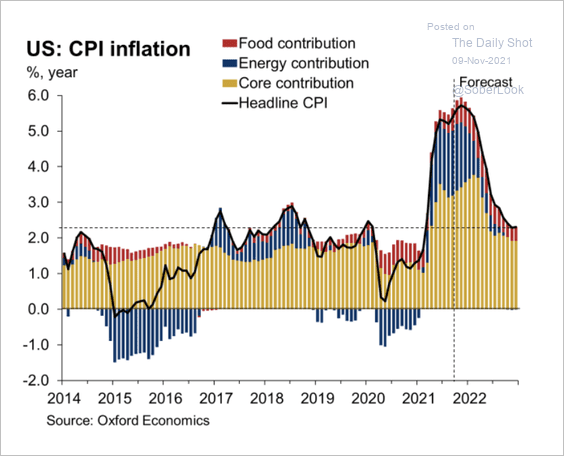
• Oxford Economics expects CPI to moderate in the second half of next year, especially as energy supply comes back online. But the CPI peak is yet to come.
 Source: Oxford Economics
• This chart shows PCE inflation over various look-back periods.
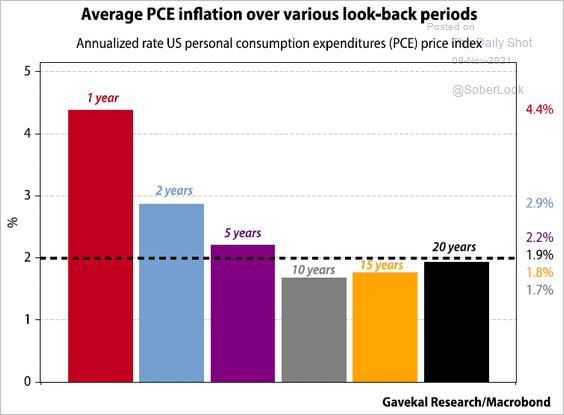 Source: Gavekal Research
• The Phillips curve relationship in the US hasn’t worked well for a long time.
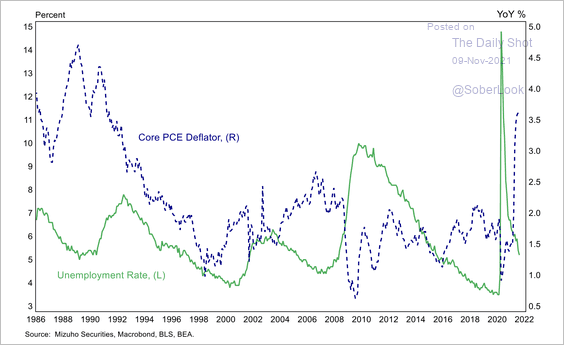 Source: Mizuho Securities USA
Is that trend about to change?
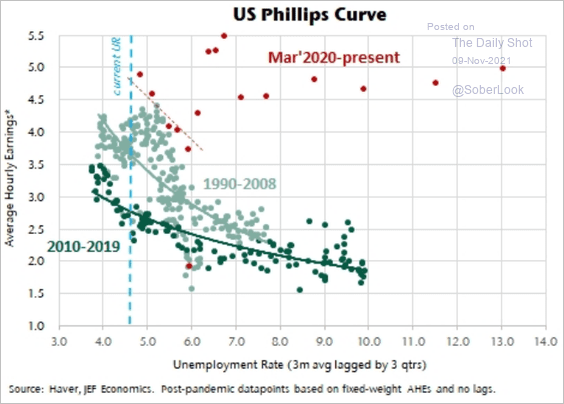 Source: Jefferies
• The median PCE inflation excluding shelter is now above 2.5%.
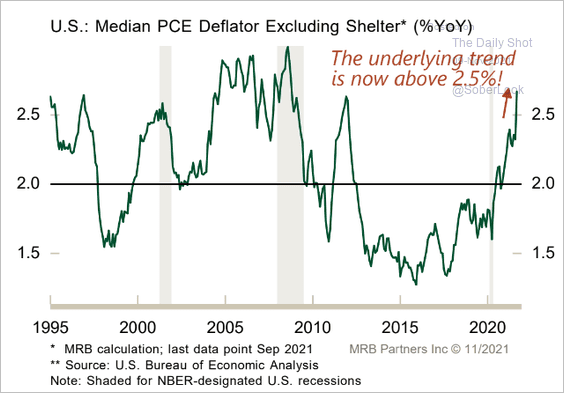 Source: MRB Partners
• This chart shows the betting markets’ odds of the October CPI rising by 0.5% (month-over-month).
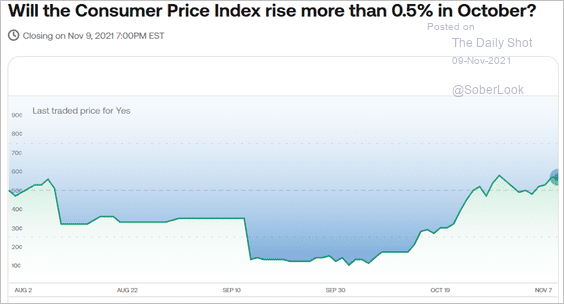 Source: Kalshi
• Consumer inflation expectations continue to climb.
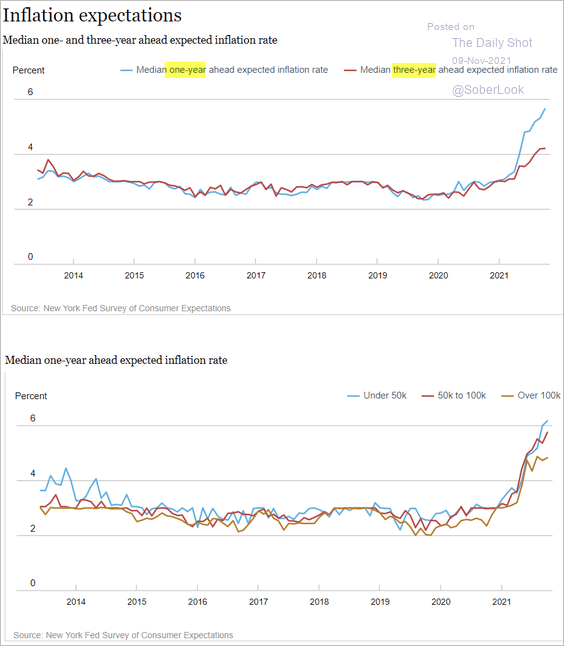 Source: NY Fed
——————–
2. Consumers expect faster wage growth ahead.
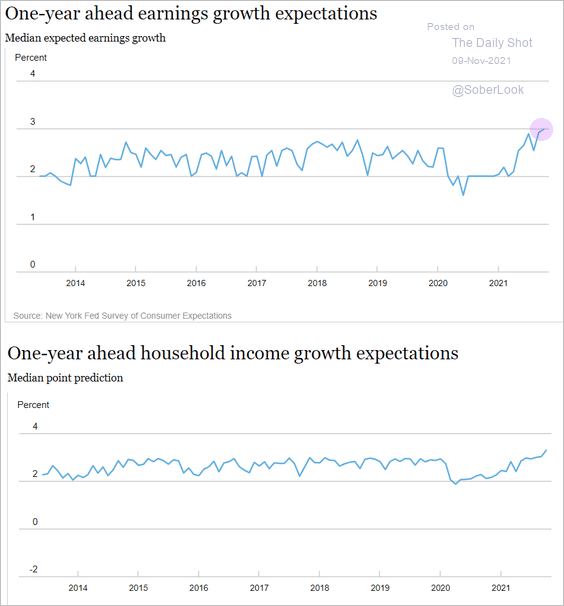 Source: NY Fed
Economists agree. Here is a forecast from Cornerstone Macro.
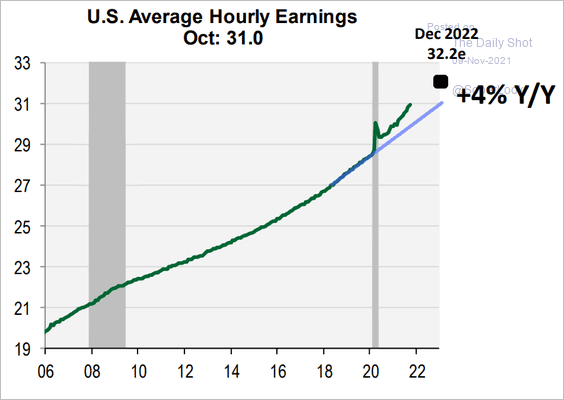 Source: Cornerstone Macro
And CFOs agree as well.
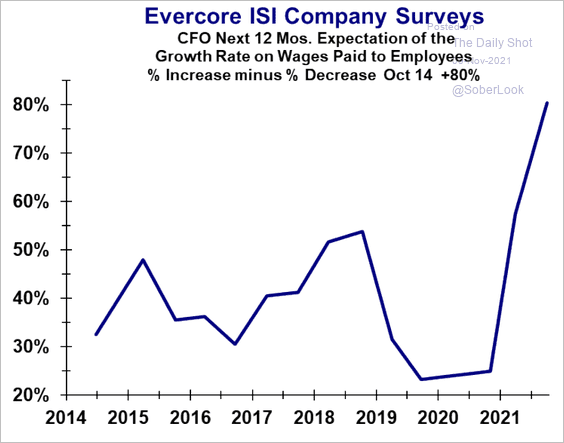 Source: Evercore ISI
——————–
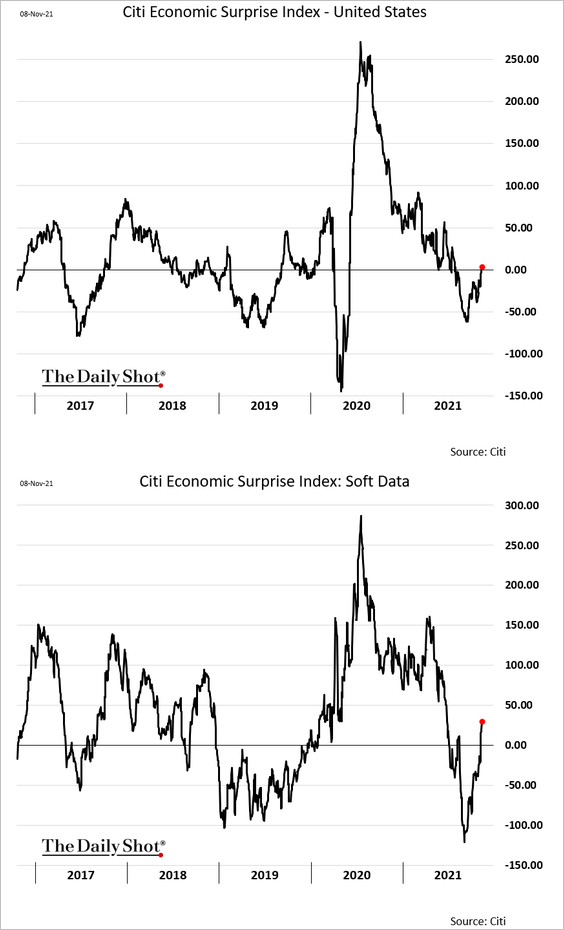
3. The Citi Economic Surprise index is back above zero, boosted by survey data (ISM manufacturing and services). A strong employment report also helped.
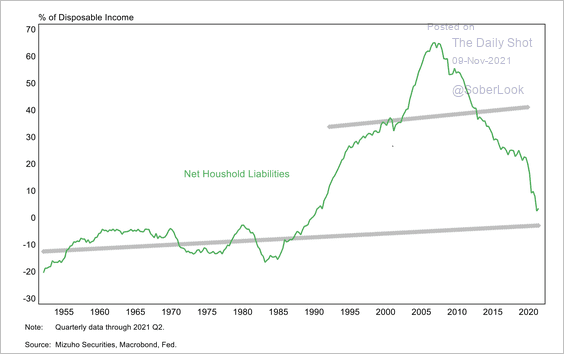
4. US household deleveraging has been extraordinary, unwinding the entire 1990 – 2009 credit binge.
 Source: Mizuho Securities USA
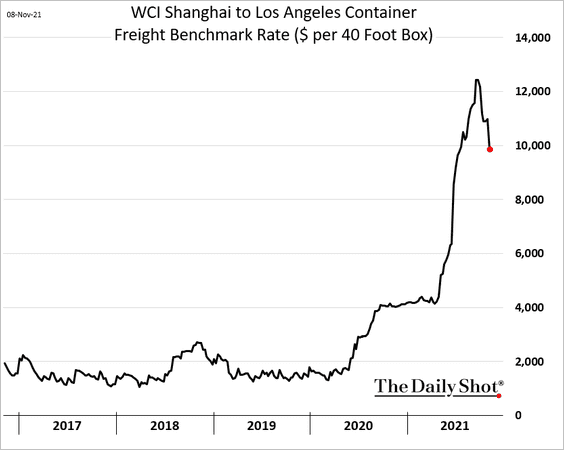
5. Shipping costs from China appear to be moderating.
Back to Index
The United Kingdom
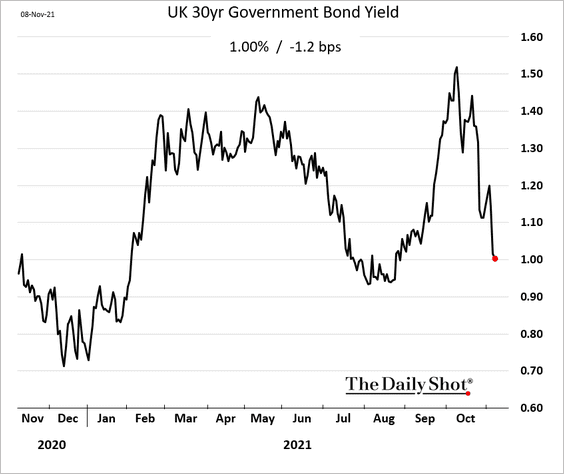
1. The 30yr gilt yield is back near 1%.
2. The UK equity market looks attractive, with one of the highest developed-market equity risk premiums.
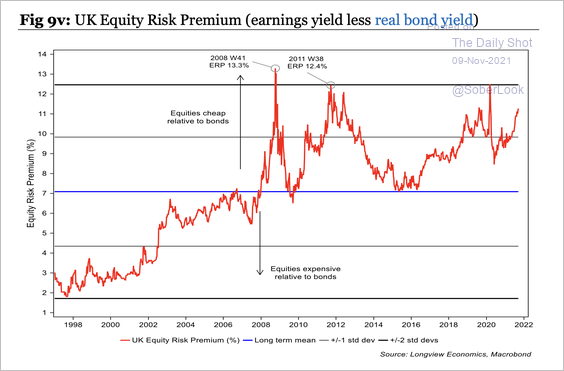 Source: Longview Economics
3. Will the UK economy outperform the US and the Eurozone next year?
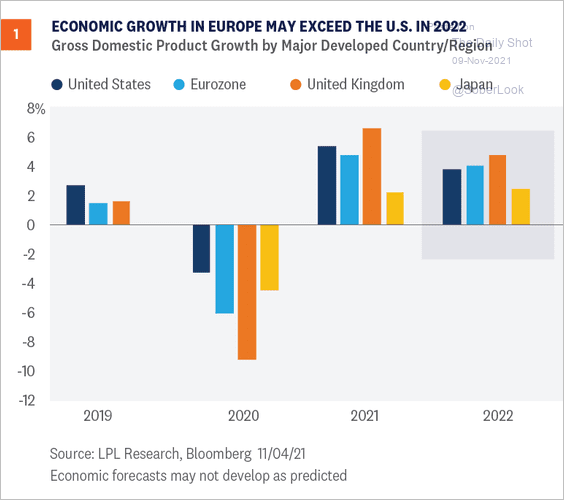 Source: LPL Research
Back to Index
Europe
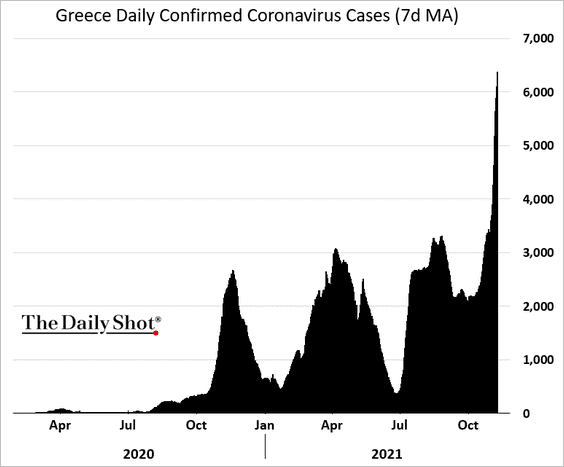
1. COVID cases are on the rise across Europe.
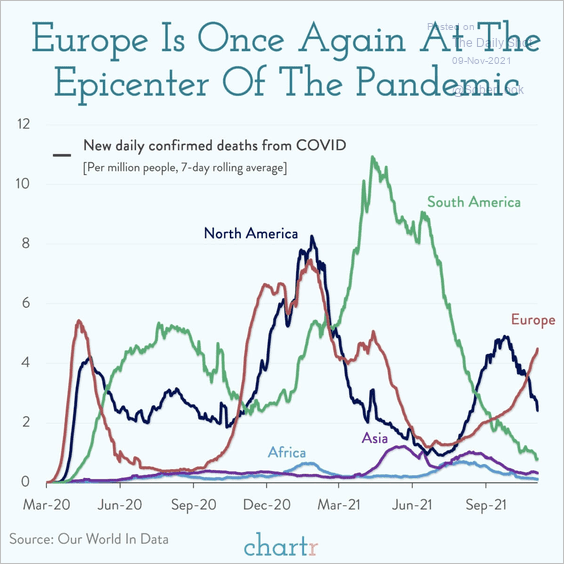 Source: @chartrdaily
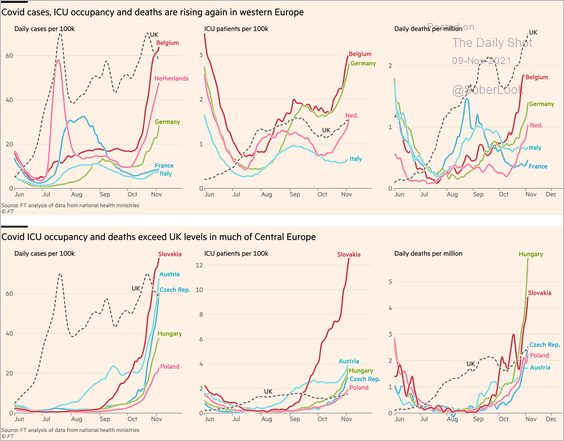 Source: @financialtimes Read full article
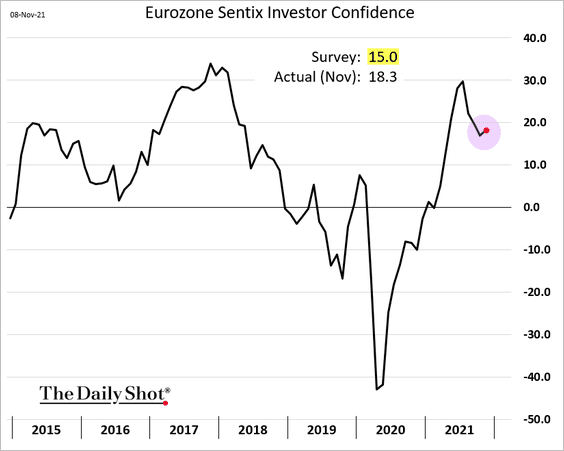
2. Nonetheless, the Sentix investor confidence index surprised to the upside.
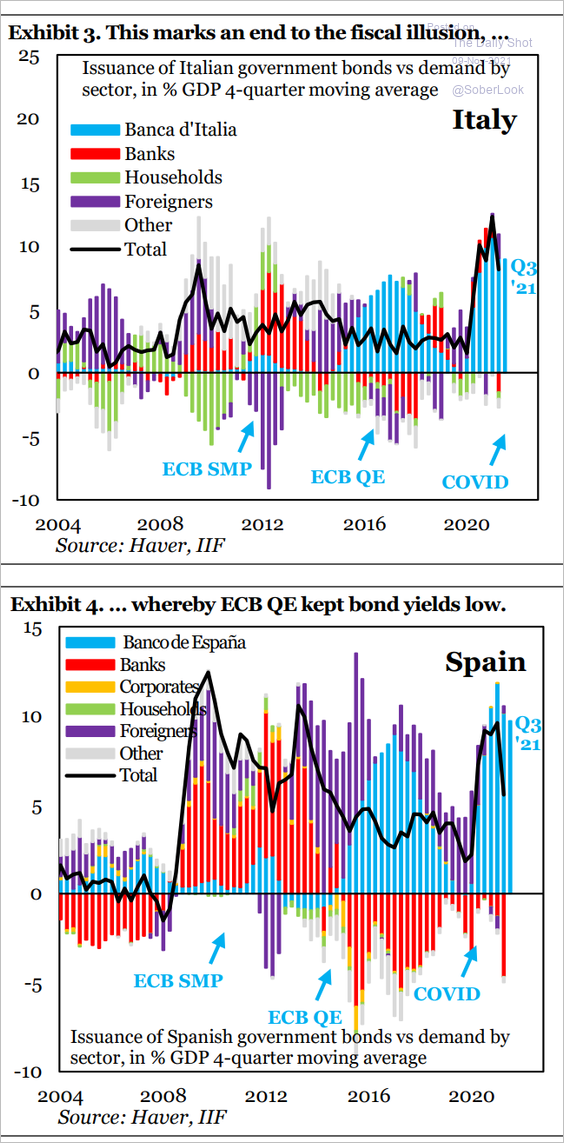
3. Keeping a lid on sovereign yields will be challenging after ECB QE ends.
 Source: IIF
4. Euro area inflation has been more muted and narrower than in the US.
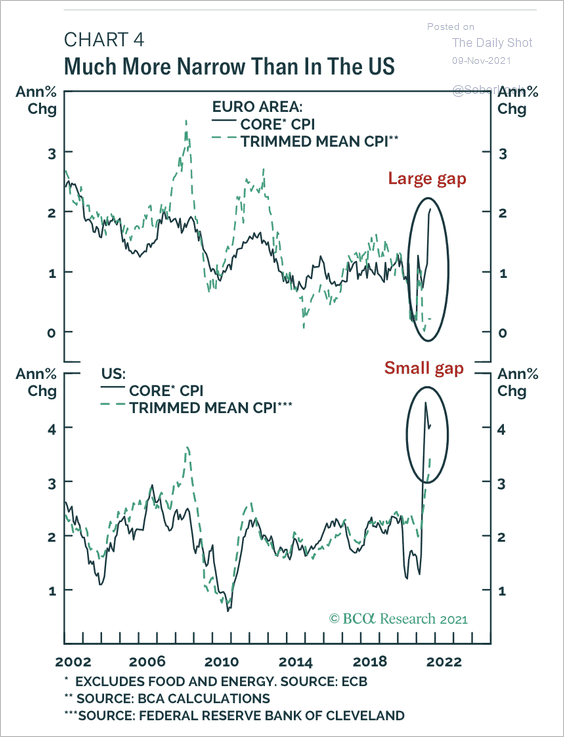 Source: BCA Research
5. Eurozone labor market slack remains comparable to 2011 levels.
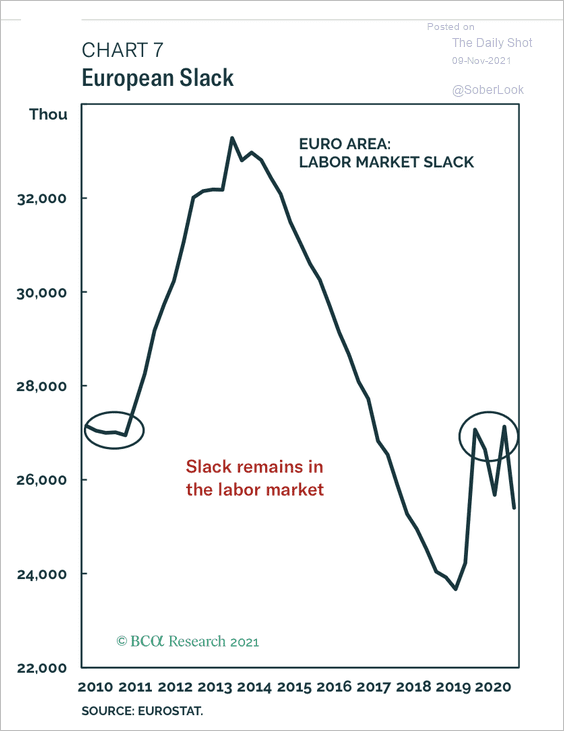 Source: BCA Research
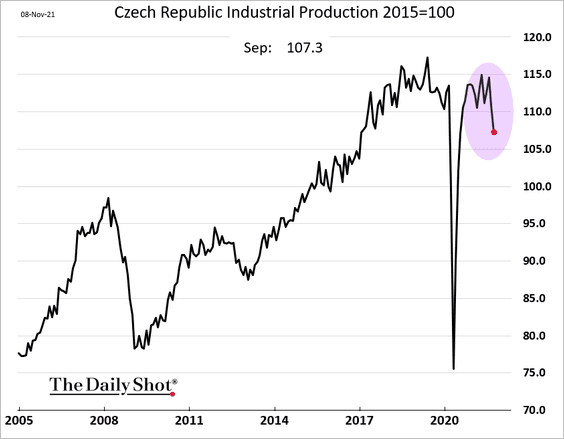
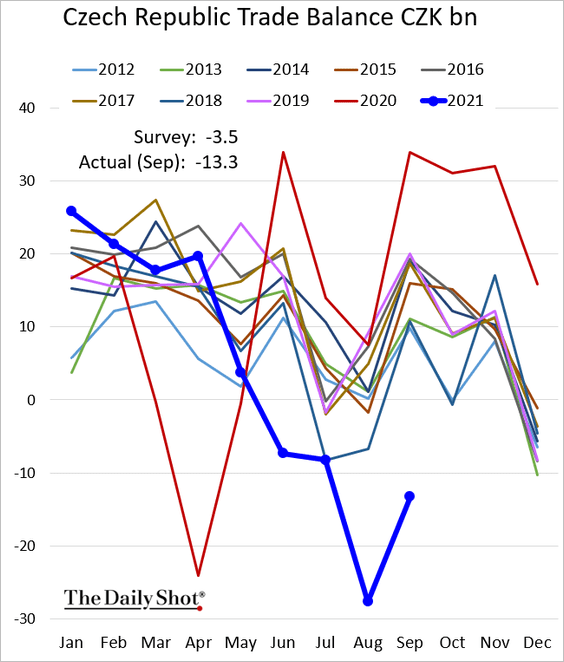
6. Czech industrial production is following Germany lower.
Here is the Czech trade balance.
——————–
7. With the looming expiry of the escape clause of the Stability and Growth Pact, the scene is set for a debate on future EU fiscal rules. The chart below shows the ESM proposal, which still looks very restrictive.
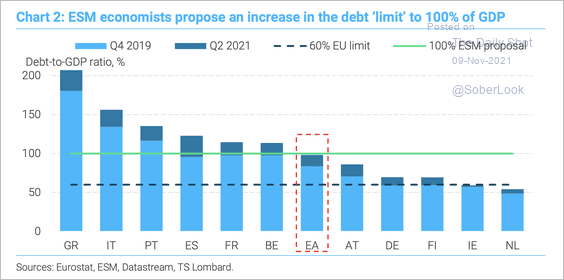 Source: TS Lombard
8. Finally, we have some data on sector PMIs (business activity).
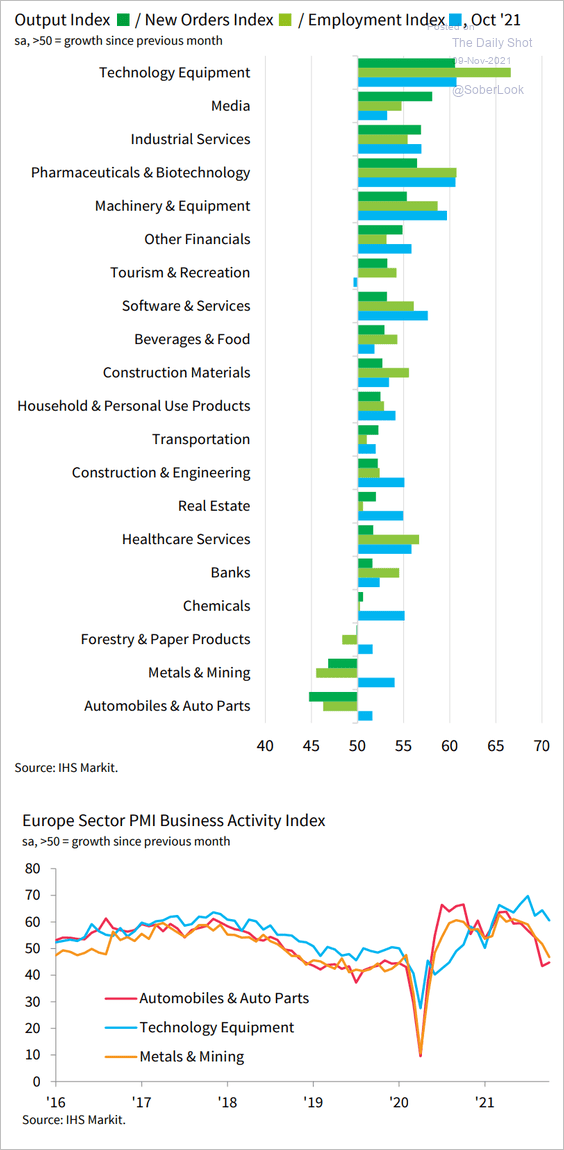 Source: IHS Markit
Back to Index
Asia – Pacific
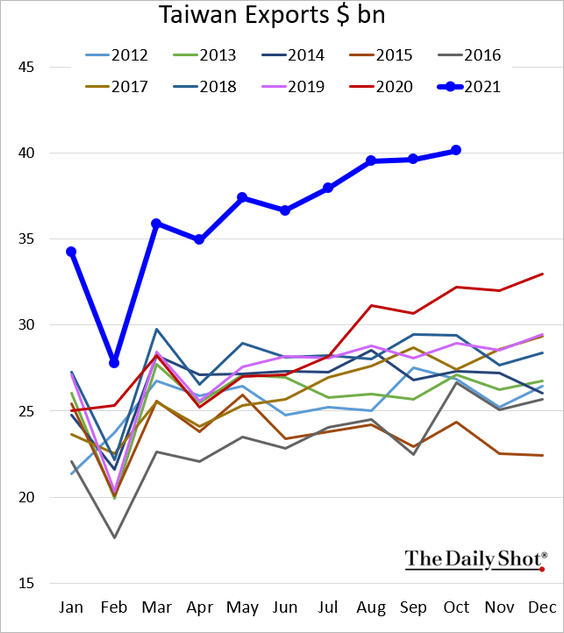
1. Taiwan’s exports hit a record high.
2. South Korea’s central bank finds itself in a precarious situation with skyrocketing private debt (especially household debt) and house prices.
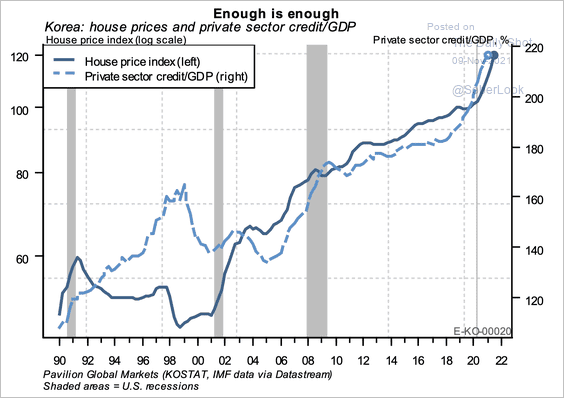 Source: Pavilion Global Markets
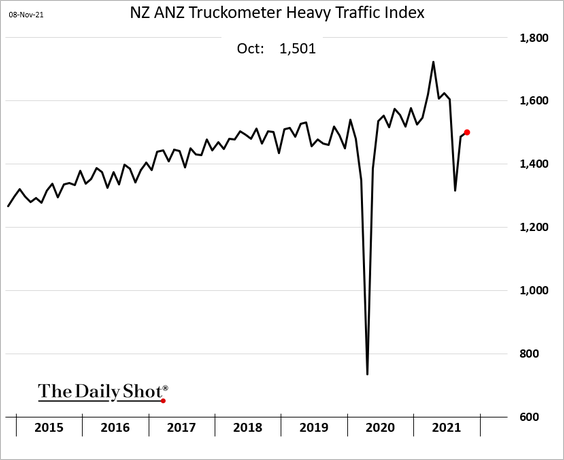
3. New Zealand’s traffic data point to a bounce in economic activity from the 2021 lockdown lows.
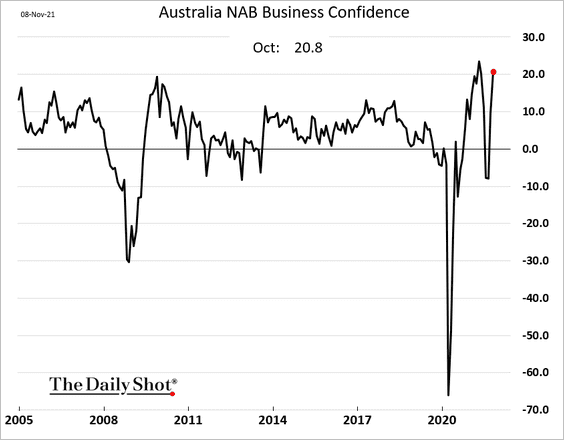
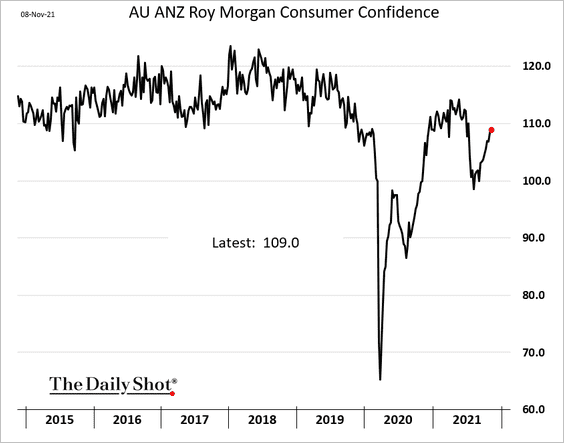
4. Australia’s consumer and business confidence indicators are recovering.
——————–
5. Natural gas consumption in Asia-Pacific has been surging in recent decades.
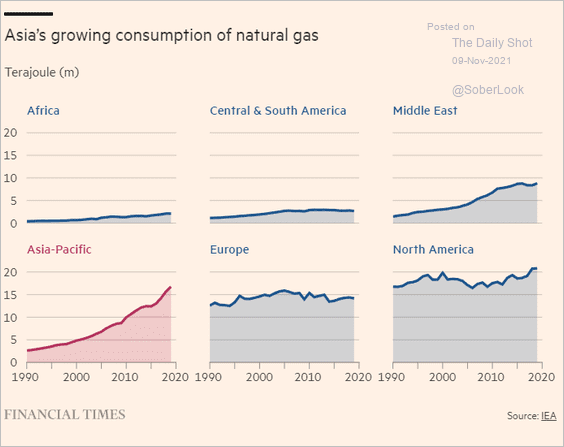 Source: @financialtimes Read full article
Back to Index
China
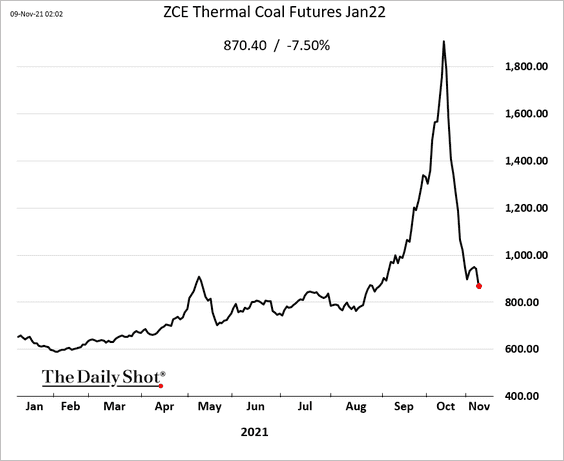
1. Here we go again. Thermal coal prices are down another 7.5%.
2. Despite an attempt to ramp up pipeline projects (largely gas from Central Asia and Russia), China continues to depend on LNG as a key source of gas.
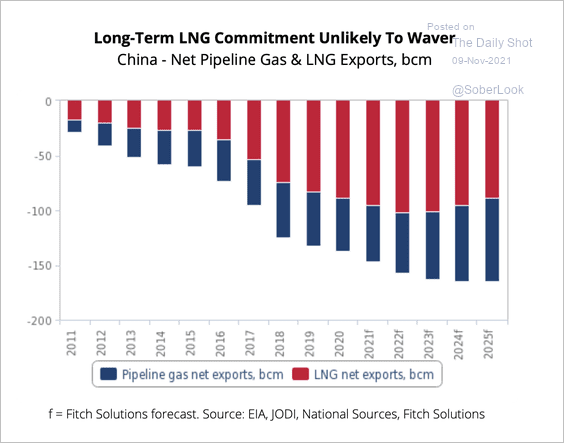 Source: Fitch Ratings
3. Here is the breakdown of China’s exports.
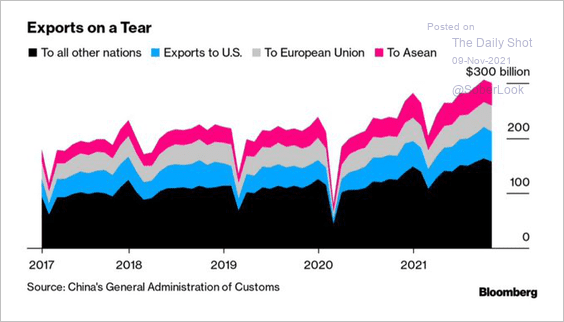 Source: @GregDaco; Bloomberg Read full article
China’s trade surplus hit a record despite increased energy imports.
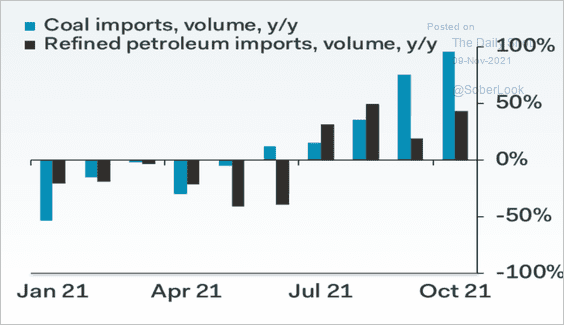 Source: Pantheon Macroeconomics
——————–
4. Profit margins are under pressure as costs climb.
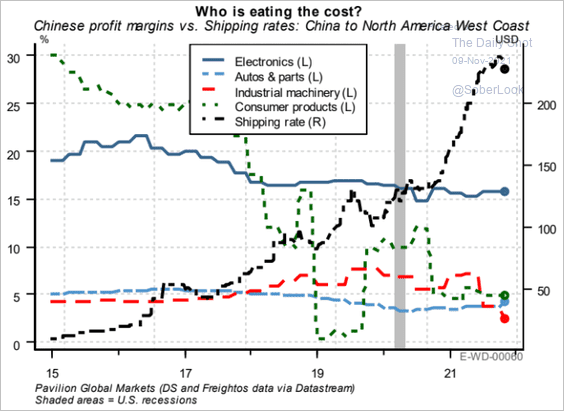 Source: Pavilion Global Markets
5. Some Chinese banks are very exposed to property markets.
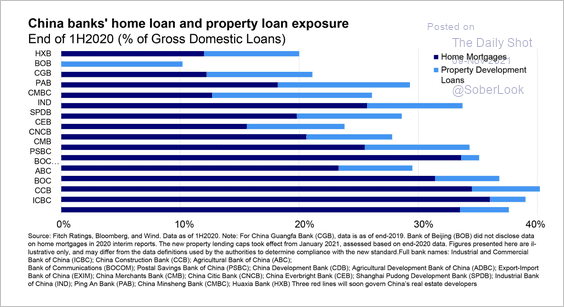 Source: SOM Macro Strategies
Back to Index
Emerging Markets
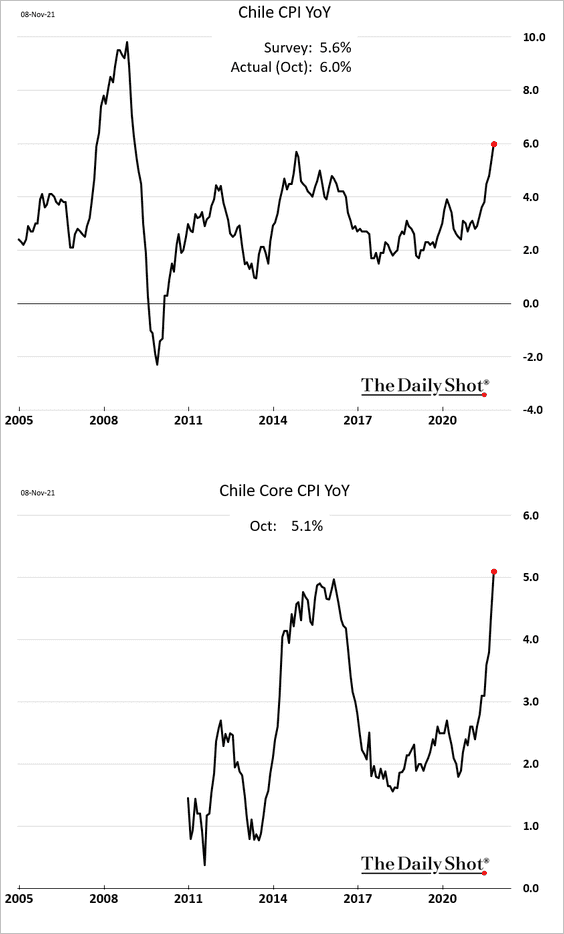
1. Let’s begin with Chile.
• Inflation topped market expectations.
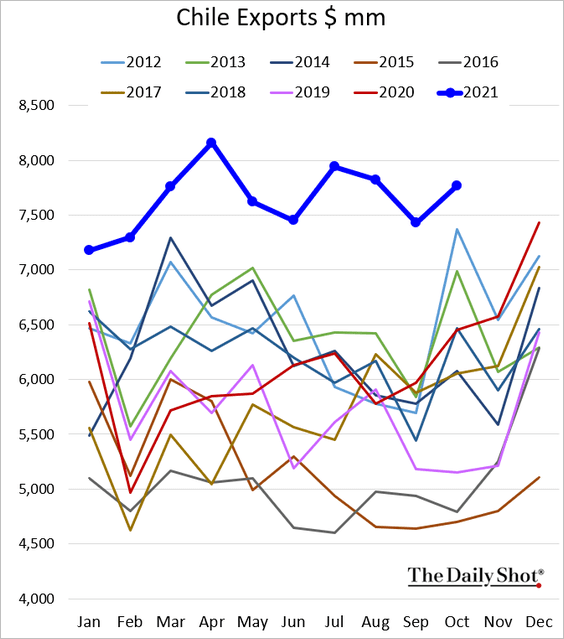
• This chart shows Chile’s exports.
• Chilean mining exports are about to take a leg down due to demand weakness in China.
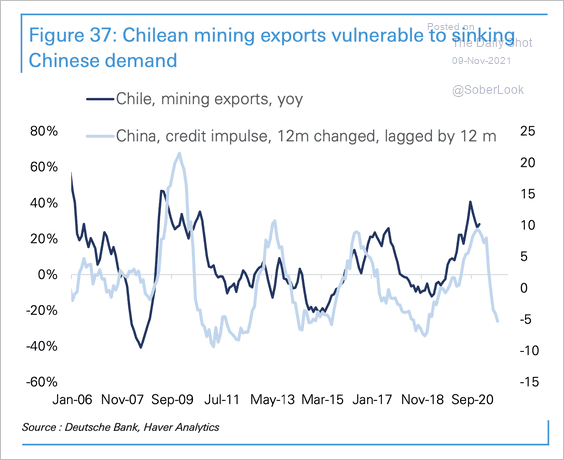 Source: Deutsche Bank Research
——————–
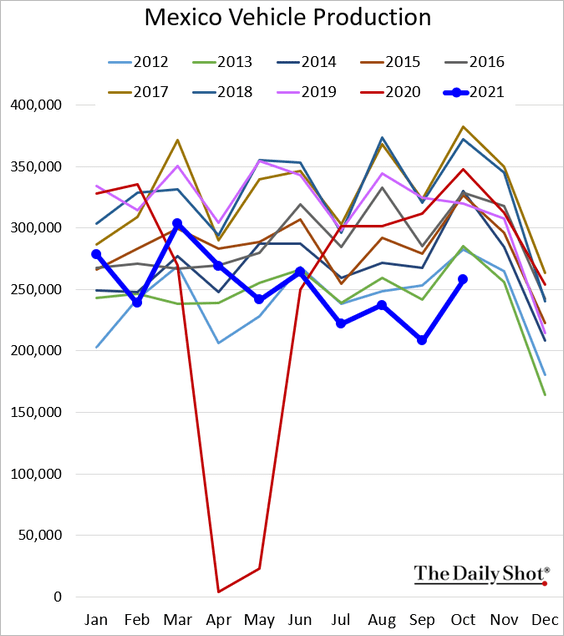
2. Mexican vehicle sales remain at multiyear lows for this time of the year.
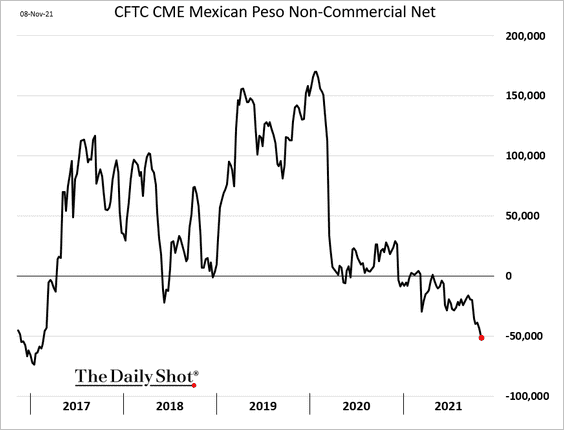
Separately, speculative accounts (such as hedge funds) have soured on the Mexican peso.
——————–
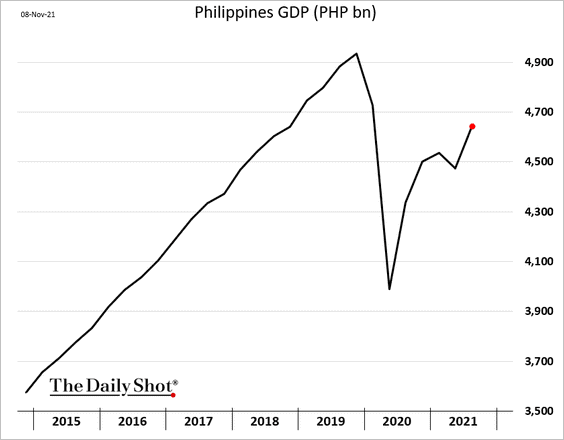
3. The Philippine GDP jumped in Q3, exceeding forecasts. But there is a long road to recovery.
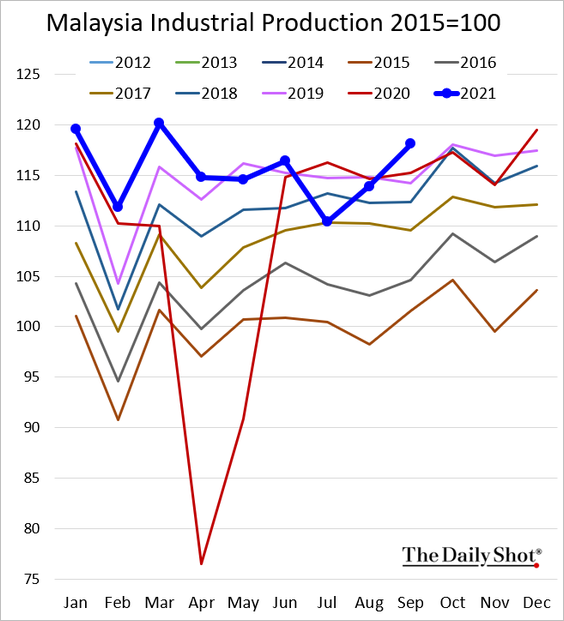
4. Malaysia’s industrial production rebounded to hit a multi-year high (for September).
Back to Index
Cryptocurrency
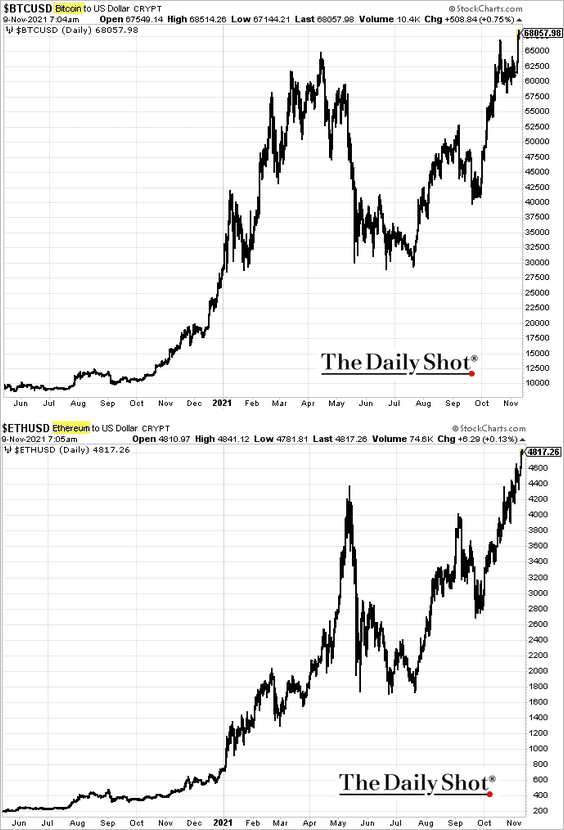
1. Bitcoin and ether made record highs on Monday.
 Source: CoinDesk Read full article
——————–
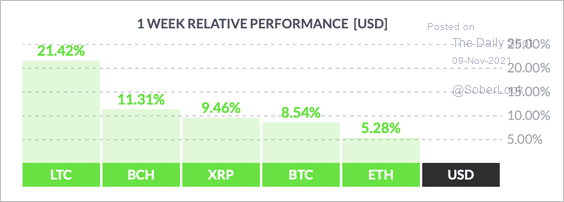
2. Litecoin (LTC) has been outperforming other large cryptocurrencies over the past week.
 Source: FinViz
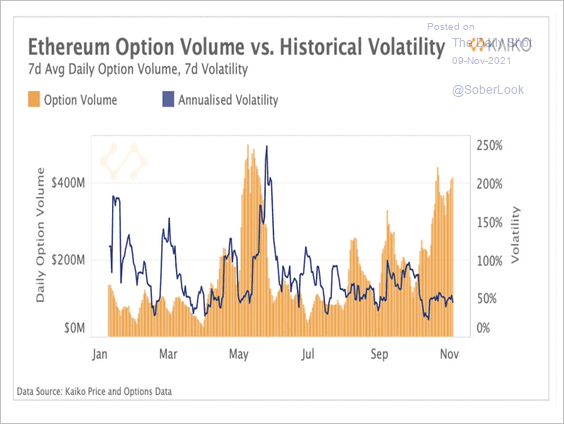
3. Despite lower trading volume in the spot market, ether’s option volumes have risen to their highest level since May.
 Source: Kaiko Read full article
4. Ethereum is losing market share to alternate Layer 1 protocols.
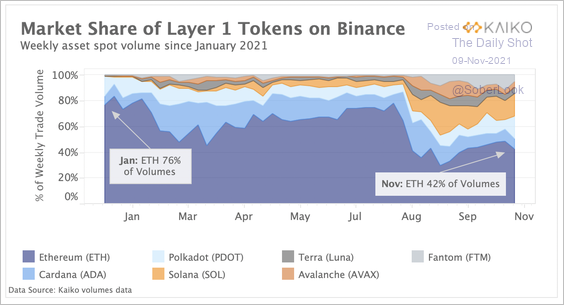 Source: Kaiko Read full article
5. Digital asset funds saw the 12th consecutive week of inflows.
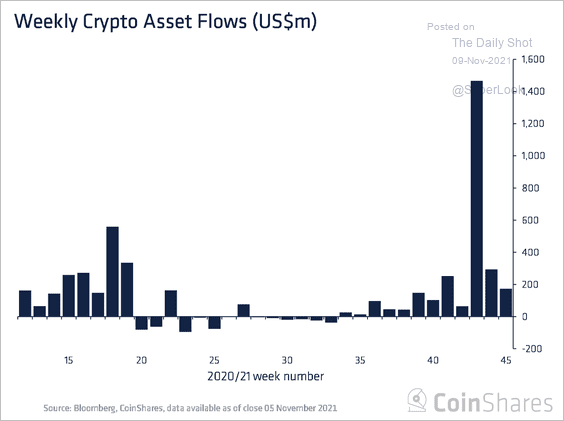 Source: CoinShares Read full article
Bitcoin investment products accounted for a majority of inflows last week.
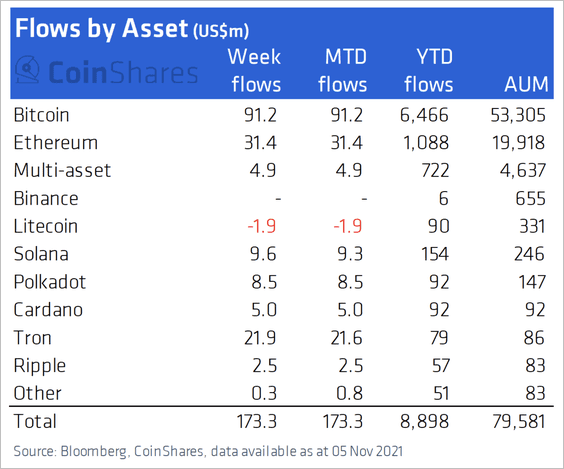 Source: CoinShares Read full article
——————–
6. Finally, we have a couple of bitcoin/gold comparisons.
• Fund flows.
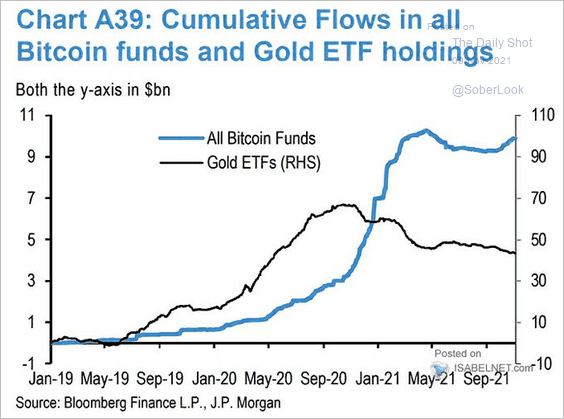 Source: @ISABELNET_SA, @jpmorgan
• Market cap:
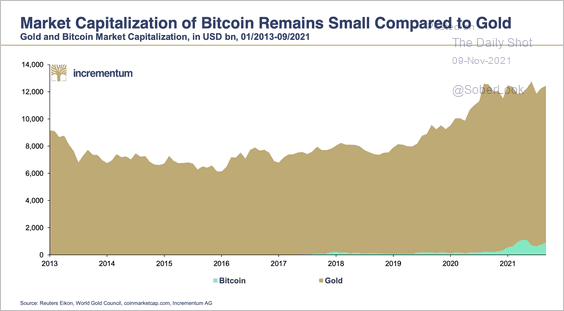 Source: ingoldwetrust.report
Back to Index
Commodities
1. Let’s begin with some updates on gold.
• Gold futures are attempting to break above an intermediate-term downtrend.
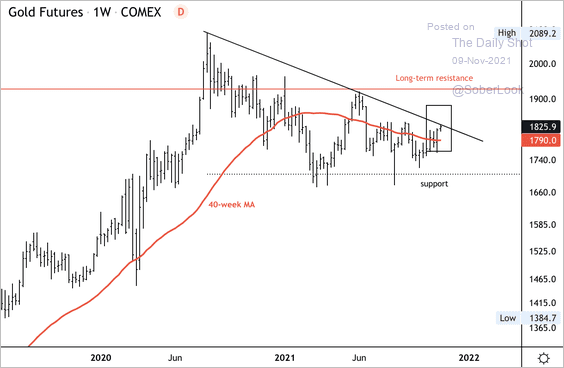 Source: Dantes Outlook
• This story gave gold a boost.
 Source: @WSJ Read full article
• The percentage of gold mining stocks in bear markets has dropped from 95% to 65% in recent days.
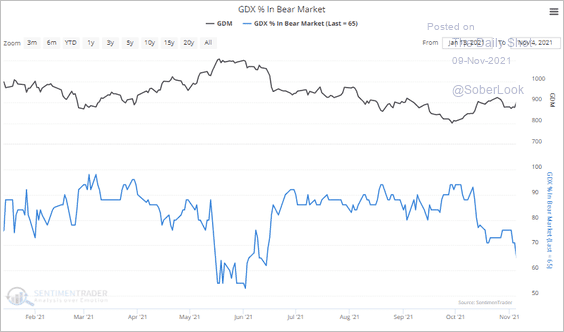 Source: SentimenTrader
• Here is a look at seasonal trends in the SPDR Gold ETF (GLD) over the past 20 years.
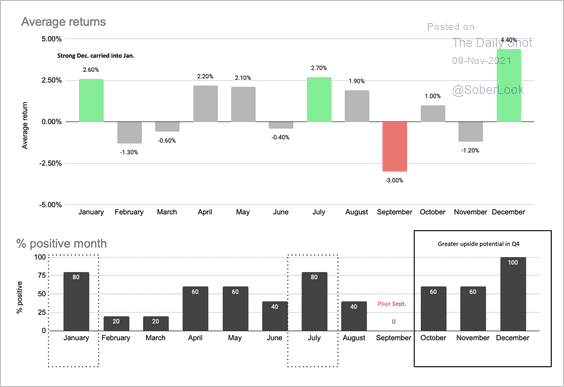 Source: Cannon Advisors
• Gold prices could weaken if TIPS yields move higher.
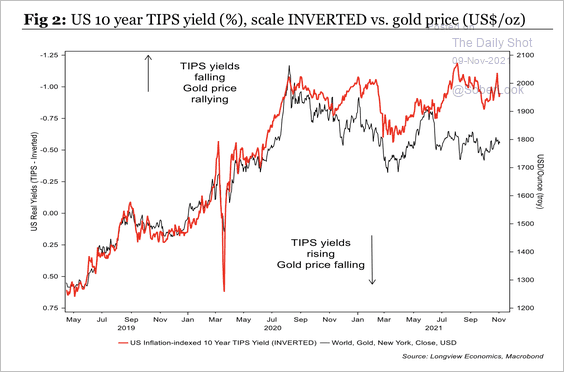 Source: Longview Economics
• Speculators have trimmed their extreme net-long gold positions over the past few years.
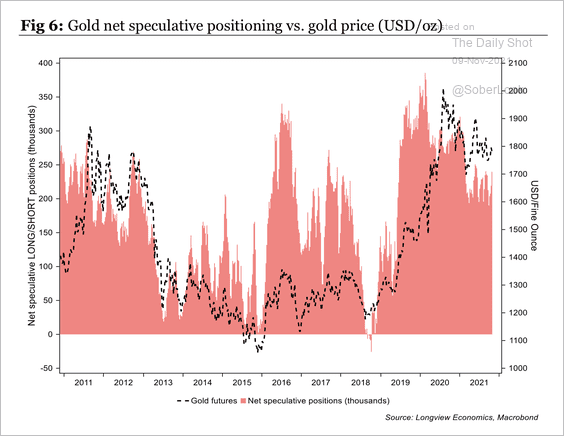 Source: Longview Economics
——————–
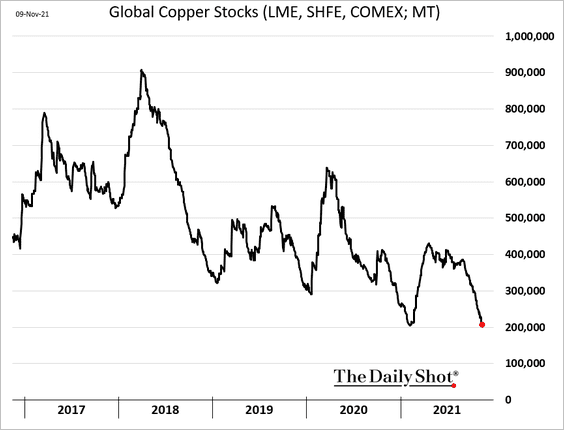
2. Copper inventories are approaching multi-year lows.
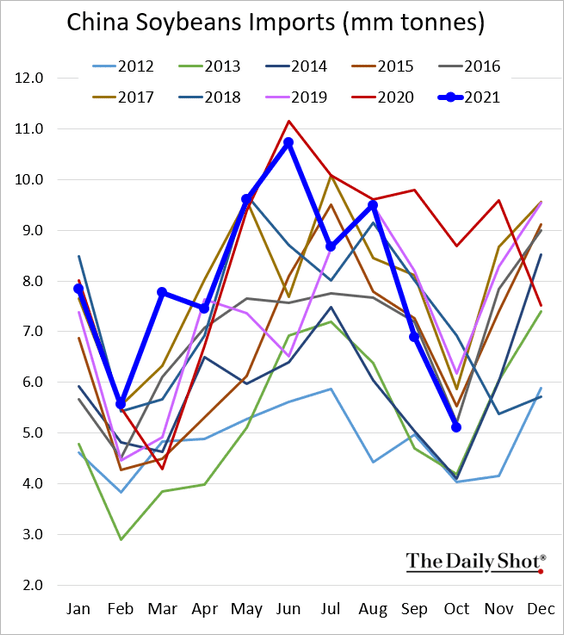
3. US soybean futures have been trending lower amid robust supply expectations and softer demand from China.
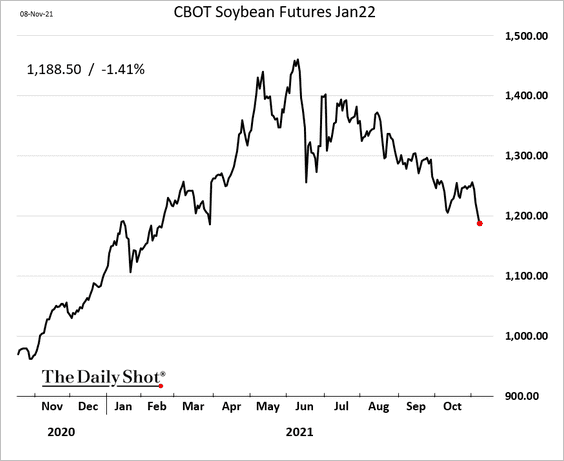
 Source: Reuters Read full article
——————–
4. It’s been a strong year for commodities.
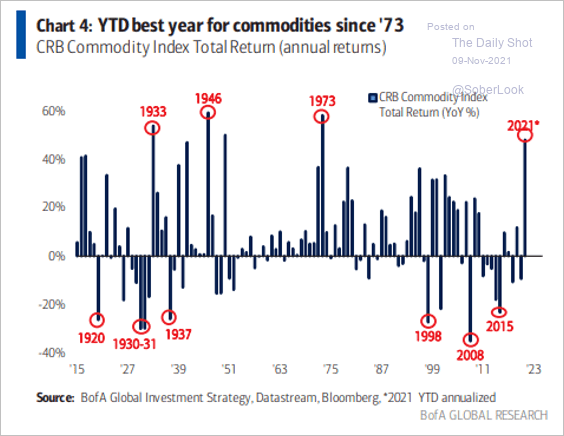 Source: BofA Global Research
Back to Index
Energy
1. OPEC+ nations could contribute around half of global oil supply growth next year, and a further 12% from Russia, according to Fitch estimates. Rising supply could weigh on oil prices in 2022.
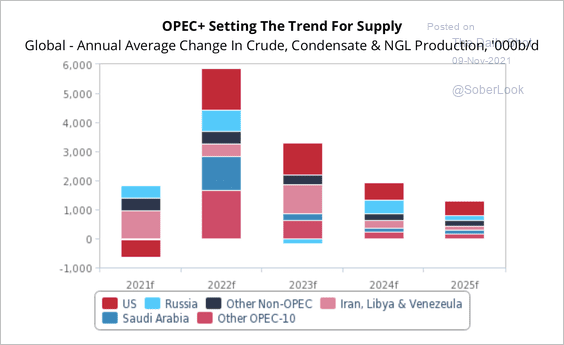 Source: Fitch Solutions Macro Research
2. Fitch expects refined fuel consumption to slow over the next few years.
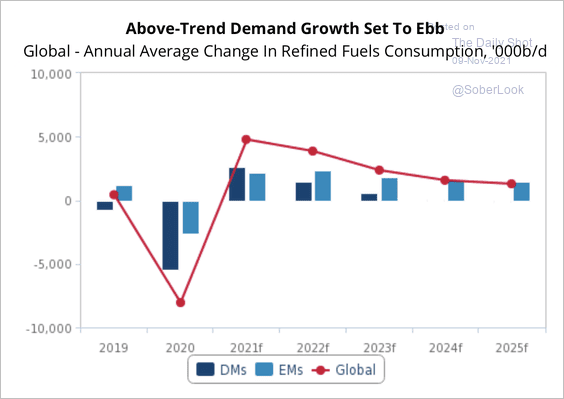 Source: Fitch Solutions Macro Research
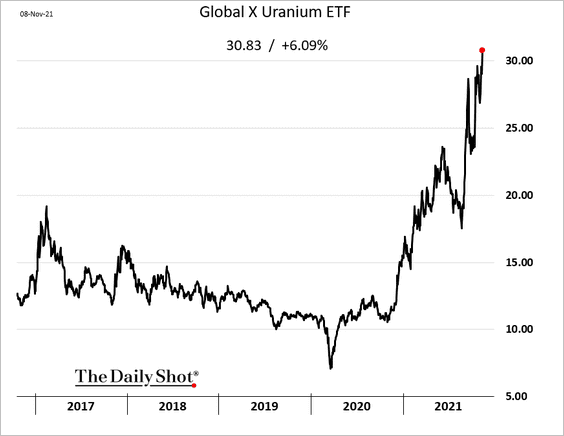
3. Shares of uranium mining firms are surging.
Back to Index
Equities
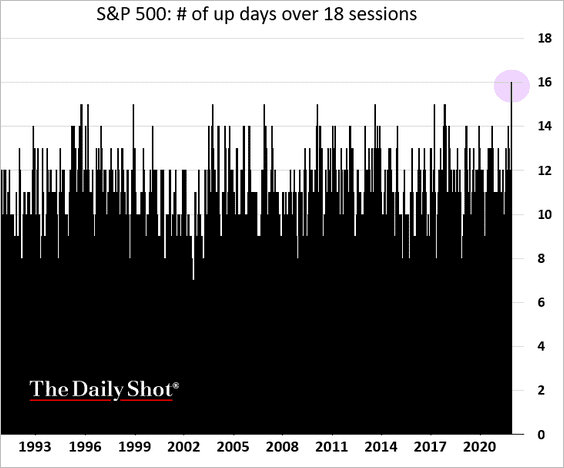
1. The market has been up in 16 out of the last 18 sessions.
 h/t @luwangnyc
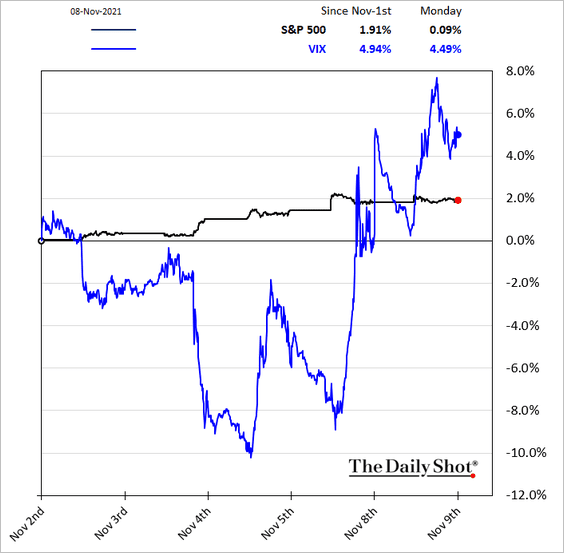
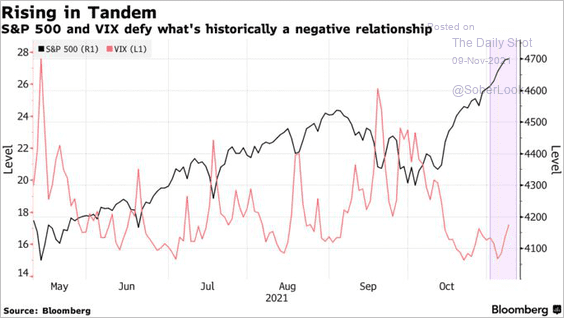
2. VIX climbed on Monday, even with the market edging higher.
 Source: Bloomberg Read full article
——————–
3. Fewer than 25% of Nasdaq 100 stocks are in a correction (down 10% from their high) – the lowest since February.
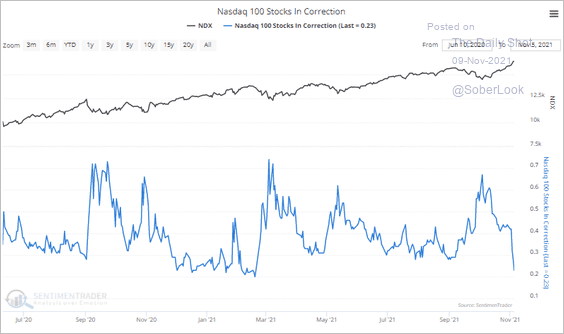 Source: SentimenTrader
• 16% of the S&P 500 members are at 52-week highs.
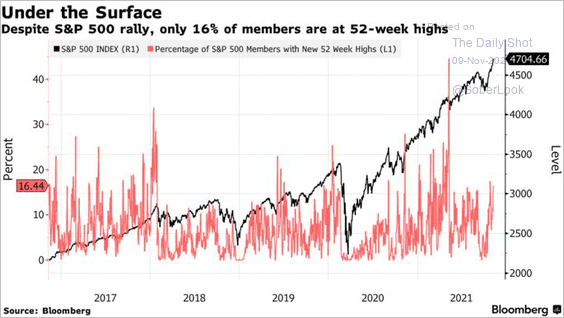 Source: Bloomberg Read full article
• More than 40% of major global developed market indexes are at a 52-week high – the most since August.
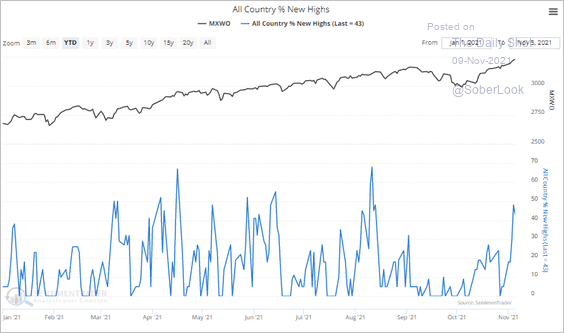 Source: SentimenTrader
——————–
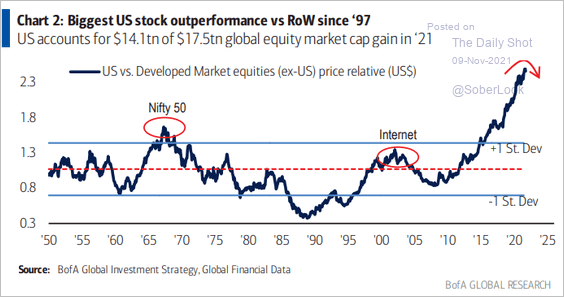
4. US stocks have outperformed all other developed markets over the long term.
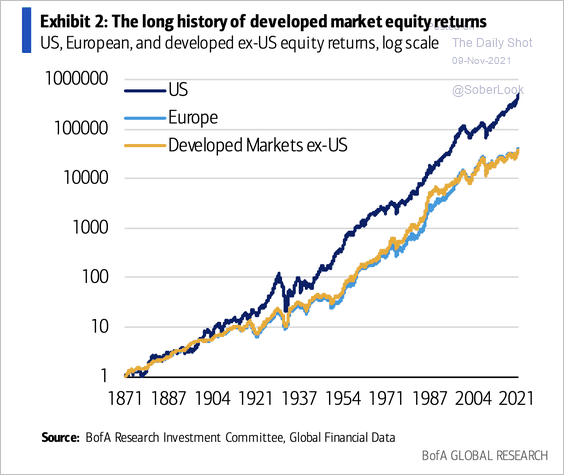 Source: BofA Global Research
Has the outperformance peaked for now?
 Source: BofA Global Research
——————–
5. Risk appetite in the options market has surged in recent weeks.
• Nasdaq 100 call option volume:
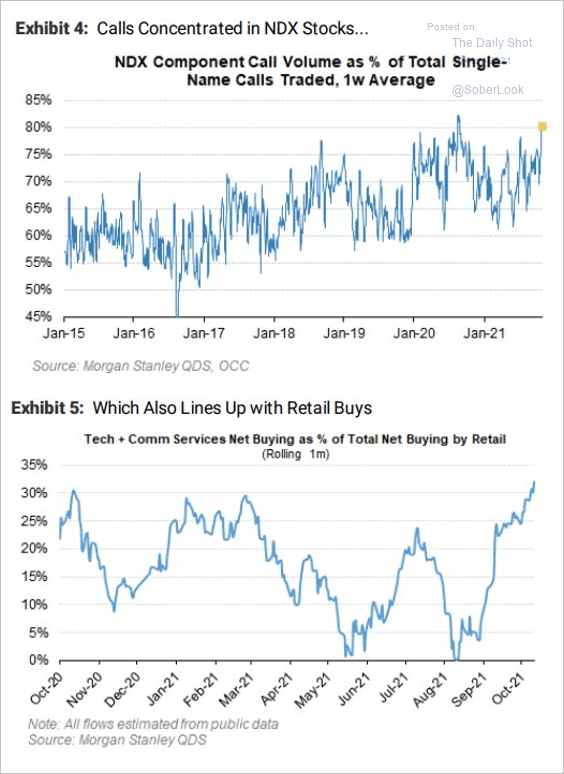 Source: Morgan Stanley Research
• Call options in S&P 500 and Russell 2000 names as well as by sector:
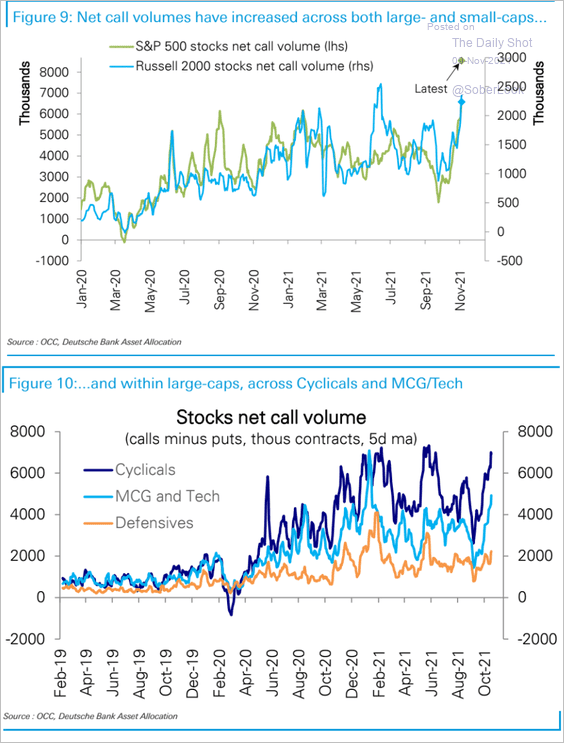 Source: Deutsche Bank Research
• The put-call ratio:
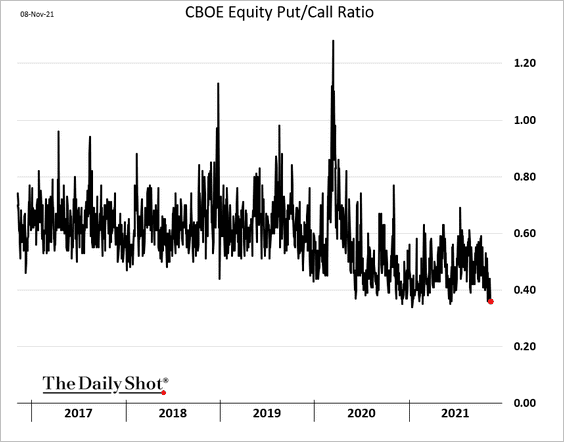
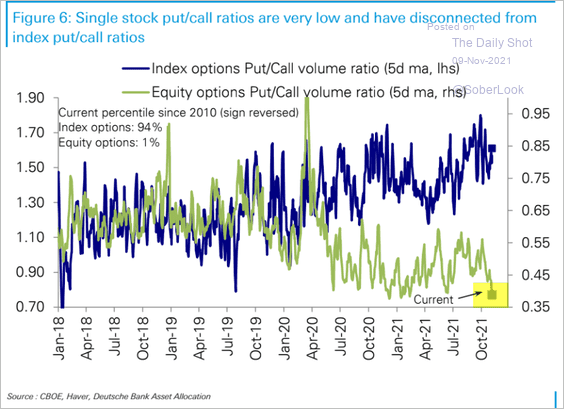 Source: Deutsche Bank Research
——————–
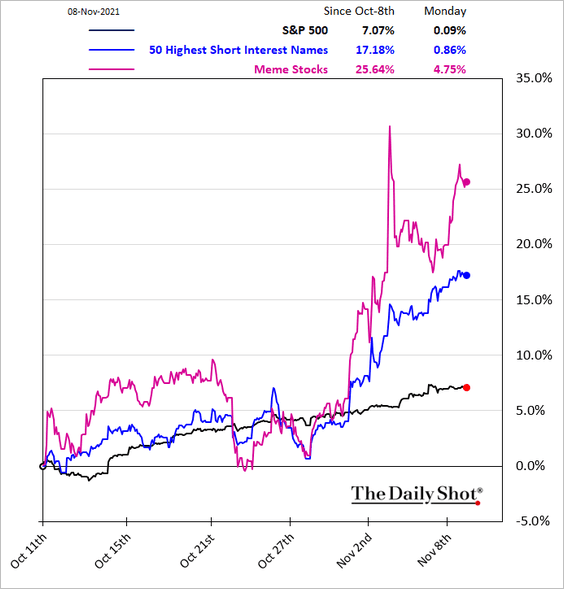
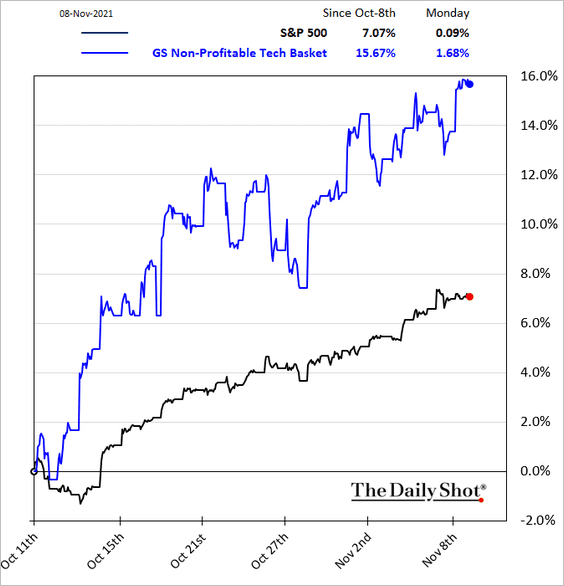
6. The Reddit crowd is pressing its bets.
• Most shorted names and meme stocks:
• Non-profitable tech:
——————–
7. Next, let’s look at a couple of attribution charts.
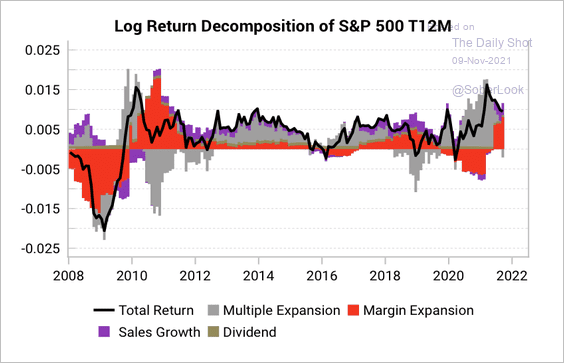
• Return contributions over time:
 Source: Pavilion Global Markets
• Drivers of S&P 500 price changes over the past two years:
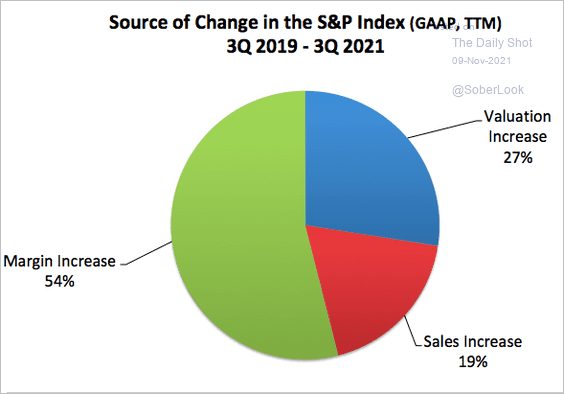 Source: @ukarlewitz
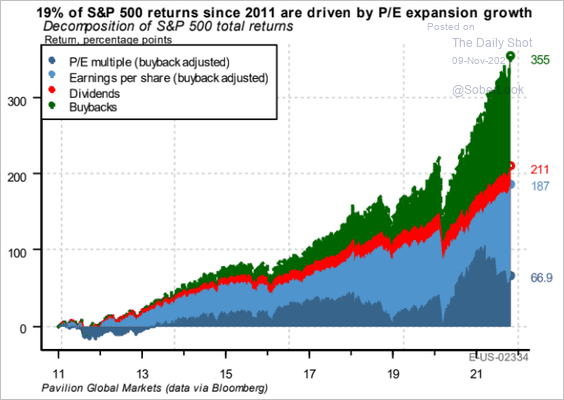
• Margin expansion has taken the reins from valuation expansion as the key driver of returns:
 Source: Variant Perception
——————–
8. The scatterplot below shows sectors plotted by risk (standard deviation) and return over the last three years.
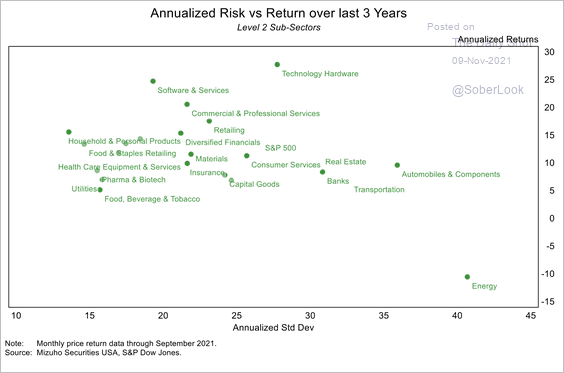 Source: Mizuho Securities USA
9. Retail interest in SPACs has collapsed.
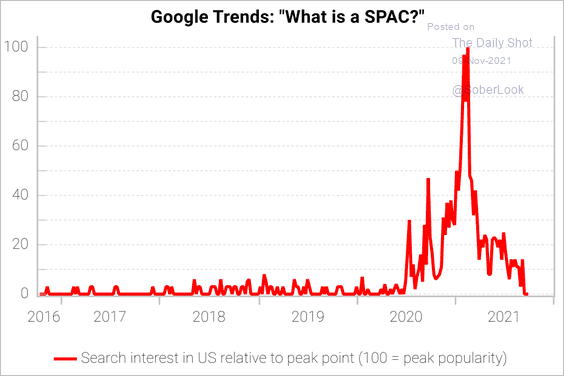 Source: Variant Perception
Back to Index
Rates
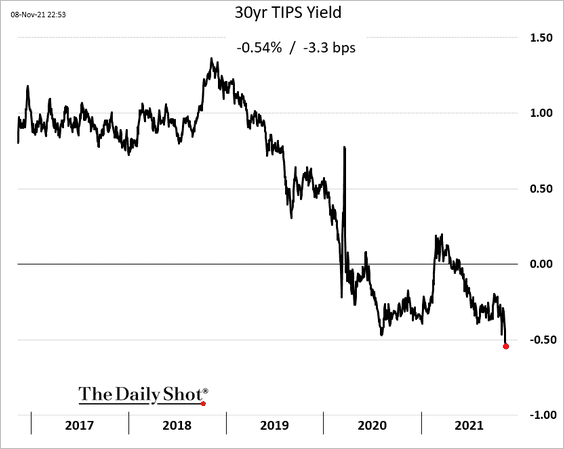
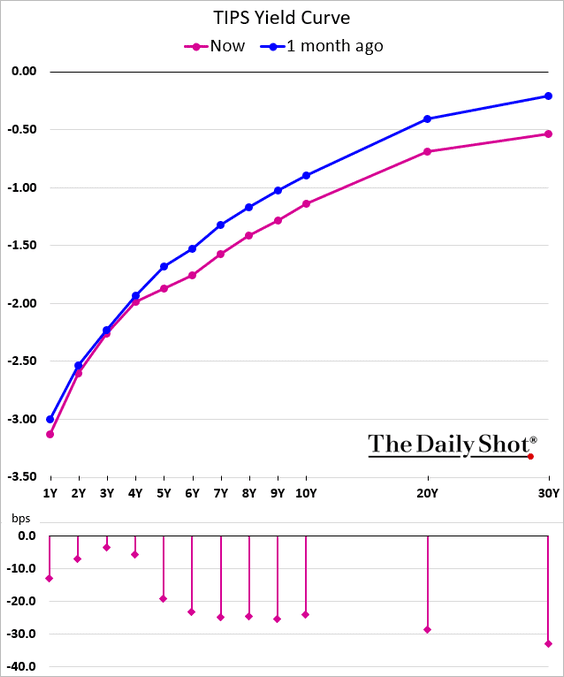
1. The 30yr TIPS yield (real rates) hit a record low. Nervous about inflation, investors have been bidding up inflation-linked Treasuries.
The TIPS curve flattened.
——————–
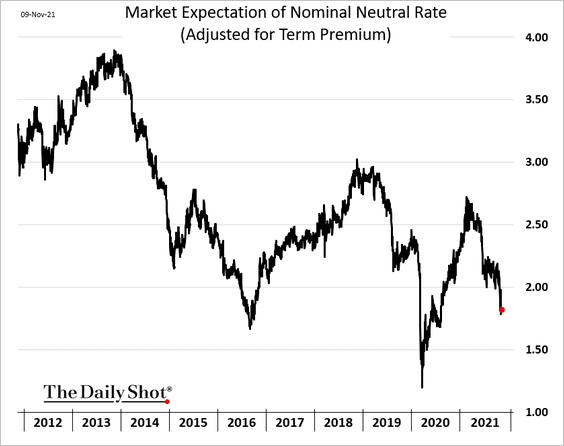
2. The market expectations for the nominal long-run rate (r*) is back below 2%.
Back to Index
Global Developments
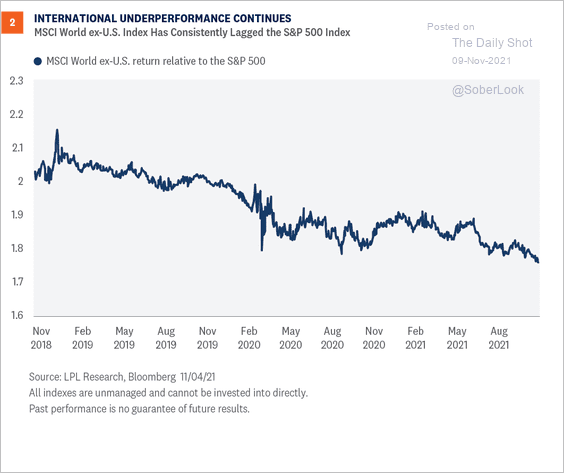
1. Global equity markets continue to underperform the S&P 500.
 Source: LPL Research
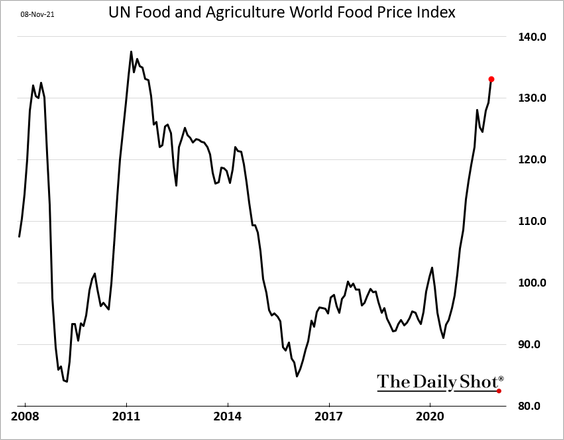
2. Food prices have been surging.
3. Global venture capital investment in the electric vehicle sector hit a record $17.8 billion in the first nine months of 2021.
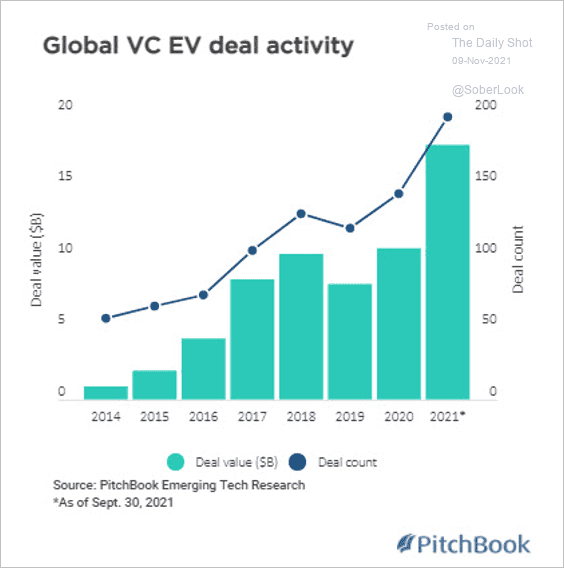 Source: PitchBook
——————–
Food for Thought
1. Aquaculture production:
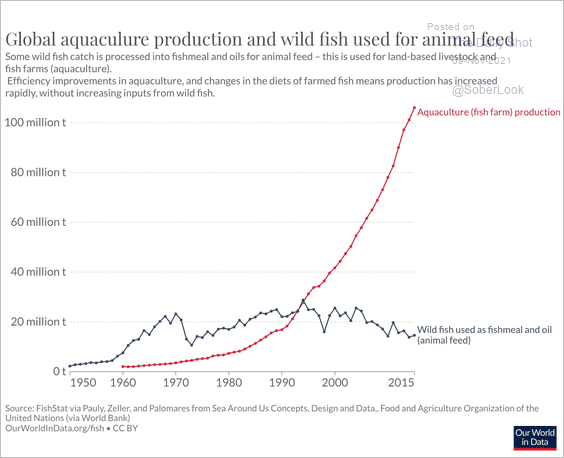 Source: @_HannahRitchie Read full article
2. Increasing droughts and floods in sub-Saharan Africa:
 Source: The World Bank Group Read full article
2. Share of the population unwilling to get vaccinated:
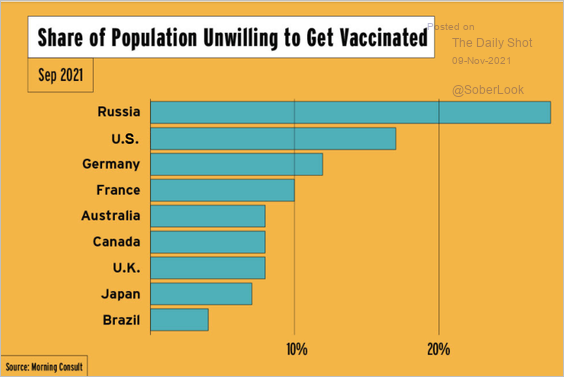 Source: Scott Galloway
3. Reported experience with anxiety/depression:
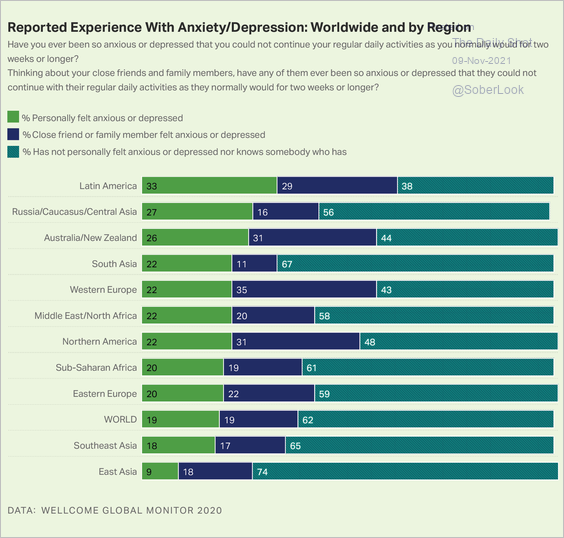 Source: Gallup Read full article
4. US retirements:
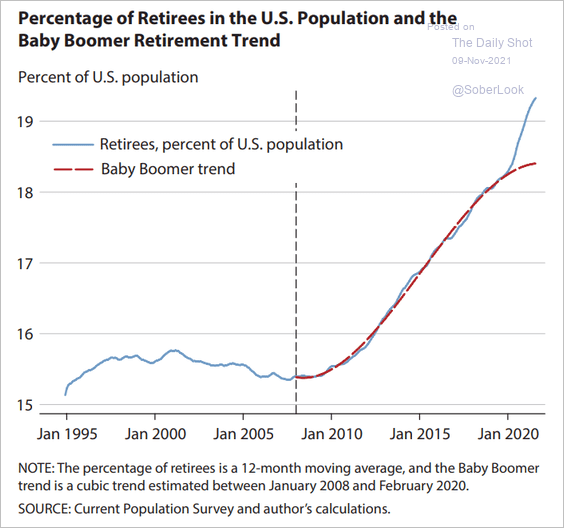 Source: Miguel Faria-e-Castro Read full article
5. Projected change in high school graduation rates:
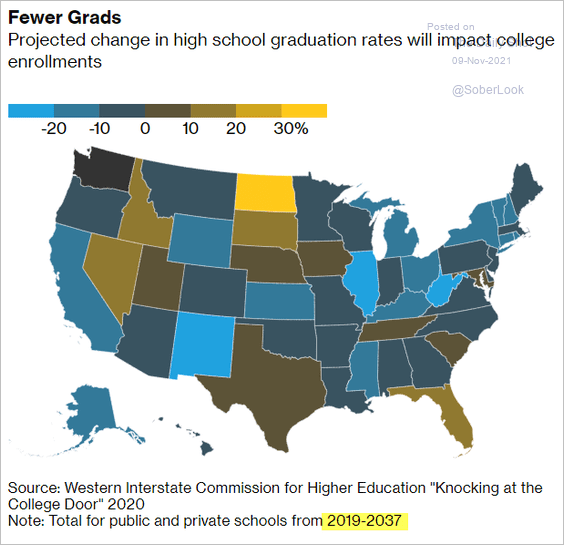 Source: Bloomberg Read full article
6. How long would $1 million last in retirement:
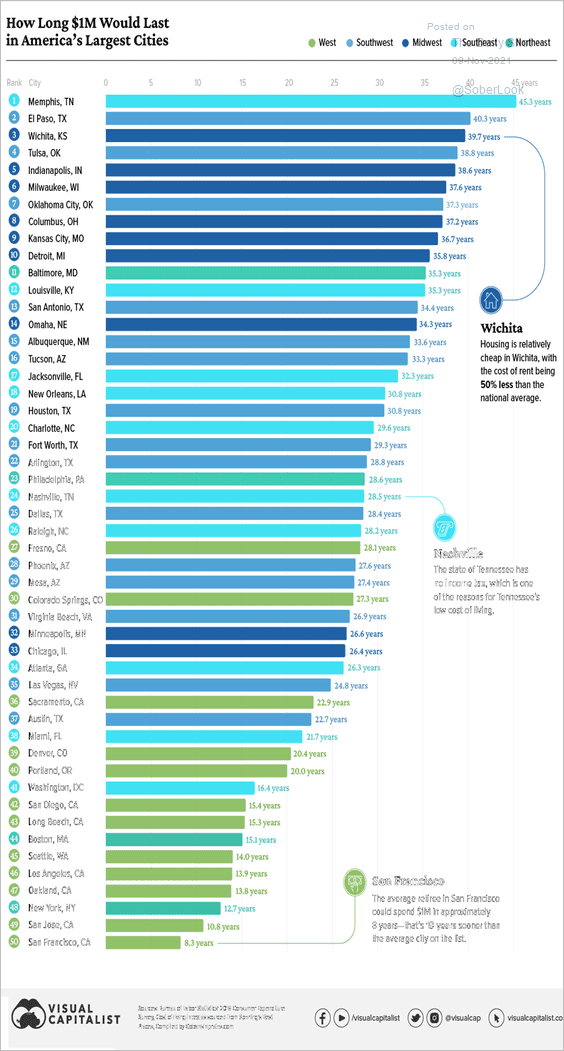 Source: Visual Capitalist Read full article
7. Tobacco products’ price evolution:
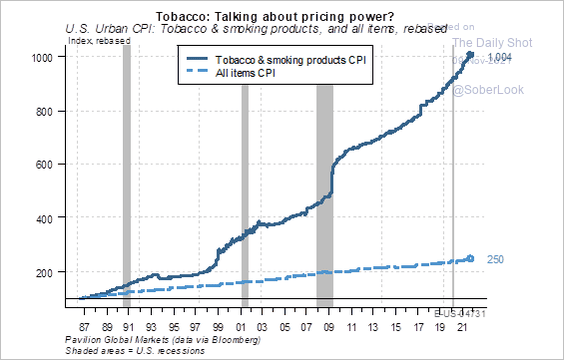 Source: Pavilion Global Markets
8. Top 100 companies by market capitalization:
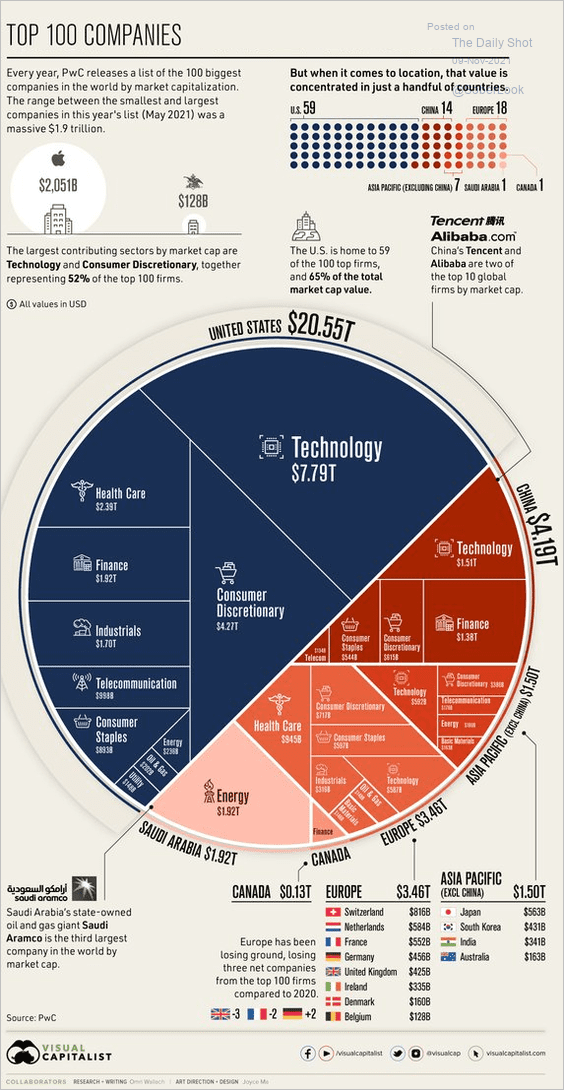 Source: @VisualCap Read full article
9. When do adult musical preferences set in?
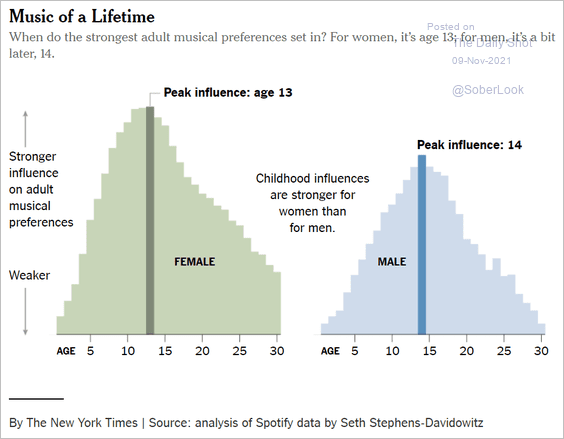 Source: The New York Times Read full article
——————–
Back to Index