
The Daily Shot: 17-Nov-21
• The United States
• Canada
• The United Kingdom
• The Eurozone
• Japan
• Asia – Pacific
• China
• Emerging Markets
• Cryptocurrency
• Commodities
• Energy
• Equities
• Rates
• Food for Thought
The United States
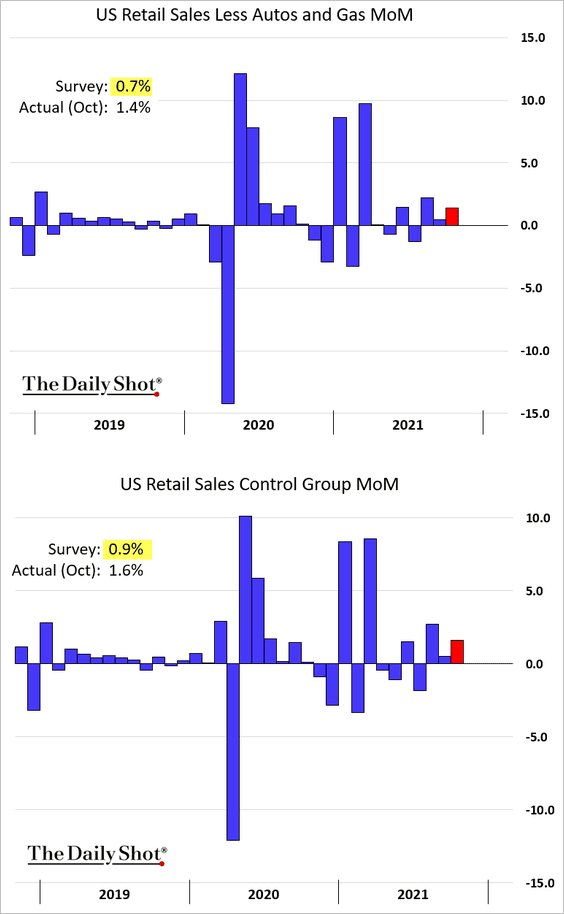
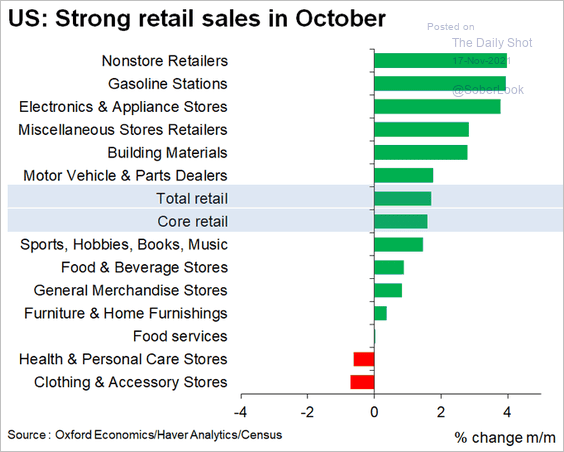
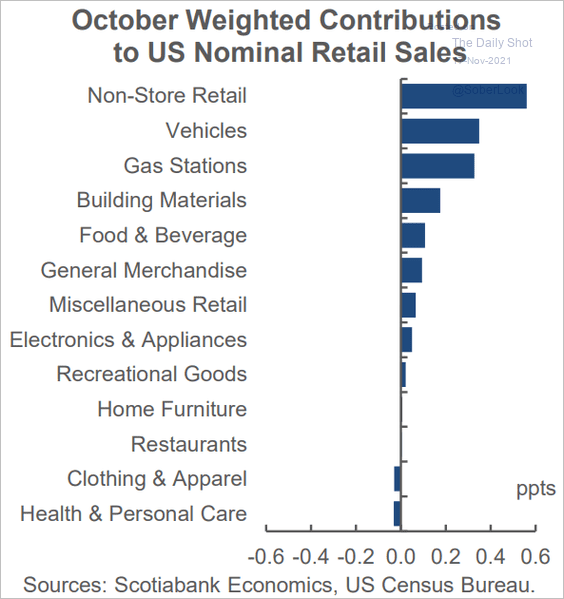
1. Retail sales were well above expectations in October, with consumers starting their holiday shopping early (apparently unfazed by higher prices).
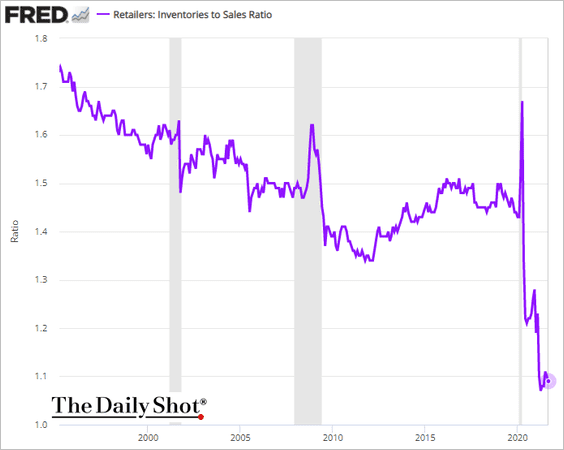
• The chart below illustrates why retailers and their suppliers can’t keep up.
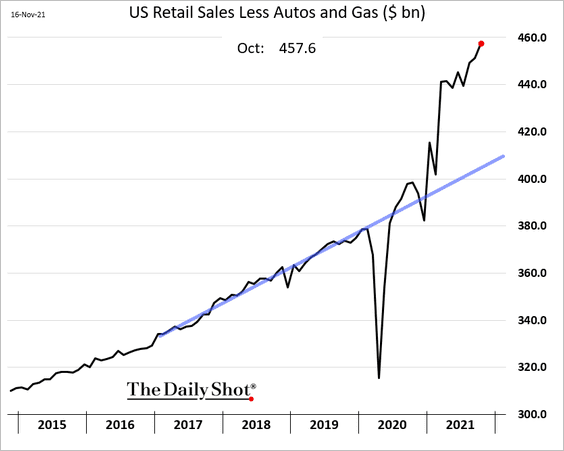
Retailers’ inventories-to-sales ratio remains depressed.
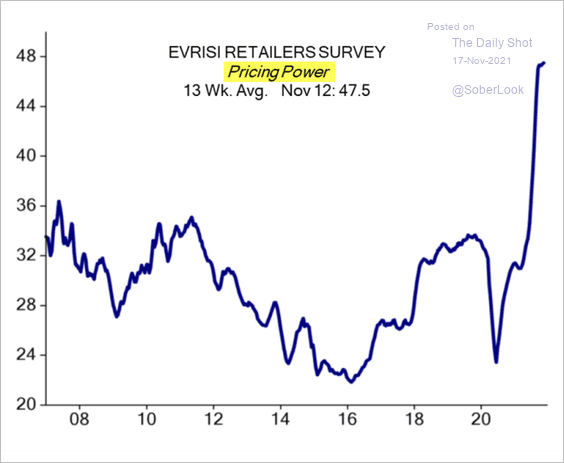
And for the first time in years, retailers have pricing power, …
 Source: Evercore ISI
… as sales surge.
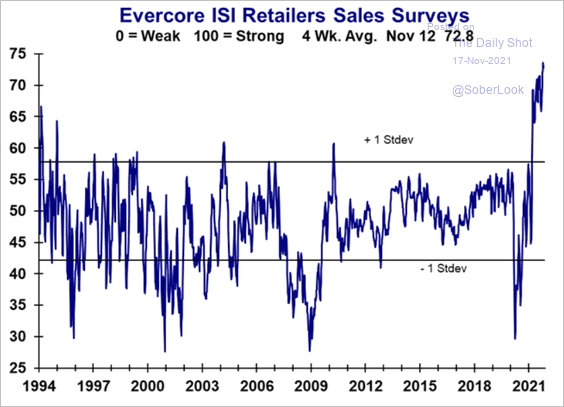 Source: Evercore ISI
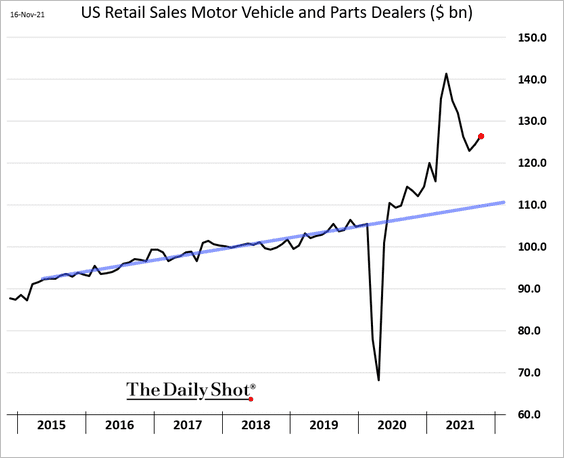
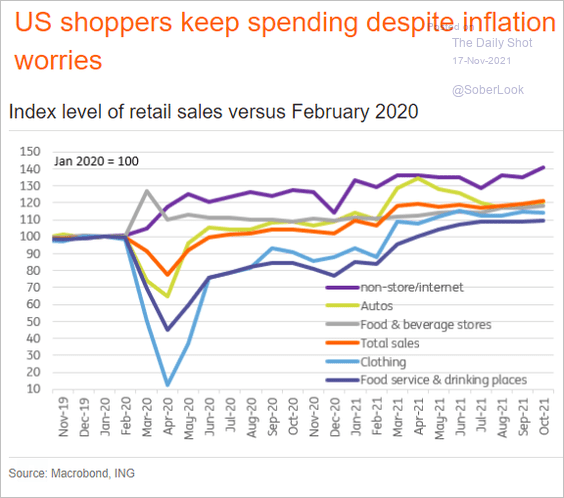
• Despite the U. Michigan’s collapsing buying conditions index, spending on automobiles rebounded and remained well above the pre-COVID trend.
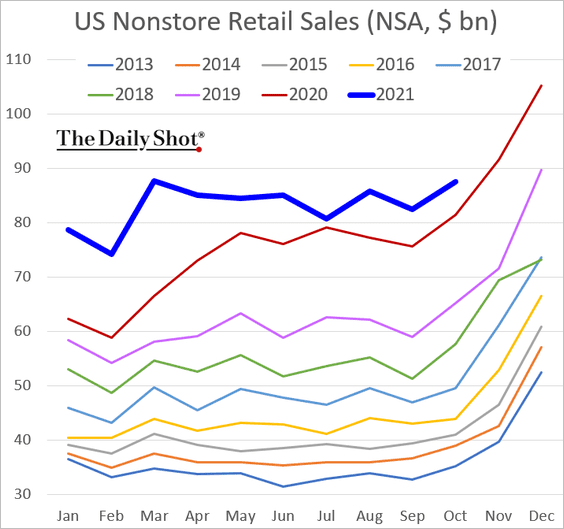
• Online spending is holding above the levels we saw in 2020.
• Next, we have the changes in retail sales by sector.
– Changes in October:
 Source: @GregDaco
– The weighted contributions to the total retail sales index:
 Source: Scotiabank Economics
– Select sector trends:
 Source: ING
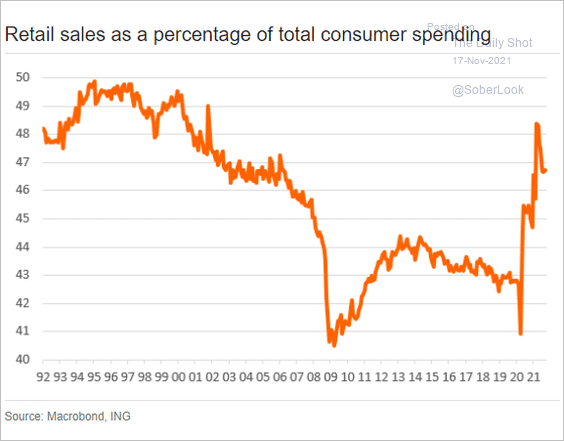
• Retail sales as a share of total consumer spending have risen since the start of the pandemic (a bigger contribution to the GDP).
 Source: ING
——————–
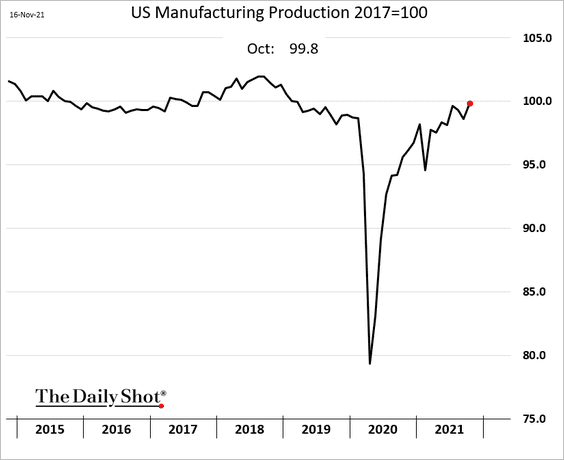
2. Industrial production also topped economists’ forecasts.
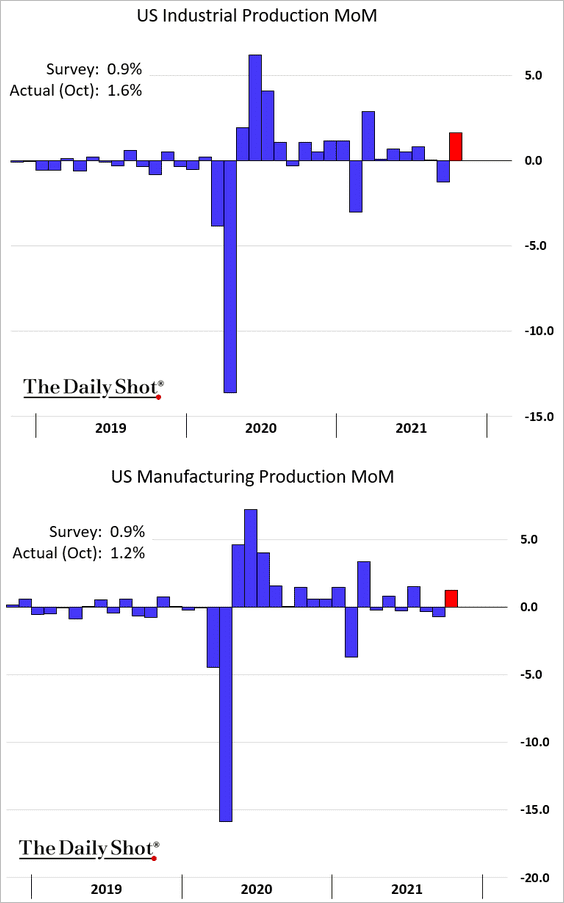
• Manufacturing output hit the highest level since early 2019.
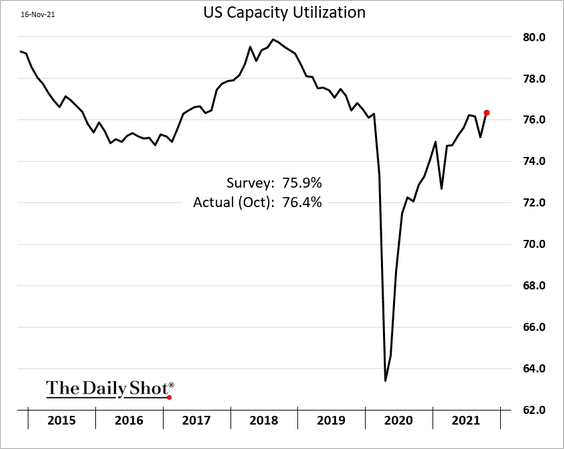
• Capacity utilization is back at pre-COVID levels as Hurricane Ida’s impact is reversed.
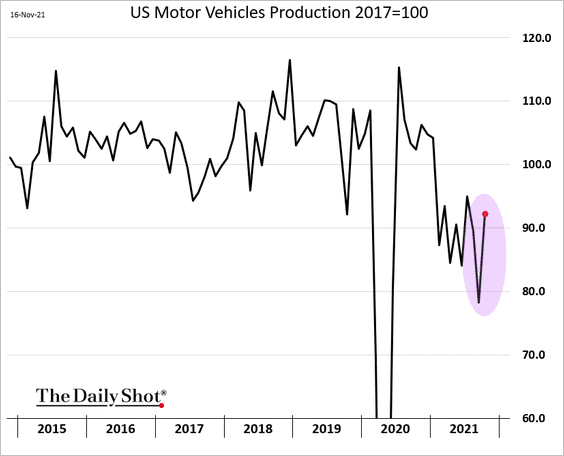
• Vehicle production rebounded sharply.
——————–
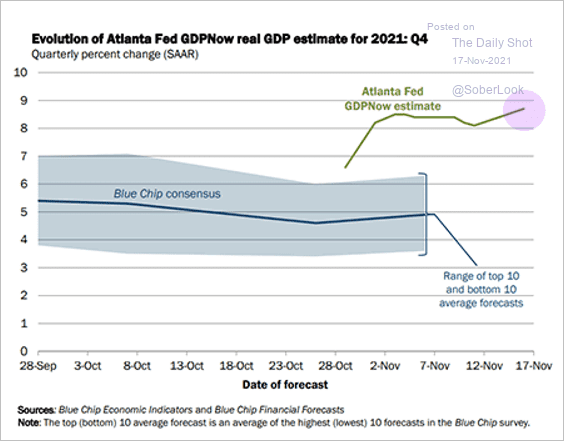
3. Strength in retail sales and industrial production further raised the Citi Economic Surprise Index (which got a boost from the ISM indicators at the beginning of the month).
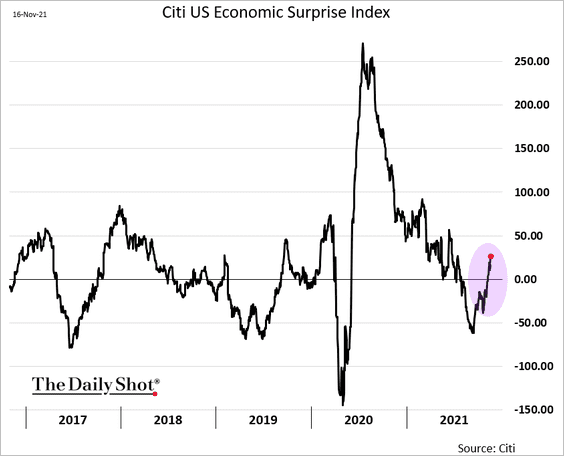
The Atlanta Fed’s GDPNow model has the Q4 growth at 8.7% (annualized).
 Source: Atlanta Fed
——————–
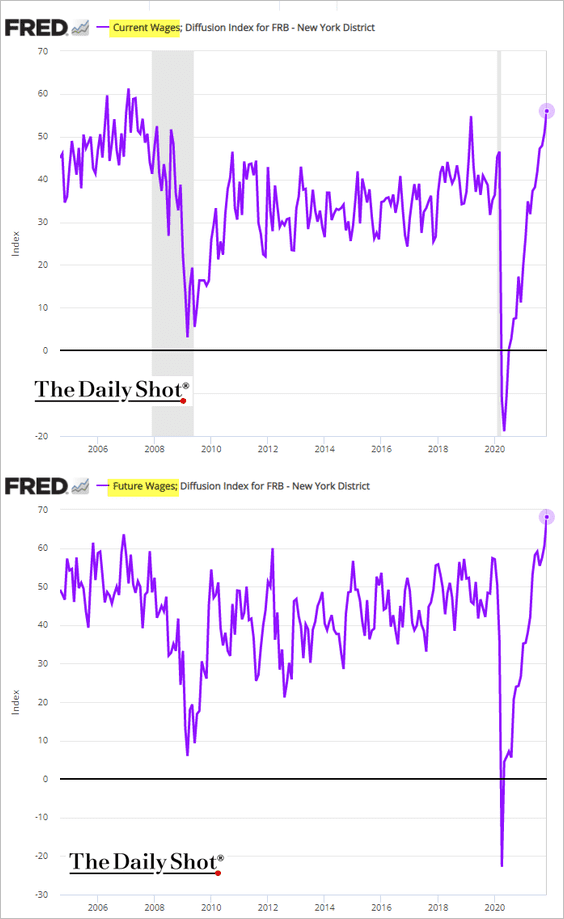
4. The NY Fed’s regional service-sector report continues to show rising price pressures …
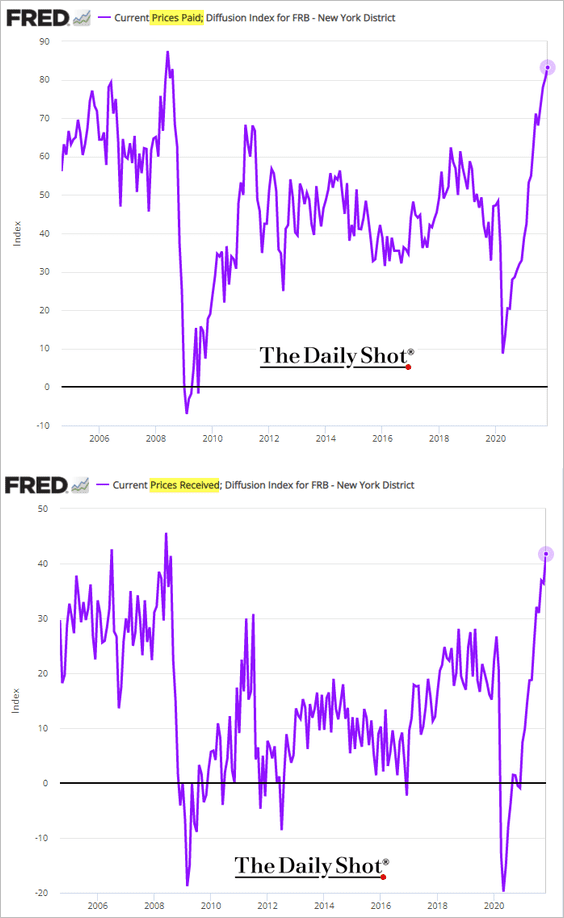
… and accelerating wage growth.
——————–
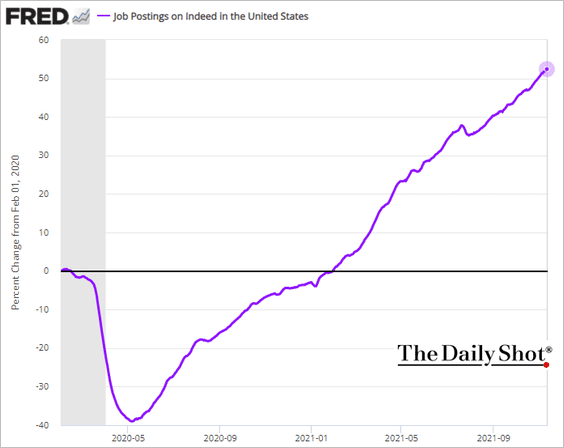
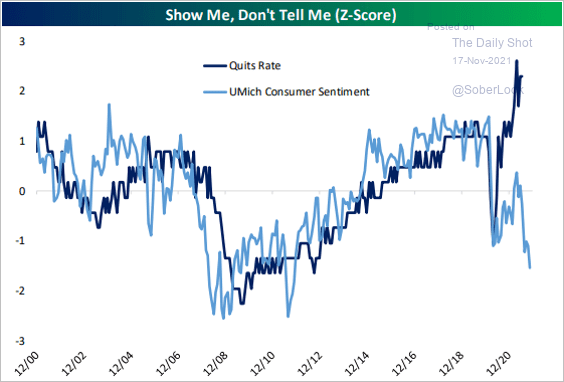
5. Next, we have some updates on the labor market.
• Job postings on Indeed are over 50% higher than they were just before the start of the pandemic.
• The U. Michigan sentiment indicator has deteriorated despite the labor market strength. The index tends to be more sensitive to inflation than other consumer gauges.
 Source: @bespokeinvest Read full article
• This chart shows employment by wage growth.
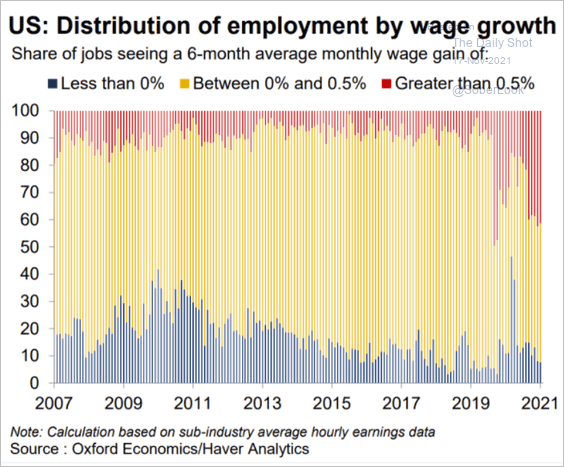 Source: Oxford Economics
——————–
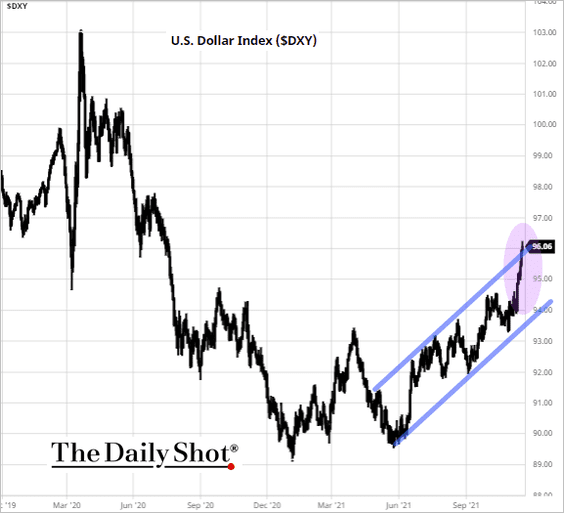
6. The US dollar continues to strengthen, which should help ease import price inflation.
 Source: barchart.com
7. Finally, let’s take a look at some trends in the housing market.
• Homebuilder sentiment is rebounding after the recent pullback as demand improves.

• The U. Michigan index of buying conditions for houses hit another low this month.
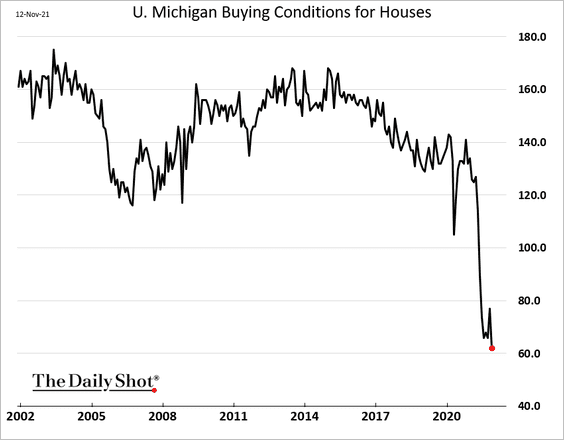
Despite the complaints about high prices, the US demand for homes is exceptional.
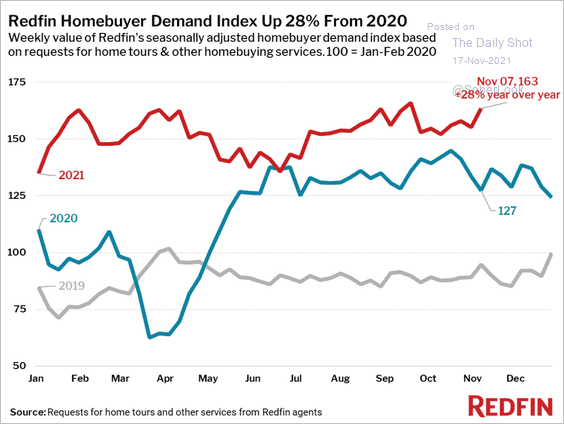 Source: Redfin
——————–
• Homes are selling quickly.
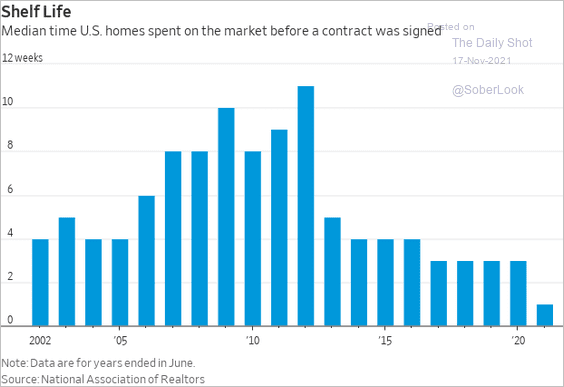 Source: @WSJ Read full article
• Why are homeowners taking money out of their home equity?
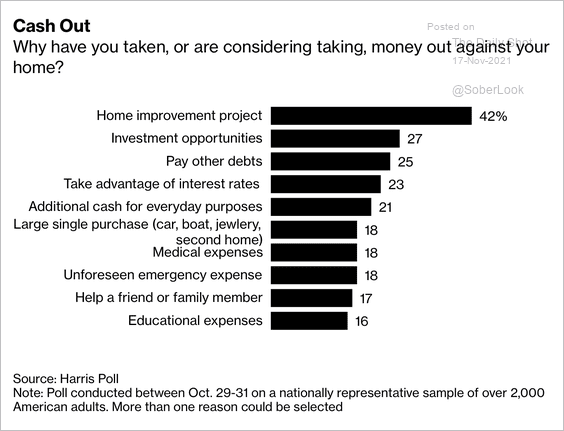 Source: @jessefelder; Bloomberg Read full article
• House rents are up sharply this year across all price categories.
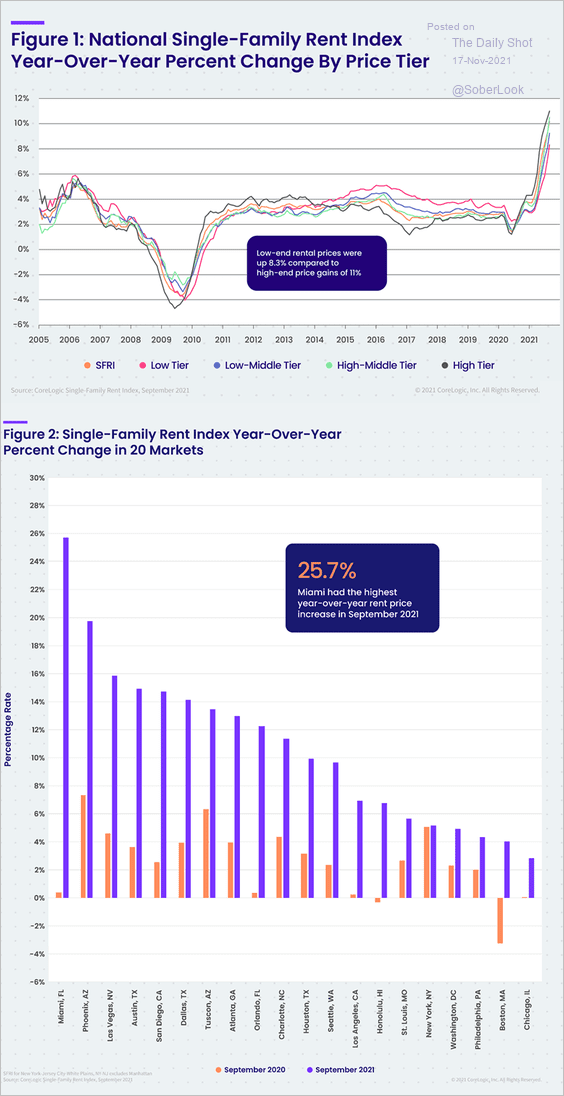 Source: CoreLogic
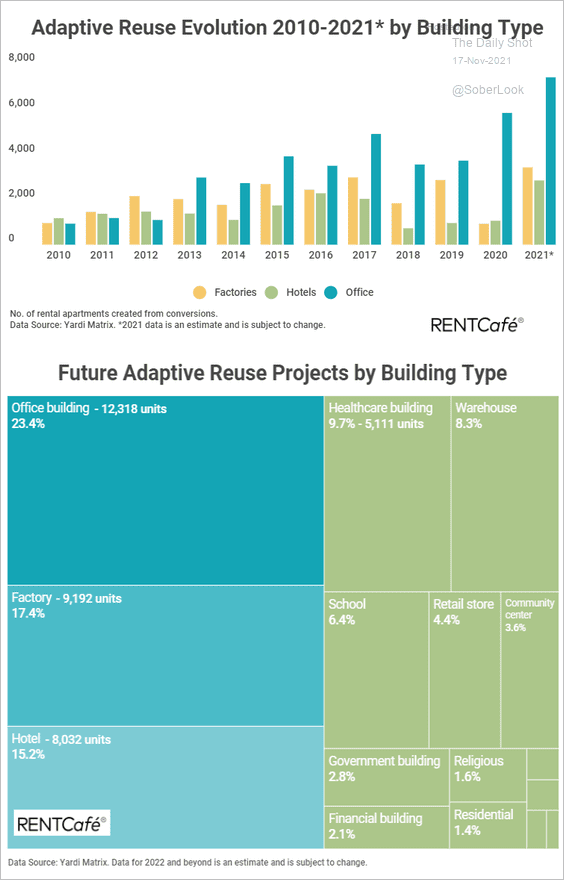
• Commercial properties are rapidly being converted into residential space.
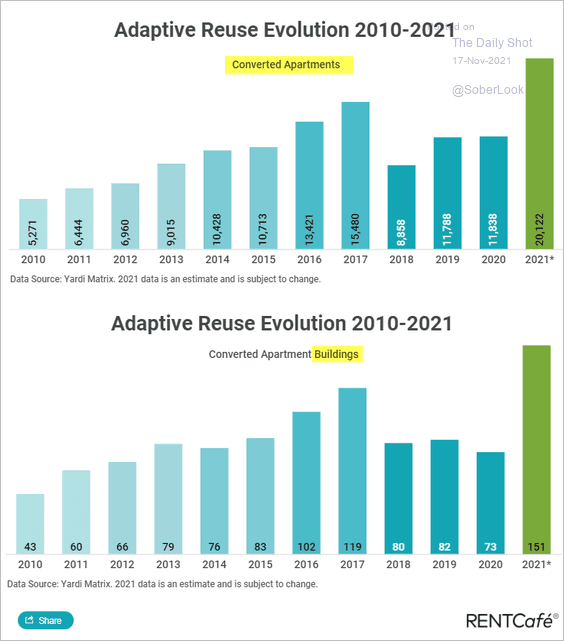 Source: RentCafe; h/t @axios Read full article
 Source: RentCafe; h/t @axios Read full article
Back to Index
Canada
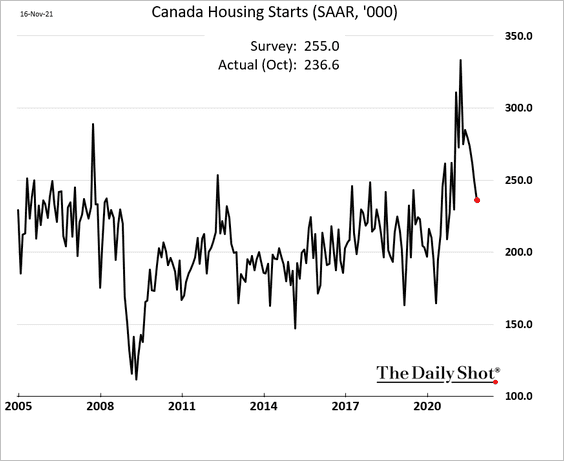
1. Housing starts are returning to more sustainable levels.
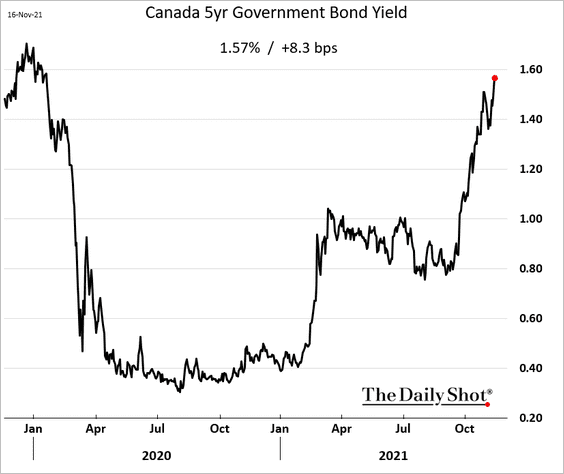
2. Bond yields continue to climb.
Back to Index
The United Kingdom
1. Payrolls have been rebounding, …
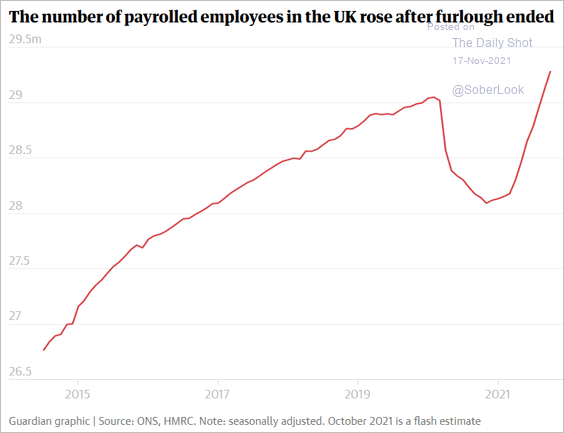 Source: The Guardian Read full article
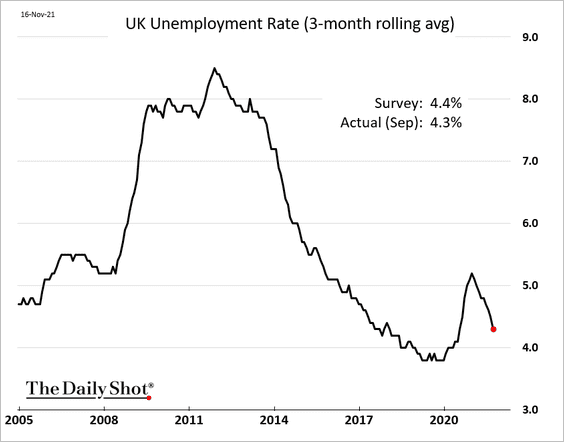
… as the unemployment rate drops.
Wages eased, pointing to more part-time jobs.
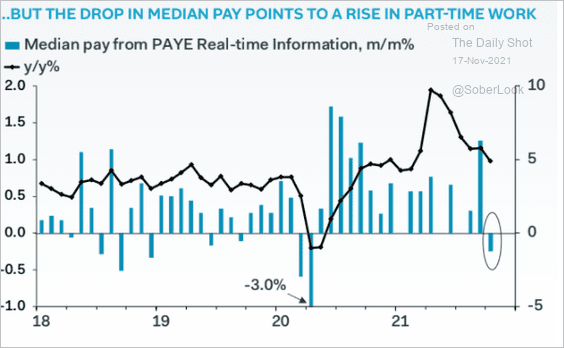 Source: Pantheon Macroeconomics
——————–
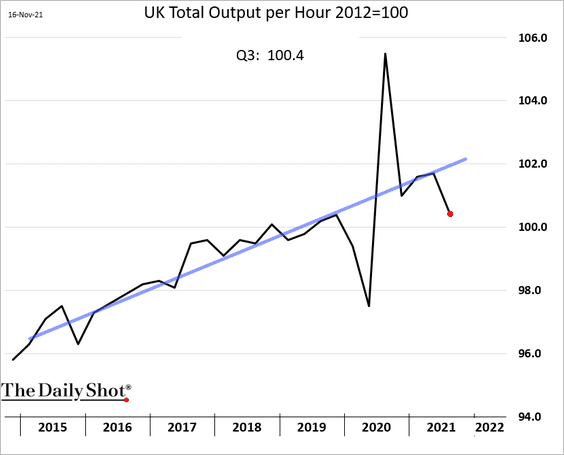
2. Productivity dipped below the pre-COVID trend.
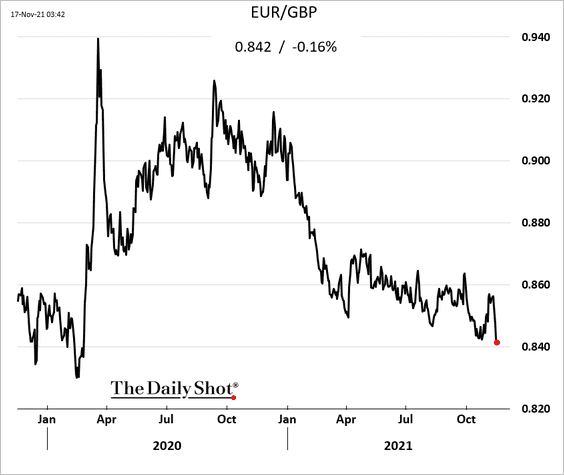
3. Inflation surprised to the upside – more on this tomorrow.
The euro hit the weakest level against the pound since the start of the pandemic.
Back to Index
The Eurozone
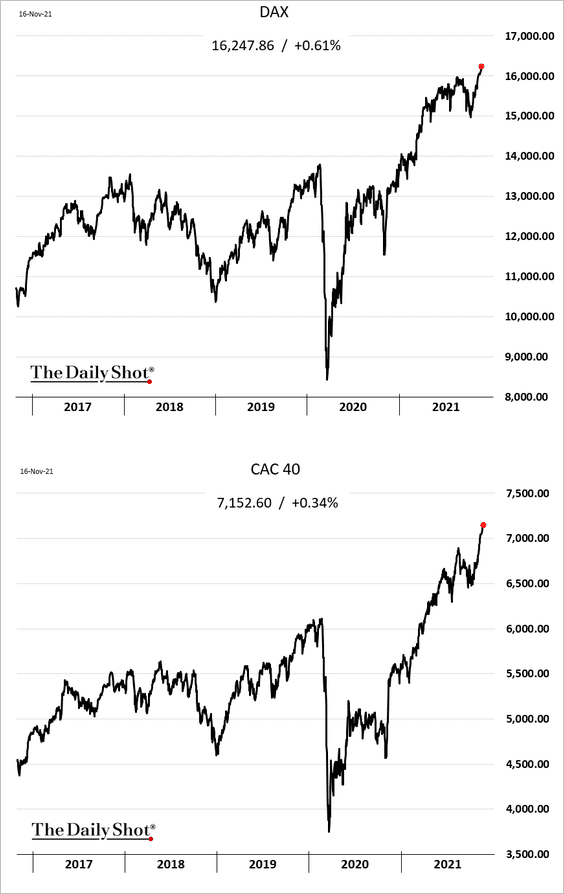
1. Equity indices are hitting record highs.
2. The euro continues to weaken as US economic data surprises to the upside (2nd panel).
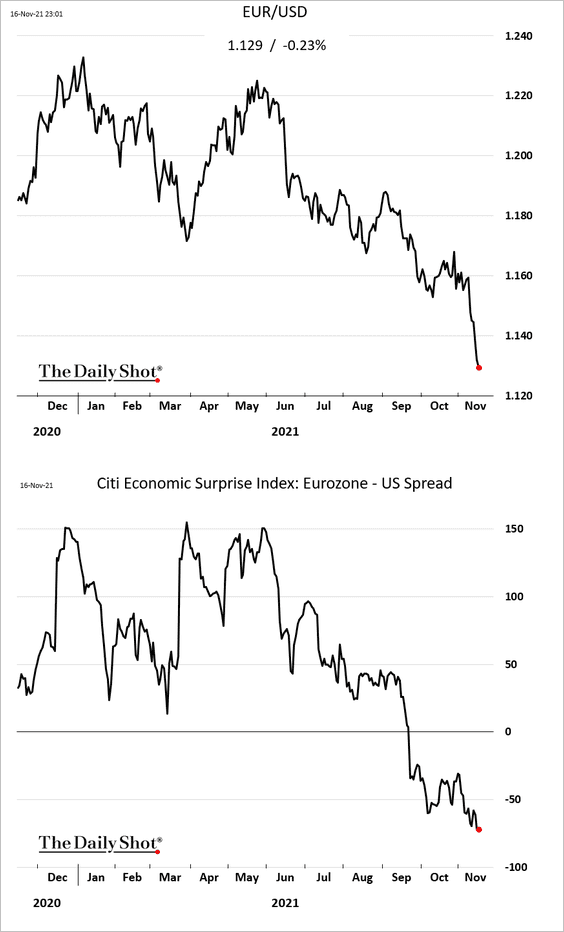 h/t @vkaramanis_fx
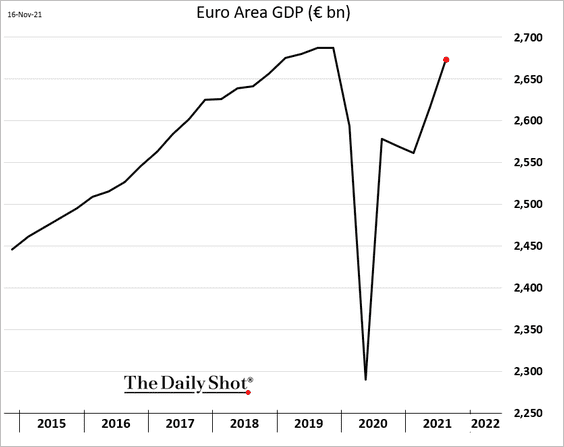
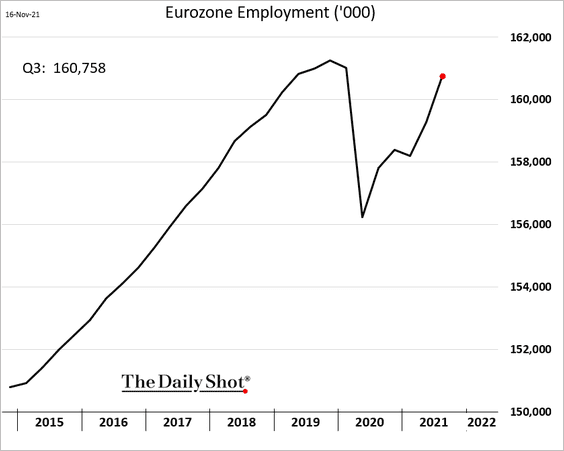
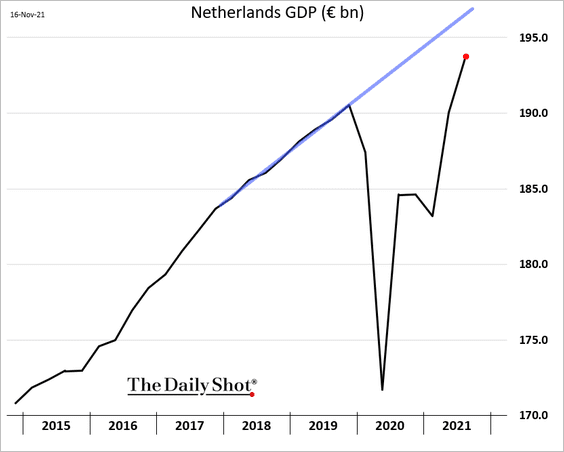
3. GDP and employment indices are approaching pre-COVID levels.
Dutch GDP is surging.
——————–
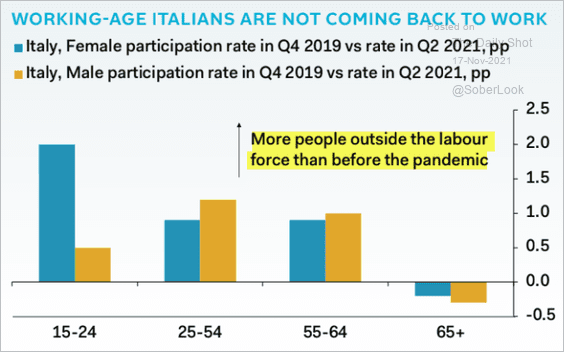
4. This chart shows the pandemic-era changes in Italy’s labor force participation.
 Source: Pantheon Macroeconomics
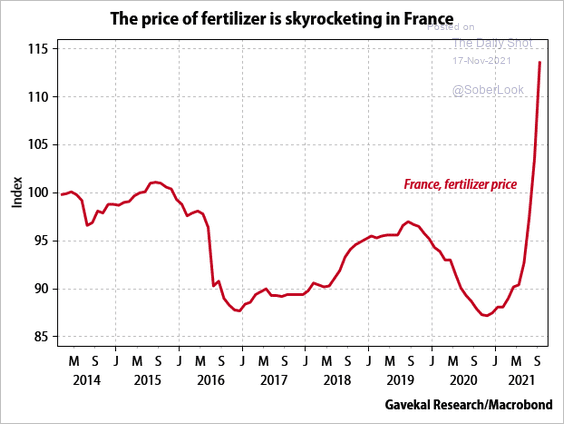
5. French fertilizer prices are soaring, which will drive up food inflation.
 Source: Gavekal Research
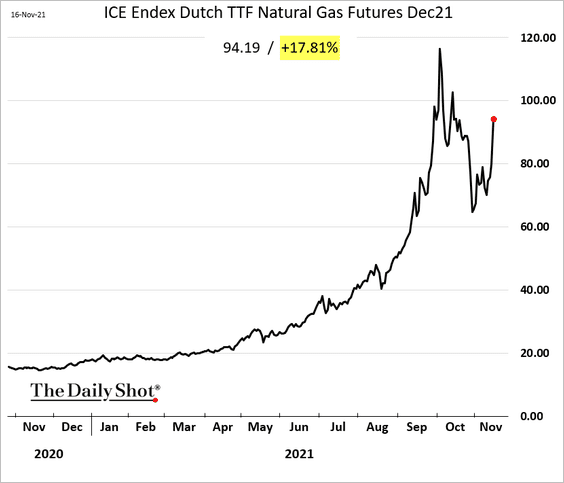
6. Natural gas prices surged as German authorities put a hold on Nord Stream 2.
 Source: Reuters Read full article
——————–
7. Euro-area broad financing conditions remain favorable at current levels, according to Barclays.
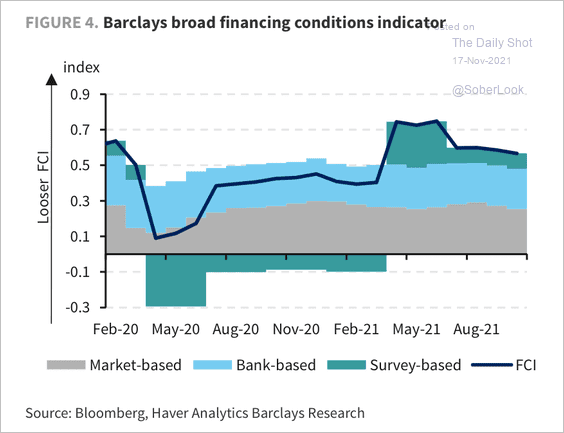 Source: Barclays Research
Back to Index
Japan
1. Dollar-yen is testing resistance.
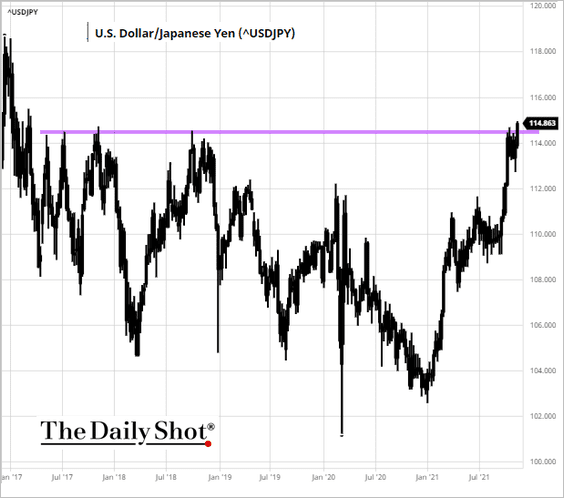 Source: barchart.com
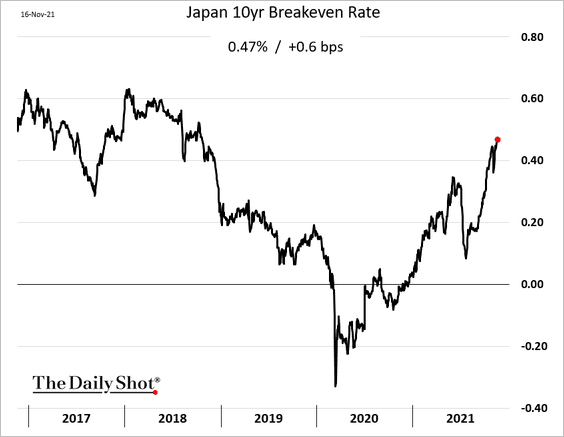
2. Market-based inflation expectations continue to climb.
3. Speculative accounts have unwound their bets on Nikkei futures.
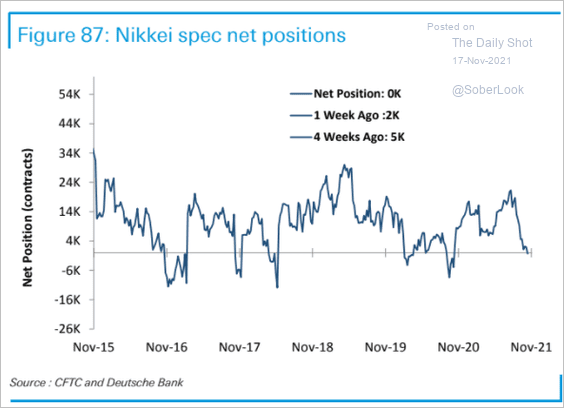 Source: Deutsche Bank Research
4 The COVID situation is under control.
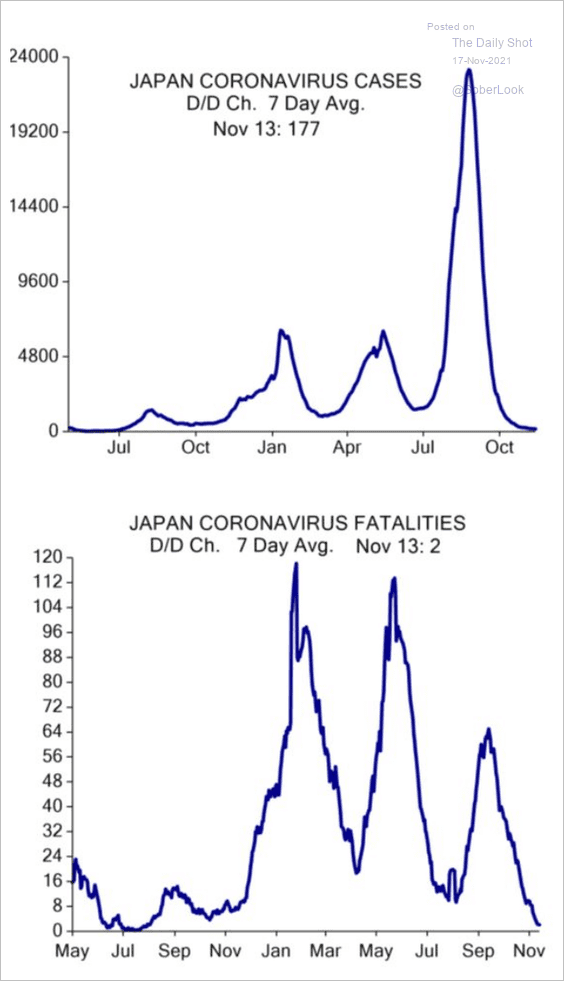 Source: Evercore ISI
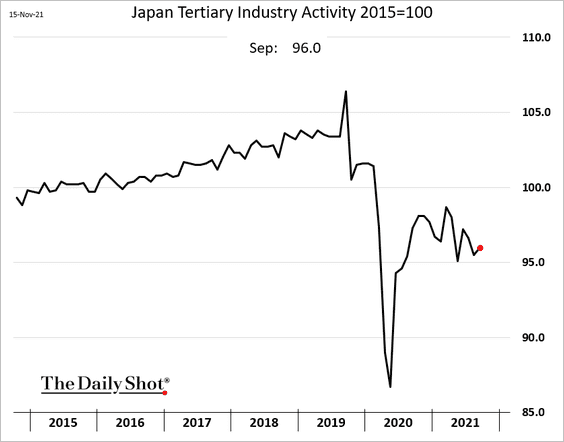
5. Nonetheless, service sector activity remains depressed.
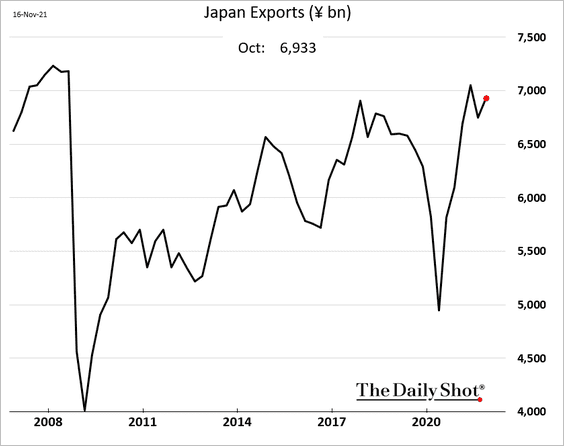
6. Exports strengthed last month.
7. Economic growth should rebound this quarter.
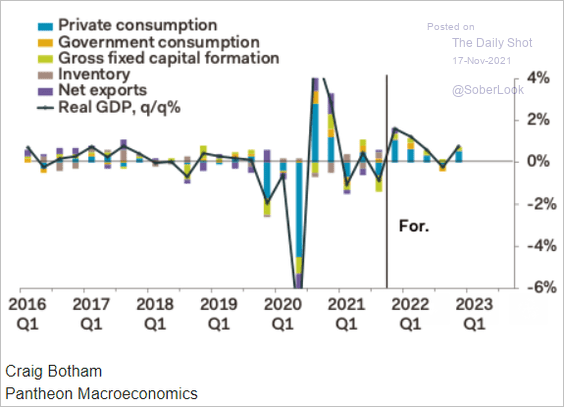 Source: Pantheon Macroeconomics
Back to Index
Asia – Pacific
1. Inflation pressures are broadening in South Korea, supporting a more hawkish central bank stance.
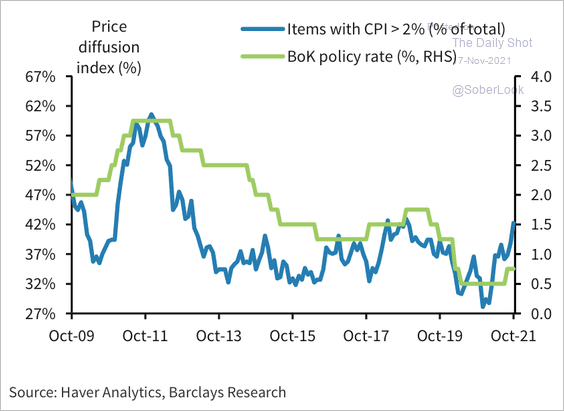 Source: Barclays Research
2. Singapore’s exports have strenghened.
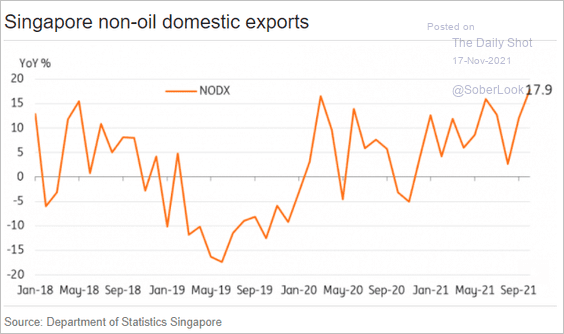 Source: ING
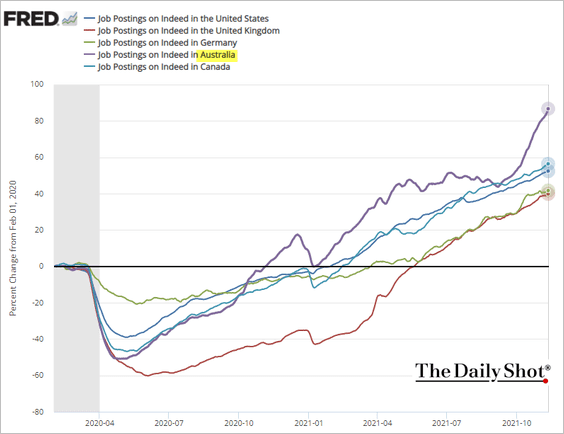
3. Australia’s job postings are outpacing other advanced economies.
Back to Index
China
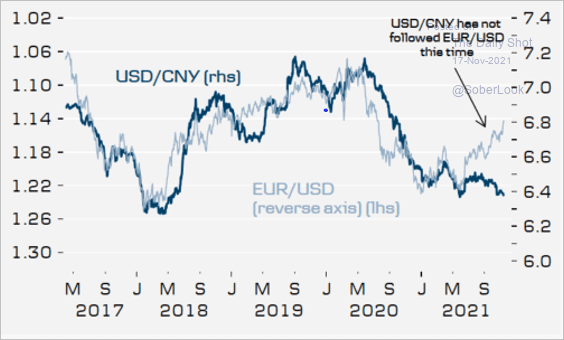
1. The US dollar rally is boosting the renminbi against other currencies. This trend will be a drag on China’s exports.
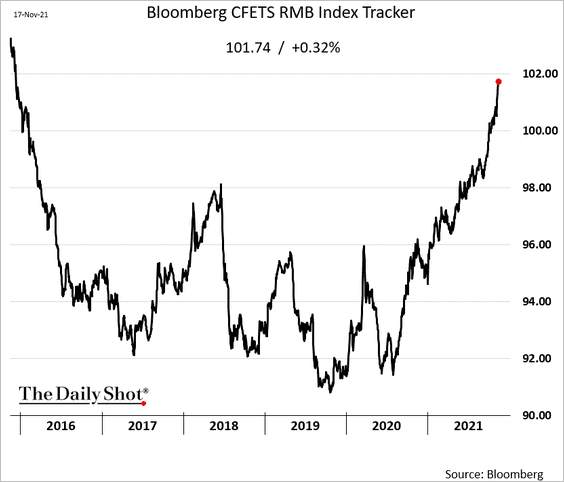
For example, China’s products are becoming more expensive in Europe.
 Source: @Avonmehren
——————–
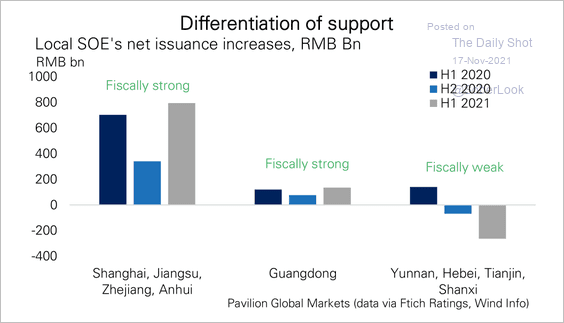
2. State-owned enterprise (SOE) debt has grown to about 130% of GDP.
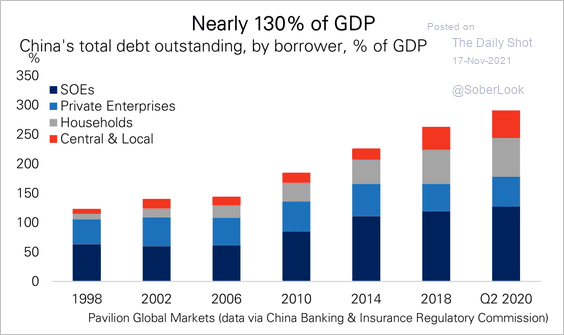 Source: Pavilion Global Markets
There was a sharp rise in SOE bond defaults last year.
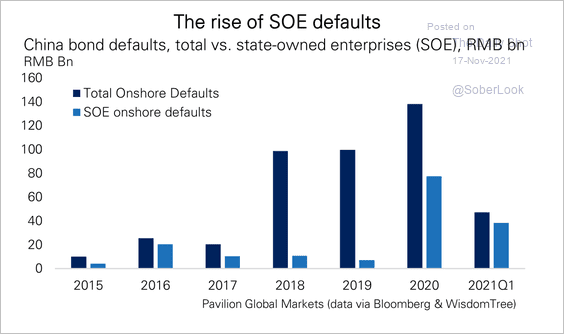 Source: Pavilion Global Markets
Net issuance by local authorities with a stronger fiscal backdrop bounced back strongly during the first half of this year.
 Source: Pavilion Global Markets
——————–
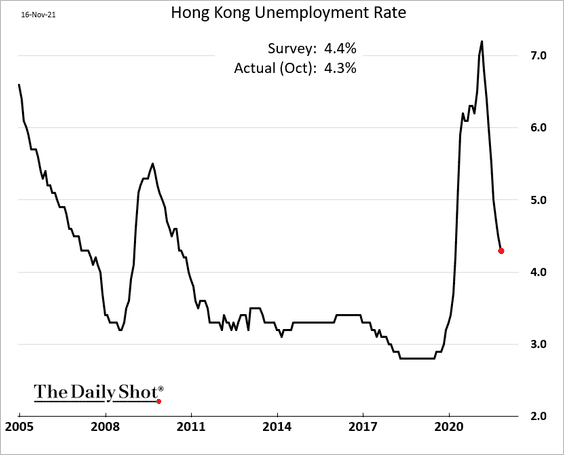
3. Hong Kong’s unemployment rate continues to drop.
Back to Index
Emerging Markets
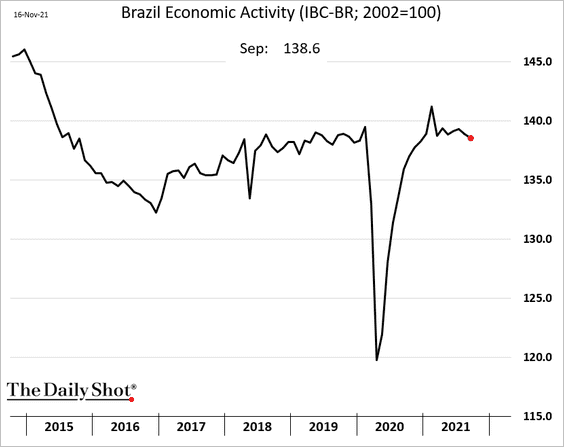
1. Brazil’s economic activity eased further in September, although the decline wasn’t as severe as some analysts feared.
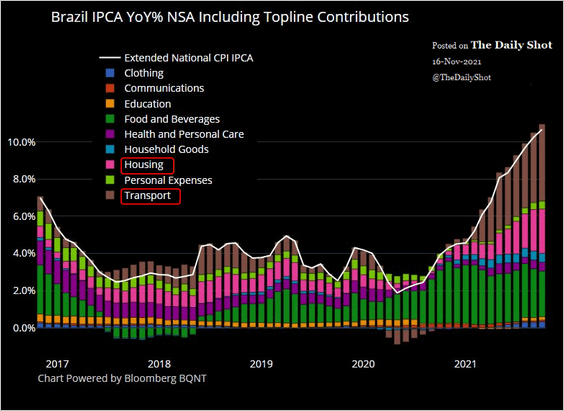
Here are the contributions to Brazil’s CPI.
 Source: @M_McDonough
——————–
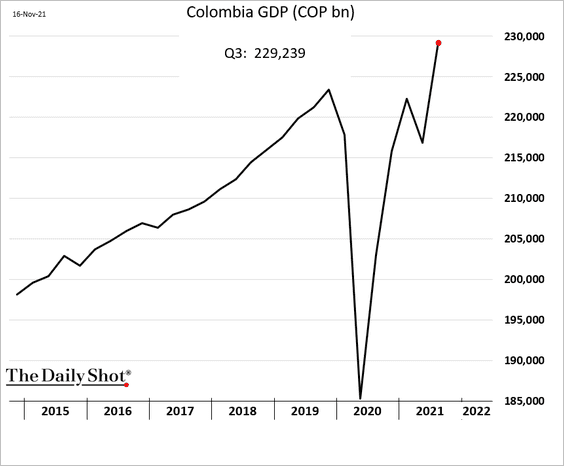
2. Colombia’s GDP is surging.
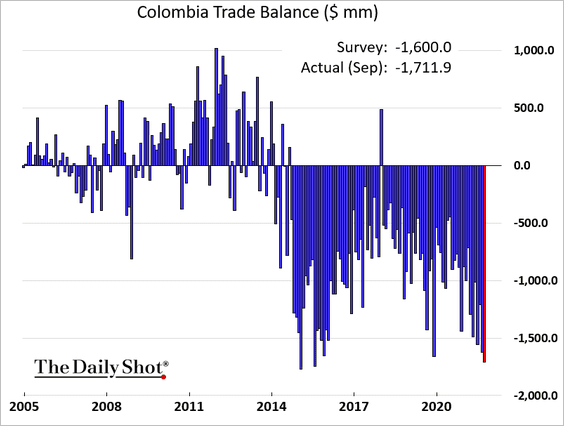
The nation’s trade deficit is near record highs.
——————–
3. EM central banks continue to hike rates.
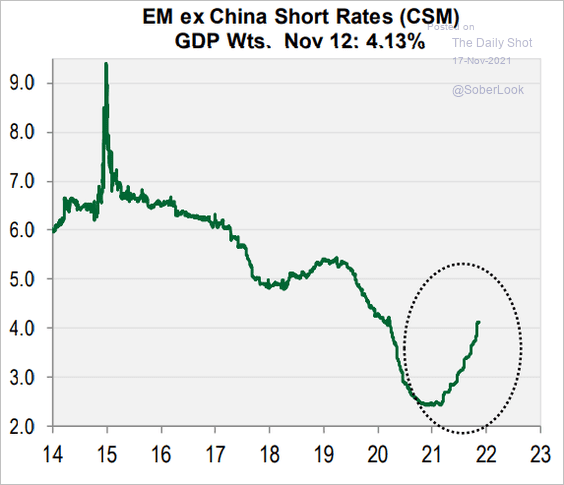 Source: Cornerstone Macro
4. Fund managers are under-allocated EM equities.
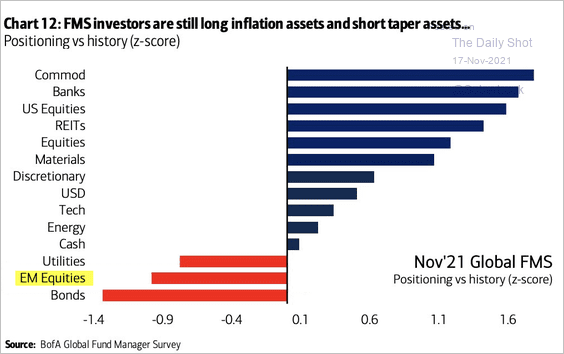 Source: BofA Global Research
Back to Index
Cryptocurrency
1. Major cryptocurrencies have been in the red in recent days.
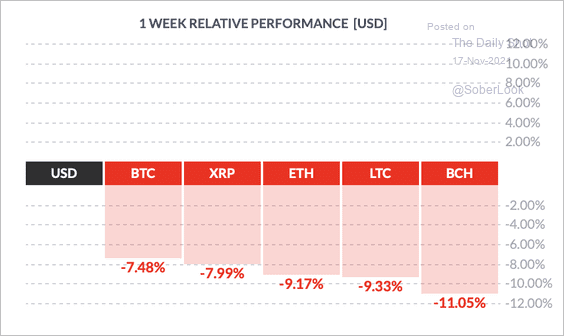 Source: FinViz
Bitcoin is back below $60k.
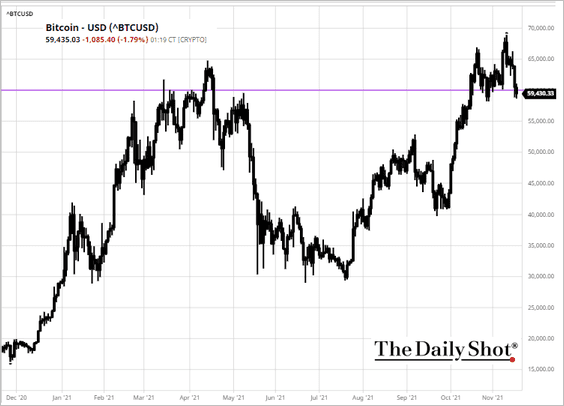 Source: barchart.com
And ether is about to test support at $4k.
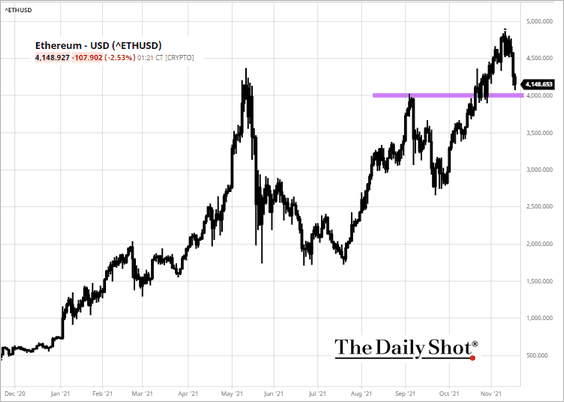 Source: barchart.com
——————–
2. The Bitcoin Fear & Greed Index is starting to fall from the highest level since September.
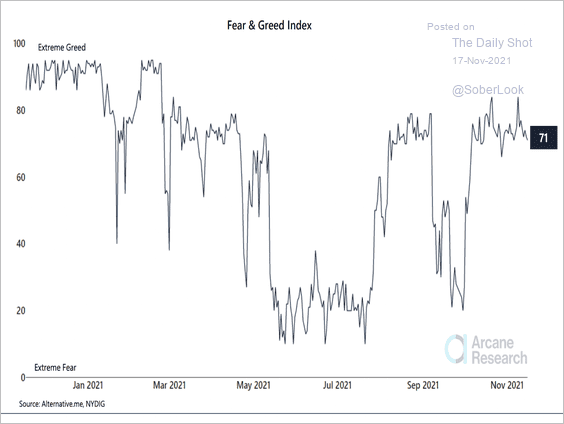 Source: Arcane Research Read full article
3. MRB’s crypto momentum index has been rising from oversold levels last month and is now only mildly overbought.
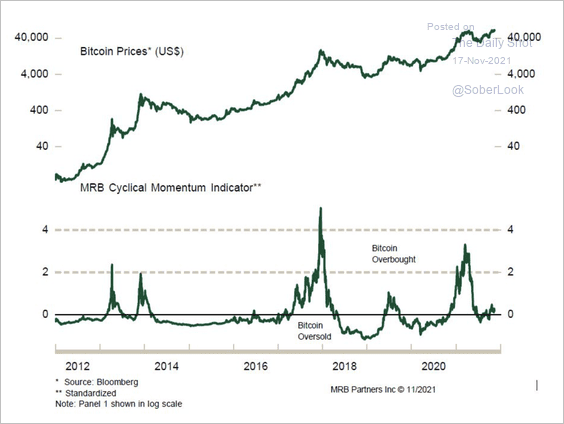 Source: Santiago Espinosa; MRB Partners
4. VanEck’s futures-based bitcoin ETF (XBTF) is off to a slow start.
 Source: CoinDesk Read full article
5. This chart shows where fund managers see bitcoin over the next 12 months.
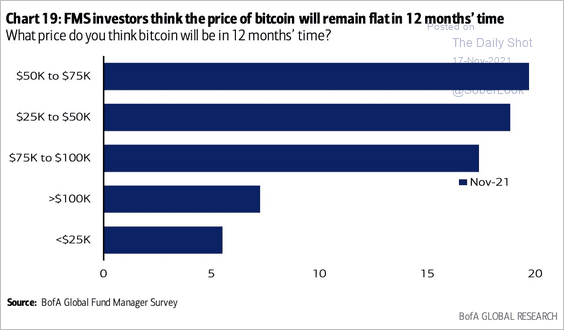 Source: BofA Global Research
Back to Index
Commodities
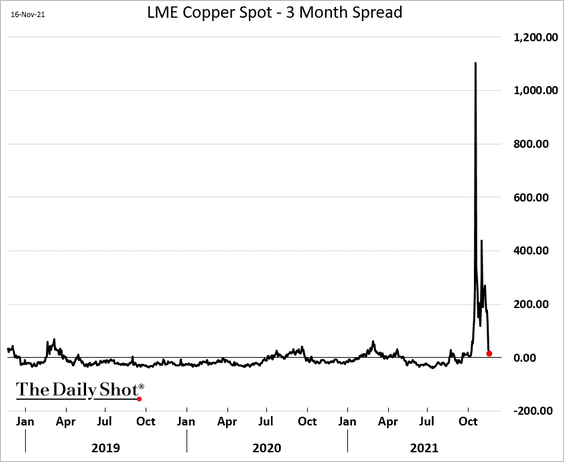
1. Copper backwardation is normalizing.
2. The last time the Bloomberg Commodity Spot Index went more than 400 days without setting a one-year low was Sep. 2017, which led to an additional eight months of higher commodity prices, according to SentimenTrader.
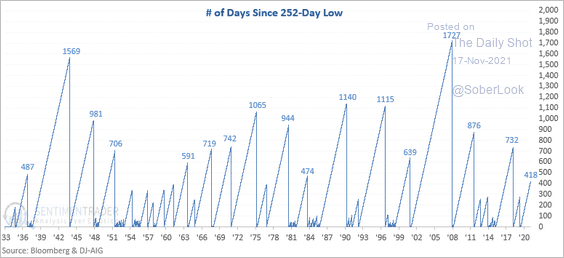 Source: SentimenTrader
3. Industrial metals could come under further pressure due to weak construction activity in China.
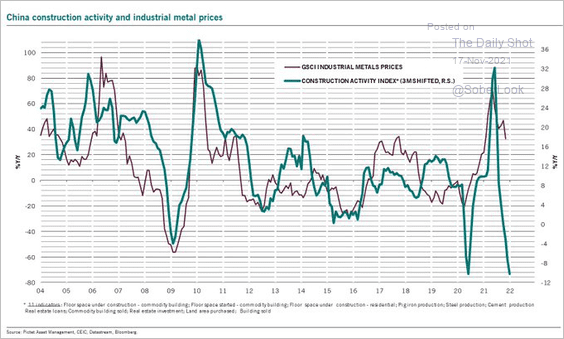 Source: @PkZweifel
Back to Index
Energy
1. Correlation between natural gas and coal has been surging, while oil-coal correlation dipped into negative territory.
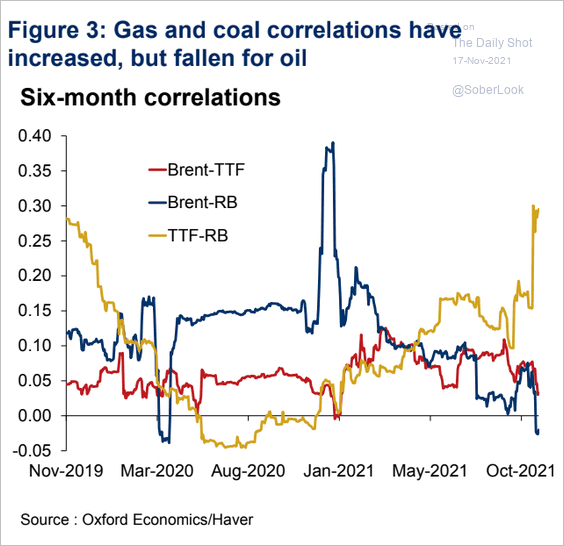 Source: Oxford Economics
2. Flows into energy stocks surged.
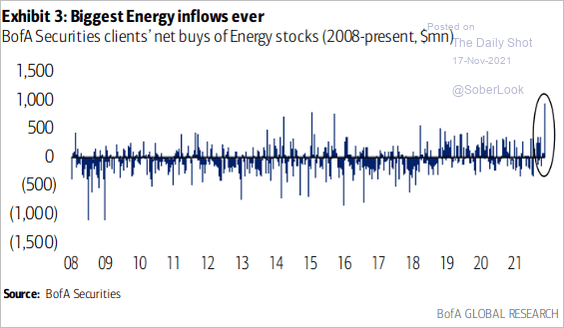 Source: BofA Global Research
3. OECD crude oil inventories remain well below the five-year range.
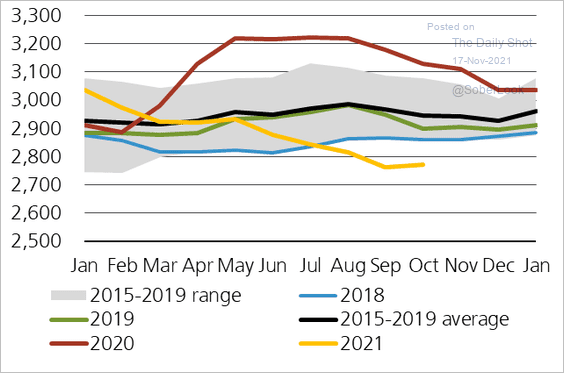 Source: @IEA, @staunovo
Back to Index
Equities
1. Tech stocks are breaking out relative to S&P 500.
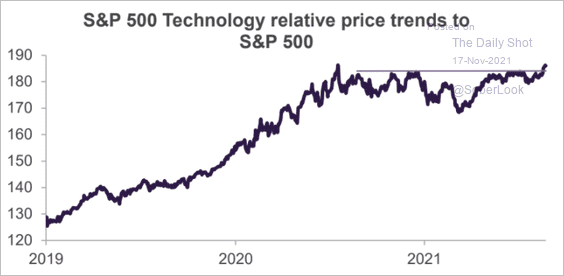 Source: Truist Advisory Services
2. Here is a look at assets under management for US inflation-themed ETFs …
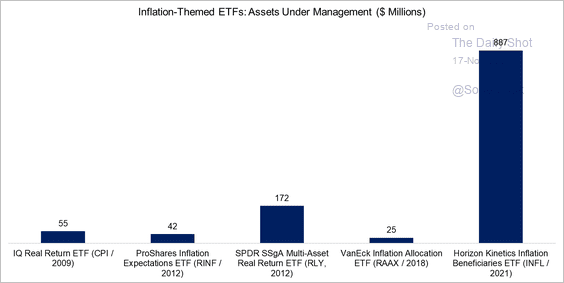 Source: FactorResearch Read full article
… and a breakdown by asset class.
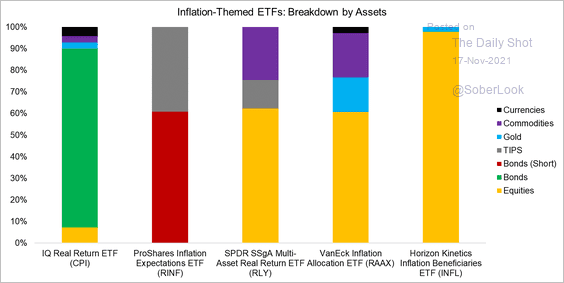 Source: FactorResearch Read full article
By the way, companies continue to ring alarm bells about inflation.
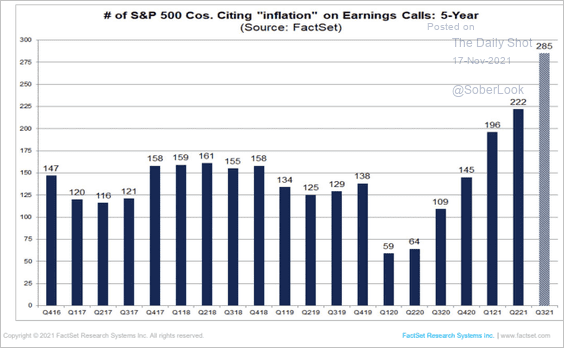 Source: @FactSet Read full article
——————–
3. Growth and value stock valuations continue to diverge.
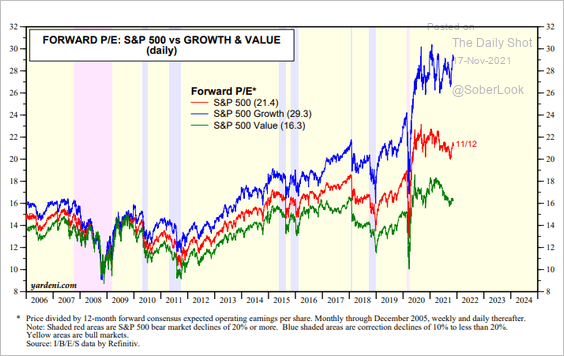 Source: Yardeni Research
4. Tech mega-caps are now 30% of the S&P 500 market cap.
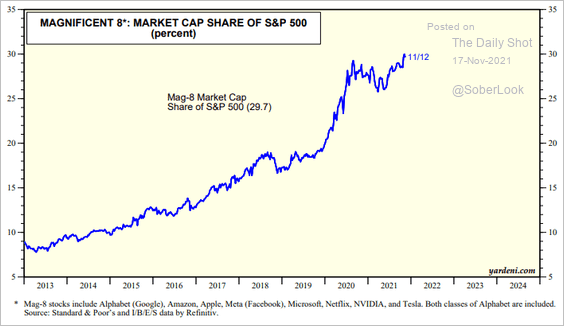 Source: Yardeni Research
This chart shows the S&P 500 P/E ratio with and without the tech mega-caps.
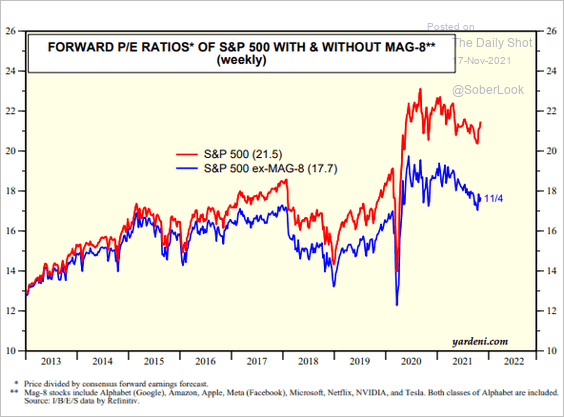 Source: Yardeni Research
——————–
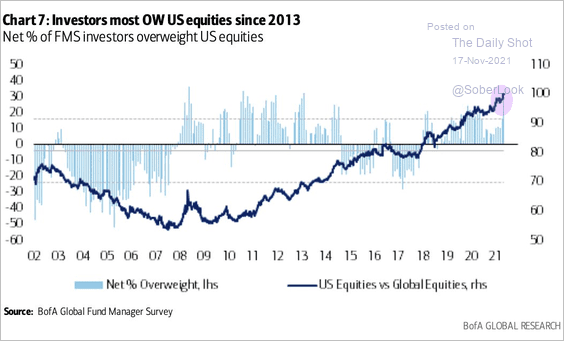
5. Fund managers are putting the pedal to the metal, with significant allocations to stocks (OW = overweight).
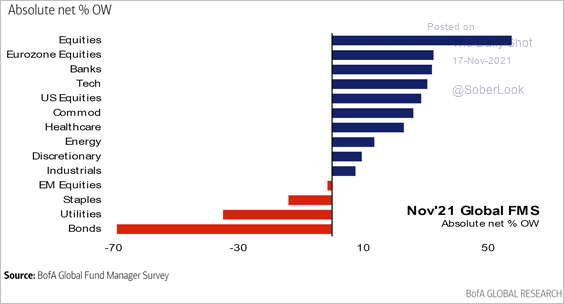 Source: BofA Global Research
 Source: BofA Global Research
6. Flows into funds labeled “climate” have been above conventional funds since 2017, but exploded in 2020 surging by a staggering 48% of assets under management over the four quarters of 2020.
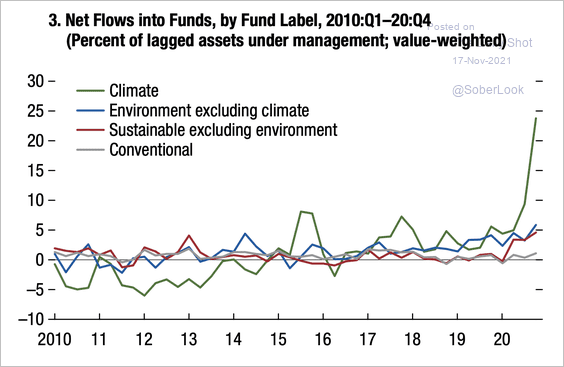 Source: IMF
Back to Index
Rates
1. Flows into inflation-protected Treasuries have been surging.
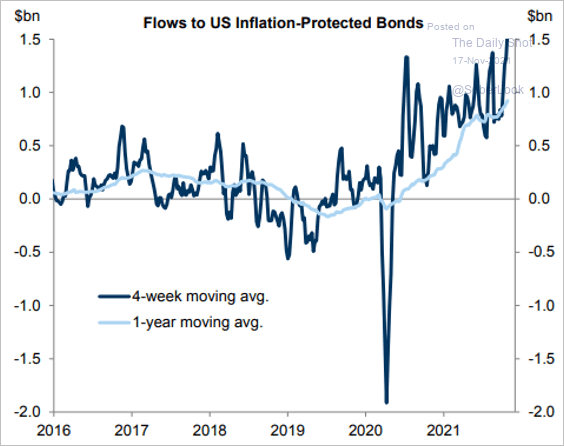 Source: Goldman Sachs; @MrBlonde_macro
2. Fund manages increasingly expect a flatter yield curve.
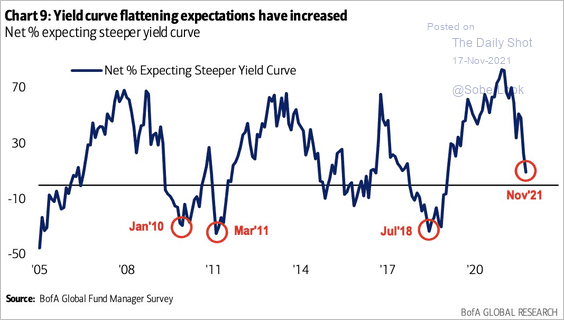 Source: BofA Global Research
3. The iShares 20+ year Treasury bond ETF (TLT) is entering a seasonally strong period.
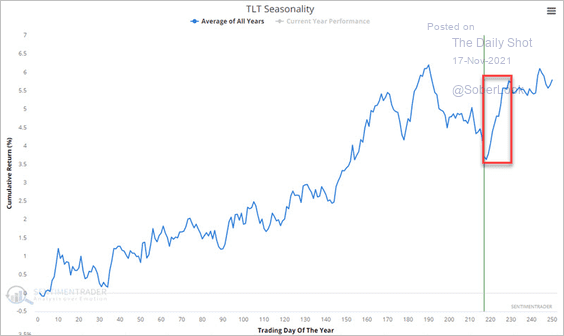 Source: SentimenTrader
4. The correlation between the short end and long end of the yield curve has collapsed to previously never seen lows.
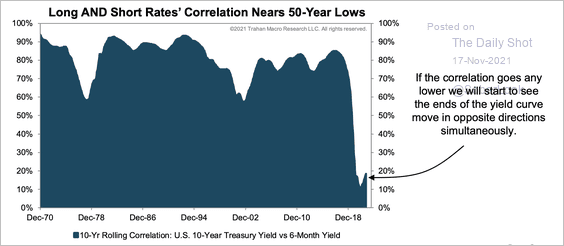 Source: Trahan Macro Research
——————–
Food for Thought
1. SALT deductions by income group:
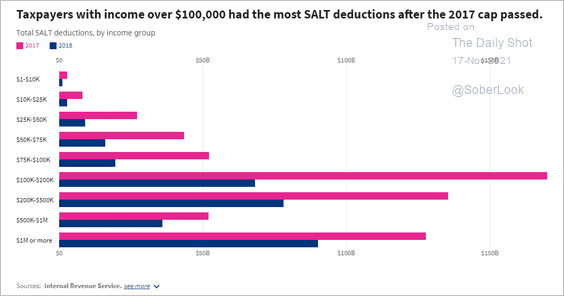 Source: USA Facts Read full article
2. The largest US firms have become much less labor-intensive.
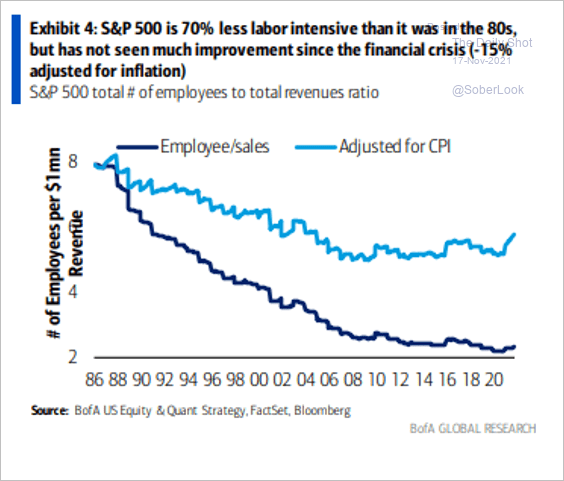 Source: BofA Global Research
3. The number of music streams needed to make one dollar:
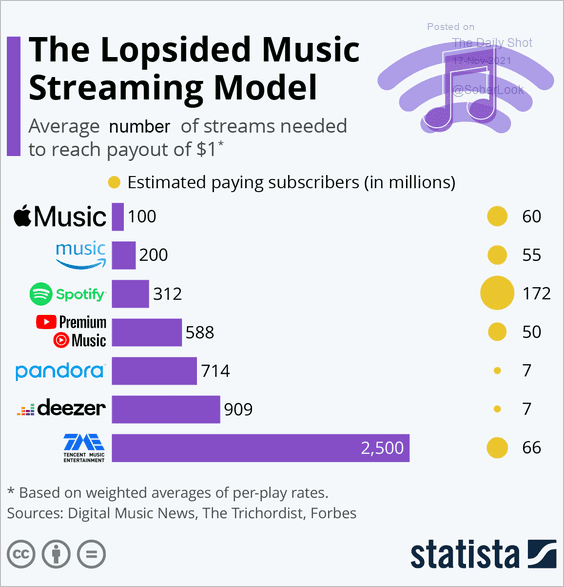 Source: Statista
4. Views on separation of church and state:
 Source: Pew Research Center Read full article
5. The number of Republican and Democratic state governors:
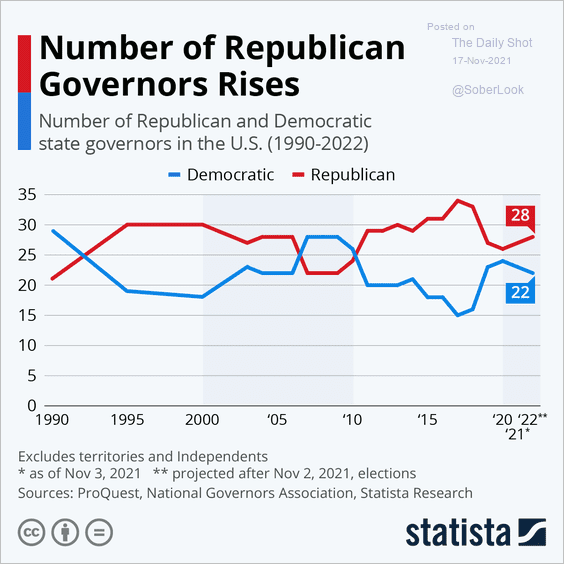 Source: Statista
6. Deforestation in the Amazon:
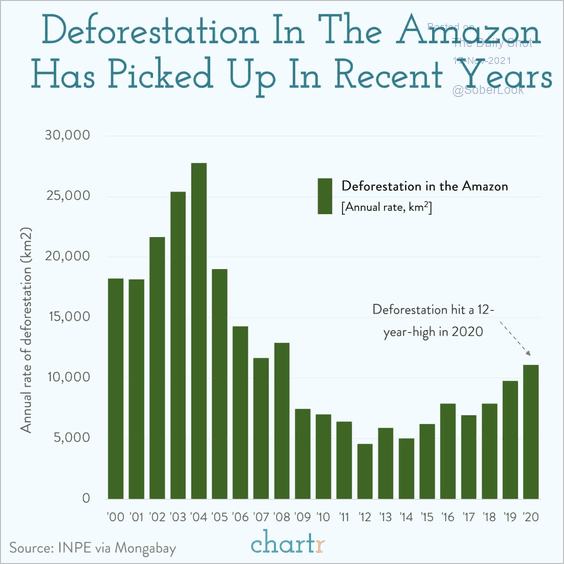 Source: @chartrdaily
7. Used farm equipment prices:
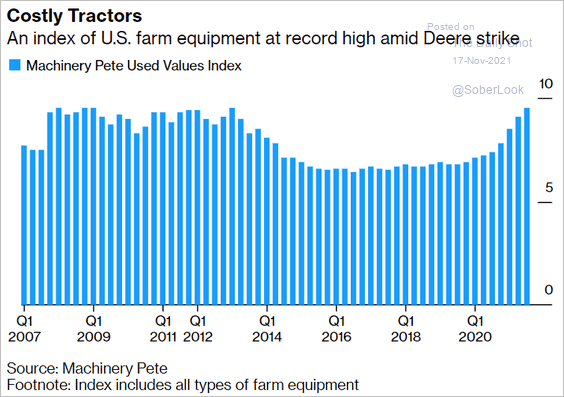 Source: Bloomberg Read full article
8. Risks to economic growth:
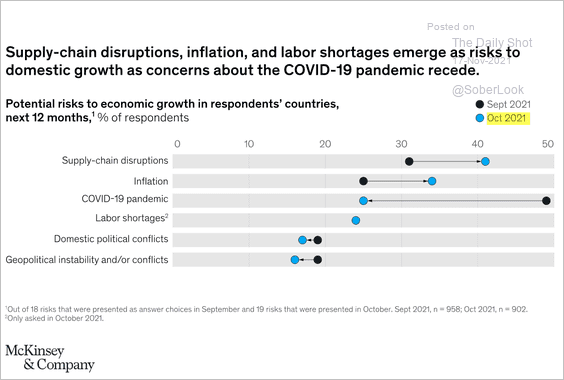 Source: McKinsey Read full article
9. Lucid’s valuation overtaking GM and Ford:
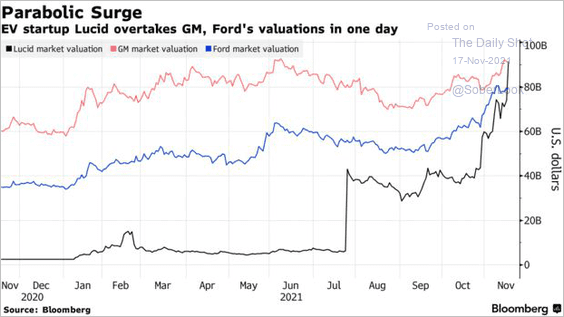 Source: Bloomberg Read full article
10. Most interesting neighborhoods:
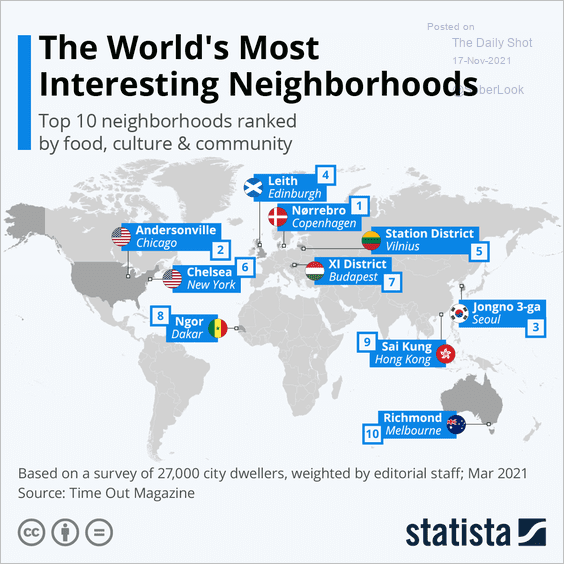 Source: Statista
——————–
Back to Index