
The Daily Shot: 03-Dec-21
• The United States
• The Eurozone
• Europe
• Asia – Pacific
• China
• Emerging Markets
• Cryptocurrency
• Energy
• Equities
• Rates
• Global Developments
• Food for Thought
The United States
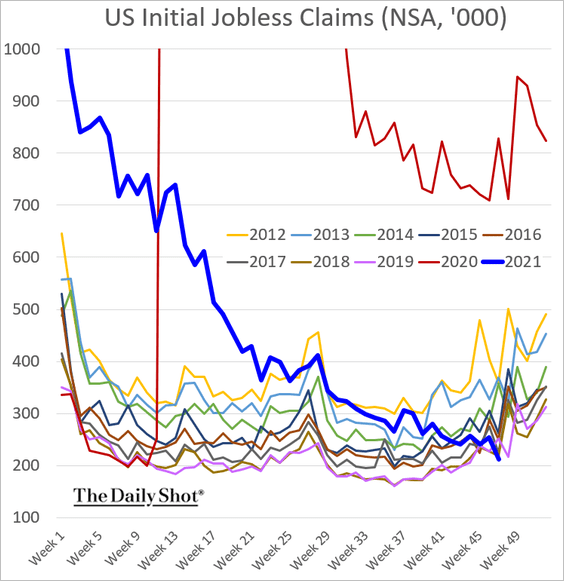
1. Let’s begin with the labor market.
• Initial jobless claims hit a multi-year low for this time of the year.
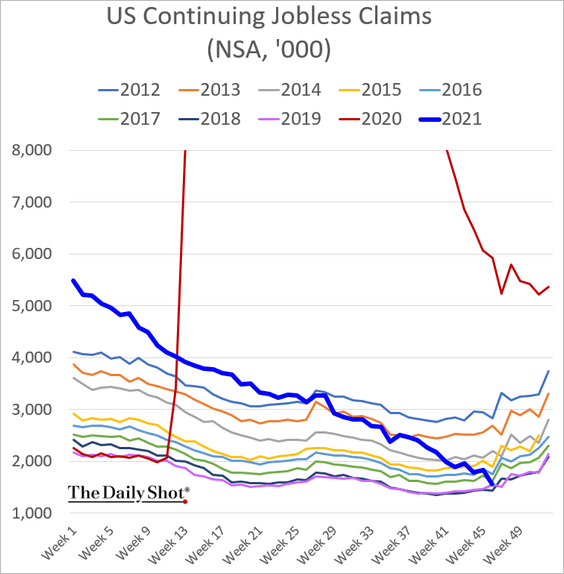
• Continuing claims, which are reported on a one-week lag to initial claims, are nearing 2018/19 levels.
• Announced job cuts are now the lowest in decades (y-axis shown in log scale).
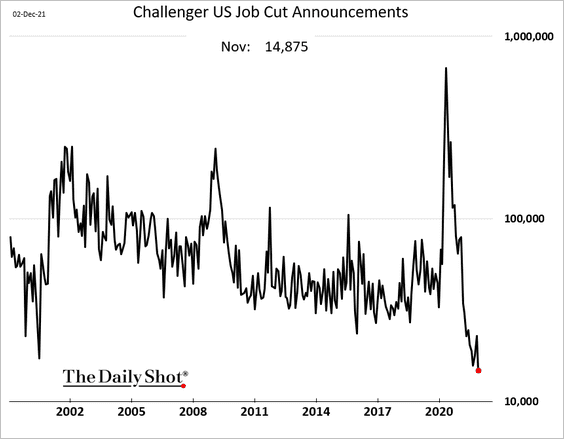
• These rapid improvements in the labor market are allowing the Fed to accelerate QE taper.
 Source: Reuters Read full article
• Economists are increasingly focused on labor force participation. It needs to rise in order to ease wage pressures.
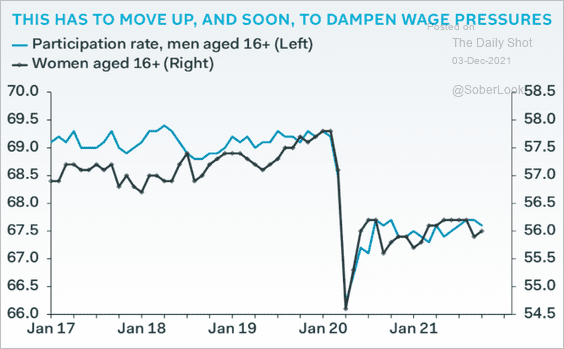 Source: Pantheon Macroeconomics
– The decline in labor force participation has been due to cyclical as well as structural trends (2 charts).
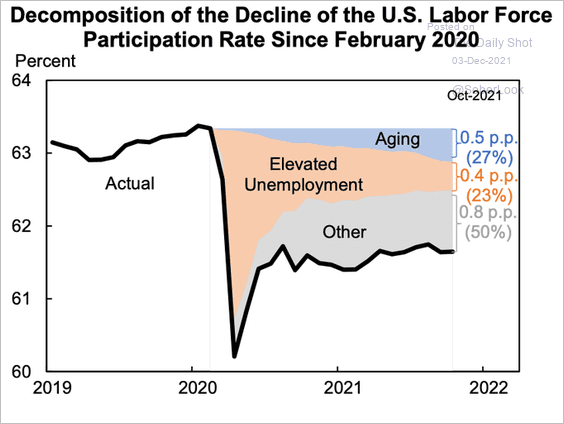 Source: @jasonfurman
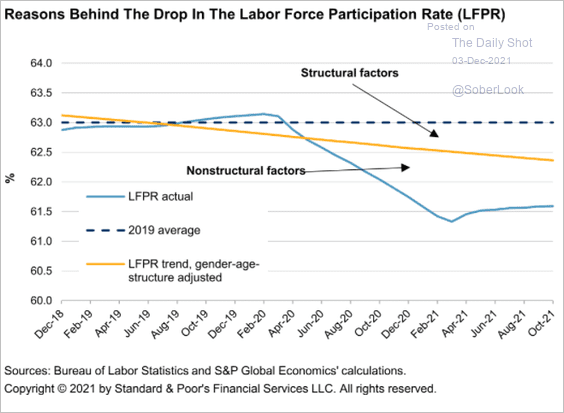 Source: S&P Global Ratings
– This chart provides more detail on the drivers of the decline.
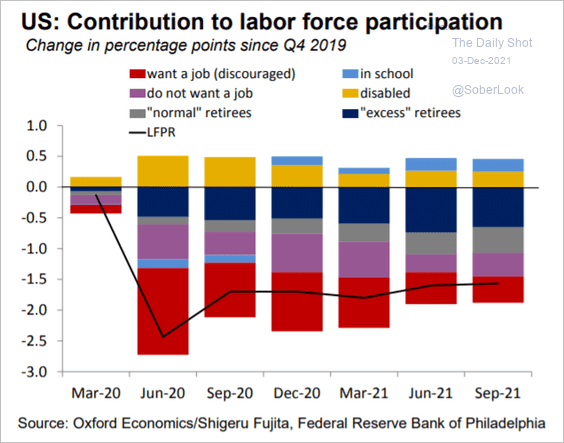 Source: @GregDaco
– Here is the breakdown by age group.
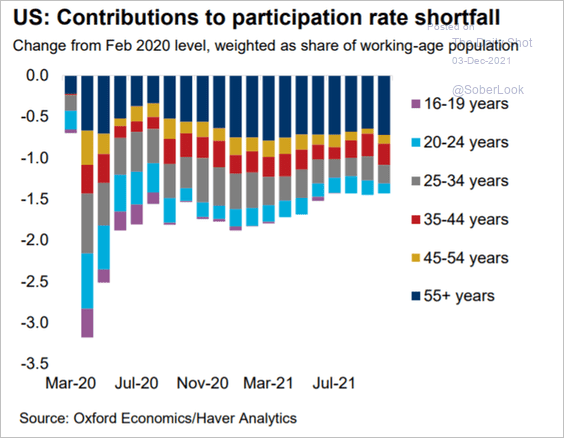 Source: @GregDaco
– While participation is expected to rebound next year, it will likely peak in early 2023 due to structural factors (according to Oxford Economics).
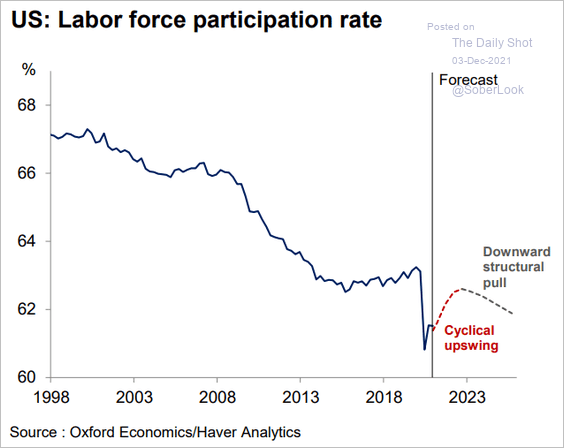 Source: @GregDaco
• Morgan Stanley is estimating 560k jobs created in November, roughly in line with consensus, …
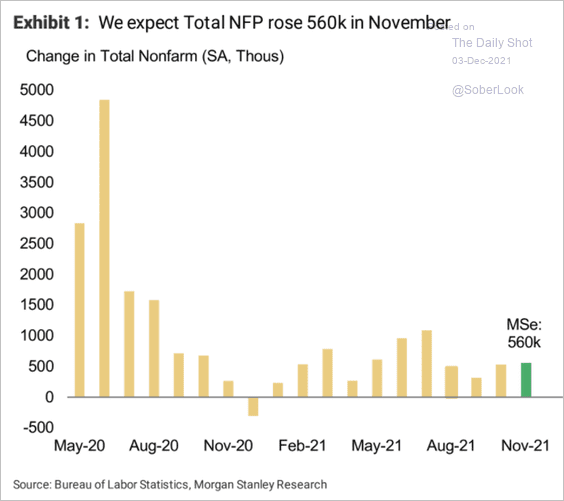 Source: Morgan Stanley Research
… with the unemployment rate going down to 4.4%.
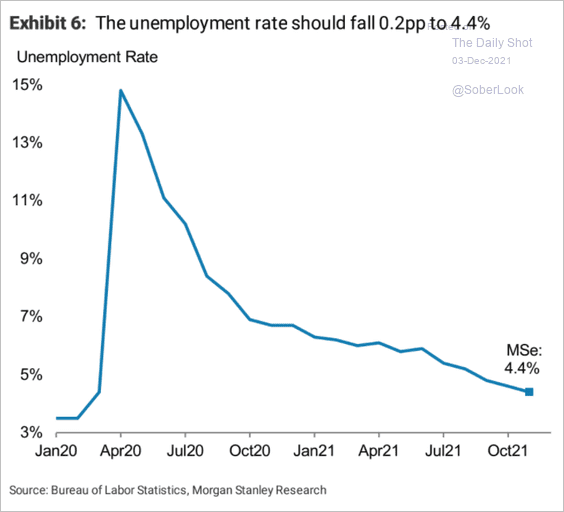 Source: Morgan Stanley Research
——————–
2. Next, we have some updates on inflation and supply-chain bottlenecks.
• These charts show the components of the PCE inflation index.
– Year-over-year:
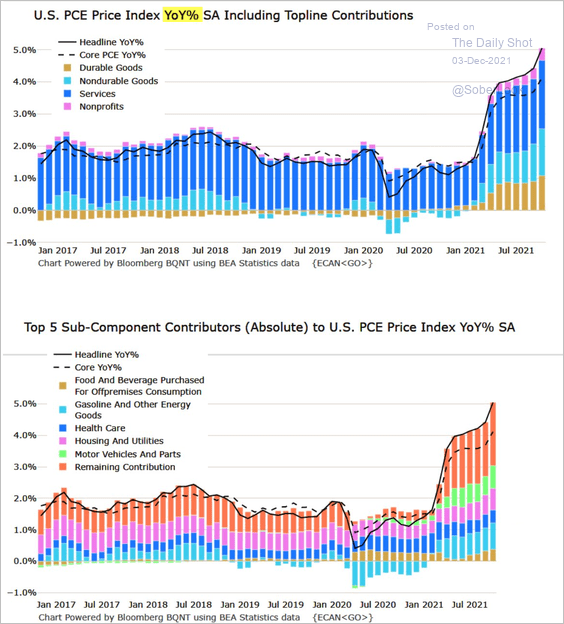 Source: @M_McDonough
– Month-over-month:
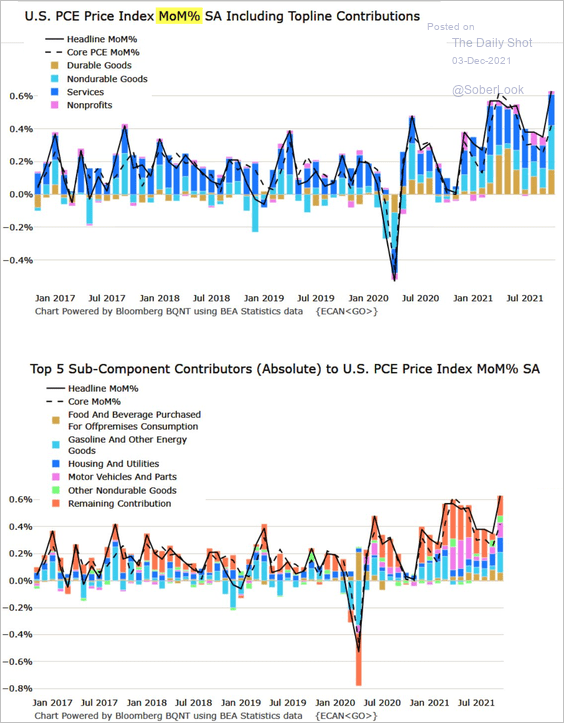 Source: @M_McDonough
• Economists expect inflation to moderate but hold above 2%.
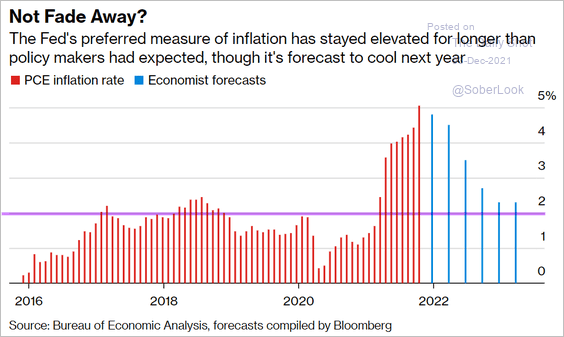 Source: @markets Read full article
• A large portion of the inflation spike is still driven by COVID-related trends.
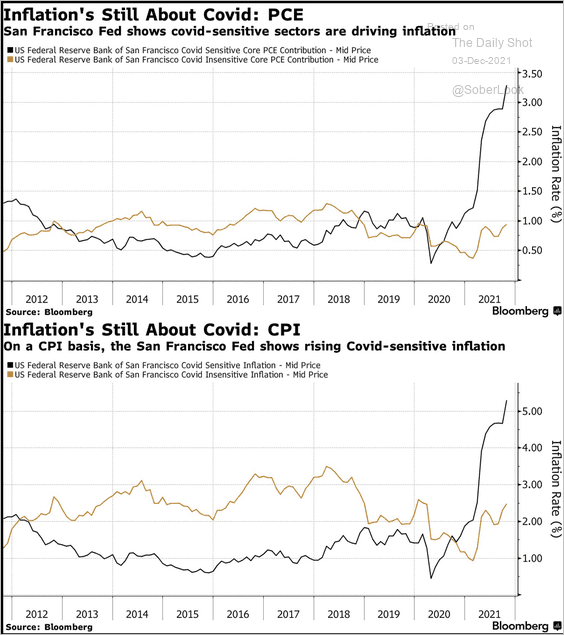 Source: @acemaxx, @sffed, @JohnAuthers Read full article
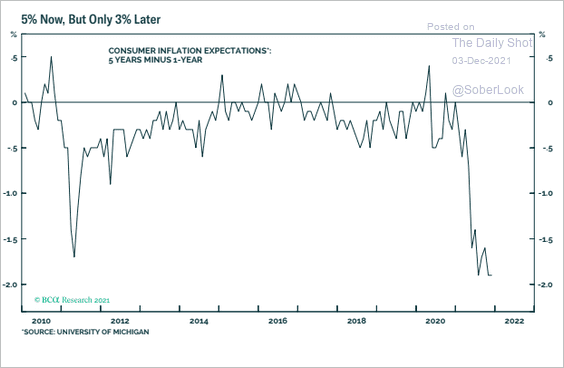
• Longer-term inflation expectations remain subdued (3 charts).
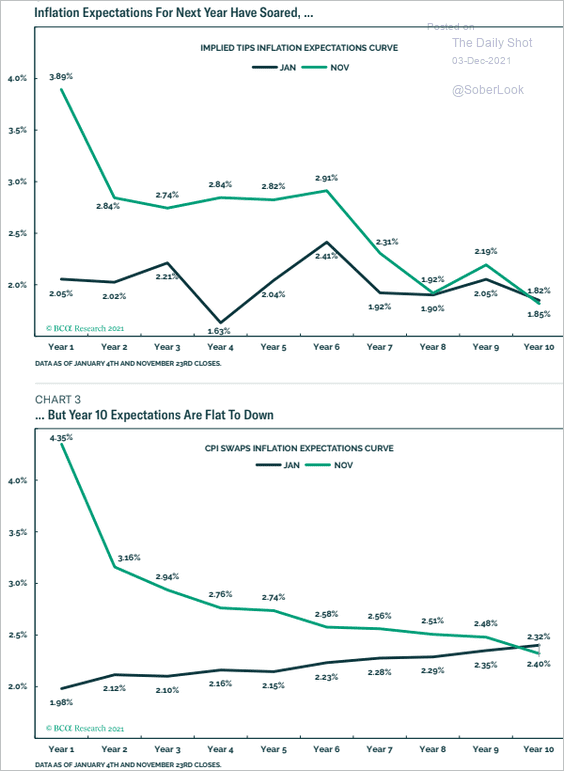 Source: BCA Research
 Source: BCA Research
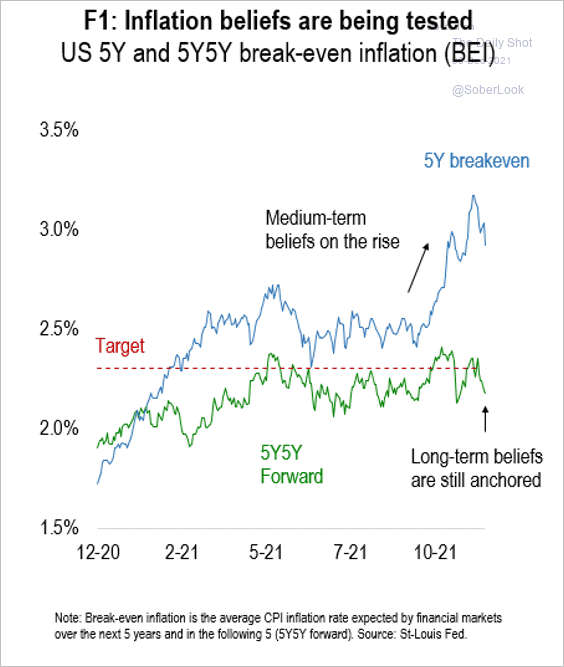 Source: Numera Analytics
• Core goods inflation has risen significantly above pre-pandemic growth trends, which can lead to disinflation next year, according to Barclays.
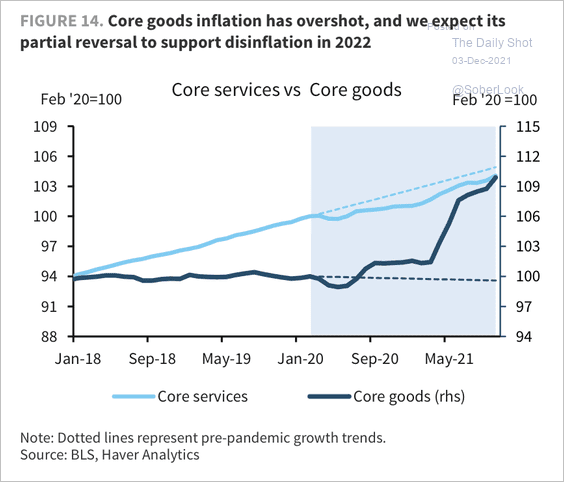 Source: Barclays Research
• Easing goods demand should dampen goods inflation (as services CPI ramps up).
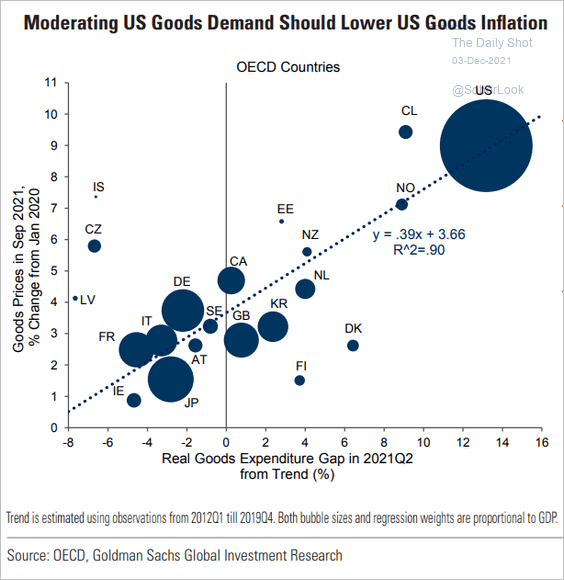 Source: Goldman Sachs
• The post-COVID rent rebound appears to have peaked.
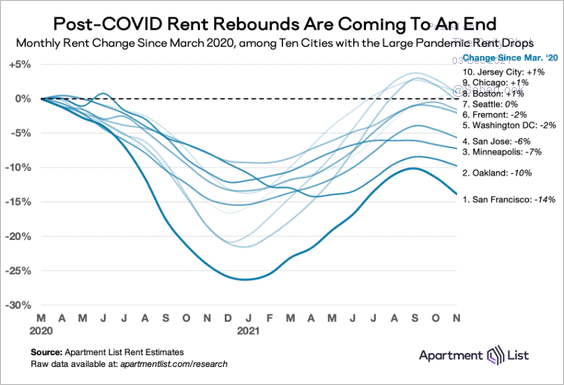 Source: Apartment List Read full article
• The US and the Eurozone had similar monetary expansionary policies. Why did inflation trends diverge so much? One possibility is that the US fiscal response was much more aggressive.
 Source: @PIIE
• The spread between new orders and inventories points to moderation in price pressures.
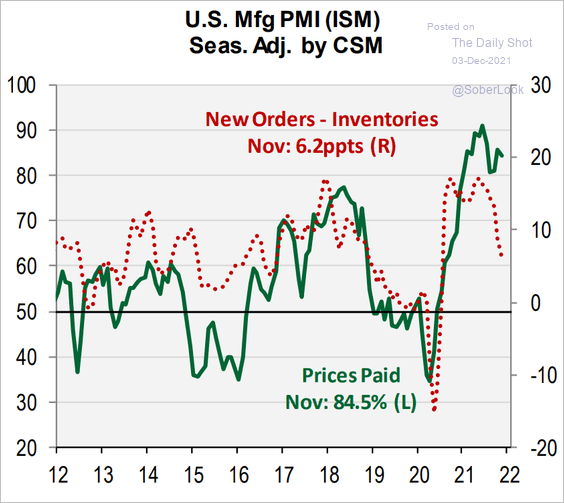 Source: Cornerstone Macro
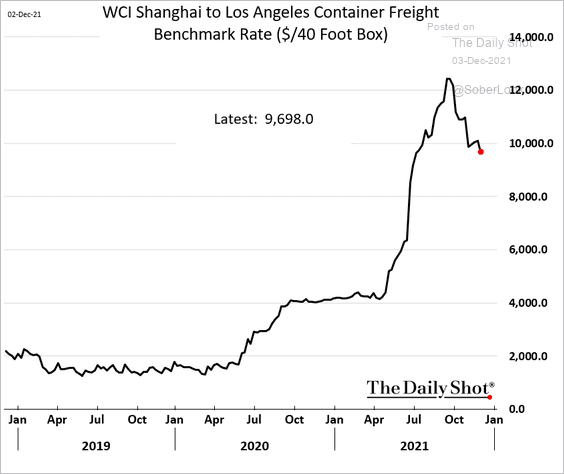
• Container shipping rates are easing.
• Manufacturers are not concerned about backlogs persisting for too long, according to the Dallas Fed’s regional survey.
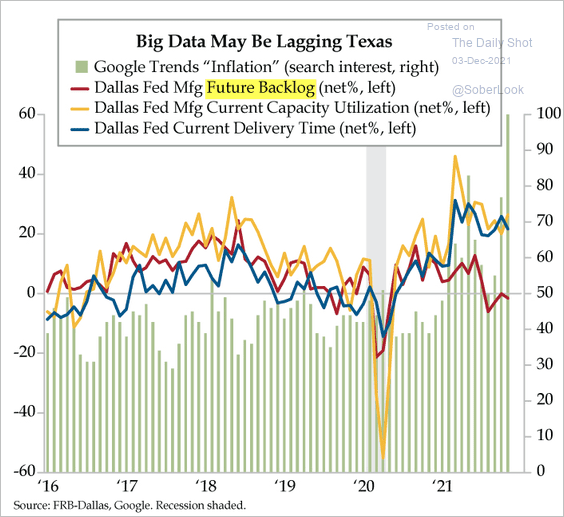 Source: The Daily Feather
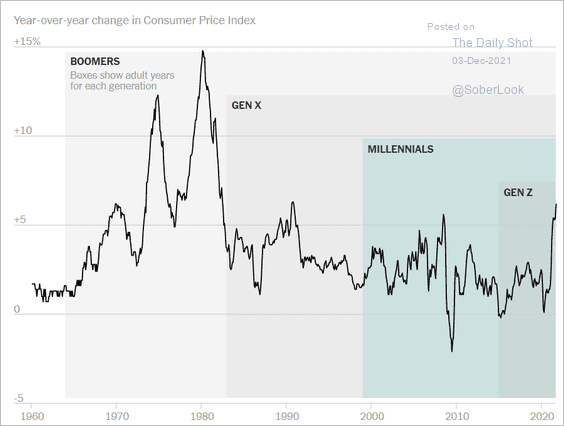
• Most Millennial/GenXers have no experience with high inflation (2 charts).
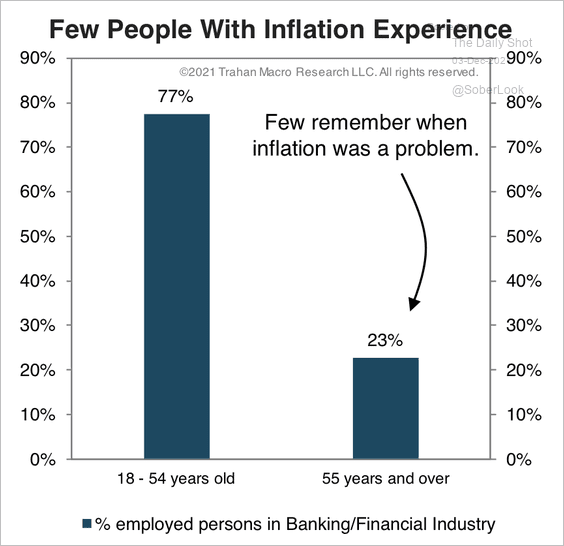 Source: Trahan Macro Research
 Source: The New York Times Read full article
——————–
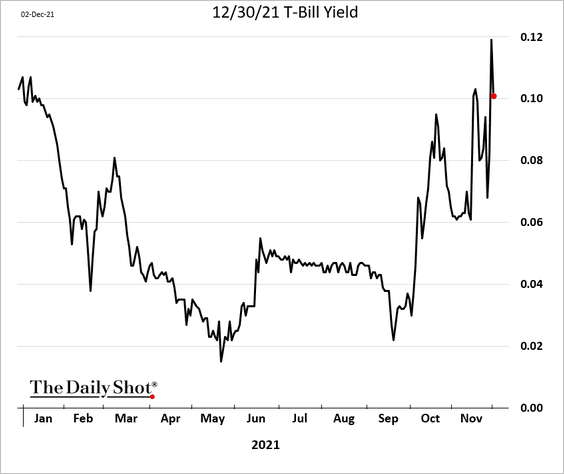
3. The Treasury market is still jittery about the debt ceiling. Here is the yield on a T-Bill maturing at the end of the month.
Back to Index
The Eurozone
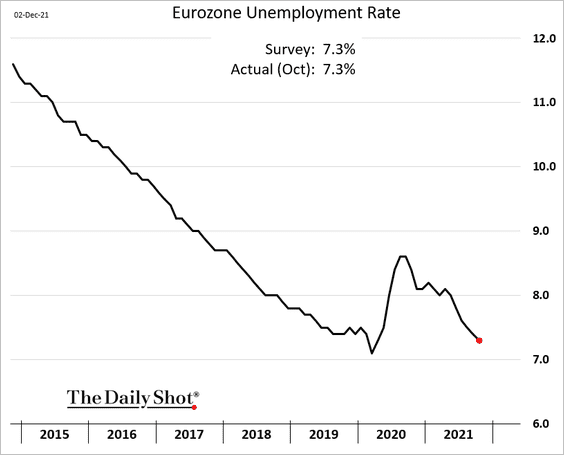
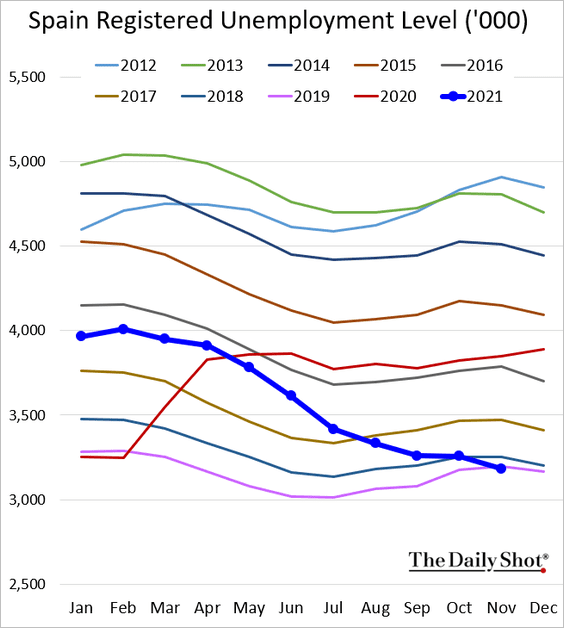
1. The unemployment rate is approaching pre-COVID levels.
Spain’s unemployment is already there.
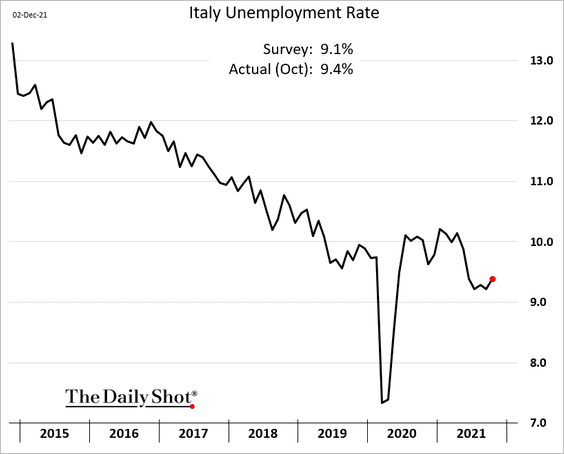
However, Italian unemployment ticked higher.
 Source: MarketWatch Read full article
——————–
2. Suppliers to Germany’s automotive industry are gloomy.
 Source: @CESifoGroup, @ifo_Institut Read full article
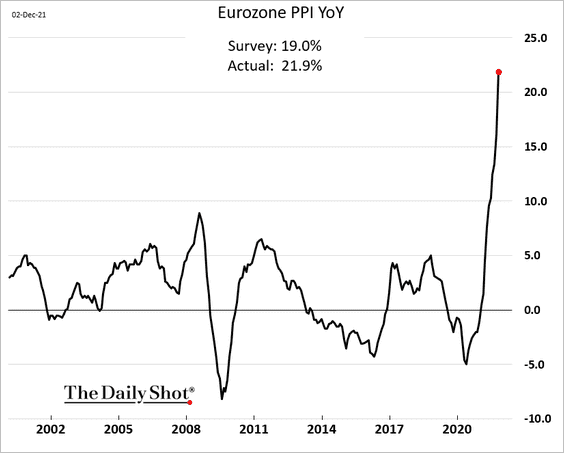
3. The Euro-area PPI shot past 20%, topping expectations.
4. Here is the minimum wage across the Eurozone.
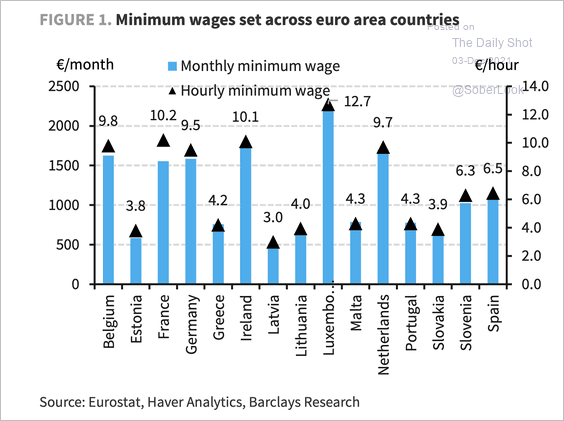 Source: Barclays Research
And this chart shows the minimum wage as a percentage of median wages in each country.
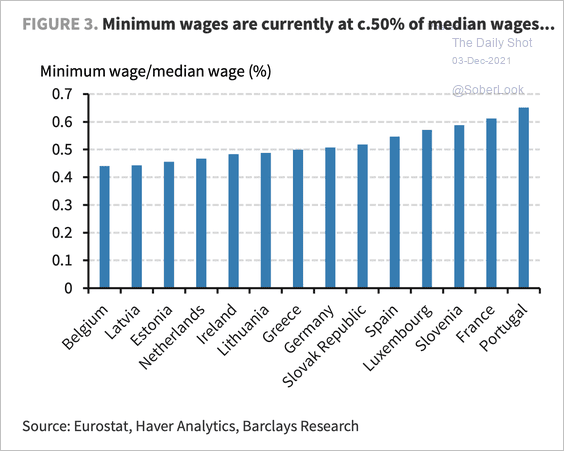 Source: Barclays Research
——————–
5. The EUR/USD 2-week implied vol jumped ahead of the Fed and ECB decisions.
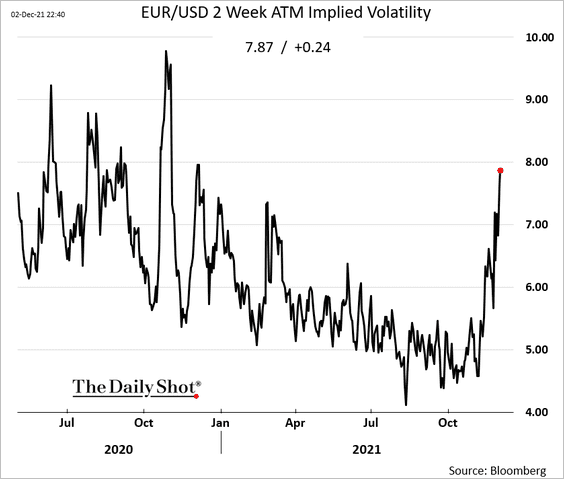 h/t @vkaramanis_fx
Back to Index
Europe
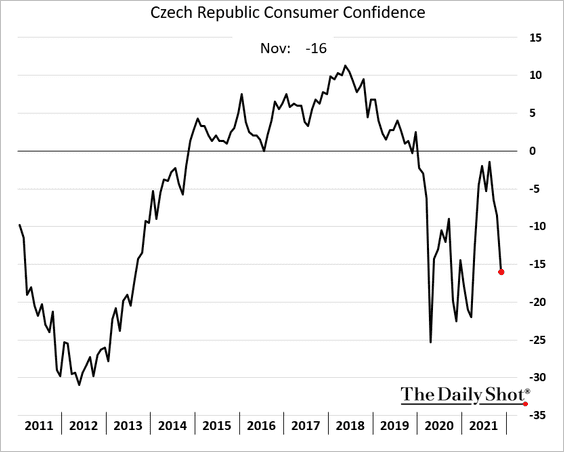
1. Czech GDP continues to rebound but remains well below pre-COVID levels.
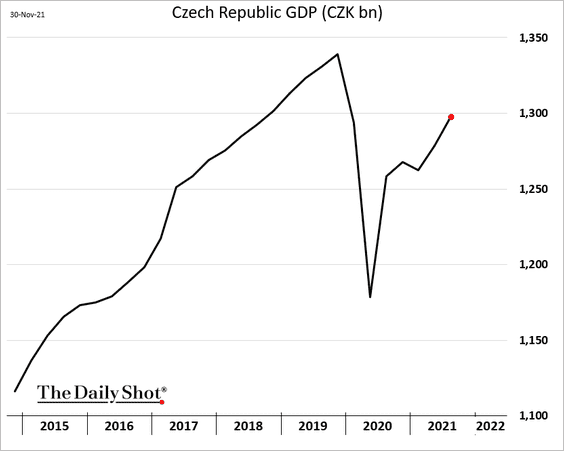
Consumer confidence has deteriorated last month as the pandemic surged.
——————–
2. This chart shows consumer inflation forecasts by country.
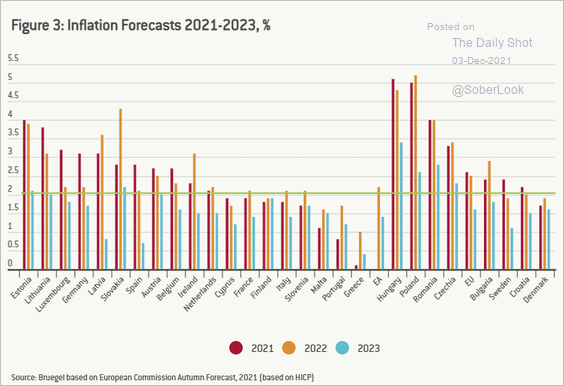 Source: Bruegel Read full article
3. EU firms have not been this concerned about shortages of material and equipment in recent history.
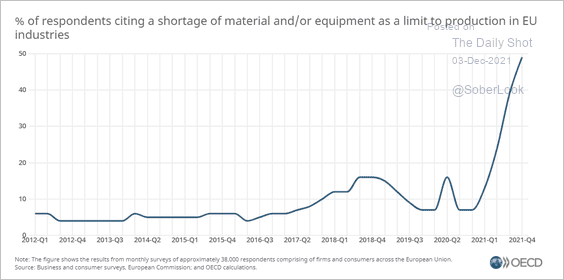 Source: OECD Read full article
4. Next, we have the EU’s distribution of trade with Asian economies.
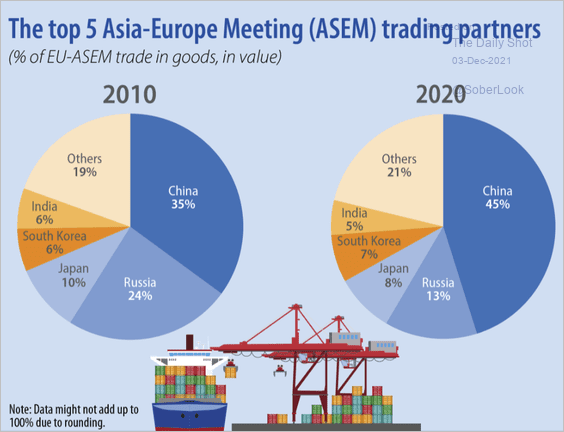 Source: Eurostat Read full article
Back to Index
Asia – Pacific
1. Growth in Singapore’s factory activity is moderating.
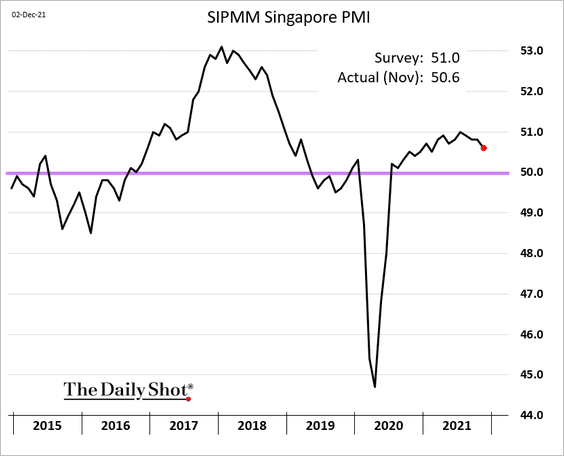
 Source: The Straits Times Read full article
——————–
2. South Korea’s domestic demand is highly sensitive to policy rate changes.
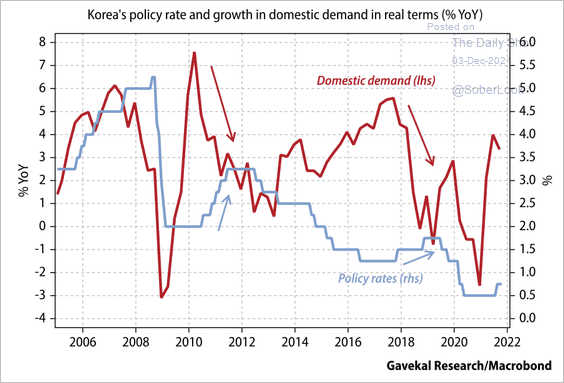 Source: Gavekal Research
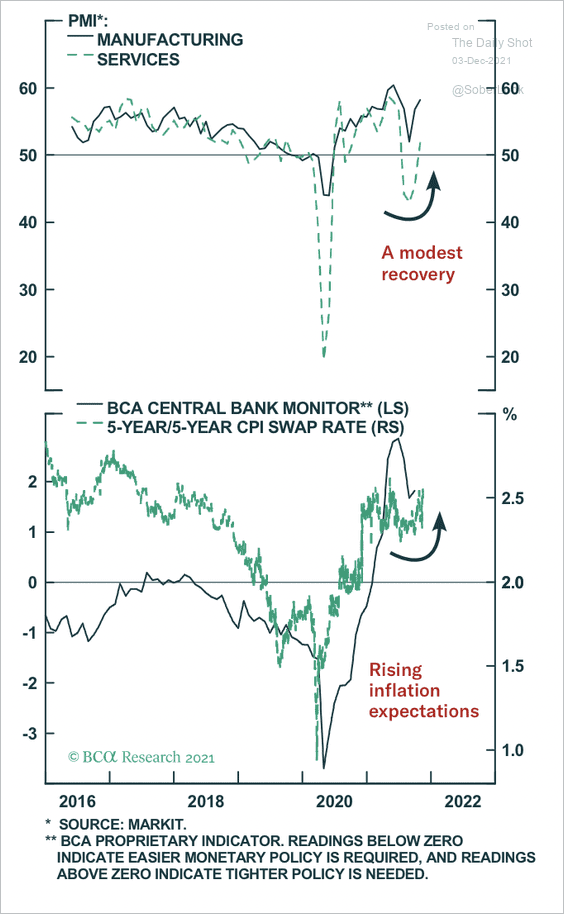
3. Next, we have some updates on Australia.
• There have been tentative signs of a rebound in Australia’s economic activity amid rising inflation expectations.
 Source: BCA Research
• Households are sitting on quite a bit of cash. This chart shows savings as a percentage of disposable income.
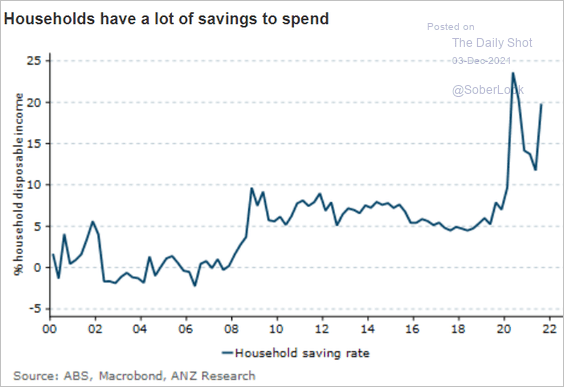 Source: ANZ Research
• Here are the contributions to the Q3 CPI.
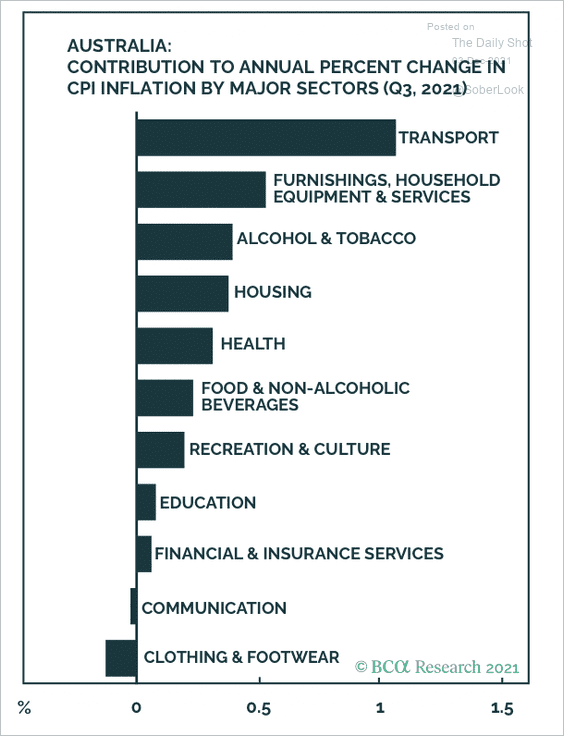 Source: BCA Research
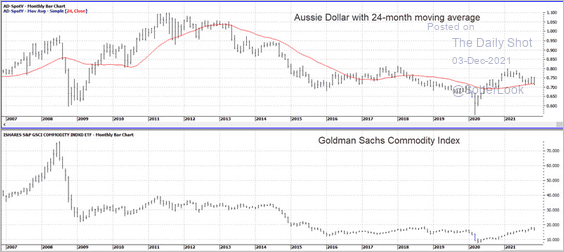
• The Aussie dollar has been under pressure.
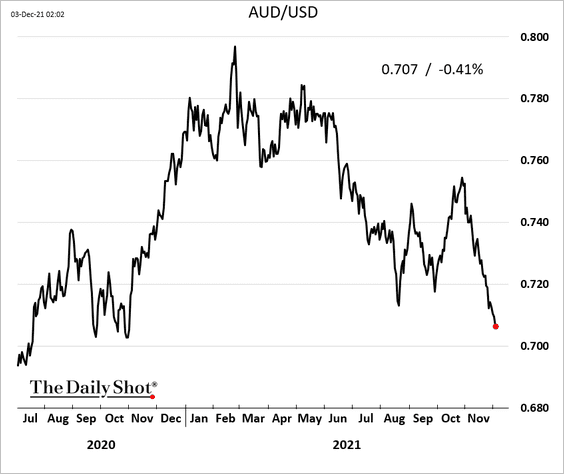
– AUD/USD is testing long-term support as the Goldman Sachs Commodity Index appears to have bottomed.
 Source: SentimenTrader
– AUD/JPY is also at support.
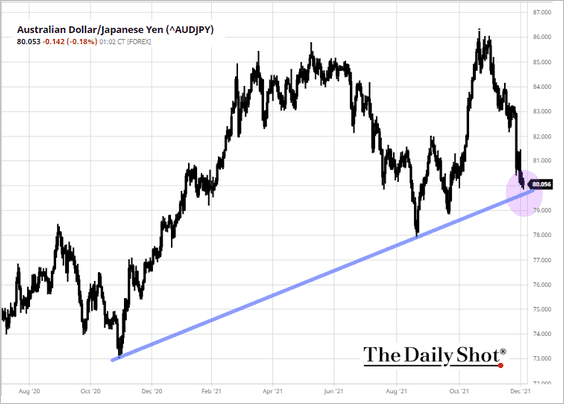 Source: barchart.com
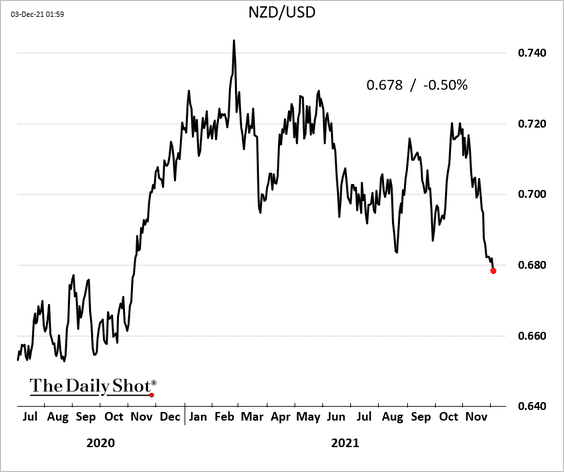
3. The Kiwi dollar hit the lowest level in a year vs. USD.
Back to Index
China
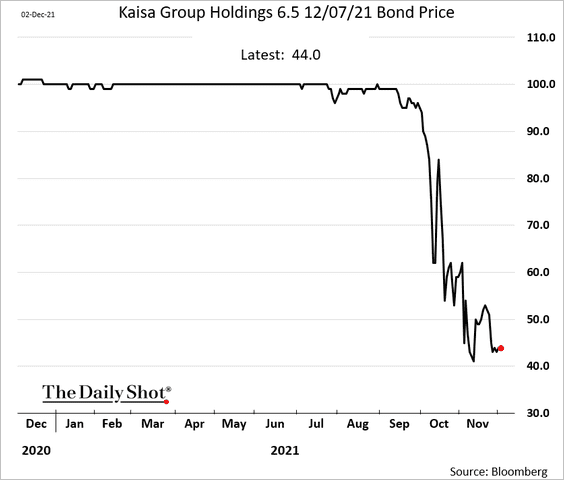
1. Beijing gave leveraged developers some breathing room, but the credit crisis in the space is by no means over.
 Source: Fitch Ratings Read full article
• Kaisa:
 Source: Reuters Read full article
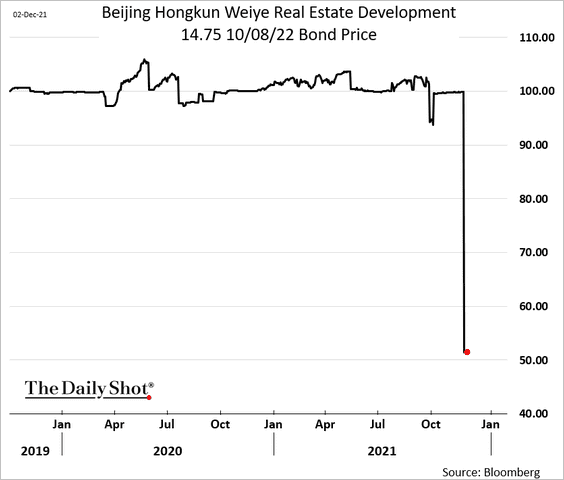
• Hongkun:
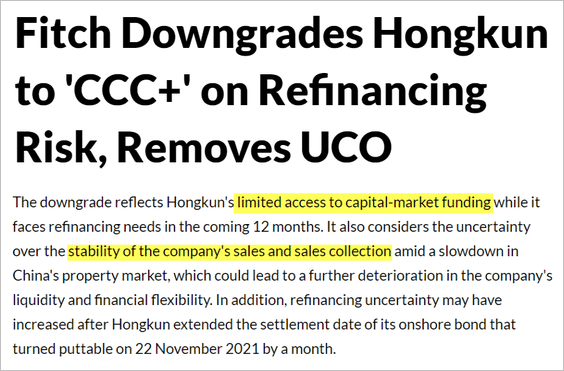 Source: Fitch Ratings Read full article
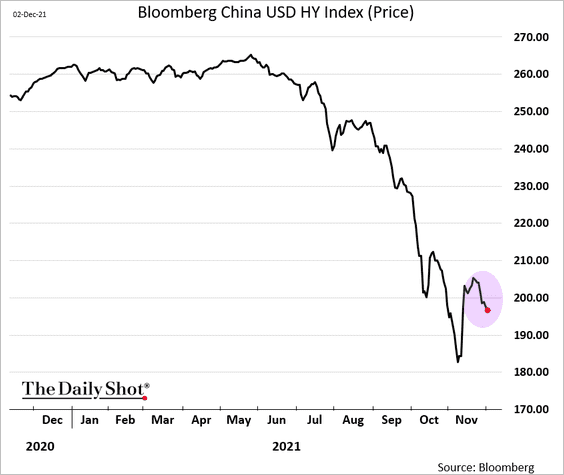
• The rebound in China’s USD high-yield index is fading.
——————–
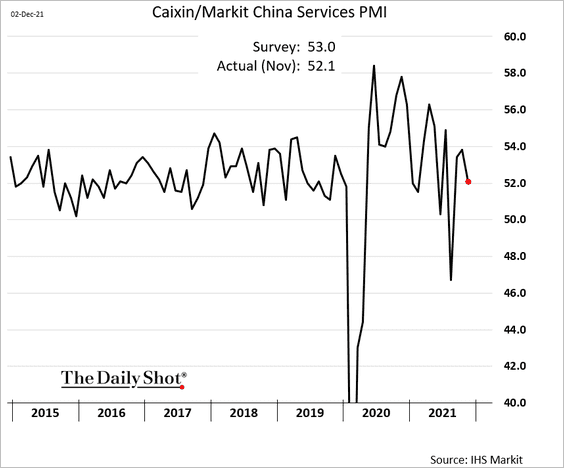
2. Service sector growth keeps moderating, according to Markit.
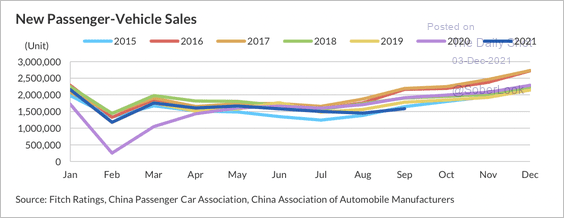
3. New passenger vehicle sales continue to slow and remain below historical levels.
 Source: Fitch Ratings
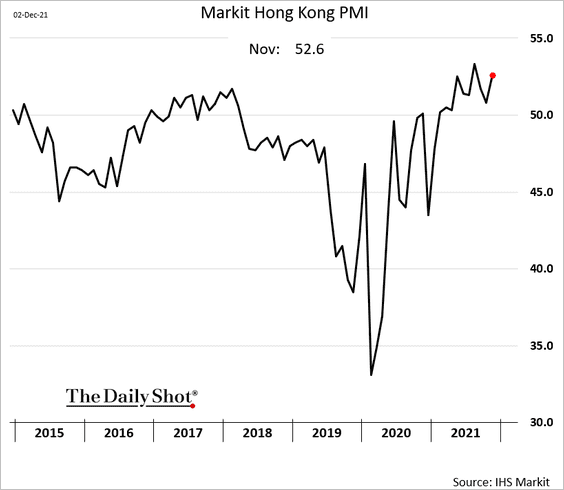
4. Hong Kong’s business activity strengthened last month.
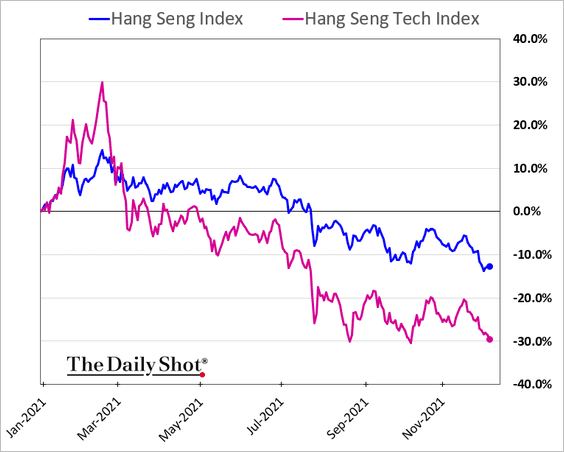
5. China’s tech shares trading in Hong Kong continue to underperform.
Back to Index
Emerging Markets
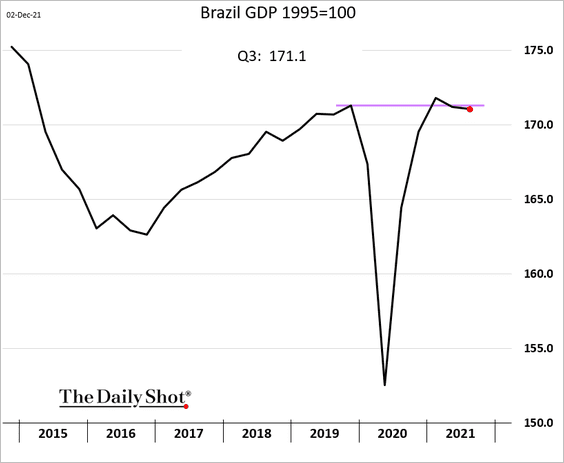
1. Brazil’s GDP dipped below its pre-COVID level.
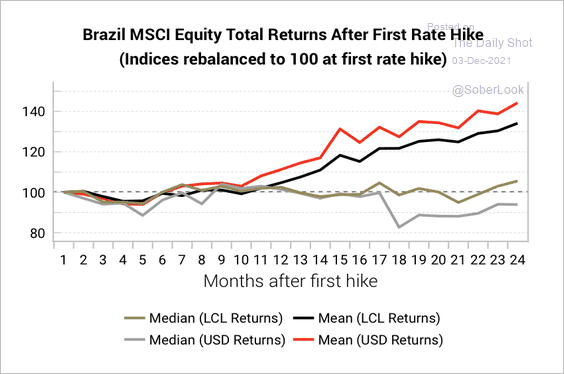
• Generally, the risk/reward for buying EM debt (particularly Brazil) is much better toward the end of a rate hike cycle, whereas equity returns vary around rate hikes (2 charts).
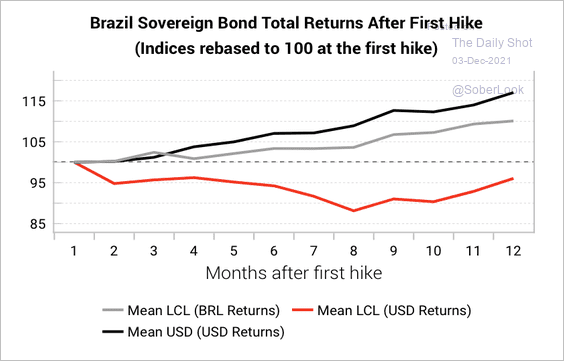 Source: Variant Perception
 Source: Variant Perception
——————–
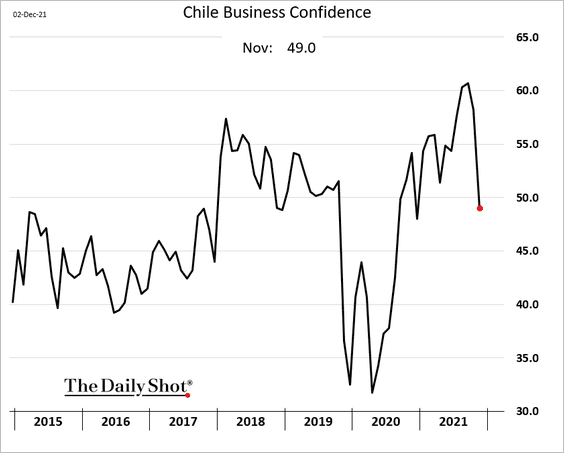
2. Chile’s business confidence slipped last month as political uncertainty takes a toll.
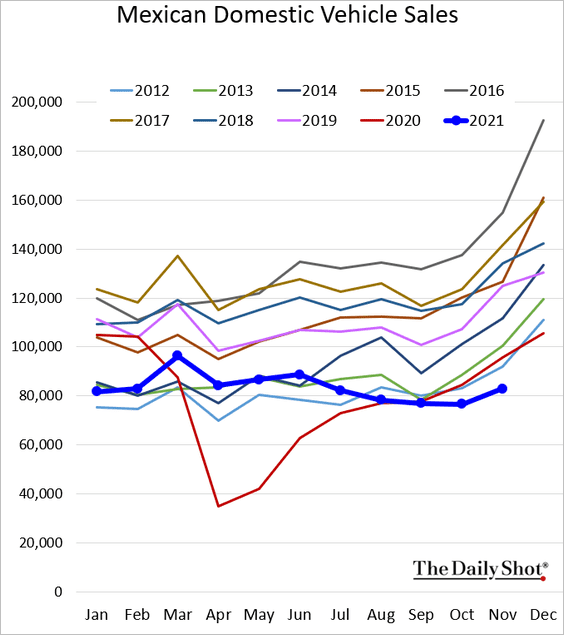
3. Mexican vehicle sales remain depressed.
——————–
4. Vietnam is expected to regain its export market share.
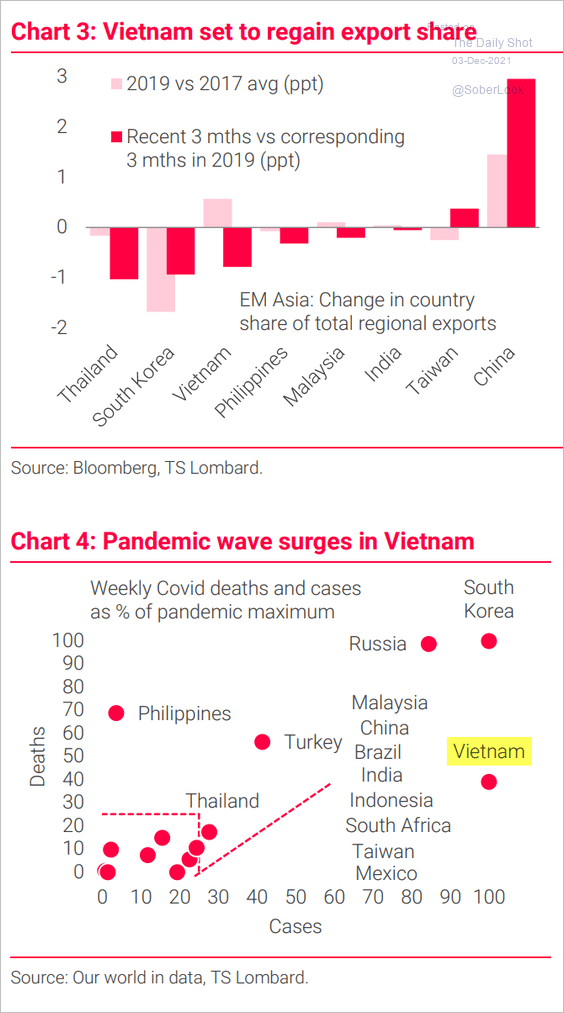 Source: TS Lombard
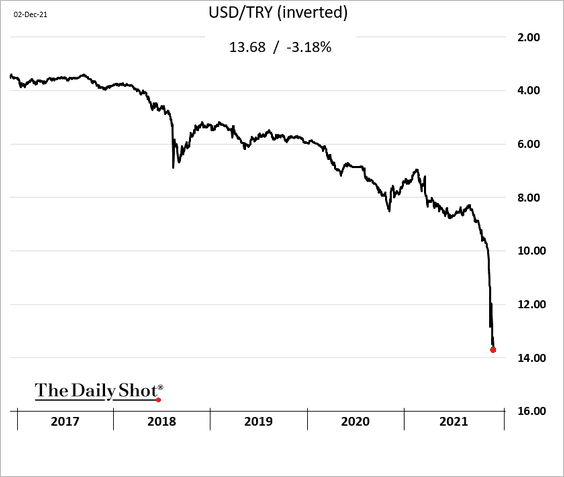
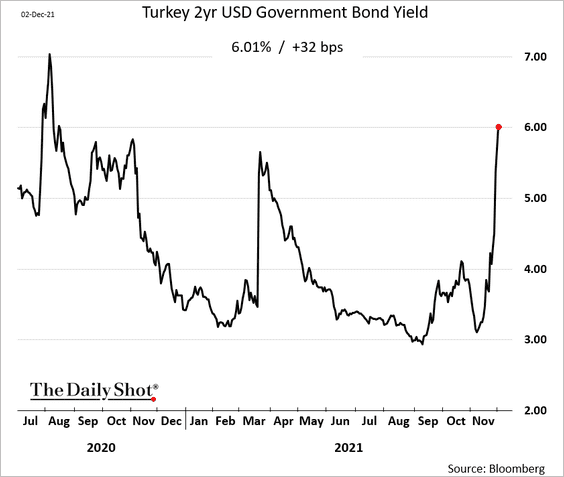
5. Erdogan wants to push rates lower, …
 Source: @bpolitics Read full article
… sending the lira to new lows.
Investors have been dumping Turkey’s dollar bonds.
——————–
6. Barclays’ 2022 EM sovereign debt downgrade candidates continue to outweigh potential upgrade candidates.
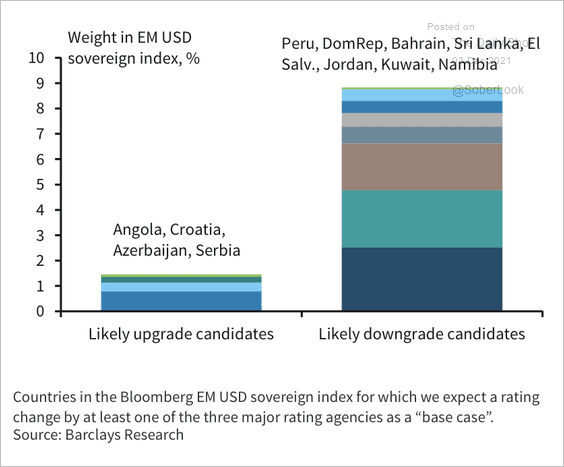 Source: Barclays Research
Back to Index
Cryptocurrency
1. The rise in BTC futures open interest could suggest the market is oversaturated with leverage. This may lead to liquidations (broad-based selling) if BTC continues to decline.
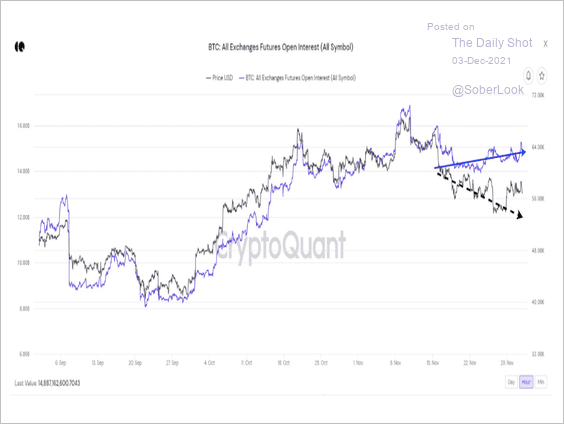 Source: CryptoQuan Read full article
2. The chart below shows the recent decline in the average lifespan of all spent transactions on the Bitcoin blockchain network. Stability in spending activity suggests less profit-taking from long-term BTC holders.
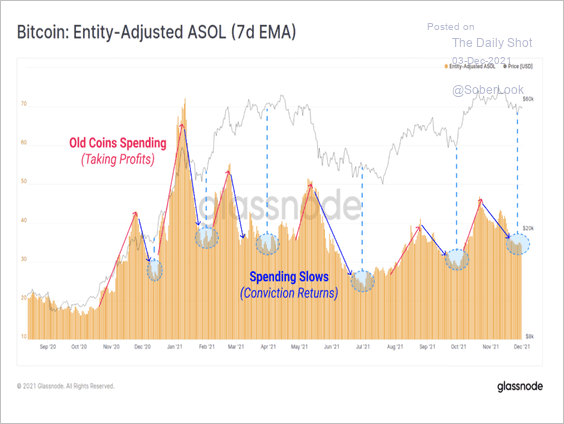 Source: @glassnode
3. Open interest in bitcoin’s options market saw a significant rise this year and is currently near $12 billion.
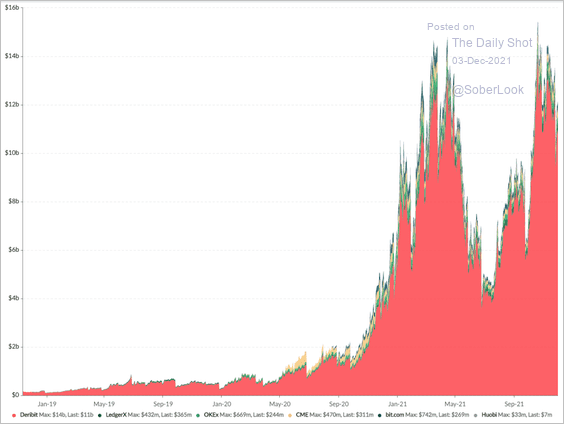 Source: Skew
More professional traders are flocking to crypto options markets.
 Source: CoinDesk Read full article
——————–
4. China’s crypto industry continues to phase out.
 Source: CoinDesk Read full article
Back to Index
Energy
1. Let’s start with the drivers of global oil production growth this year.
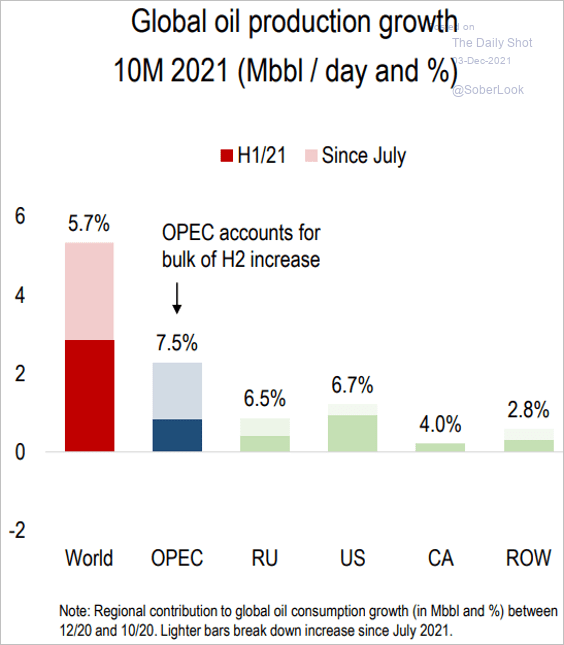 Source: Numera Analytics
And here are the contributions to production shortfalls vs. the pre-COVID trend. At this point, much of it is the US.
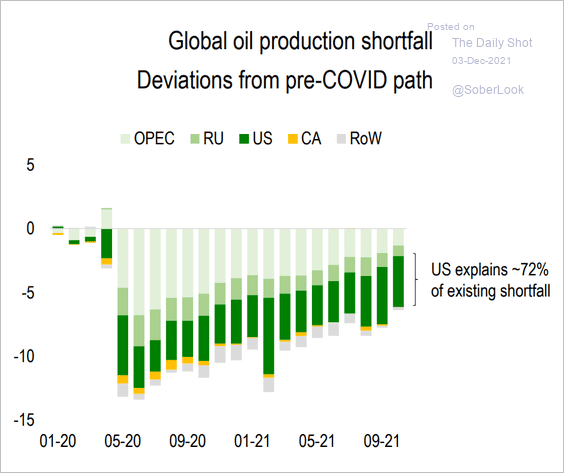 Source: Numera Analytics
——————–
2. OPEC+ will proceed with its planned output increase.
 Source: Reuters Read full article
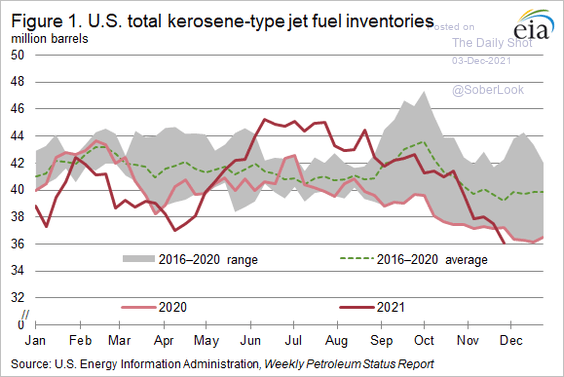
3. US jet fuel inventory is back below the 5-year range.
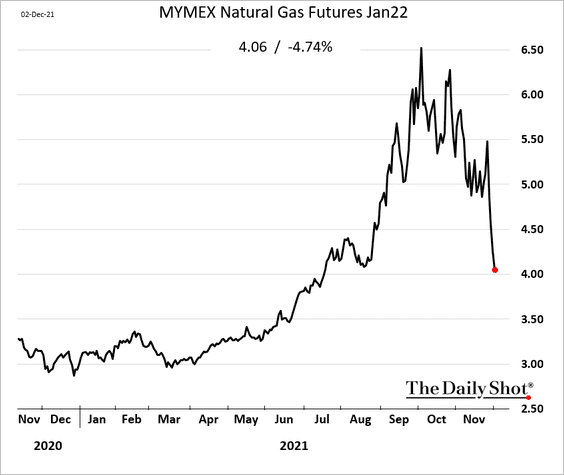
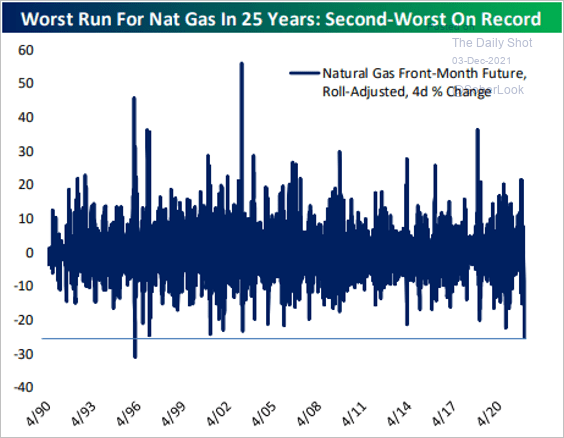
4. It’s been a while since US natural gas saw such a sharp price decline.
 Source: @bespokeinvest Read full article
 Source: NGI Read full article
——————–
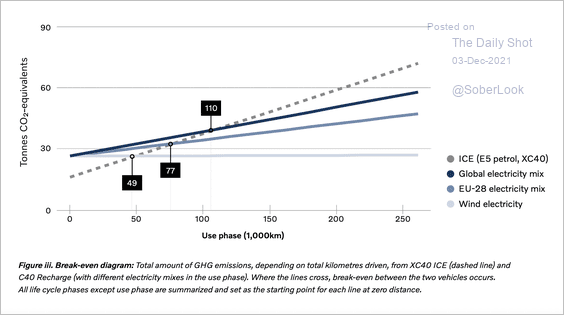
5. How environmentally friendly are EVs? Even if one assumes a 100% renewable energy mix, an electric Volvo XC40 takes 49,000 km to hit breakeven in CO2 terms (vs. one with an internal combustion engine). This figure rises to 110,000 km if the current global electricity mix is used.
 Source: @SnippetFinance Read full article
Back to Index
Equities
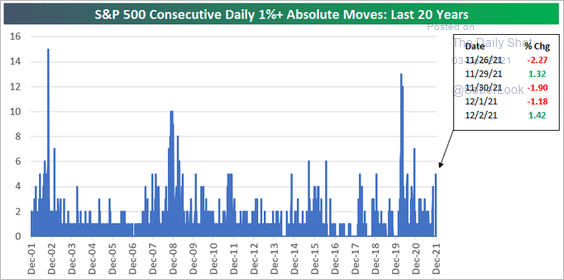
1. It’s been a volatile week, with five consecutive days of 1%+ moves.
 Source: @bespokeinvest
But year-to-date, we are still below the median.
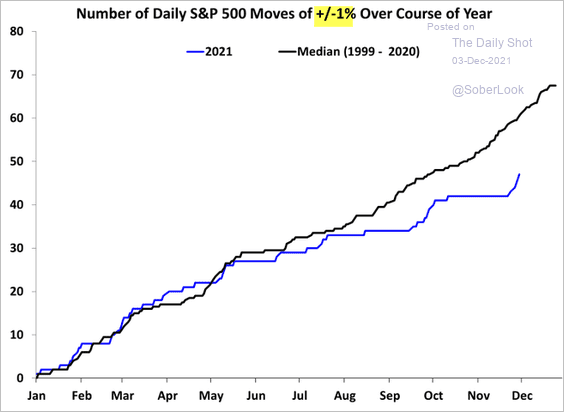 Source: @WillieDelwiche
——————–
2. Dip buyers tend to come in when the share of S&P 500 members above their 50-day moving average is near 30%.
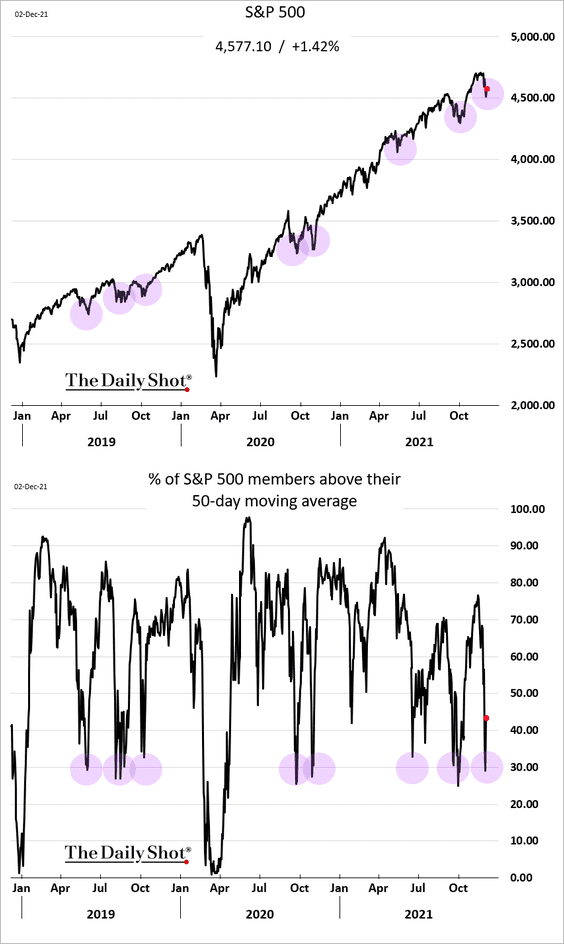 h/t Akshay Chinchalkar
3. With the S&P 500 forward P/E ratio hovering around 21, the market is betting on transitory inflation.
![]() Source: Deutsche Bank Research
Source: Deutsche Bank Research
• If inflation doesn’t send the P/E ratio lower, will tighter financial conditions do the job?
![]() Source: @MichaelKantro, @csm_research
Source: @MichaelKantro, @csm_research
• According to Yardeni Research, the forward P/E ratio will hold near 22x over the next couple of years.
![]() Source: Yardeni Research
Source: Yardeni Research
——————–
4. Profit margins hit a multi-decade high.
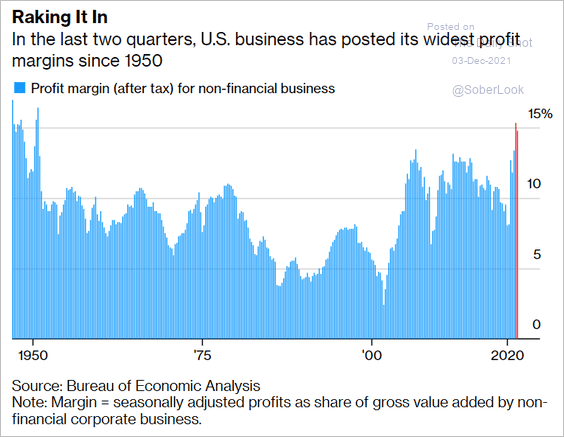 Source: @markets Read full article
• But margins are peaking, according to Oxford Economics.
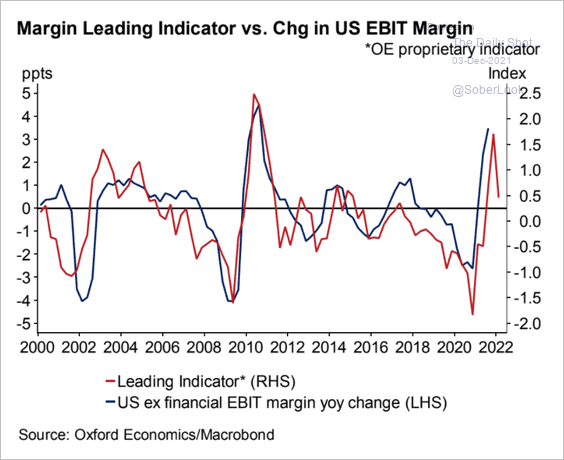 Source: Oxford Economics
• Which sectors face margin pressures due to higher labor costs?
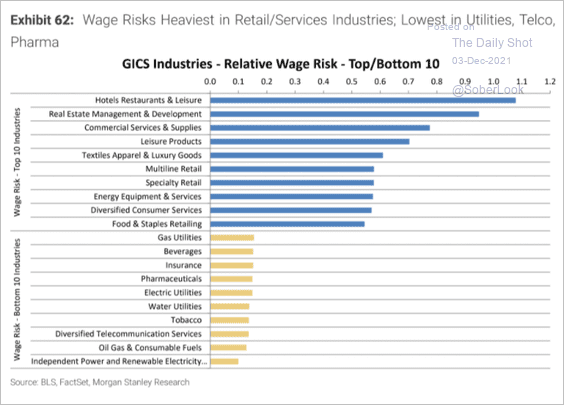 Source: Morgan Stanley Research
——————–
5. Earnings growth faces increasingly tougher comps next year.
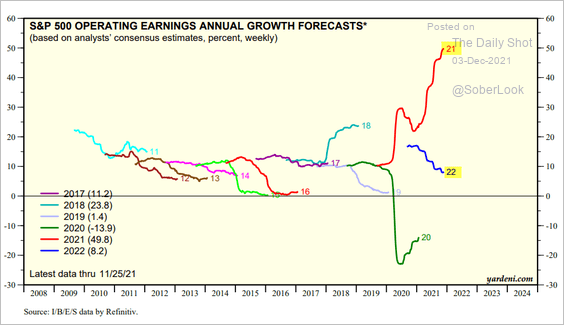 Source: Yardeni Research
6. Speculative growth stocks have been under pressure recently.
– Post-IPO portfolio:
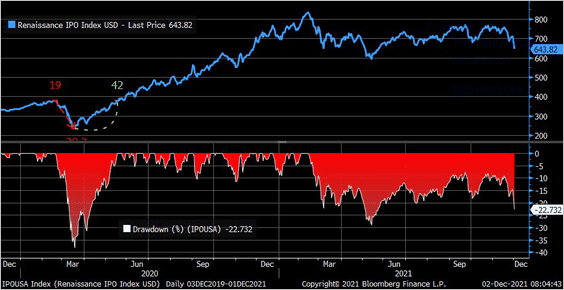 Source: @LizAnnSonders
• Non-profitable tech:
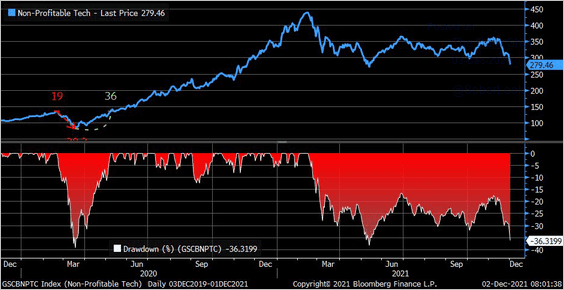 Source: @LizAnnSonders
——————–
7. The Russell 2,000 Index had one of its fastest corrections in history this week.
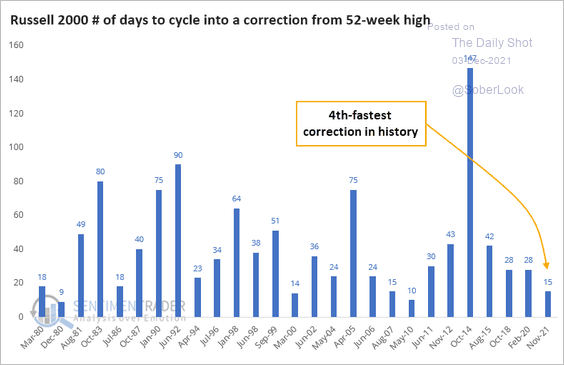 Source: SentimenTrader
8. This has been a record year for inflows into the equity market.
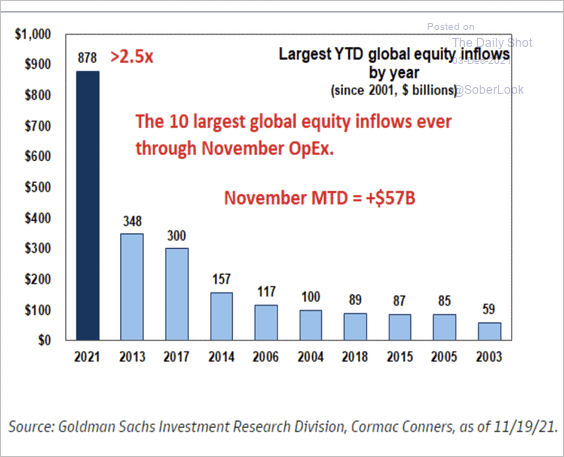 Source: Goldman Sachs
January tends to see the greatest amount of equity inflows.
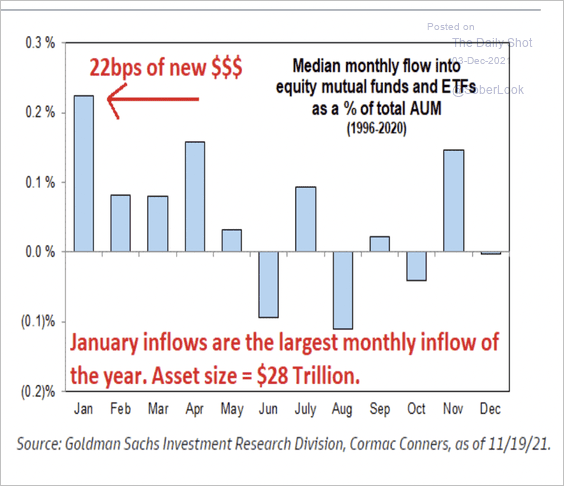 Source: Goldman Sachs
Back to Index
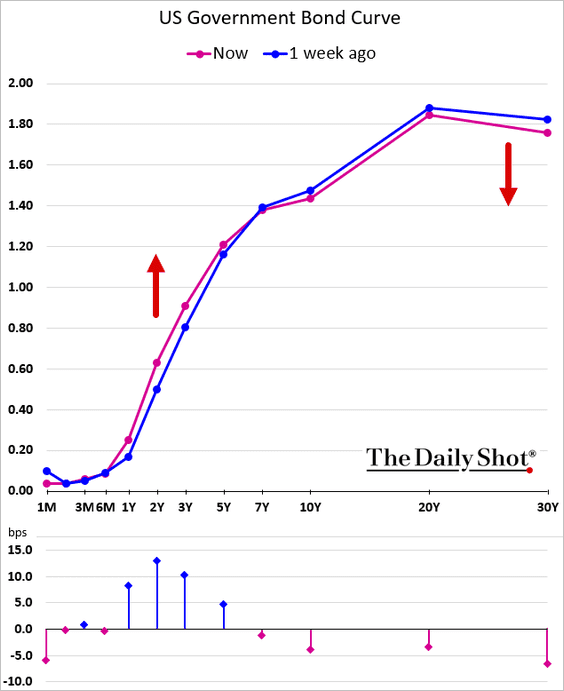
Rates
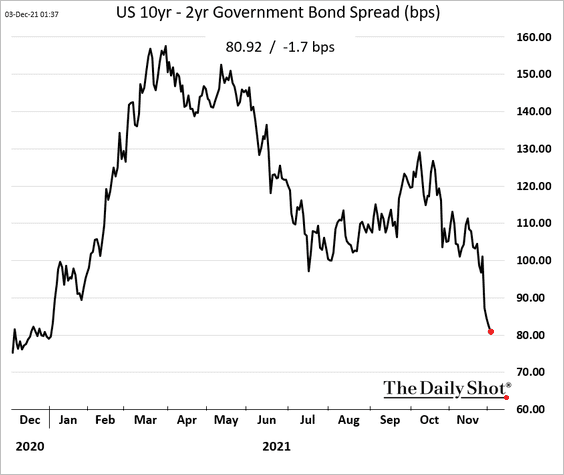
1. The Treasury curve continues to flatten.
——————–
2. The market expects the Fed to end its rate hiking cycle in late 2023.
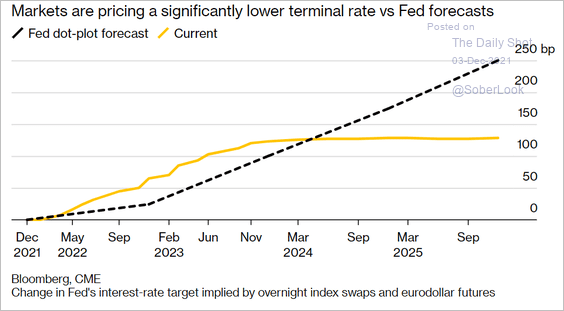 Source: @markets Read full article
Back to Index
Global Developments
1. Let’s start with the percentage of funds that saw inflows, by asset class.
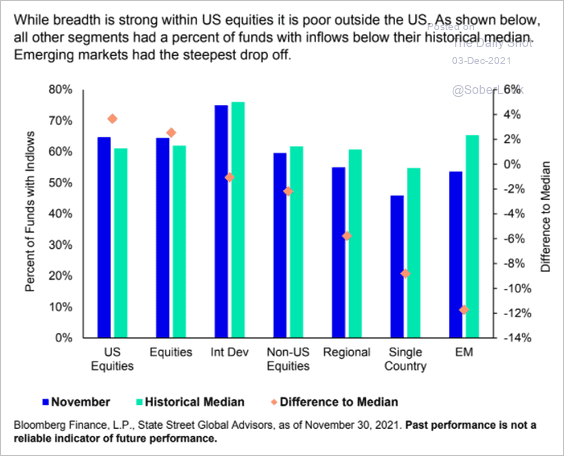 Source: SPDR Americas Research, @mattbartolini
2. Global debt is starting to decline as the economic recovery takes hold.
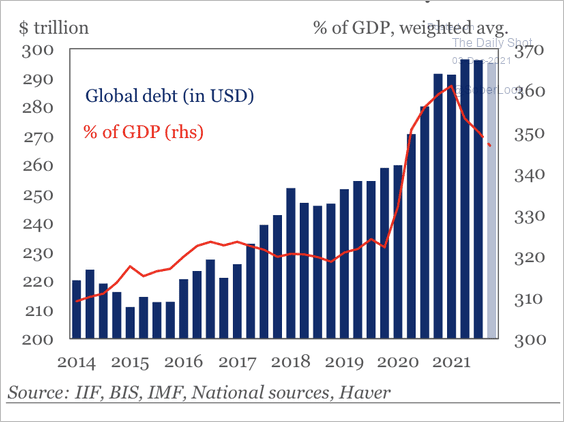 Source: IIF
3. Energy inflation surged across OECD economies:
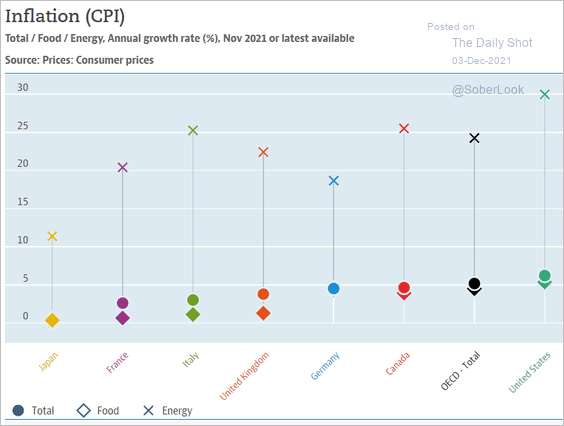 Source: OECD
4. Here is a look at Fidelity’s capital market assumptions in a low/high inflation scenario.
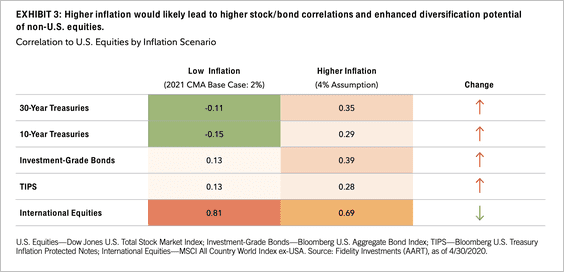 Source: Fidelity Investments Read full article
5. Financing needs by governments remain a vulnerability around the world.
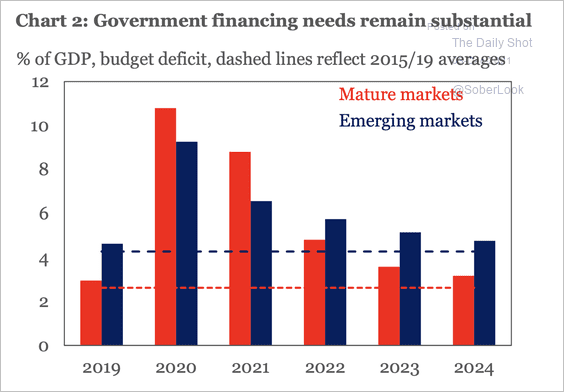 Source: IIF
——————–
Food for Thought
1. No more shopping on Thanksgiving day?
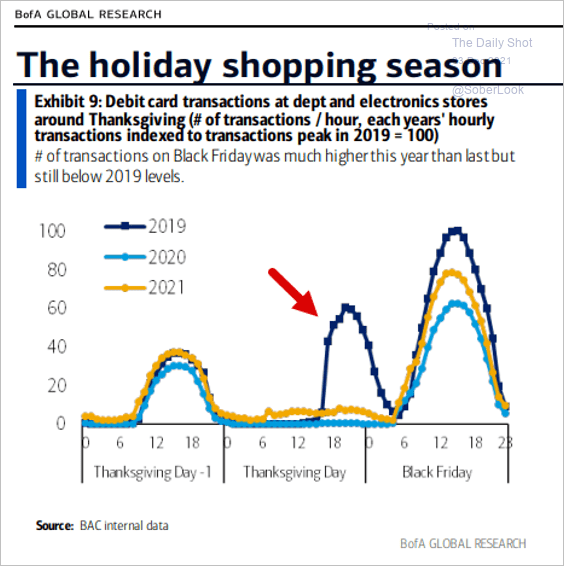 Source: BofA Global Research; @MikeZaccardi
2. Digital payments penetration:
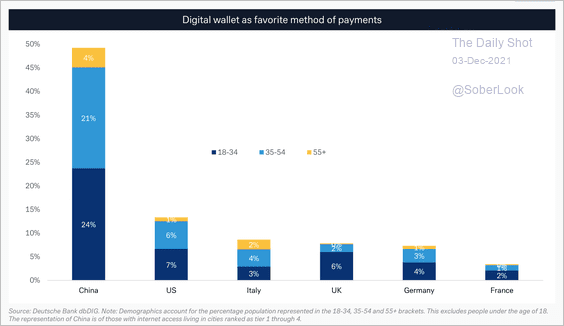 Source: Deutsche Bank Research
3. EV sales hit 10% of total vehicles sold.
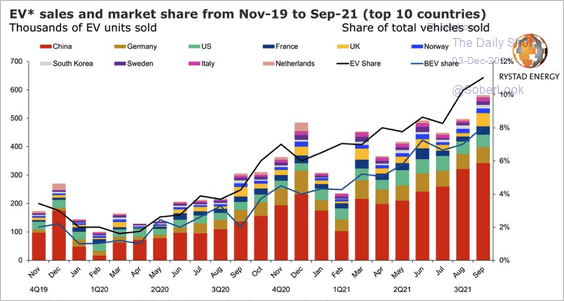 Source: @aeberman12 Read full article
The EV market:
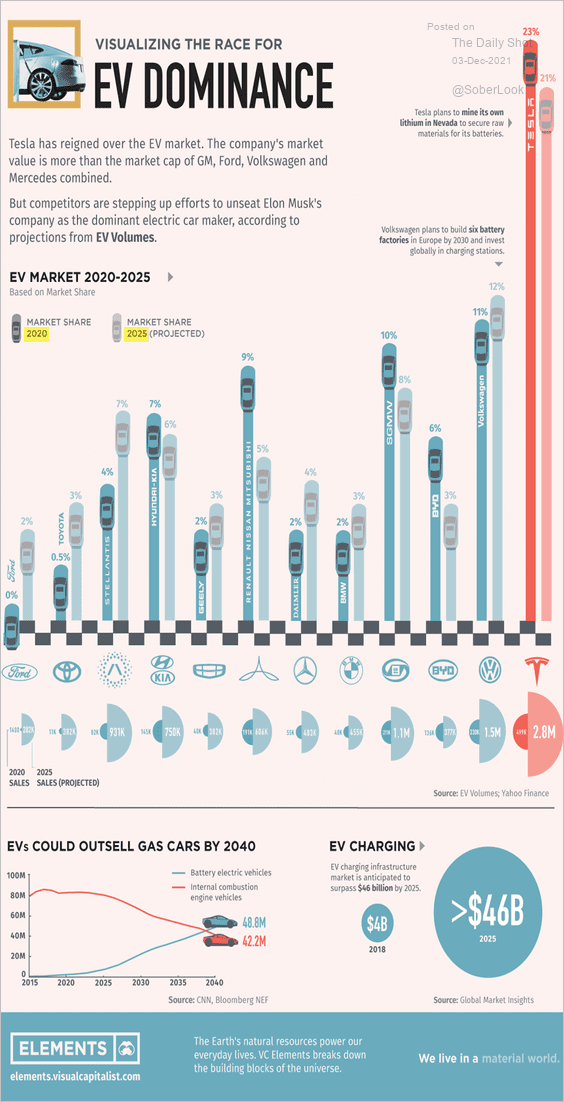 Source: Visual Capitalist Read full article
——————–
4. Auto loan originations in the US:
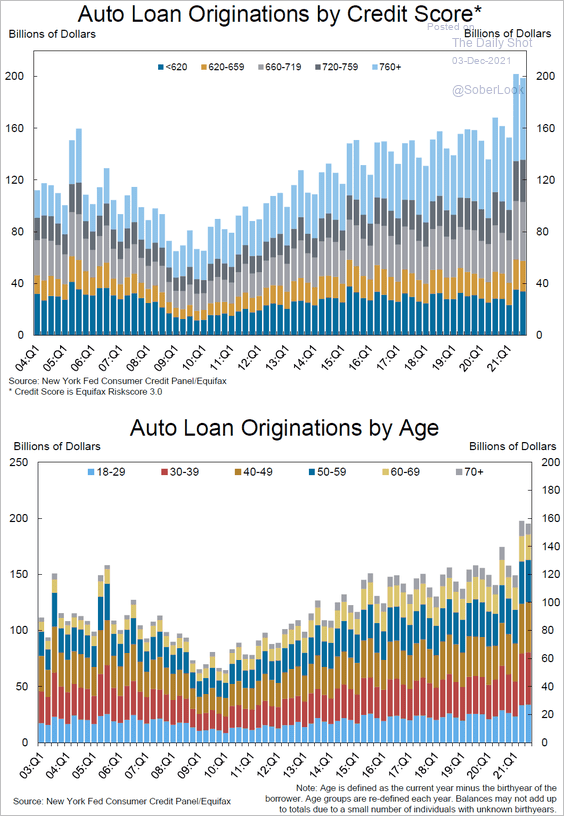 Source: NY Fed
5. Delinquent household loans in the US:
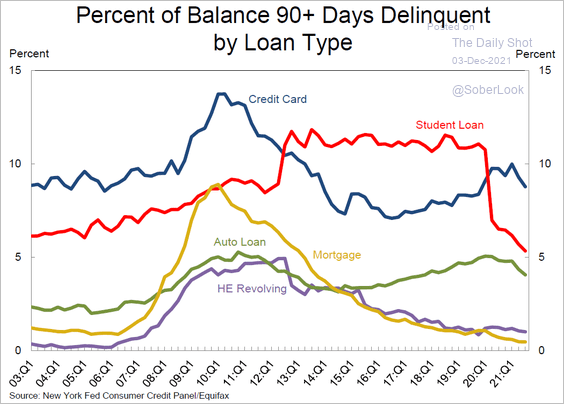 Source: NY Fed
6. Joining the top 1%:
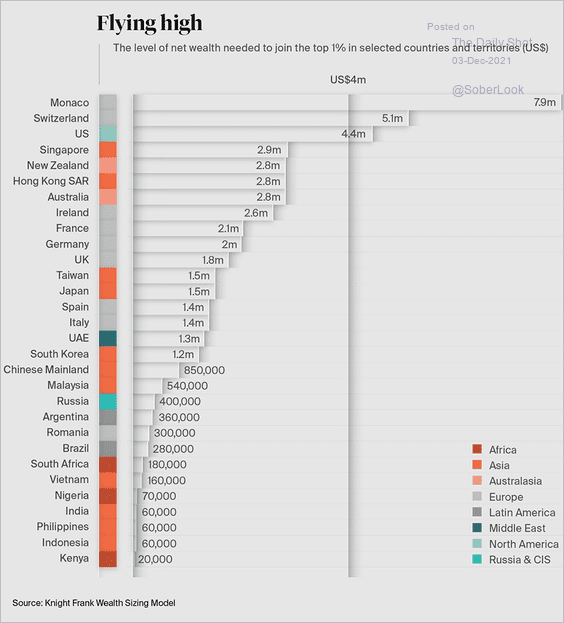 Source: Knight Frank Read full article
7. President Biden’s approval rating:
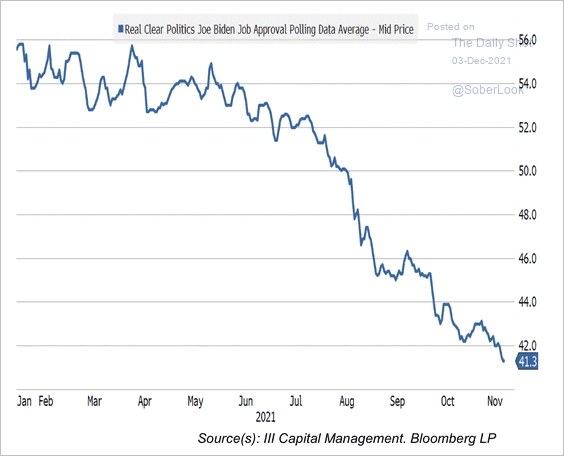 Source: III Capital Management
8. Production and accumulation of plastics:
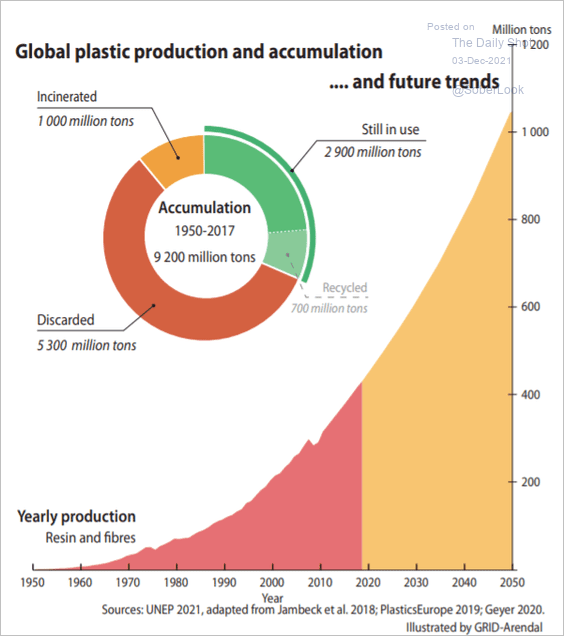 Source: UN Read full article
9. Second languages:
 Source: Visual Capitalist Read full article
——————–
Have a great weekend!
Back to Index