
The Daily Shot: 15-Dec-21
• The United States
• Canada
• The United Kingdom
• Europe
• China
• Emerging Markets
• Cryptocurrency
• Commodities
• Equities
• Credit
• Rates
• Global Developments
• Food for Thought
The United States
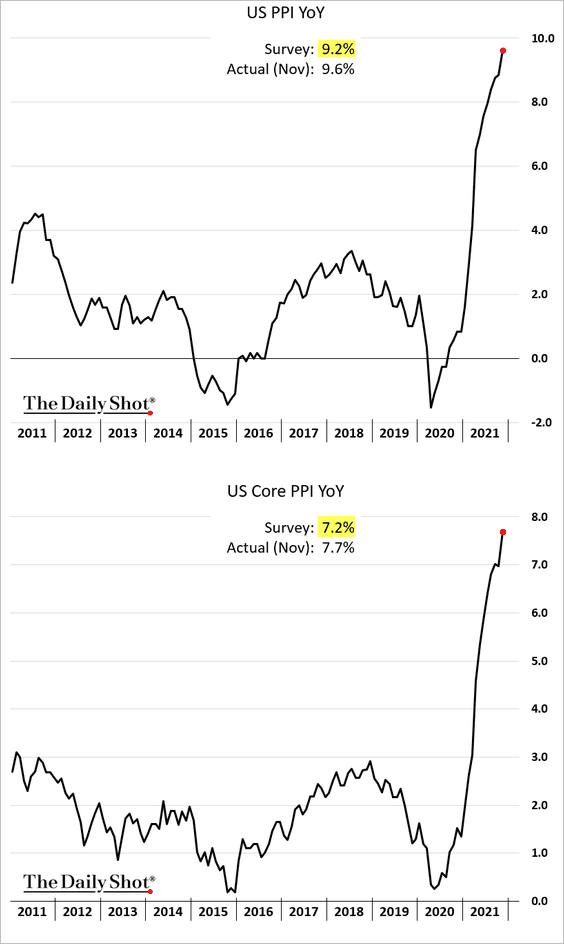
1. November producer price gains surprised to the upside, with the headline PPI approaching 10%.
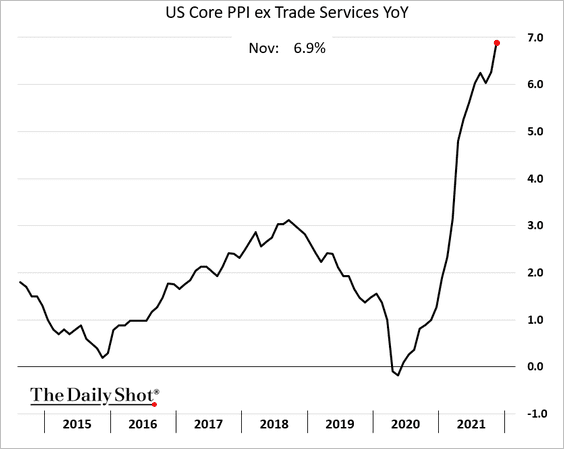
• The core PPI ex. trade services (business markups) surged as well.
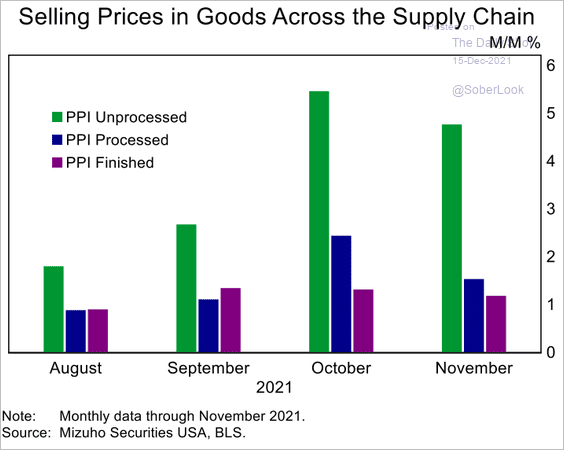
• The spread between upstream and downstream price gains points to margin pressures (that’s in addition to rising labor costs).
 Source: Mizuho Securities USA
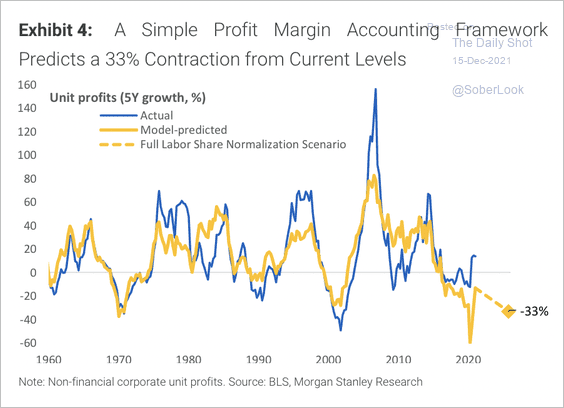
Morgan Stanley expects corporate profit margins to contract meaningfully from current levels.
 Source: SentimenTrader
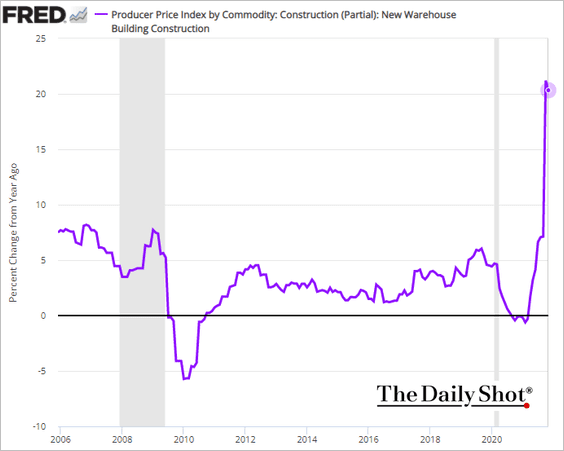
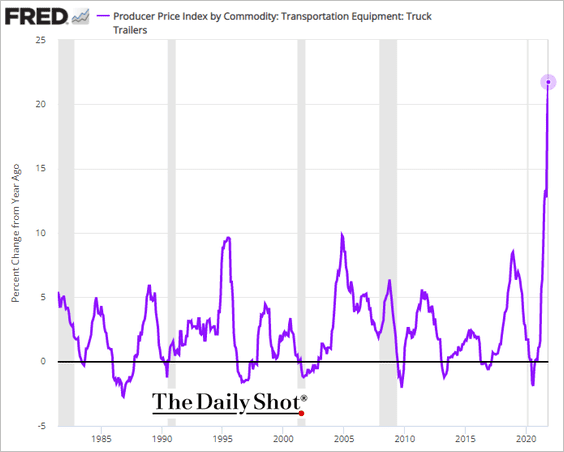
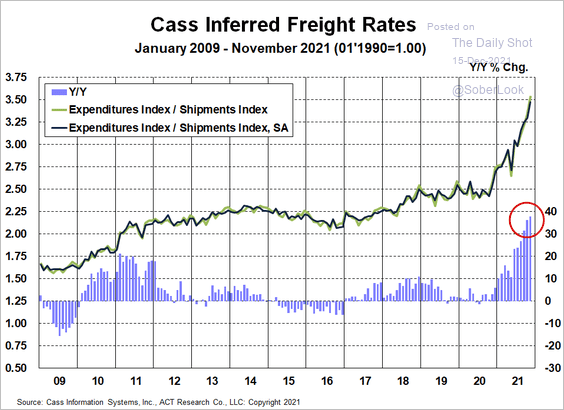
• Logistics bottlenecks continue to drive prices higher.
– Warehouse construction prices are up 20% vs. last year.
– And here is the PPI for semi-trailer trucks.
– A separate report from Cass Information Systems showed that freight rates have surged 38% over the past year, a new record.
 Source: Cass Information Systems
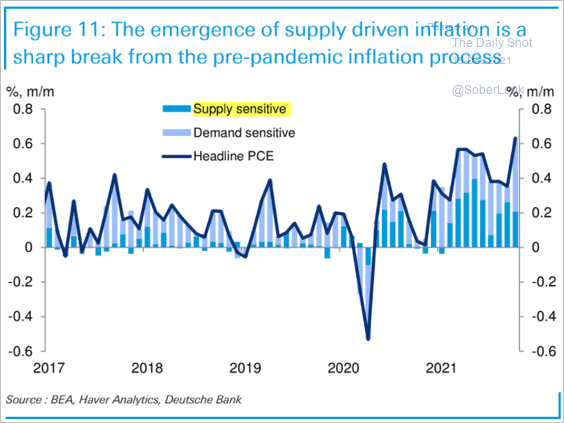
– By the way, supply-driven inflation has been feeding into consumer prices much more than we’ve seen in recent years.
 Source: Deutsche Bank Research
• Will the core PPI peak this month?
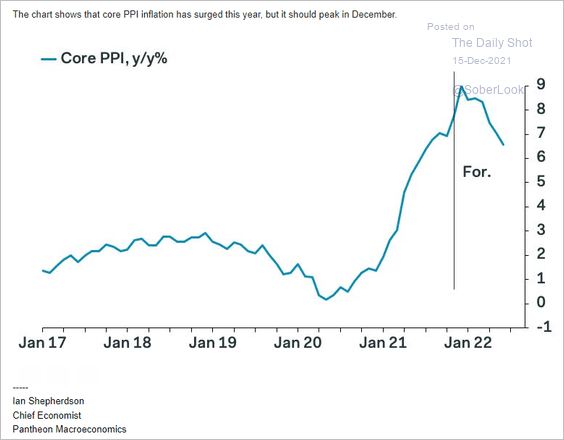 Source: Pantheon Macroeconomics
——————–
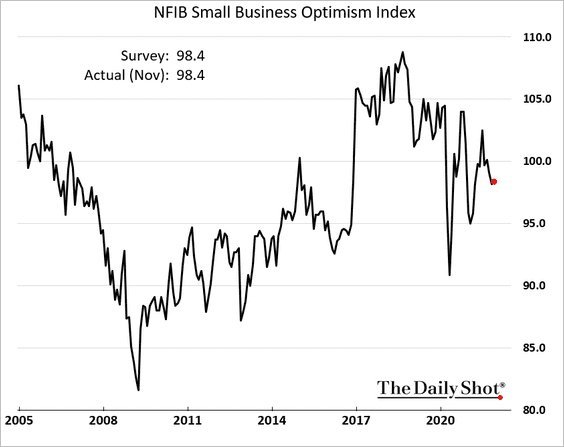
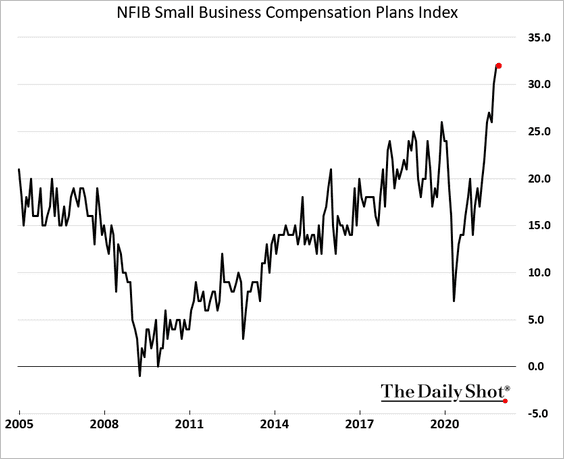
2. The NFIB small business sentiment index ticked higher.
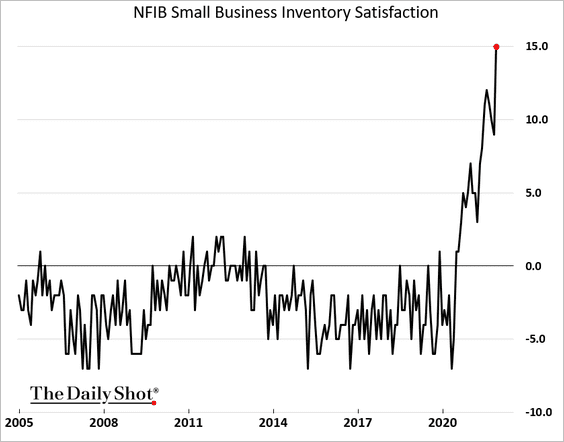
• Small businesses continue to struggle with supply shortages as inventories keep tightening.
• Inflation is increasingly a concern, …
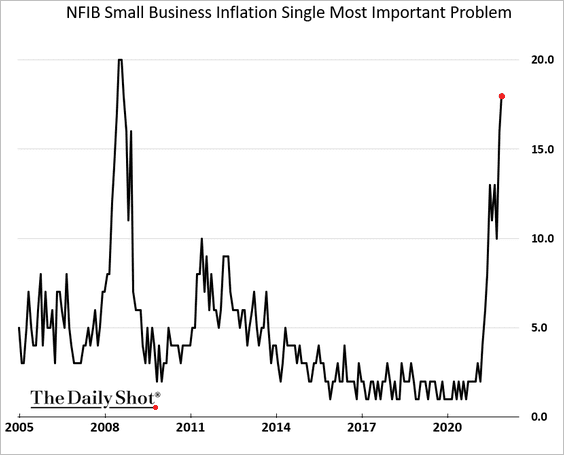
… as companies boost prices and plan to keep doing so in the months ahead.
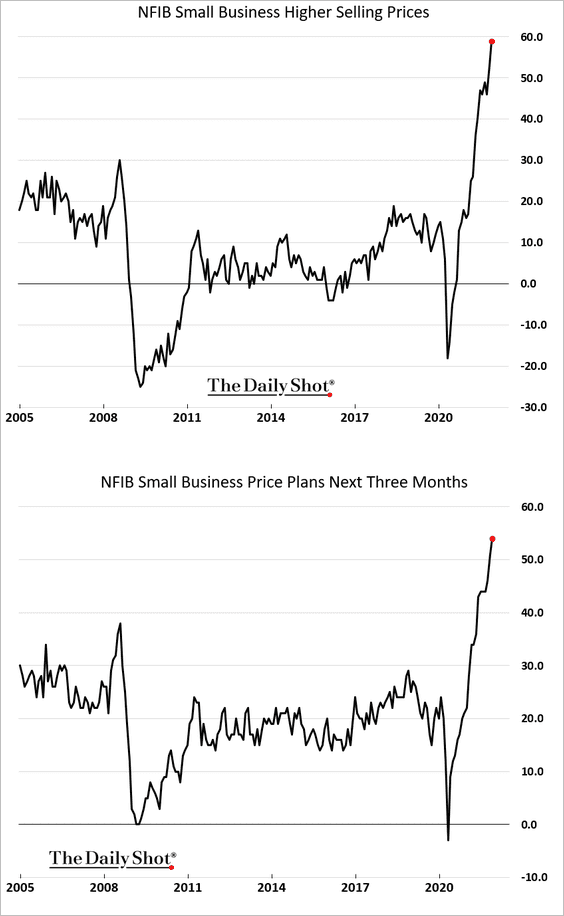
• Businesses also increasingly expect to raise wages.
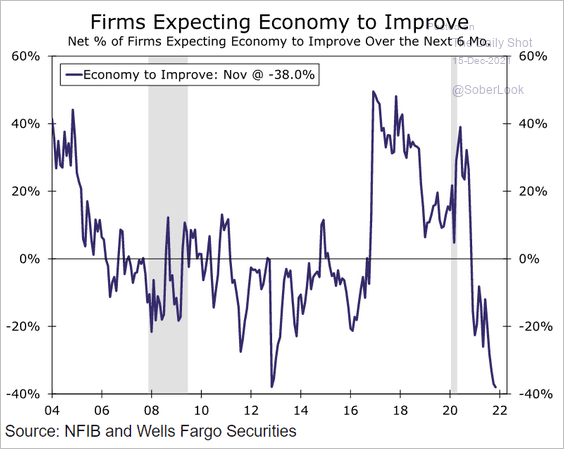
• The NFIB survey shows that companies see the economy tanking in the next six months.
 Source: Wells Fargo Securities
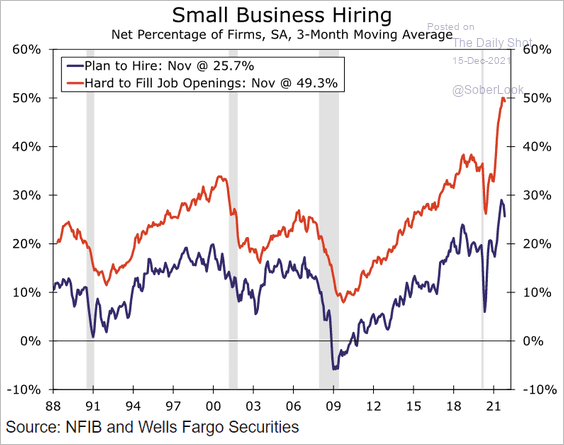
The above indicator is suspect because businesses that expect a sharp economic downturn generally do not go on a hiring spree.
 Source: Wells Fargo Securities
——————–
3. As we saw yesterday (chart), US consumers expect to boost spending next year. Much of the increase in spending expectations is coming from households making under $50k.
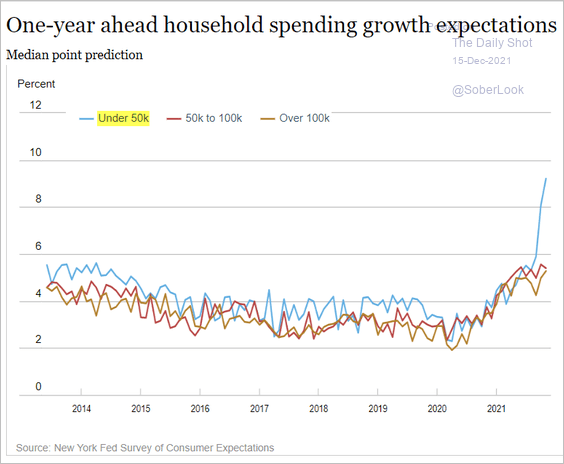 Source: NY Fed
• Physical store sales surged this year, with gains outpacing online stores.
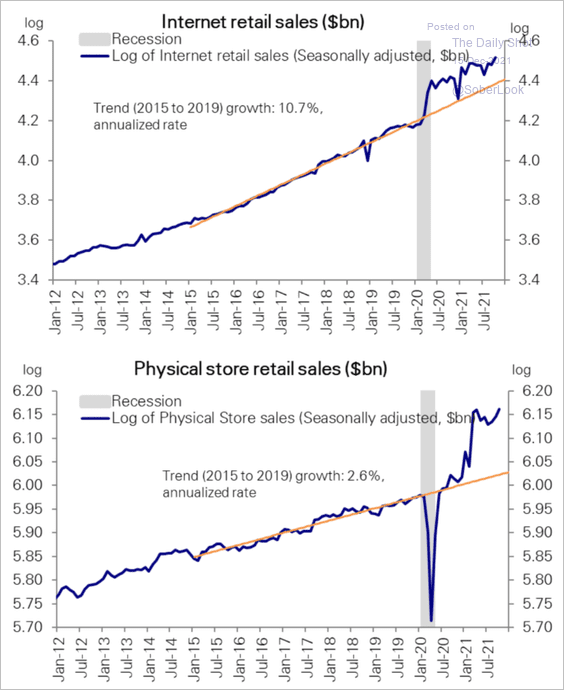 Source: Deutsche Bank Research
• The stock market points to robust holiday sales this year
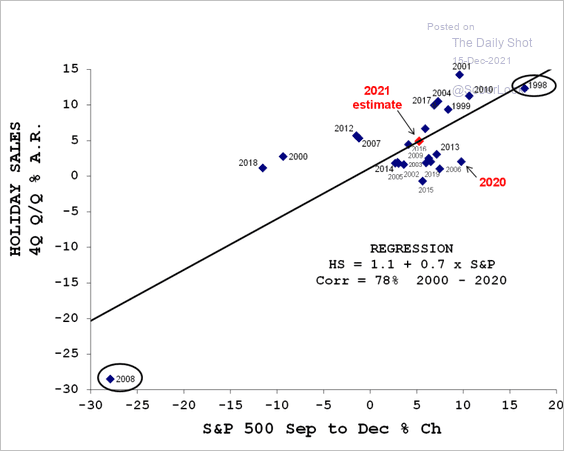 Source: Evercore ISI Research
Back to Index
Canada
1. Inventory rebuilding should boost Canada’s GDP growth next year.
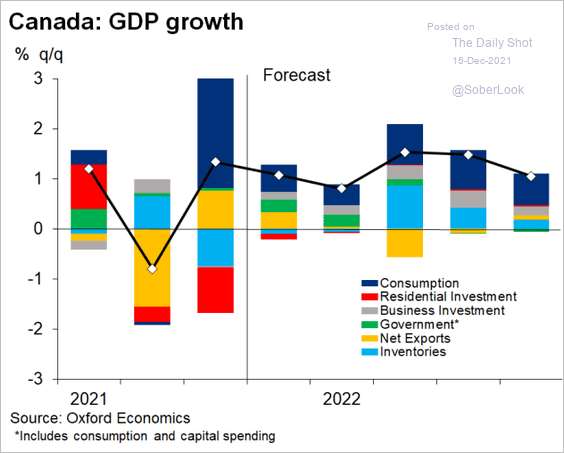 Source: Oxford Economics
2. Household leverage is now substantially higher than in the US. One caveat is that Canada’s disposable income is more “disposable” than that of US households (due to healthcare expenses in the US).
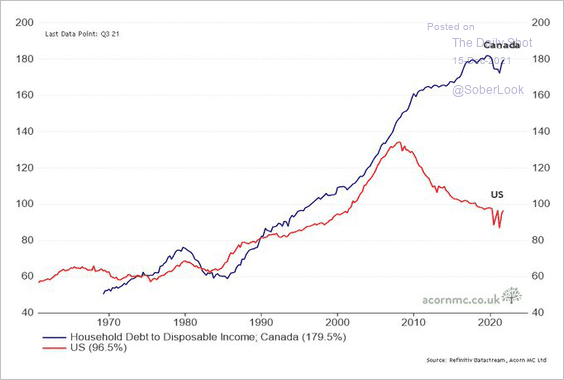 Source: @RichardDias_CFA
3. Banks have been reversing loan loss provisions.
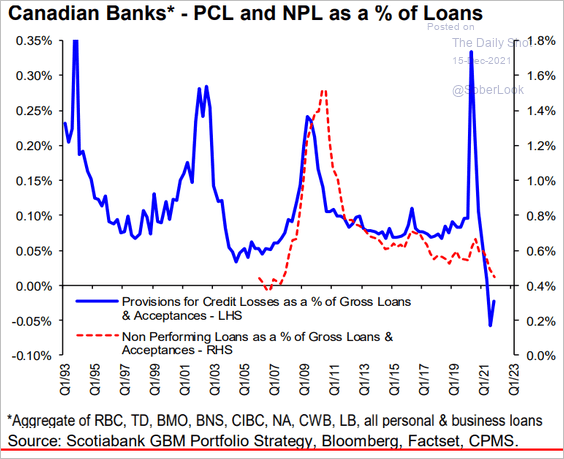 Source: Hugo Ste-Marie, Portfolio & Quantitative Strategy Global Equity Research, Scotia Capital
But loan growth remains soft.
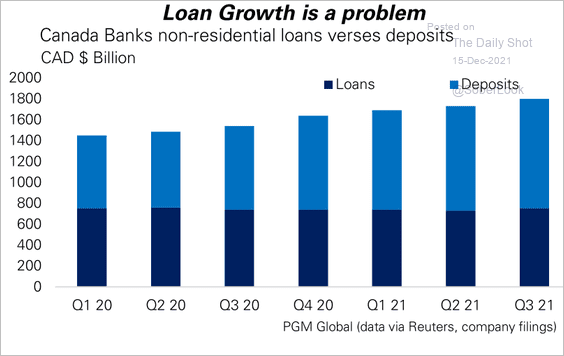 Source: PGM Global
Back to Index
The United Kingdom
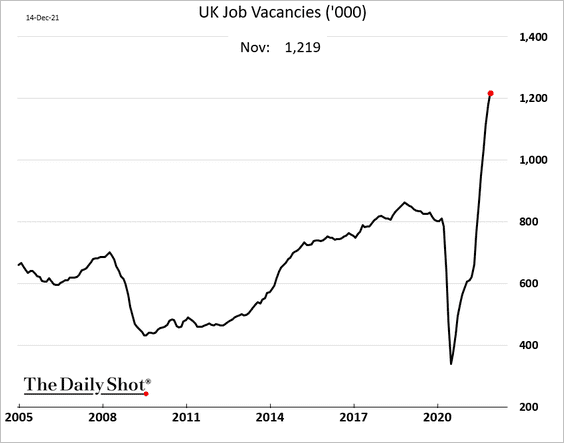
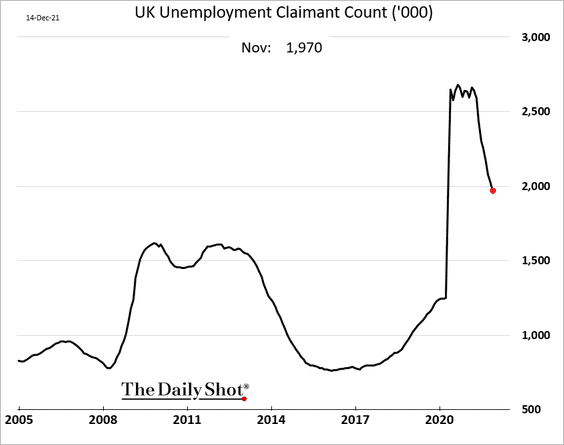
1. The labor market continues to tighten as payrolls surge.
– Payrolls:
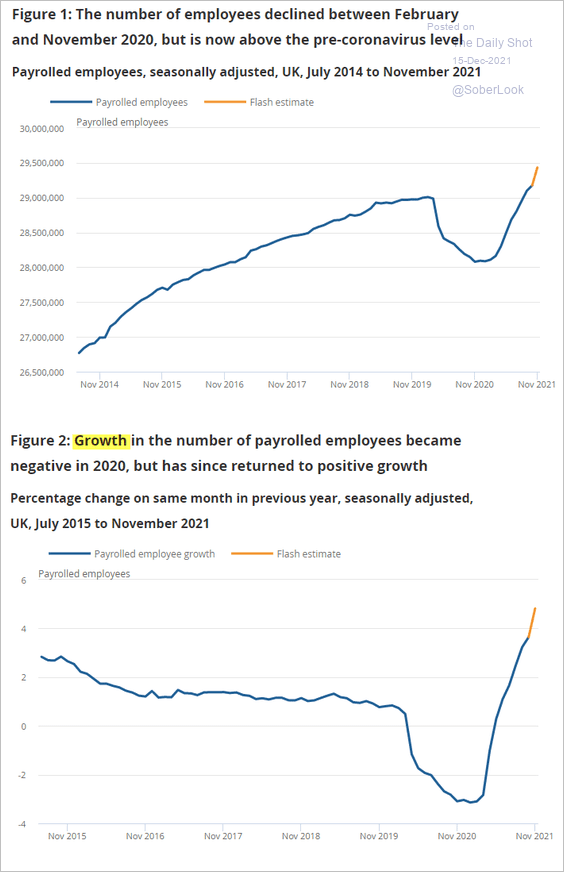 Source: ONS
– Vacancies:
• Jobless claims have room to decline.
• Part-time work has picked up.
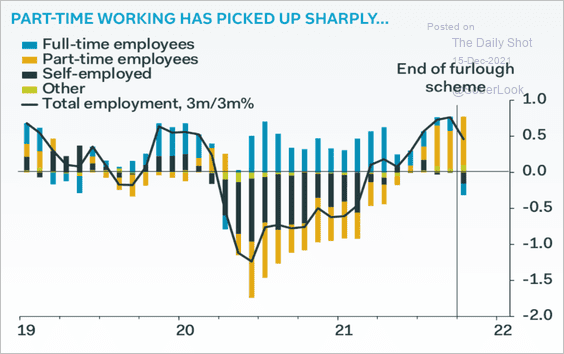 Source: Pantheon Macroeconomics
——————–
2. Business closures accelerated this year.
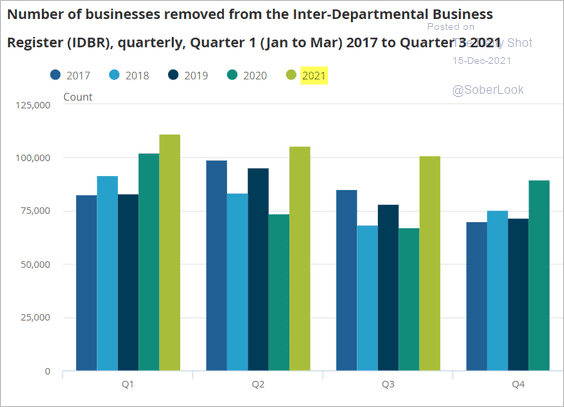 Source: ONS Read full article
Back to Index
Europe
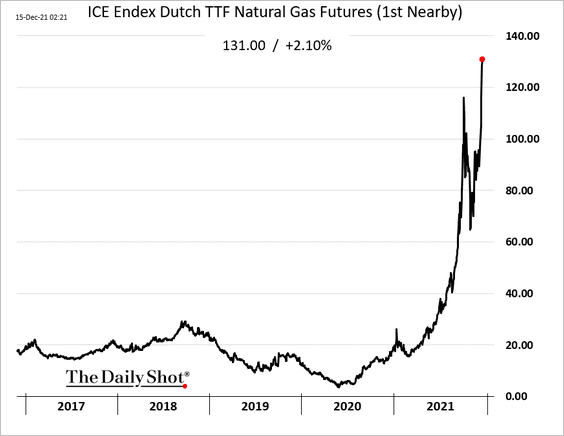
1. European natural gas prices continue to hit record highs.
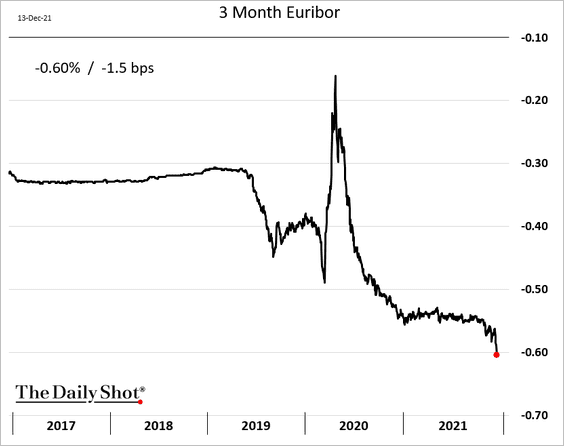
2. The ECB-driven glut of liquidity in the euro-area banking system sent interbank rates to record lows.
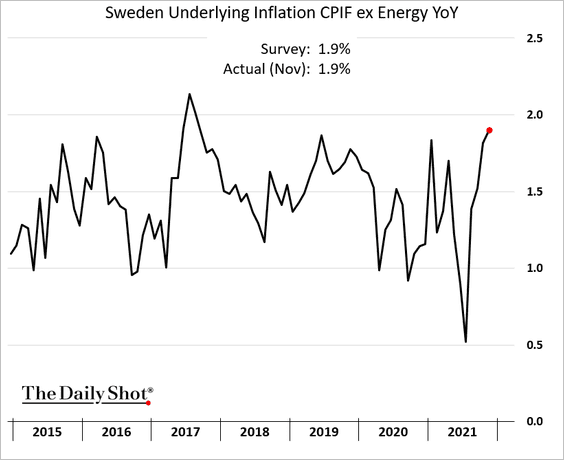
3. Sweden’s core inflation is holding below 2%.
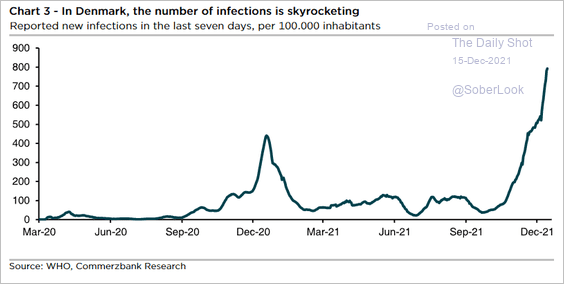
4. Denmark’s COVID cases surge.
 Source: Commerzbank Research
5. European stocks are increasingly attractive relative to the US.
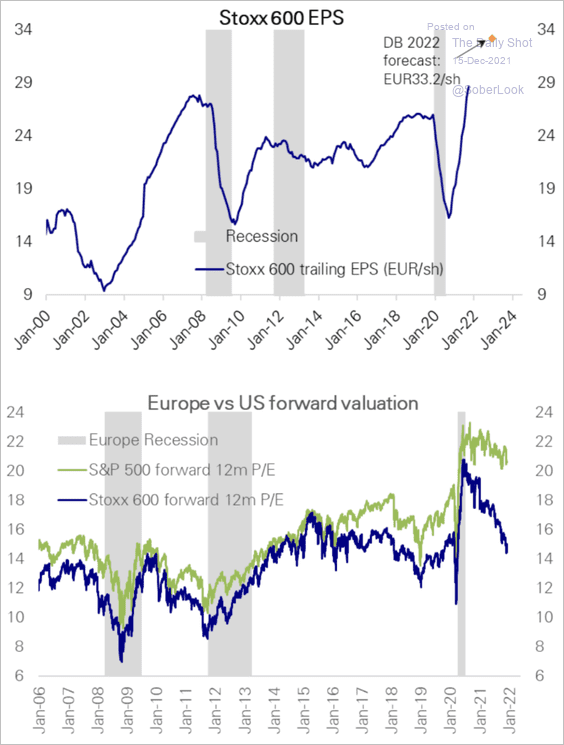 Source: Deutsche Bank Research
Back to Index
China
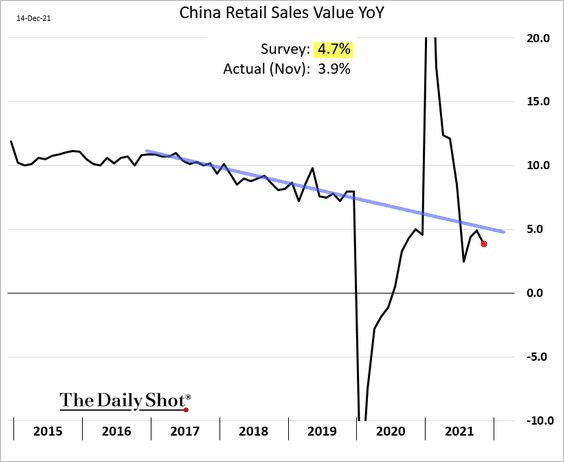
1. The November economic report was lackluster.
• Industrial production ticked higher on a year-over-year basis.
• But retail sales growth was disappointing.
——————–
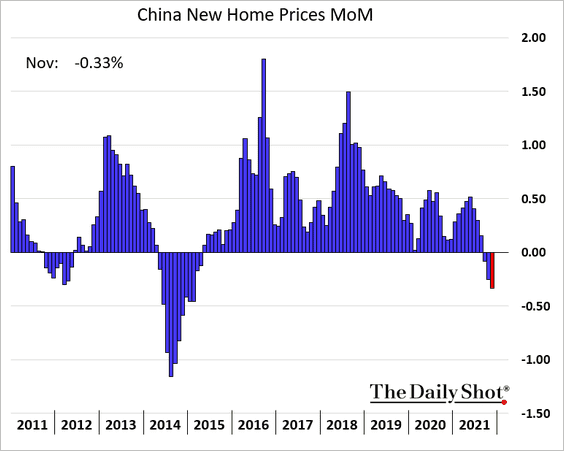
2. New home prices declined for the third month in a row.
3. Account receivables look stretched.
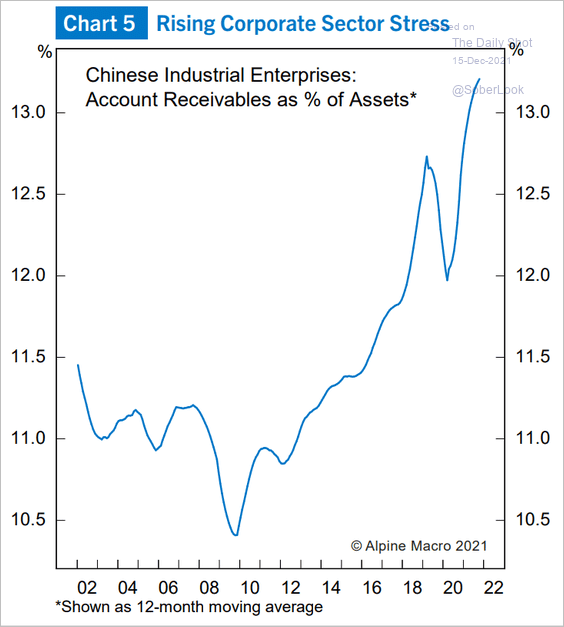 Source: Alpine Macro
Back to Index
Emerging Markets
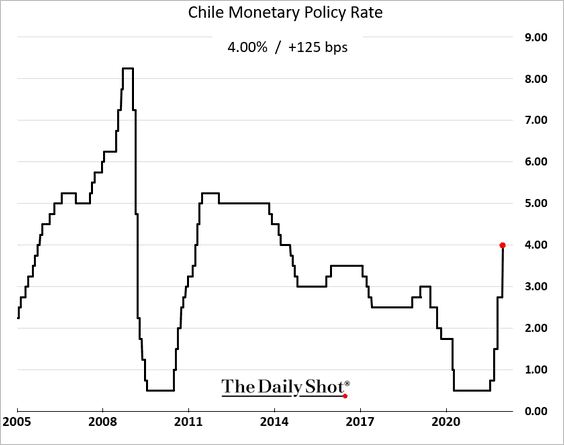
1. Chile’s central bank hiked rates by 125 bps as inflation strengthens.
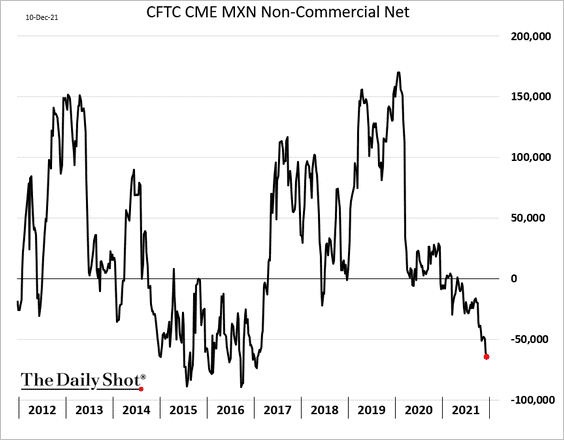
2. Traders are increasingly betting against the Mexican peso.
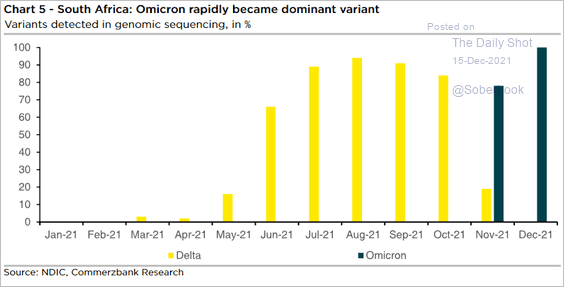
3. Omicron is becoming the dominant variant in South Africa.
 Source: Commerzbank Research
Nonetheless, South Africa’s mobility tracker isn’t budging.
![]() Source: Capital Economics
Source: Capital Economics
——————–
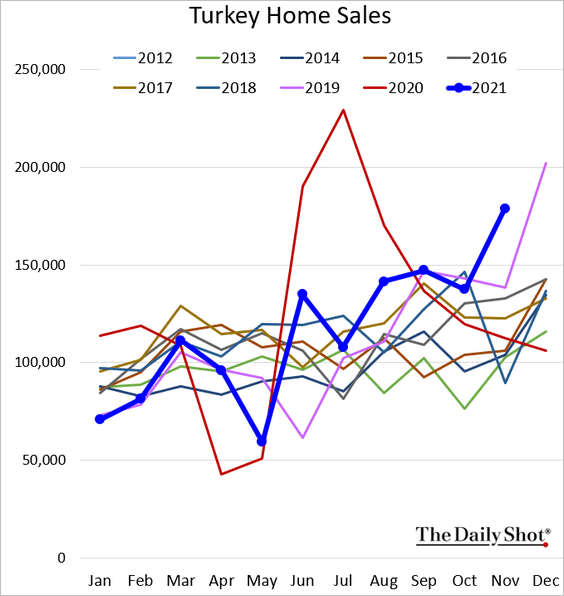
4. The Turkish lira continues to plunge.
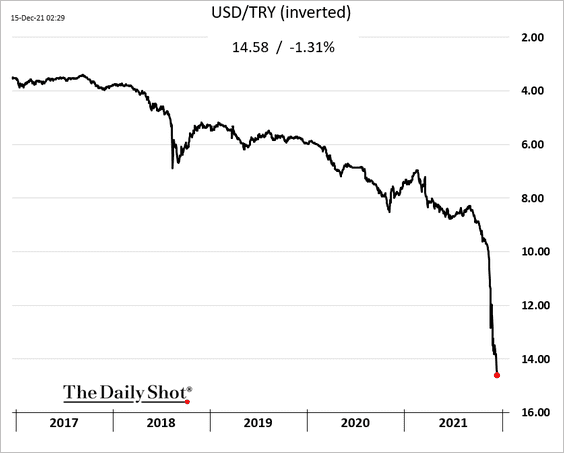
With the currency collapsing, demand for homes has accelerated again.
 Source: Reuters Read full article
——————–
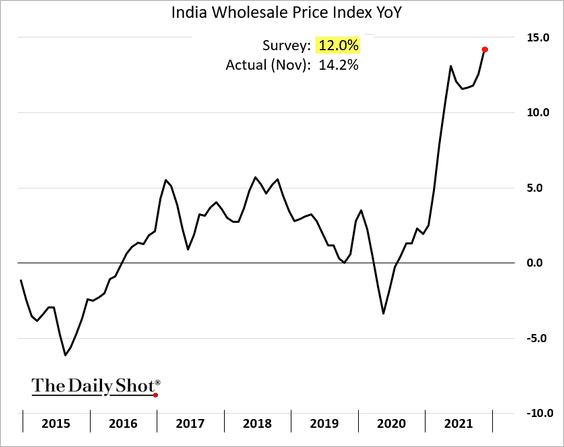
5. India’s wholesale prices surprised to the upside.
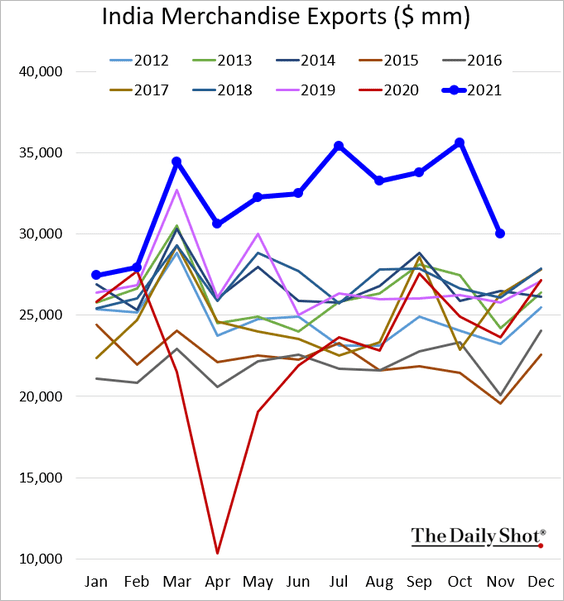
Exports eased but remain well above 2018/19 levels.
——————–
6. EM Asia currencies have outperformed.
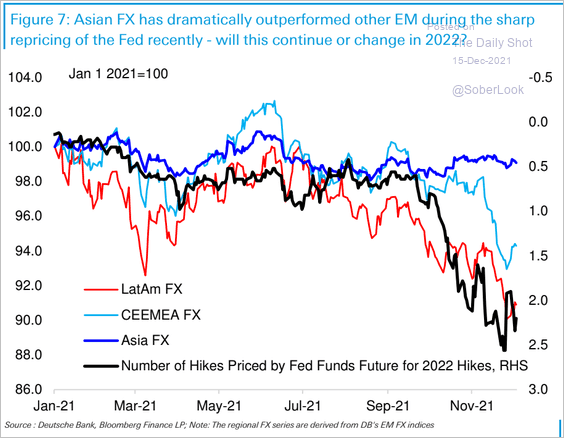 Source: Deutsche Bank Research
Back to Index
Cryptocurrency
1. Polygon’s MATIC token has outperformed most of its peers so far this month. Still, most altcoins are underperforming bitcoin, which could reflect lower appetite for risk among crypto investors.
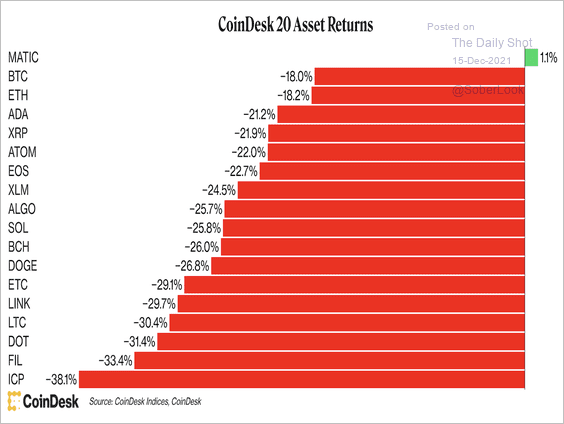 Source: CoinDesk Read full article
2. Bitcoin’s trading volume continues to decline across major exchanges.
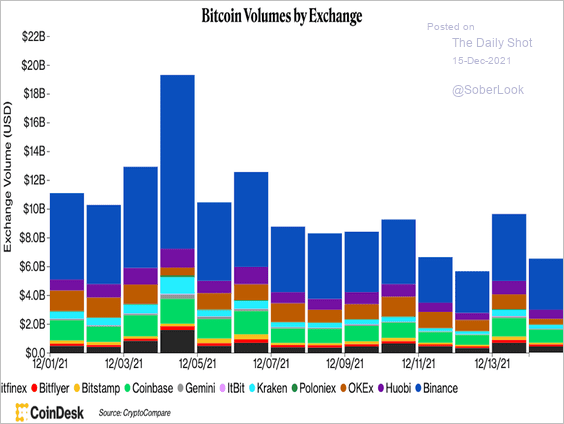 Source: CoinDesk
3. 90% of bitcoin’s 21 million available coins have been mined.
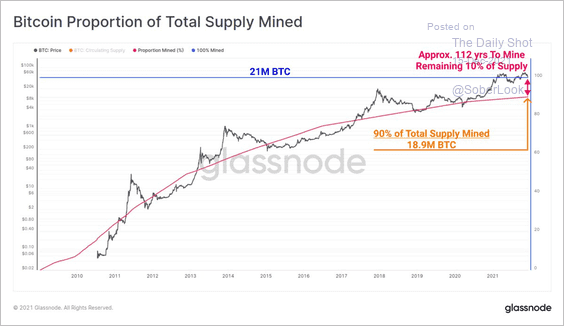 Source: @glassnode
4. The US Senate Banking Committee heard from stablecoin experts on Tuesday to discuss future regulation. There are plenty of risks, although the regulatory timeline remains unclear.
 Source: Blockworks Read full article
By the way, stablecoin volumes track crypto trading.
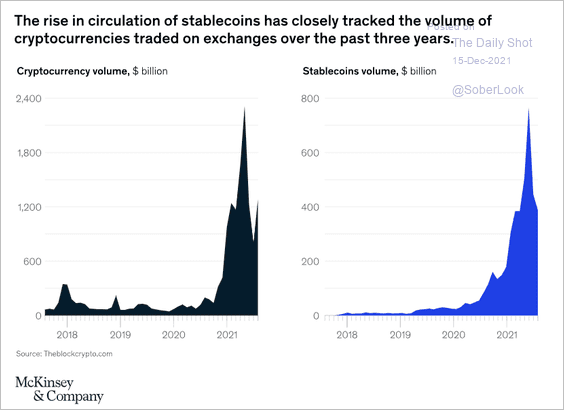 Source: McKinsey Read full article
Back to Index
Commodities
1. The occurrence of a La Niña phenomenon for a second consecutive year could cause further damage to the Australian wheat crop over the coming weeks, according to Fitch Solutions.
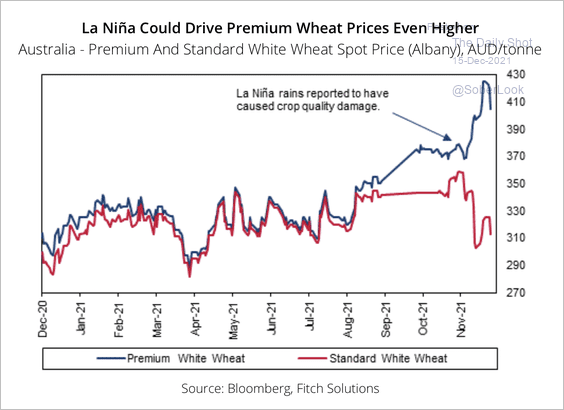 Source: Fitch Solutions Macro Research
 Source: @markets Read full article
Fitch expects global wheat prices to remain elevated in the short term before heading lower next year.
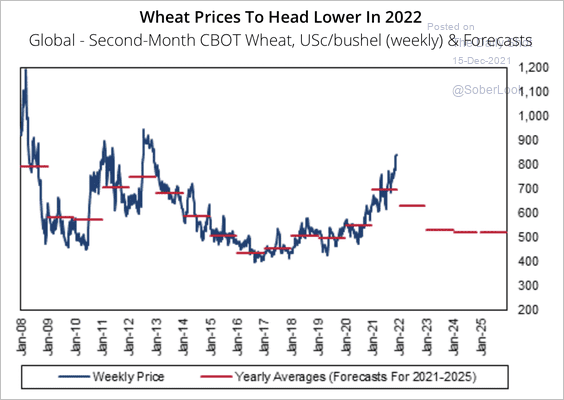 Source: Fitch Solutions Macro Research
——————–
2. Mining margins are expected to remain strong.
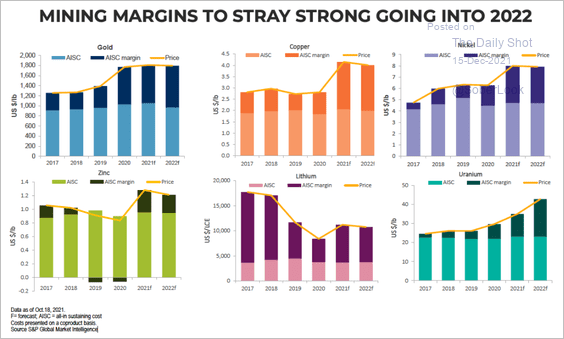 Source: mining.com Read full article
Back to Index
Equities
1. Fund managers have increased their cash holdings.
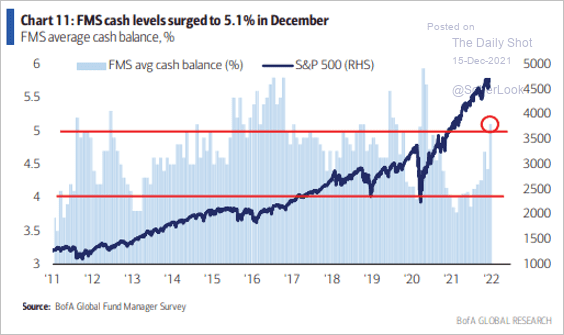 Source: BofA Global Research; @FerroTV
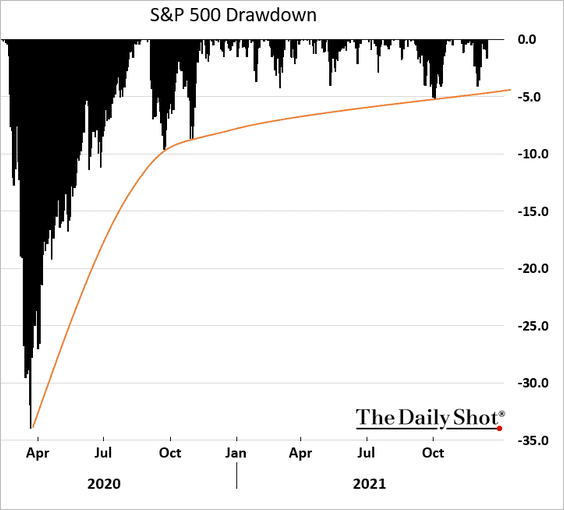
2. The current bull market has been tracking the pattern of the late-90s very closely. Next year could be volatile.
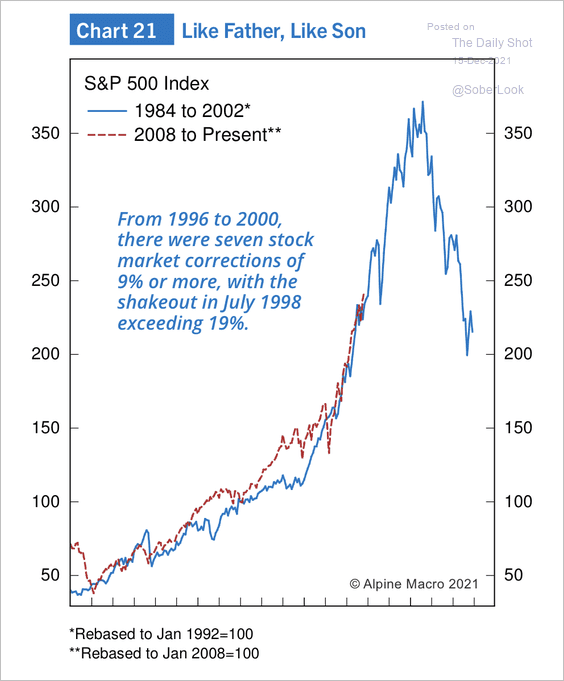 Source: Alpine Macro
3. Earnings gains and higher stock prices coexisted even as the Fed’s bond portfolio shrank during much of the last expansion.
 Source: Citi Private Bank
4. Stock market’s correlation to the US dollar has turned positive (30-day correlation).
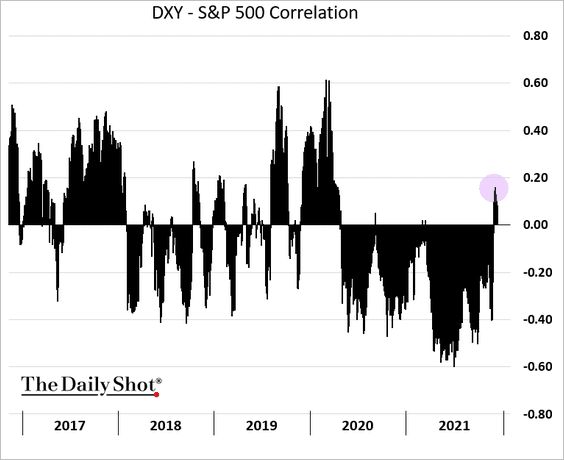 h/t Robert Fullem
5. Share buybacks accelerated this year.
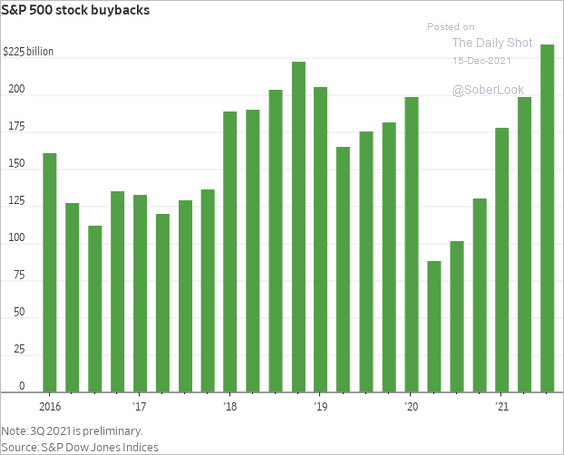 Source: @WSJ Read full article
6. Stocks with high options trading volume (often dominated by retail investors) have underperformed sharply this month (2 charts).
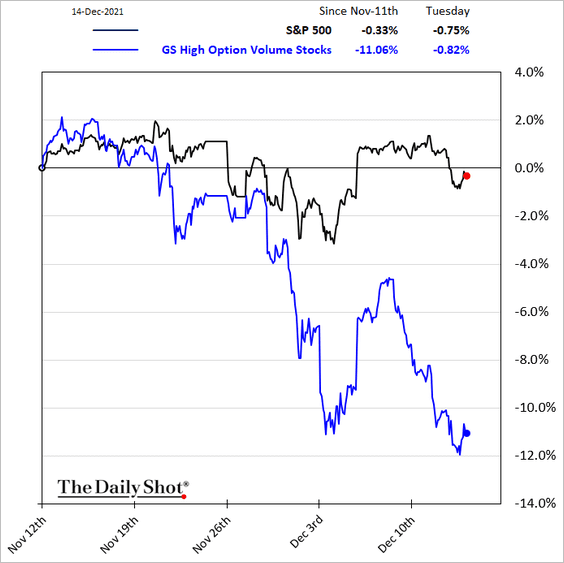
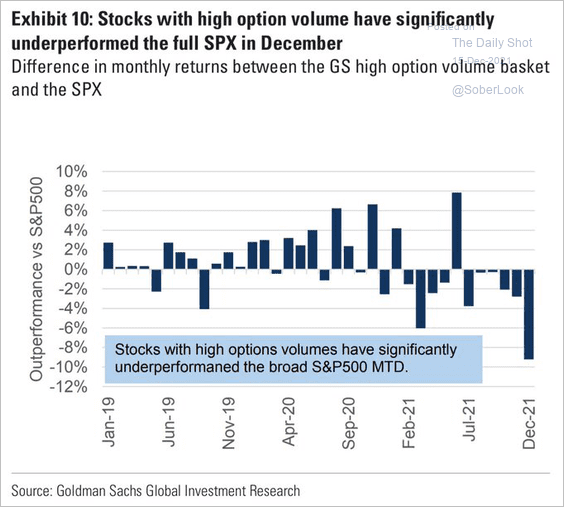 Source: Goldman Sachs; @WallStJesus
——————–
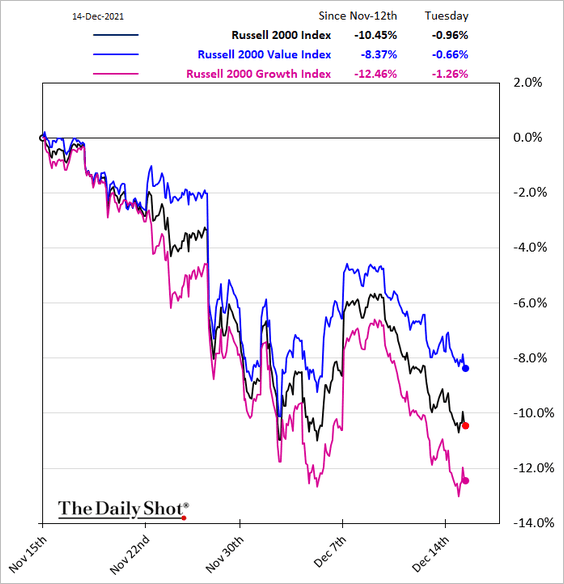
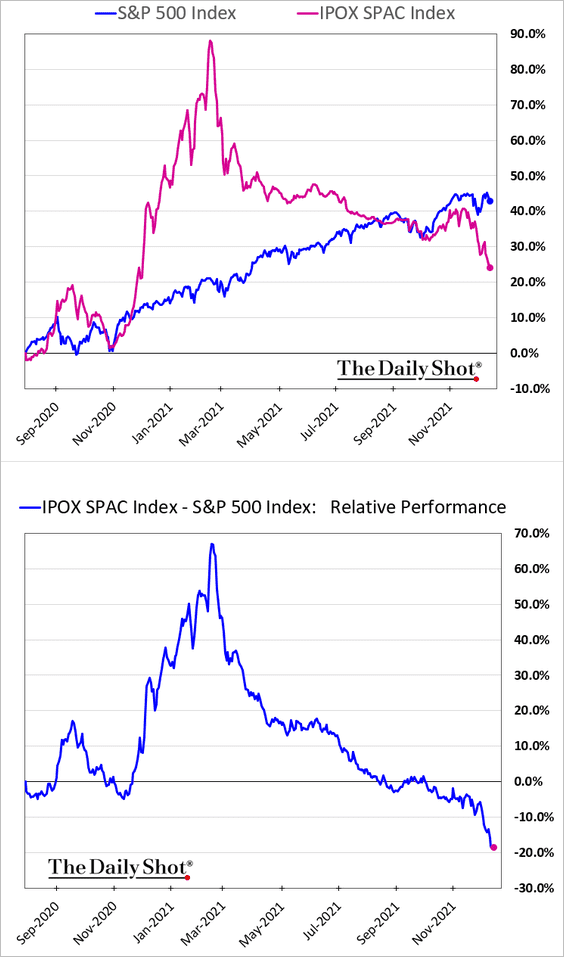
7. Small-cap growth stocks continue to underperform.
8. The SPAC bubble keeps deflating.
9. Dip buyers have become increasingly aggressive. Here is what JPMorgan’s Clinton Warren had to say on Bloomberg TV.
We have clients calling in historically when the market pulled back 10%, and then those clients calling in to buy at 5%, and now it’s 2%. Any 2% move or so, clients are getting in.
Back to Index
Credit
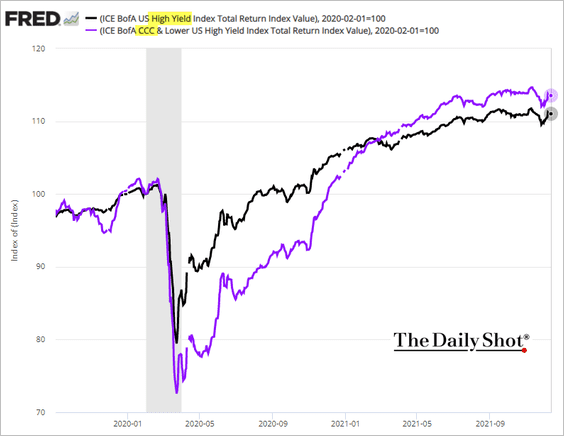
1. CCC-rated bonds have outperformed the overall HY market since the start of the pandemic.
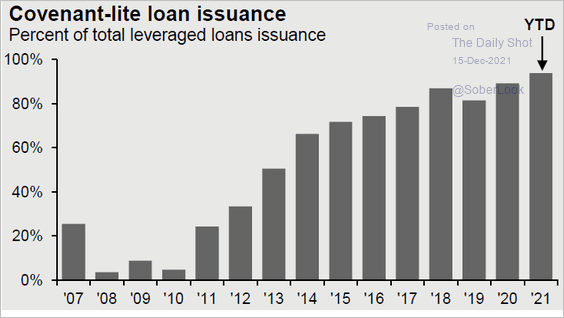
2. Covenant-lite loans are approaching 100% of the new-issue market.
 Source: J.P. Morgan Asset Management
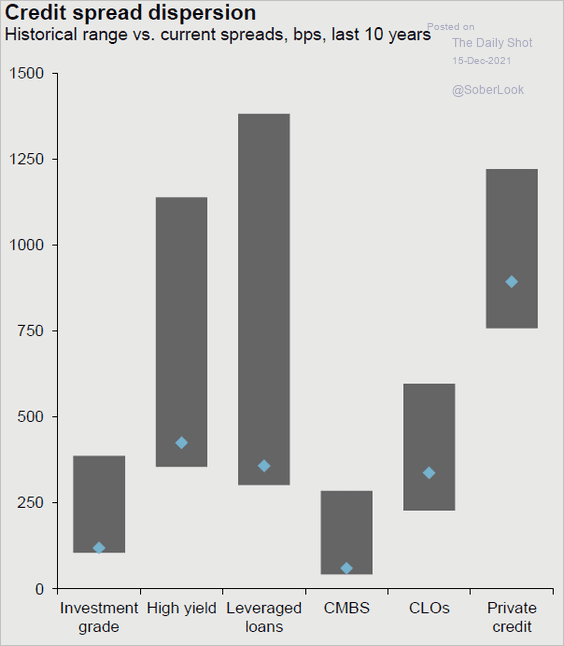
3. This chart shows spread dispersion across credit markets over the past decade.
 Source: J.P. Morgan Asset Management
Back to Index
Rates
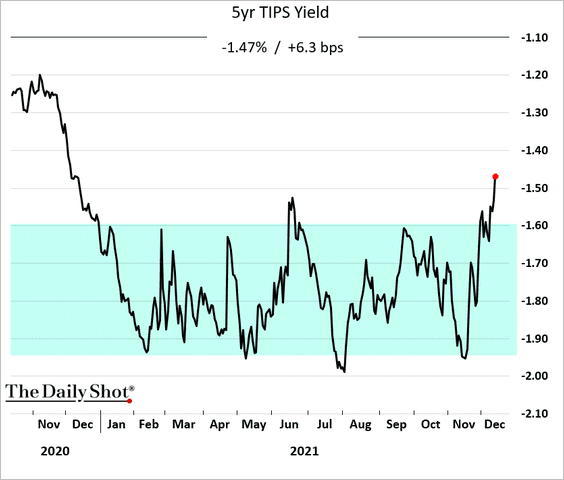
1. The 5-year TIPS yield (real rate) has broken out of its 2021 trading range. This is not a good sign for high-multiple growth stocks.
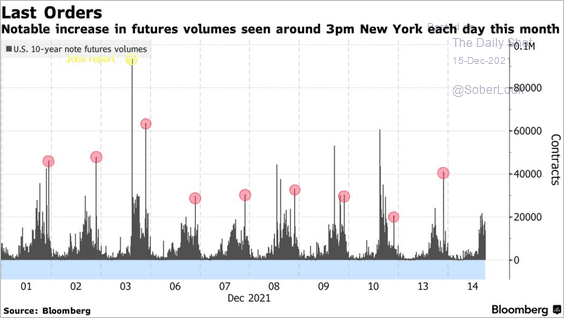
2. The 10yr Treasury note futures volume has been rising around 3 PM NY time every day this month. Large institutions are doing some rebalancing.
 Source: @markets Read full article
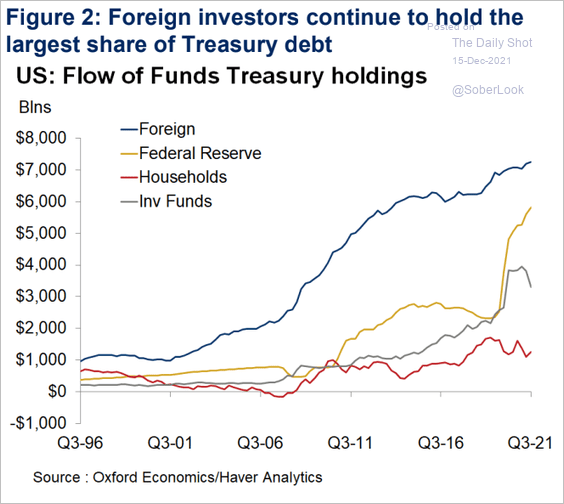
3. Here is the evolution of Treasury holdings by key investor groups.
 Source: Oxford Economics
Back to Index
Global Developments
1. Global equity valuations have diverged this year, with materials and energy lagging.
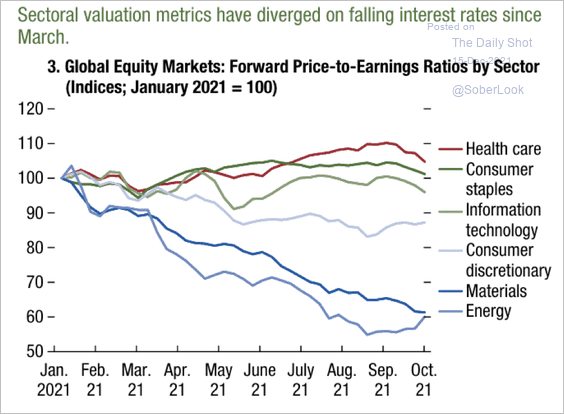 Source: IMF
2. The number of countries with positive relative trend scores versus the S&P 500 declined to the lowest level since July. When country ETFs underperform to this extent, annualized returns for broad-based global equities are unfavorable.
 Source: SentimenTrader
3. Equities, not rates, drive FX market vol.
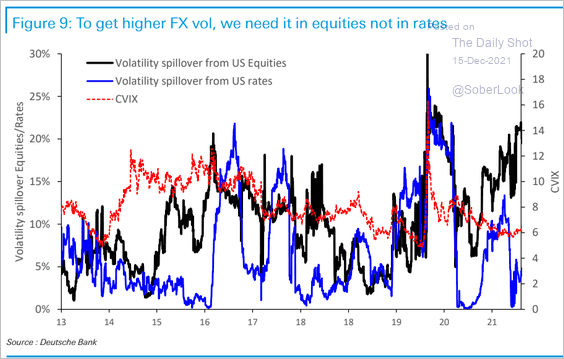 Source: Deutsche Bank Research
4. This chart shows home price appreciation by country alongside rent price growth and rental yield change.
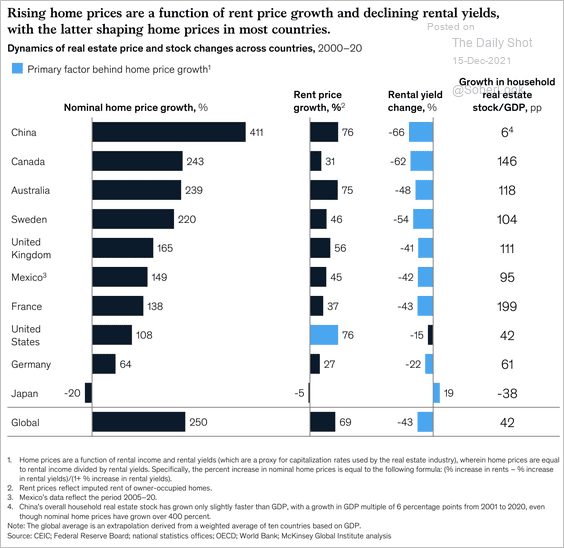 Source: McKinsey Global Institute Read full article
——————–
Food for Thought
1. Share of SUVs in total passenger car sales:
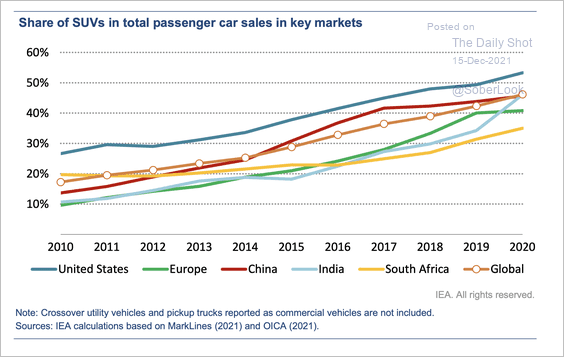 Source: International Energy Agency
2. Next, we have some updates on the EV market.
• EV fleet growth:
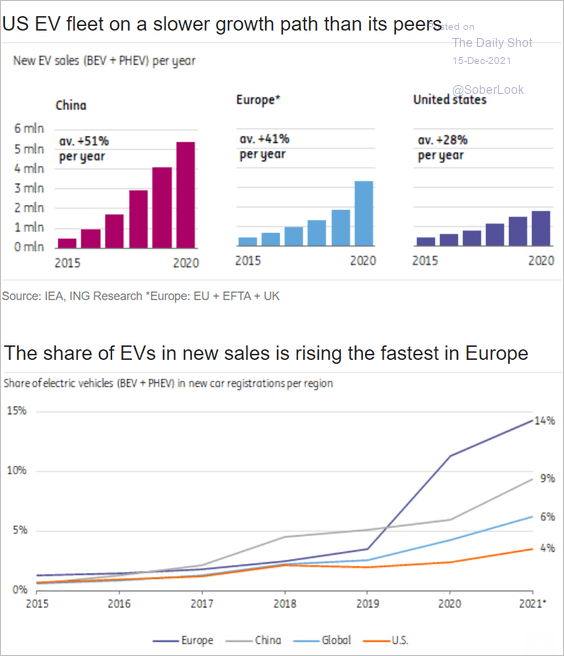 Source: ING
• Market share by company:
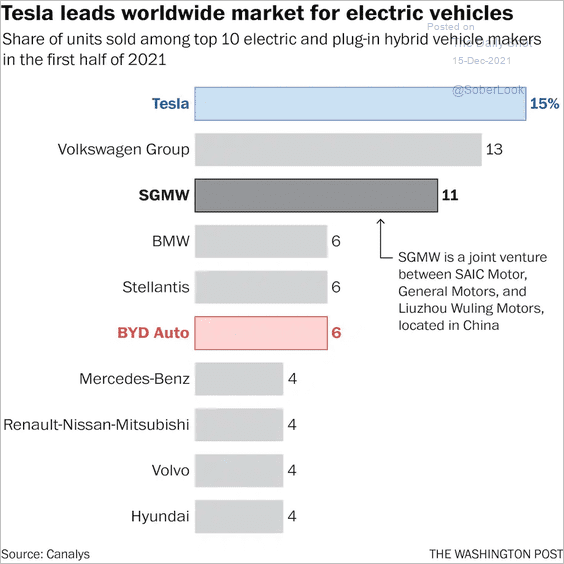 Source: The Washington Post Read full article
• Penetration rates:
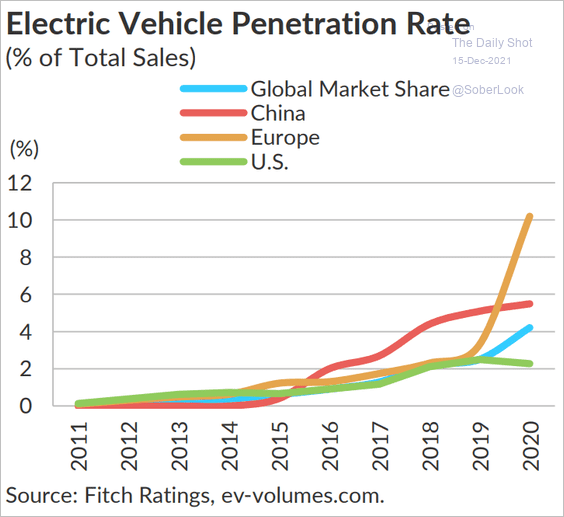 Source: Fitch Ratings
——————–
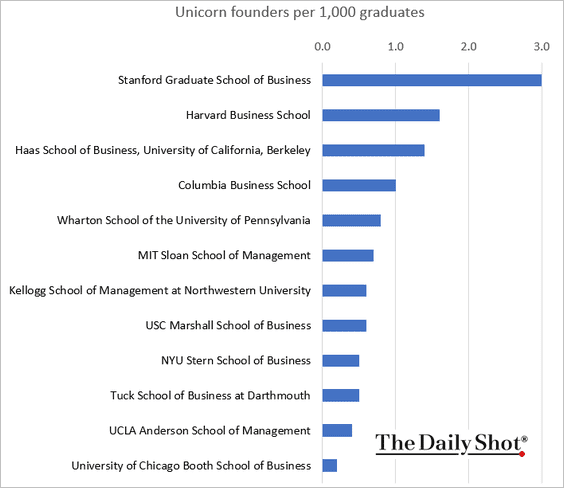
3. Unicorn founders by MBA program:
4. World population growth projections:
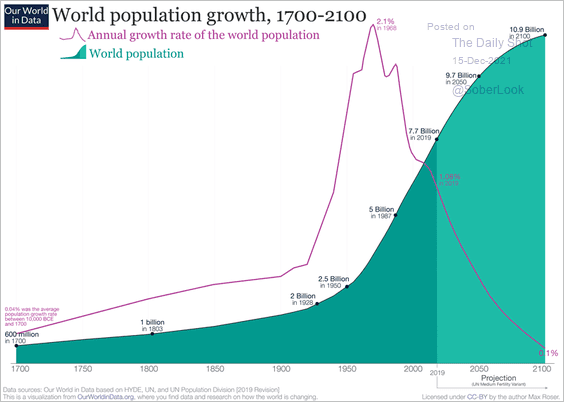 Source: Our World in Data Read full article
5. BBBA breakdown of spending measures:
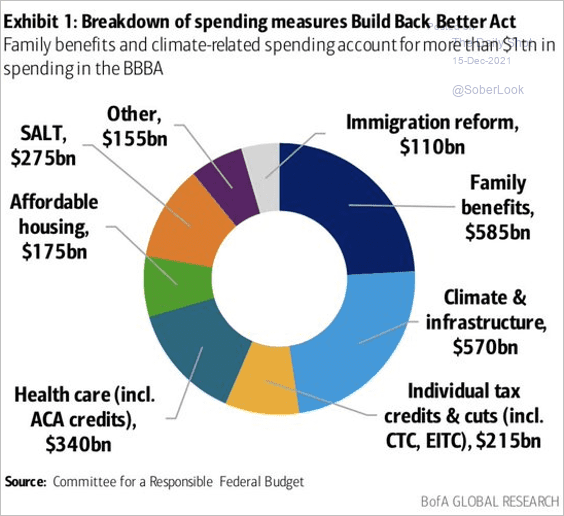 Source: BofA Global Research; @carlquintanilla
6. Indigenous populations’ life expectancy:
 Source: Statista
7. Chasing the 70-year dream of nuclear fusion energy:
![]() Source: @financialtimes Read full article
Source: @financialtimes Read full article
——————–
Back to Index