The Daily Shot: 24-Dec-21
• Administrative Update
• The United States
• Canada
• The United Kingdom
• The Eurozone
• Europe
• Asia – Pacific
• China
• Emerging Markets
• Cryptocurrency
• Energy
• Equities
• Global Developments
• Food for Thought
Administrative Update
The next Daily Shot will be out on Monday, January 3rd.
Back to Index
The United States
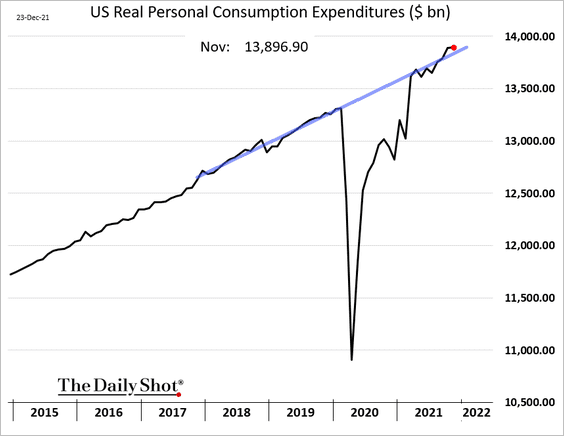
1. US nominal consumer spending climbed further in November, …
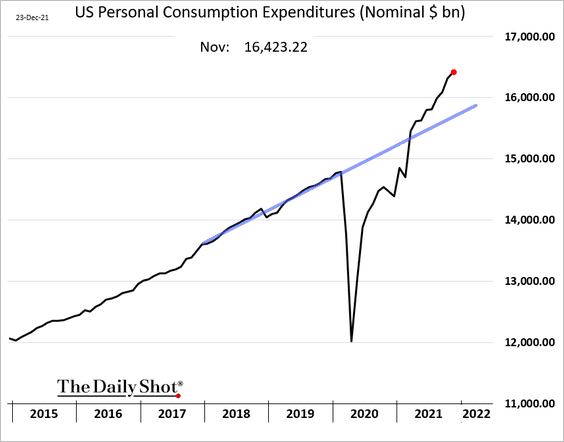
… but was flat when adjusted for inflation (and near the pre-COVID trend).
Here are the changes in real spending in November.
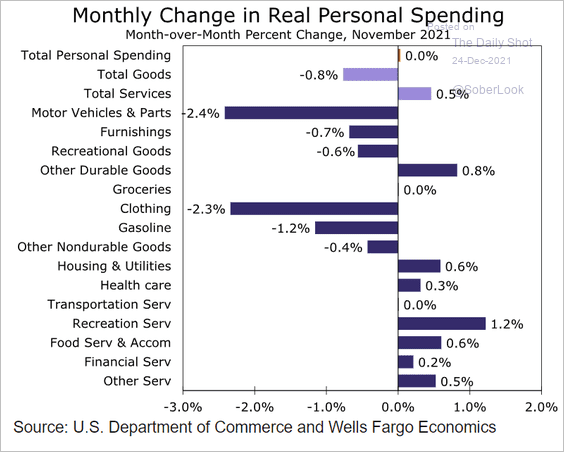 Source: Wells Fargo Securities
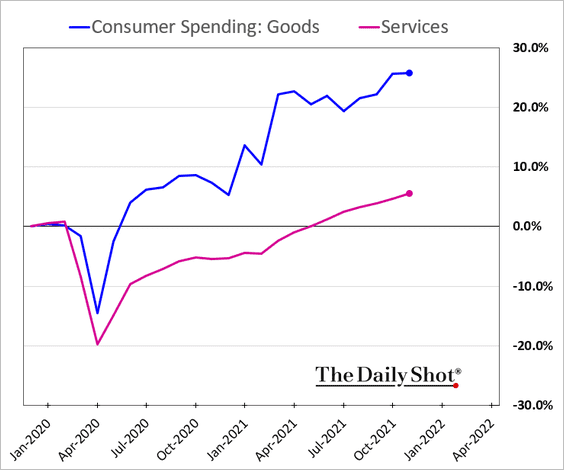
Let’s take a look at a few pandemic-era spending trends (nominal measures).
• Services continue to lag goods.
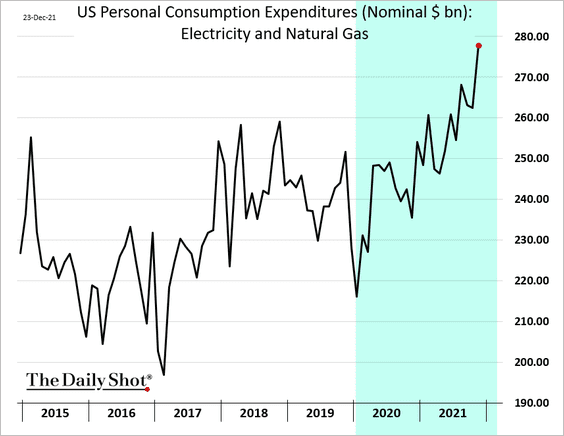
• Utility bill payments have been surging.
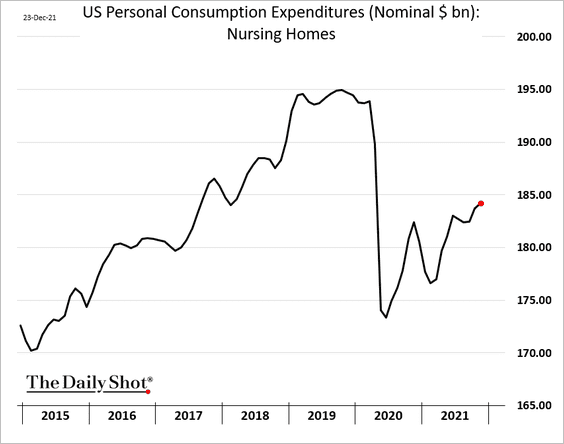
• Nursing home expenditures tumbled at the start of the pandemic as occupancy rates dropped sharply.
 Further reading
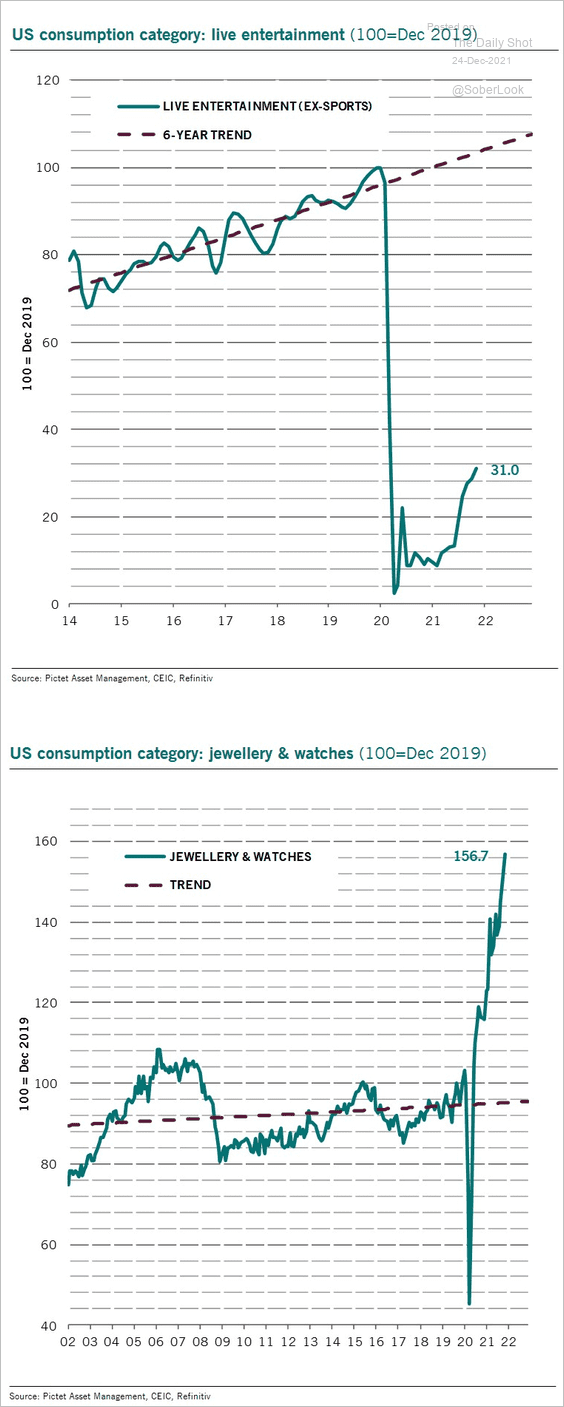
• Spending shifted from live entertainment to luxury items.
 Source: Patrick Zweifel, Pictet Wealth Management
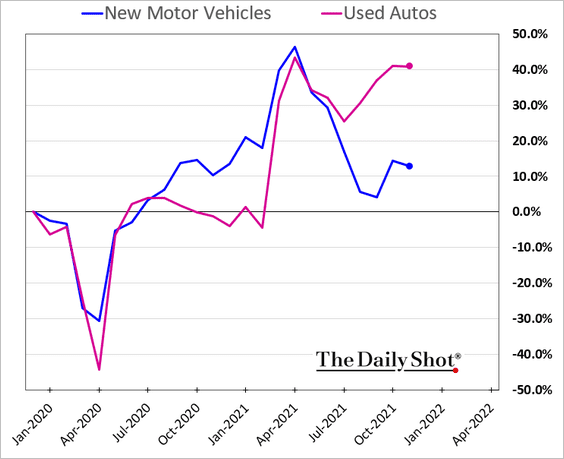
• Spending on new automobiles lags used vehicles due to inventory and price constraints.
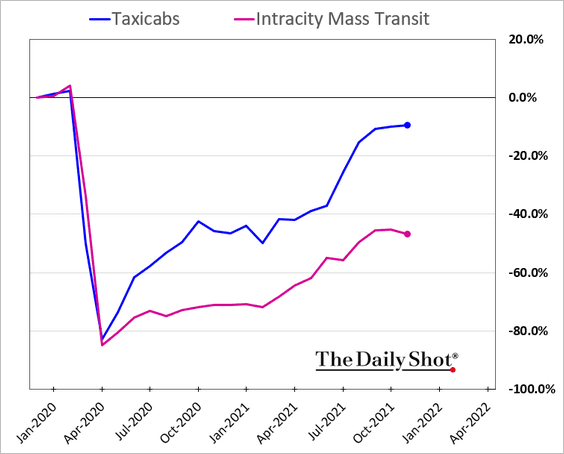
• Mass transit spending lags taxicabs.
——————–
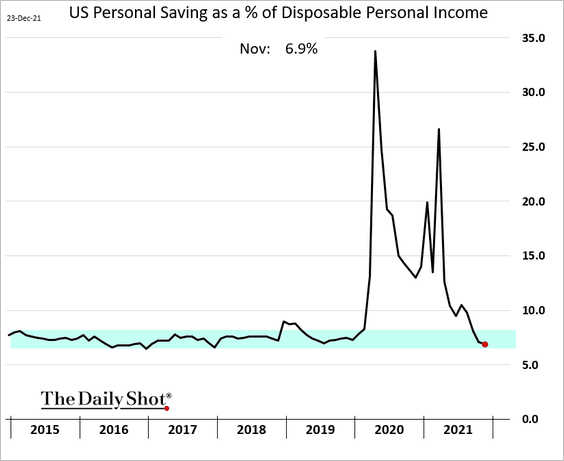
2. Savings as a share of disposable income are now at the low end of the pre-COVID range.
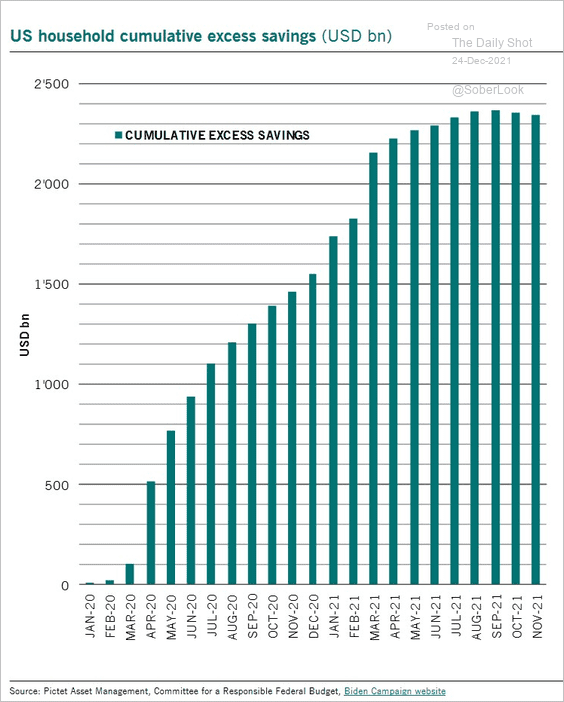
But cumulative excess savings remain massive.
 Source: Patrick Zweifel, Pictet Wealth Management
——————–
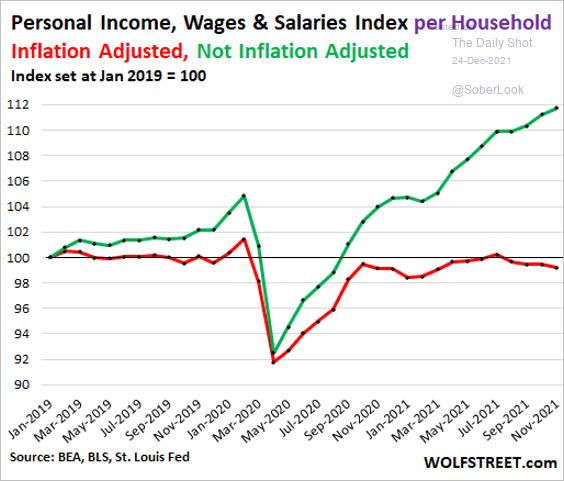
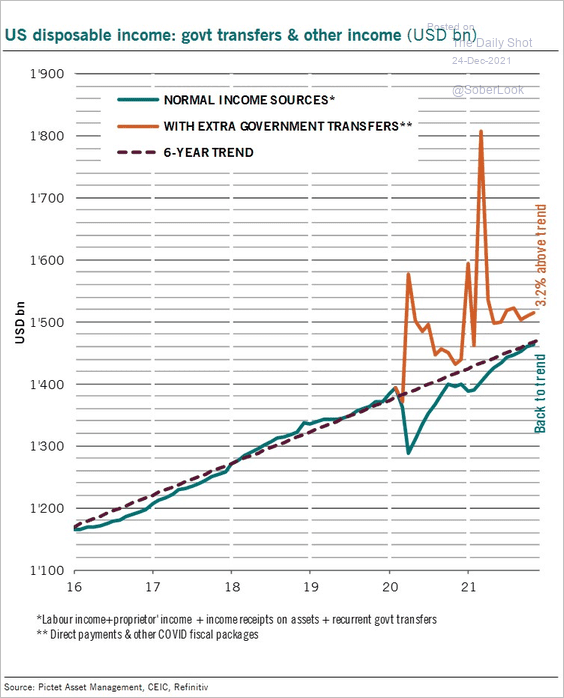
3. Personal income per household is now well above pre-COVID levels. But the situation is quite different when adjusted for inflation.
 Source: @wolfofwolfst Read full article
This chart shows the government transfers’ impact on disposable income.
 Source: Patrick Zweifel, Pictet Wealth Management
——————–
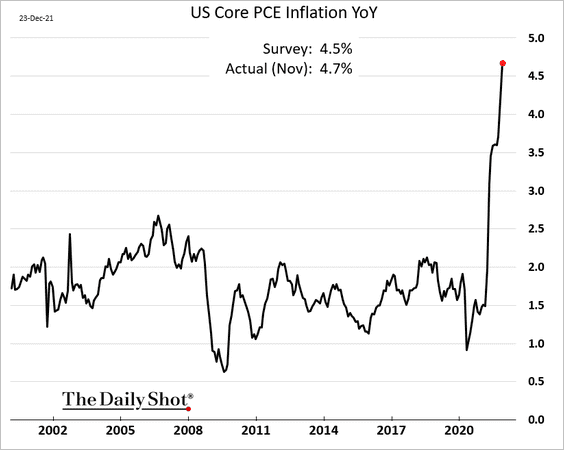
4. The November core PCE inflation (the Fed’s preferred measure) surprised to the upside, hitting a multi-decade high on a year-over-year basis.
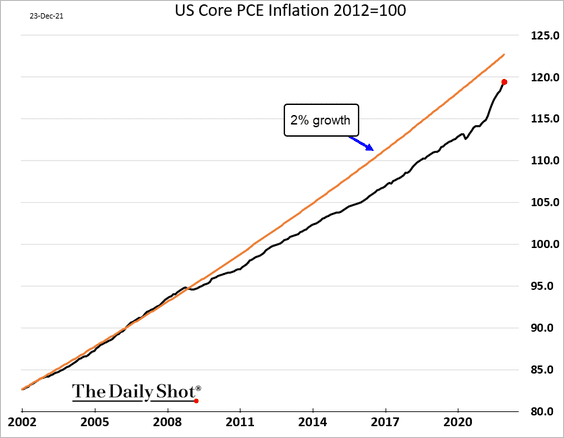
• Here is the core PCE price index relative to the Fed’s 2% target with a starting point twenty years ago.
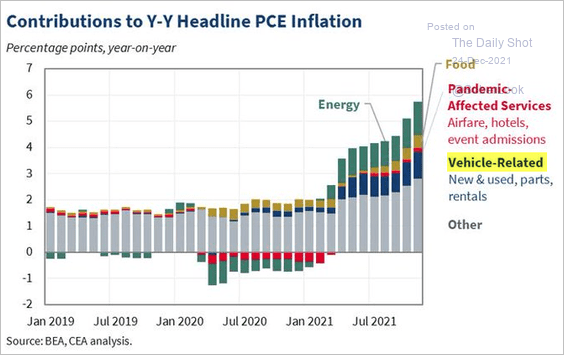
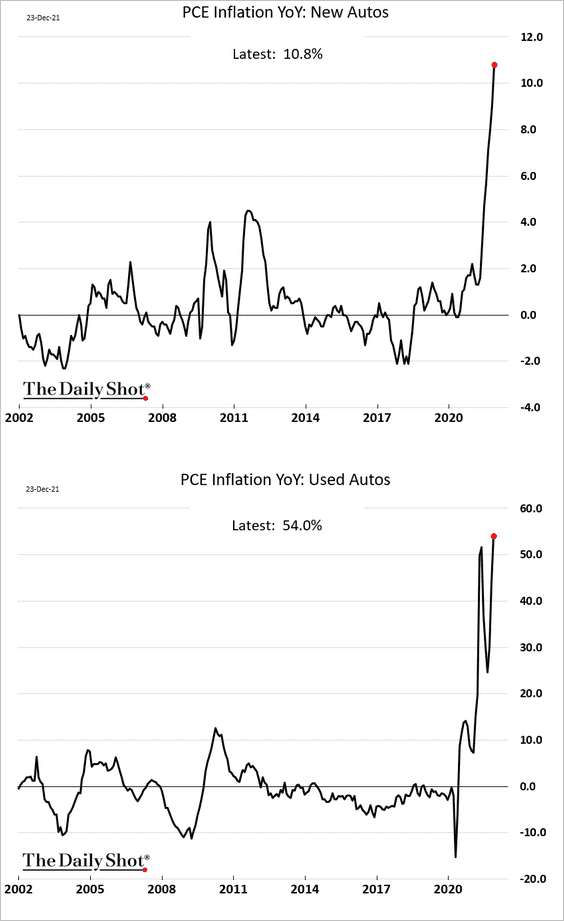
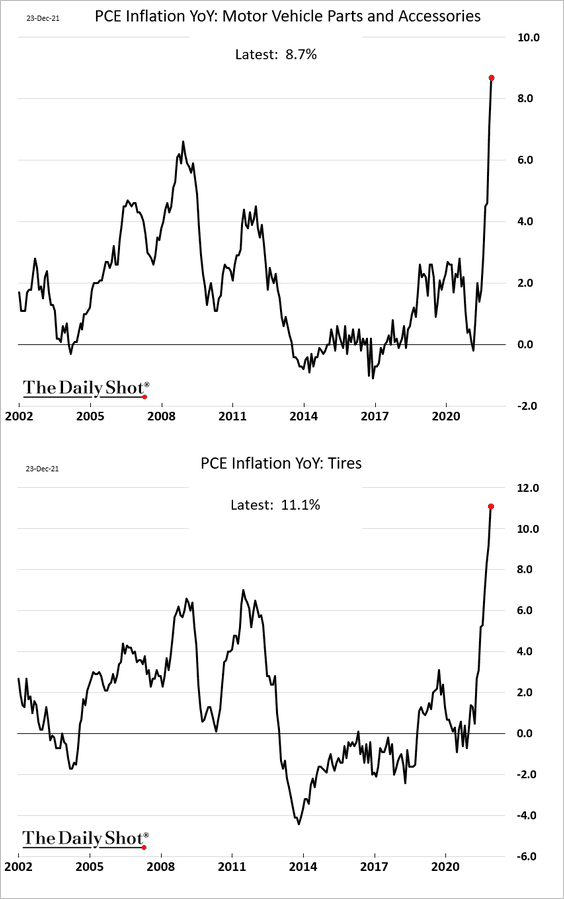
• Vehicle-related price gains remain a substantial contributor to the core PCE.
 Source: Council of Economic Advisers
– New and used vehicles:
– Parts and accessories:
——————–
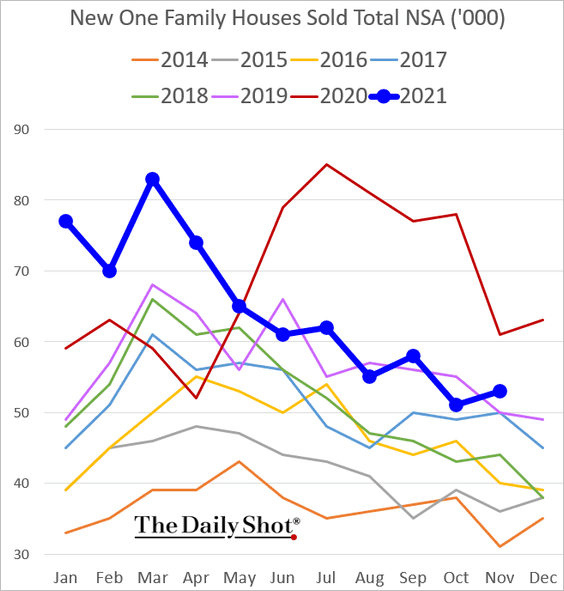
5. New home sales continue to follow the 2019 trend.
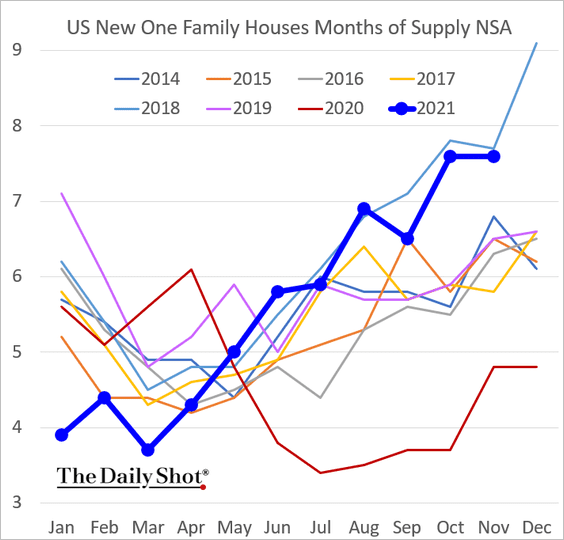
Inventories are elevated when measured as months of supply.
——————–
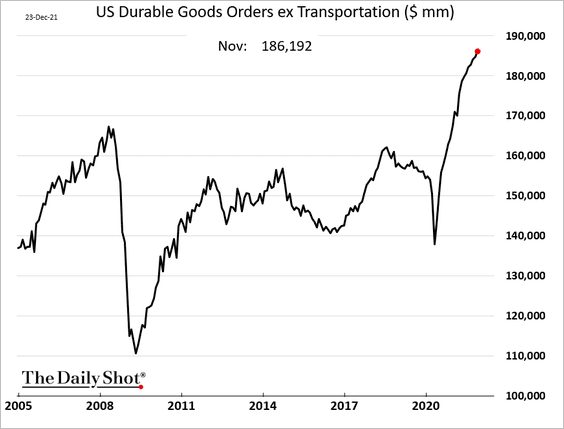
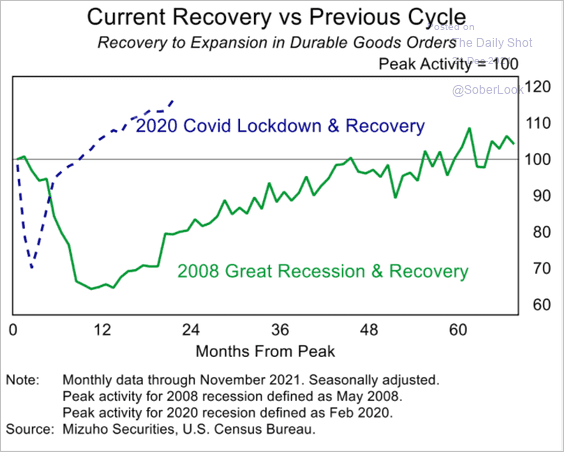
6. US durable goods orders keep climbing.
Here is a comparison with the post-2008 recovery.
 Source: Mizuho Securities USA
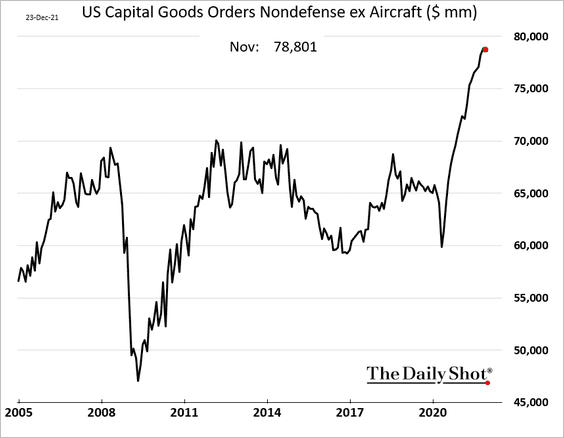
Capital goods orders came off the highs but remain near record levels.
——————–
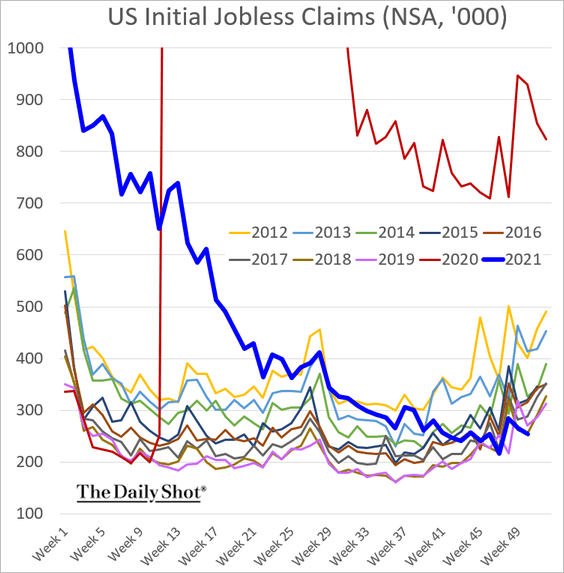
7. Initial jobless claims are near multi-decade lows for this time of the year. The recovery has been remarkable.
8. The consumer confidence gap in the chart below reflects the Conference Board’s emphasis on employment vs. the U. Michigan’s focus on inflation concerns. Both measures showed improvement in December.
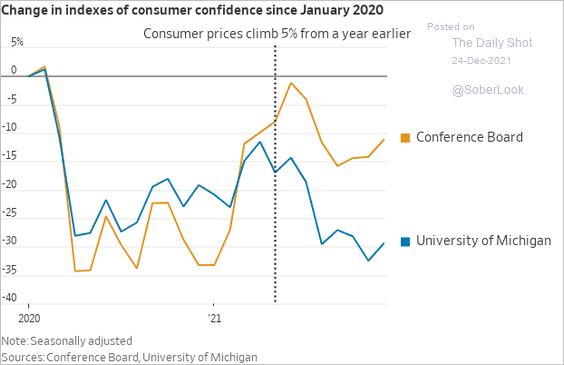 Source: @WSJ Read full article
9. Consumers are brushing off omicron. Visits to retail locations ticked up even as the number of COVID cases climbed.
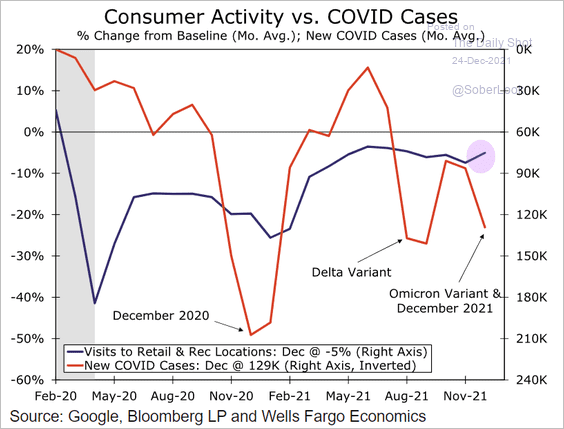 Source: Wells Fargo Securities
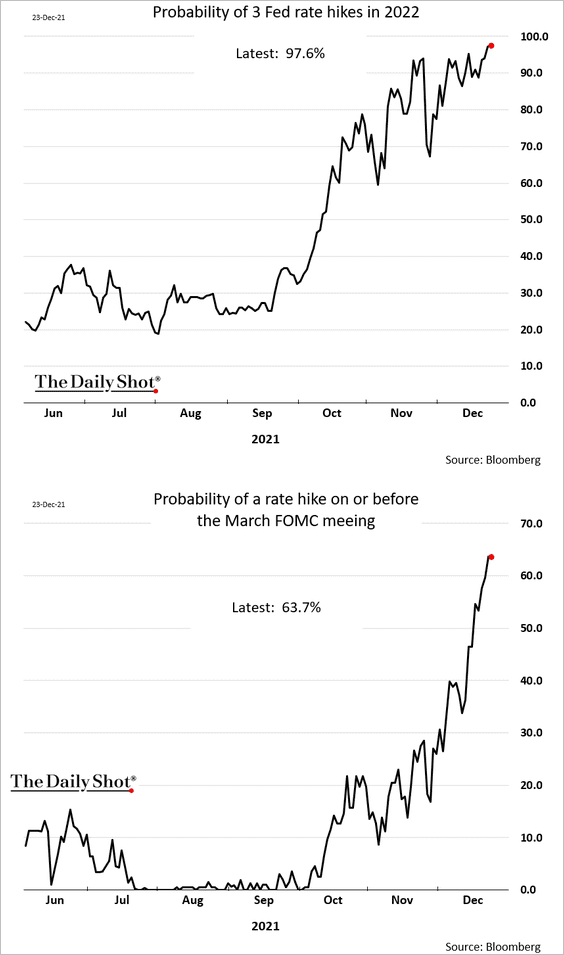
10. The omicron concerns are subsiding in the market, with rate futures now pricing in a near certainty of three Fed rate hikes in 2022. The probability of the first hike coming in March is now above 60%.
Despite the accelerated taper (removal of QE) and expectations of rapid rate hikes, US financial conditions remain extraordinarily accommodative.
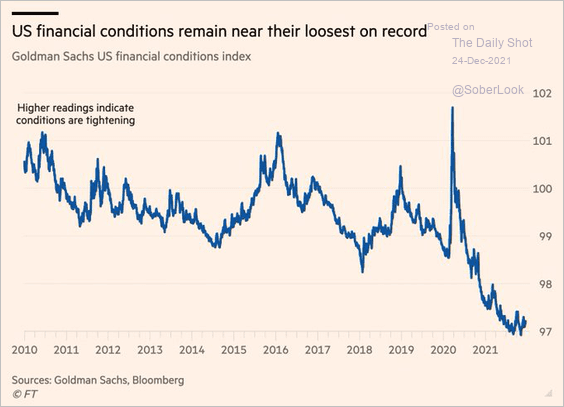 Source: @jessefelder Read full article
Back to Index
Canada
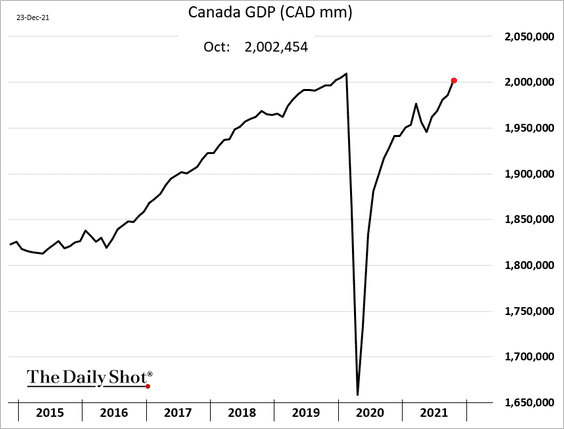
1. Canada’s GDP grew 0.8% in October – the fastest pace in seven months – and is nearing pre-COVID levels.
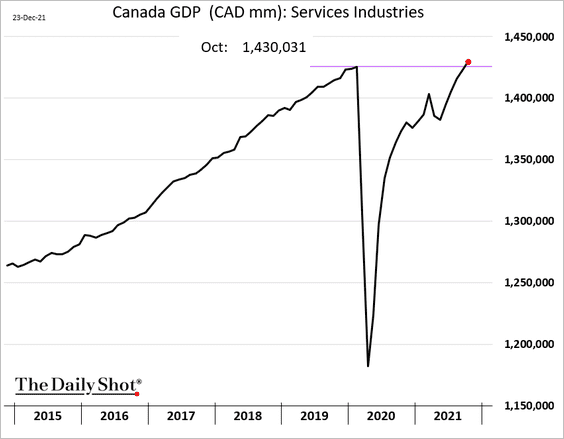
Service industries’ output has fully recovered.
——————–
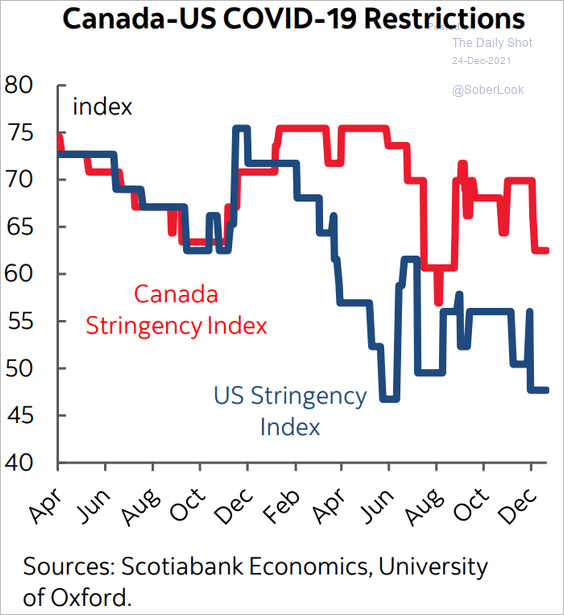
2. COVID restrictions remain more stringent than in the US.
 Source: Scotiabank Economics
Back to Index
The United Kingdom
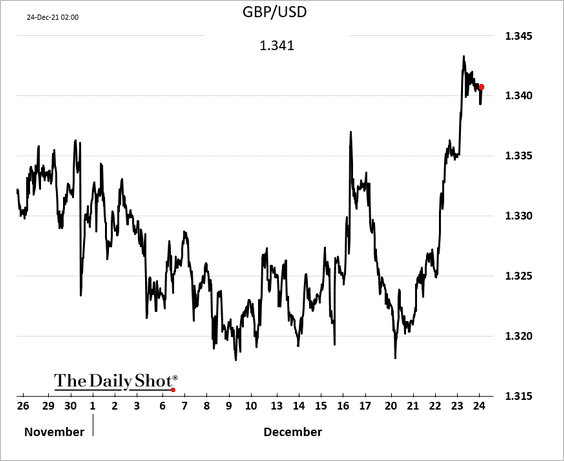
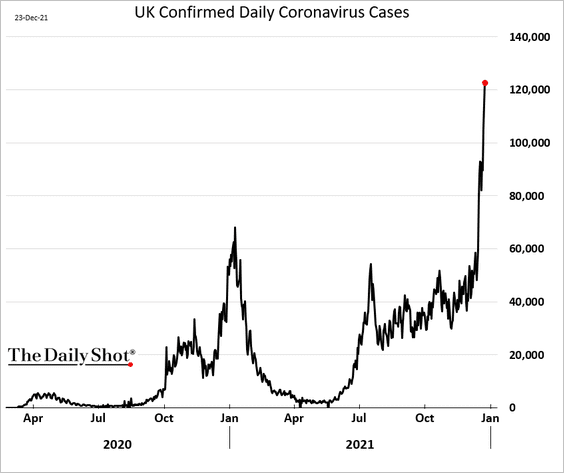
1. The pound rebounded this week as omicron fears ebb and global risk appetite returns.
UK COVID cases hit a record high, …
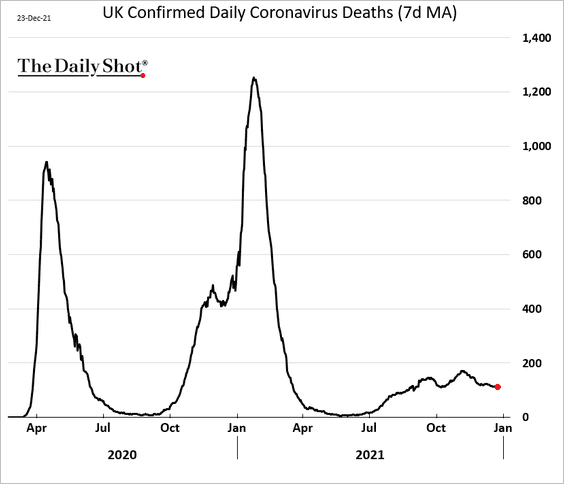
… but, at least for now, fatalities remain relatively low.
——————–
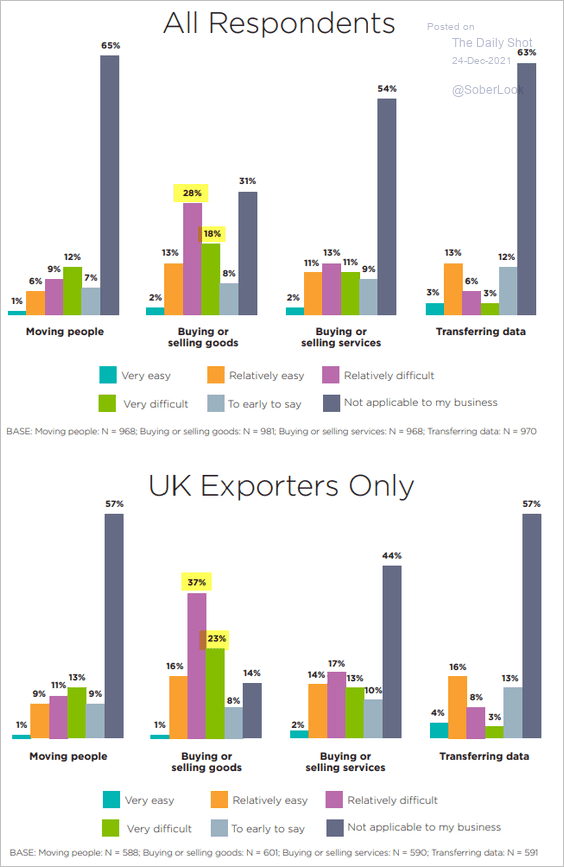
2. Some 45% of companies surveyed by BCC are finding it “very” or “relatively” difficult to trade with the EU (that number was 30% in January). The figure is 60% for the nation’s exporters.
 Source: The British Chambers of Commerce Read full article
 Source: Reuters Read full article
Back to Index
The Eurozone
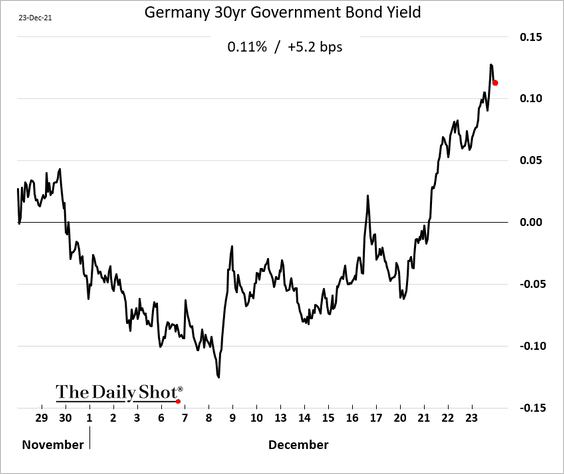
1. Bund yields are climbing, with the 30yr rate now firmly in positive territory.
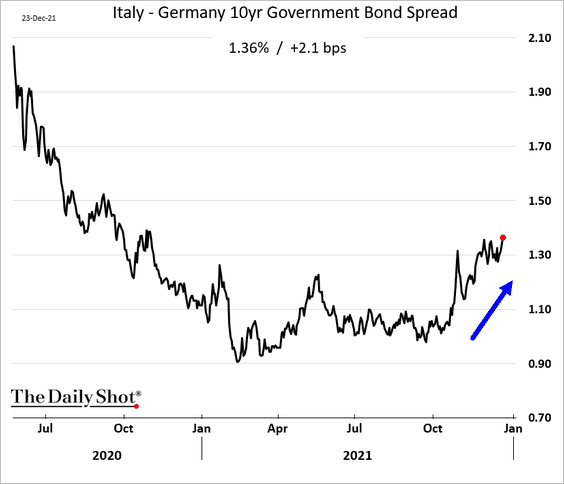
2. Italian bond spreads to Germany are widening as the ECB prepares to cut back its securities purchases.
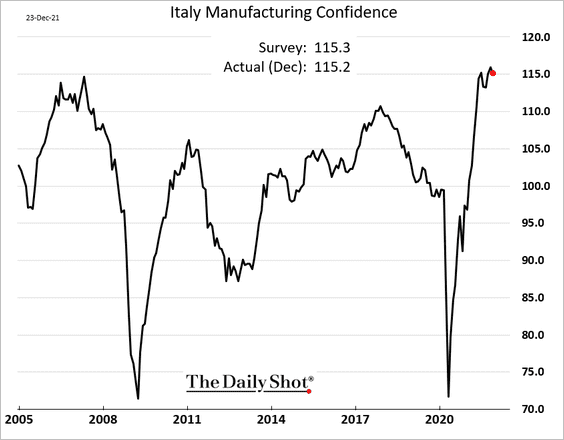
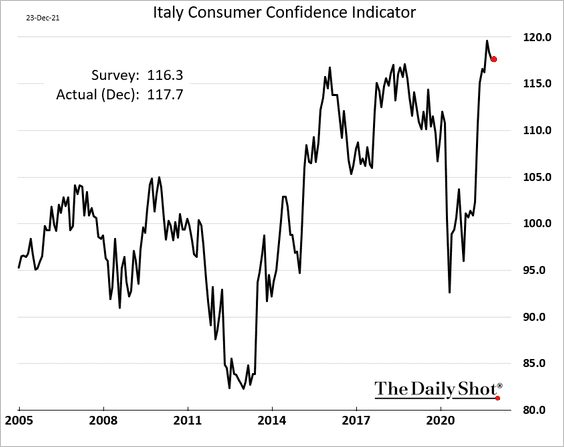
Sentiment indicators in Italy remain strong.
• Manufacturing:
• Consumer:
——————–
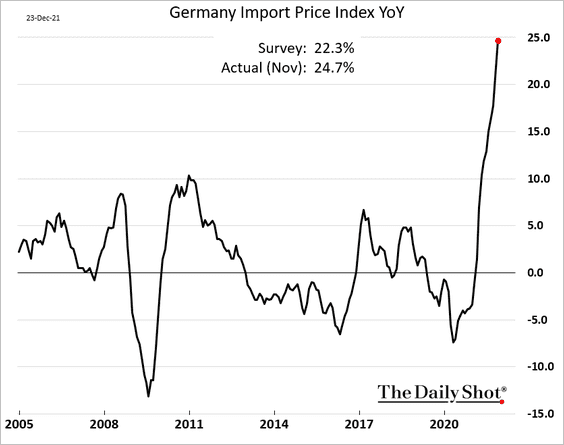
3. German import prices are up nearly 25% from a year ago.
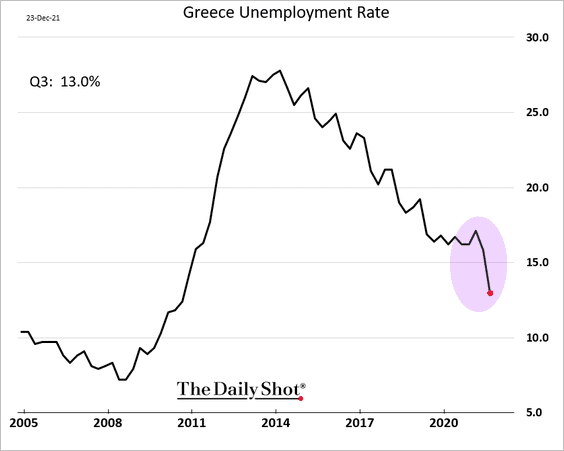
4. Greek unemployment rate hit the lowest level since 2010.
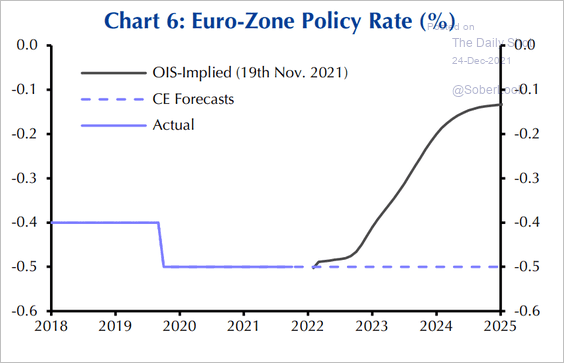
5. Unlike the market, Capital Economics does not expect an ECB rate hike for years to come.
 Source: Capital Economics
Back to Index
Europe
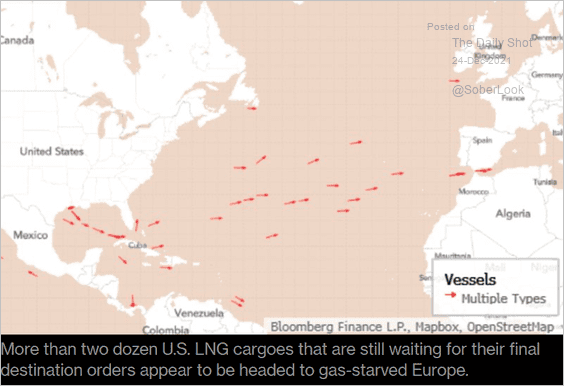
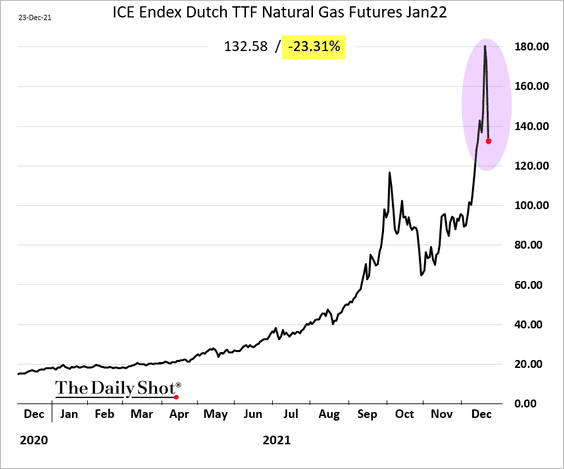
1. Natural gas prices tumbled as US LNG cargoes are redirected from Asia to Europe.
 Source: @markets Read full article
Here are some additional updates on Europe’s energy crisis.
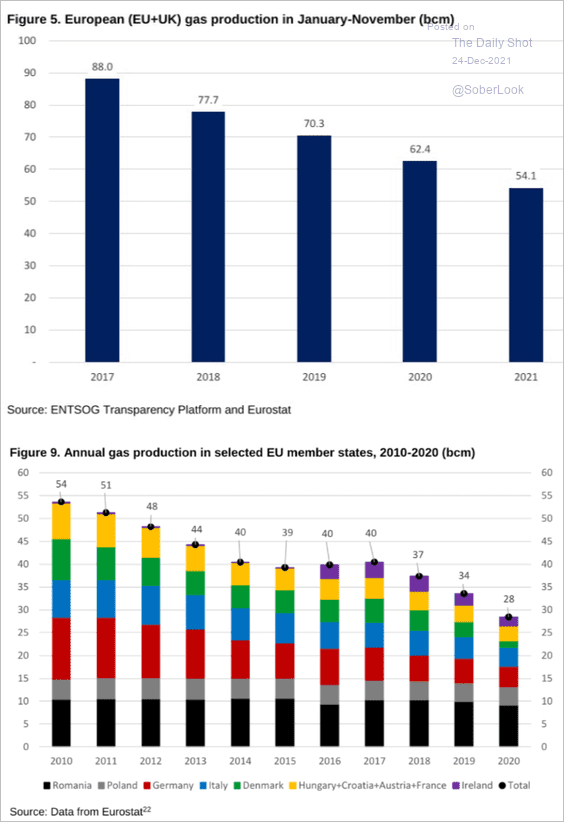
• EU and UK natural gas production:
 Source: Oxford Institute for Energy Studies
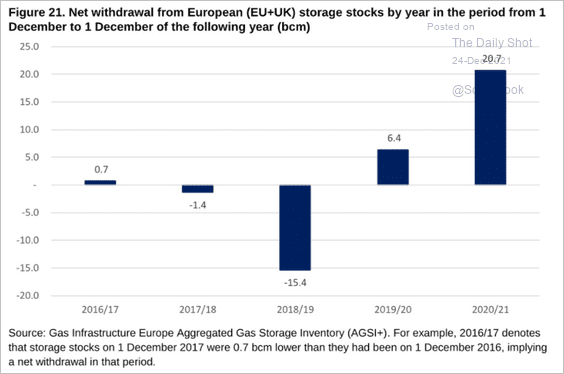
• Natural gas withdrawals:
 Source: Oxford Institute for Energy Studies
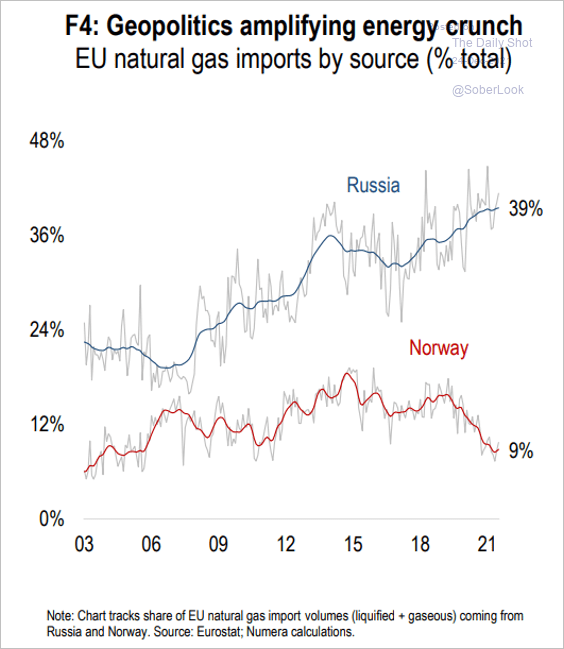
• EU’s natural gas imports from Russia and Norway:
 Source: Numera Analytics
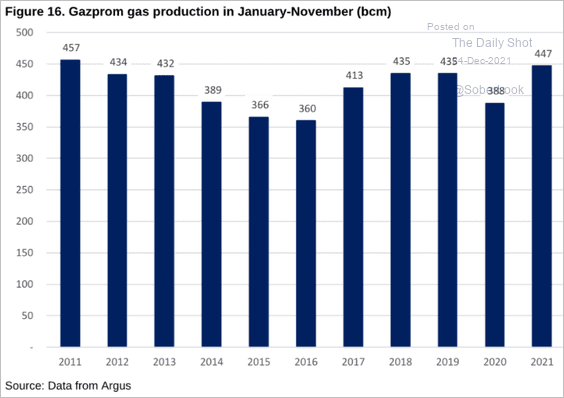
• Gazprom gas production:
 Source: Oxford Institute for Energy Studies
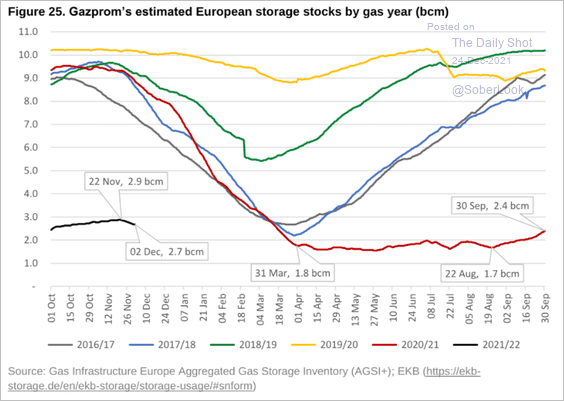
• Gazprom’s natural gas inventories in the EU:
 Source: Oxford Institute for Energy Studies
——————–
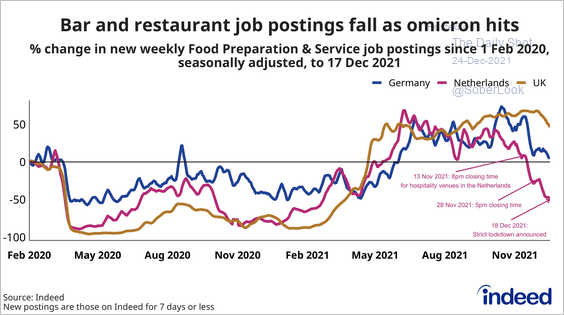
2. Bar and restaurant job postings have been declining.
 Source: @PawelAdrjan
Back to Index
Asia – Pacific
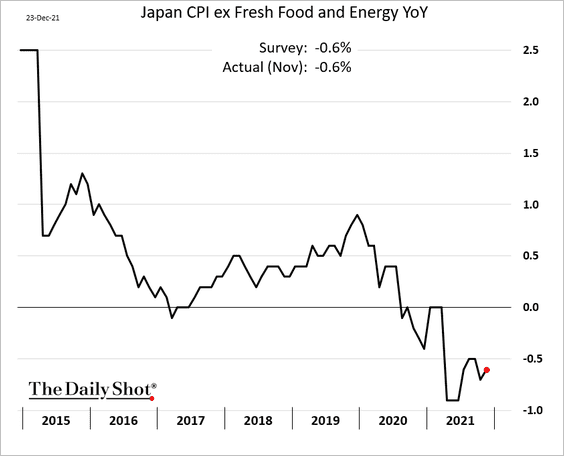
1. Japan’s core CPI remains in deflation territory.
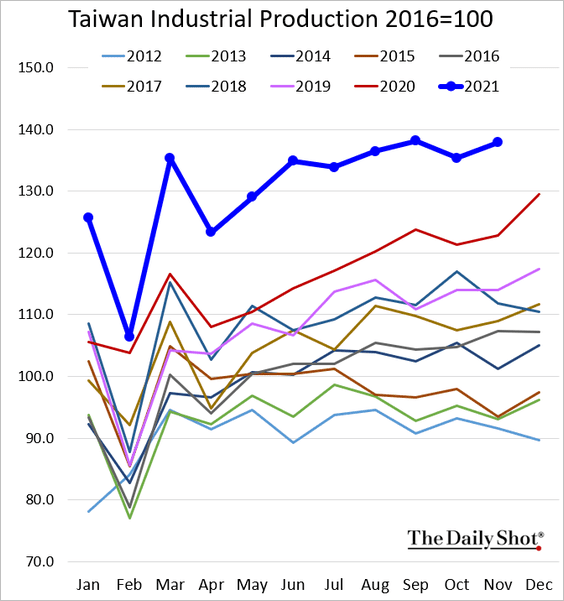
2. Taiwan’s industrial production is holding near record highs.
Back to Index
China
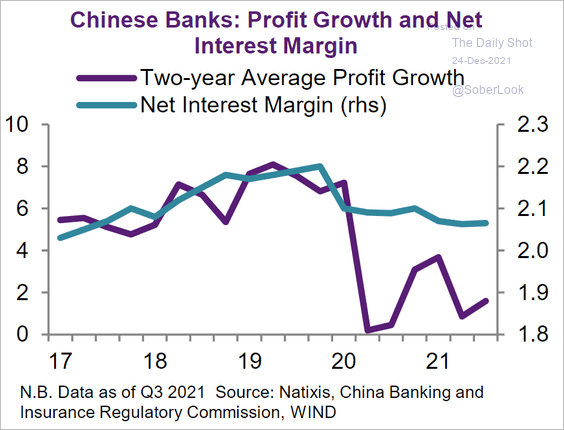
1. Banks’ profit growth has not recovered.
 Source: Natixis
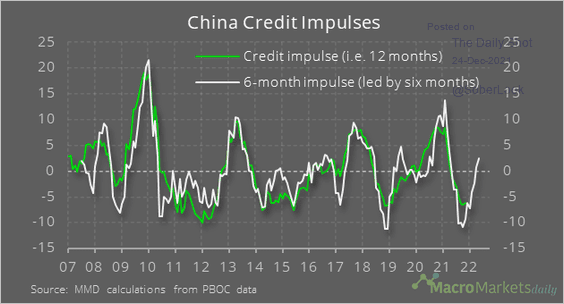
2. China’s credit impulse is expected to rebound in the months ahead as Beijing eases monetary policy.
 Source: @macro_daily
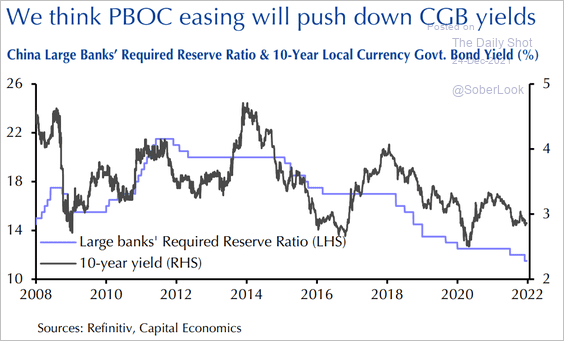
The PBoC’s easing should also lower bond yields.
 Source: Capital Economics
——————–
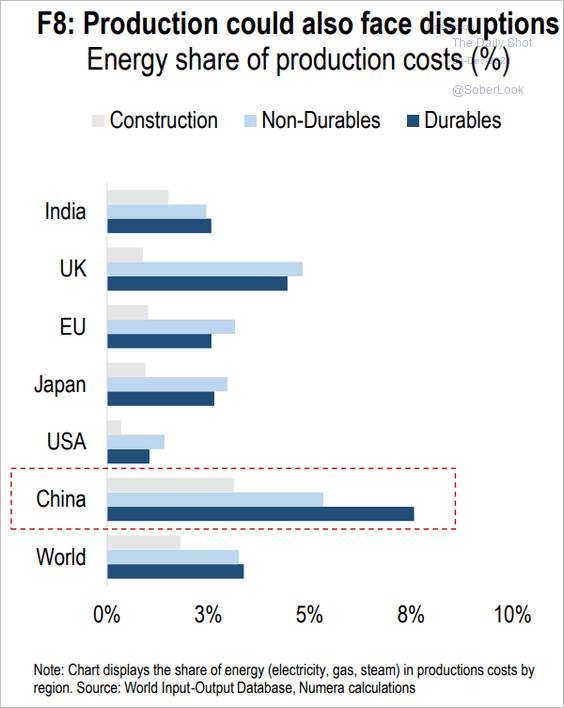
3. China is vulnerable to energy disruptions.
 Source: Numera Analytics
Back to Index
Emerging Markets
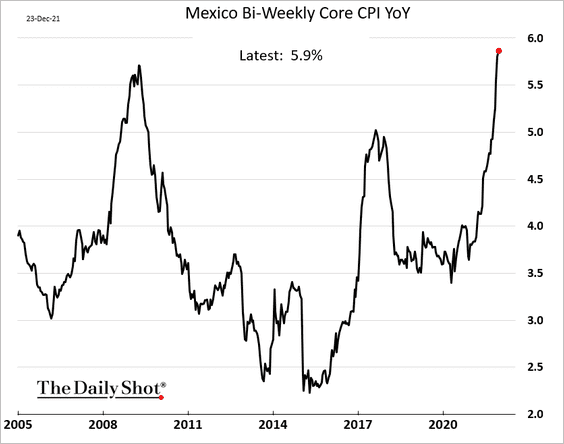
1. Mexico’s core CPI continues to climb.
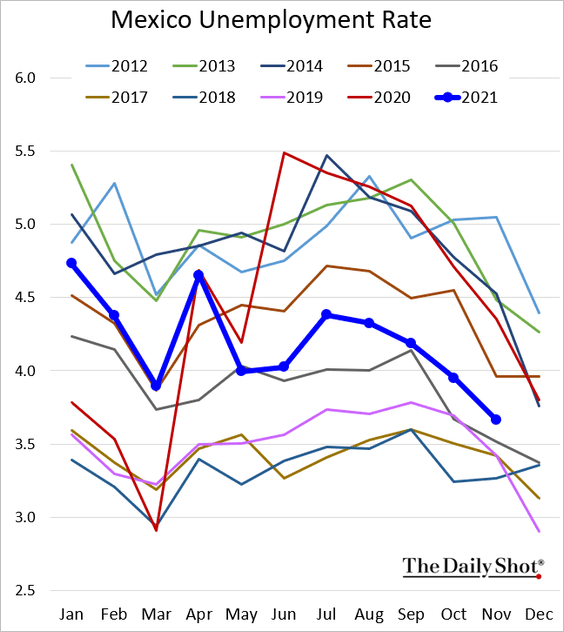
The unemployment rate remains above 2019 levels.
——————–
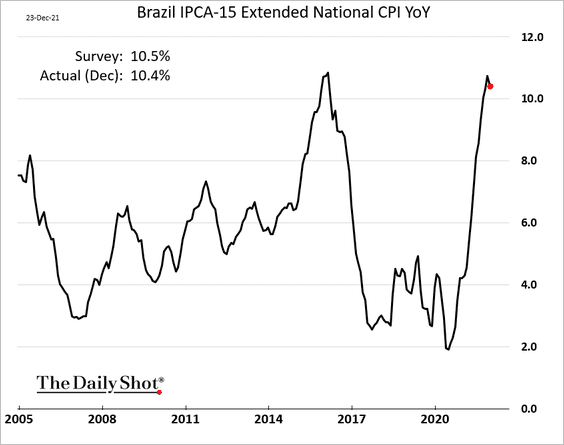
2. Brazil’s inflation seems to be peaking.
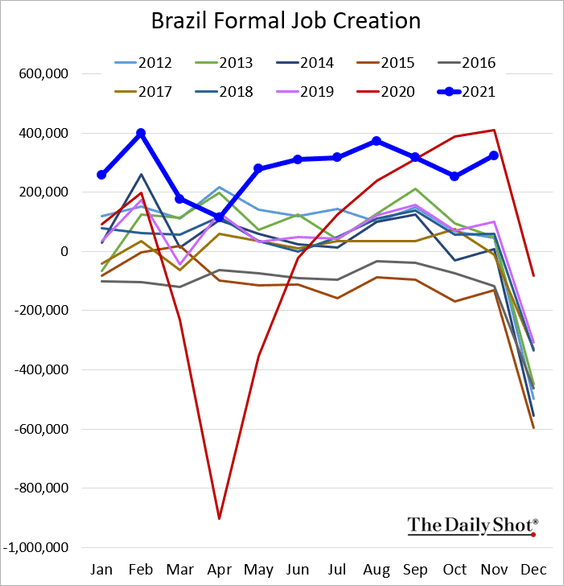
Formal job creation remains very strong.
——————–
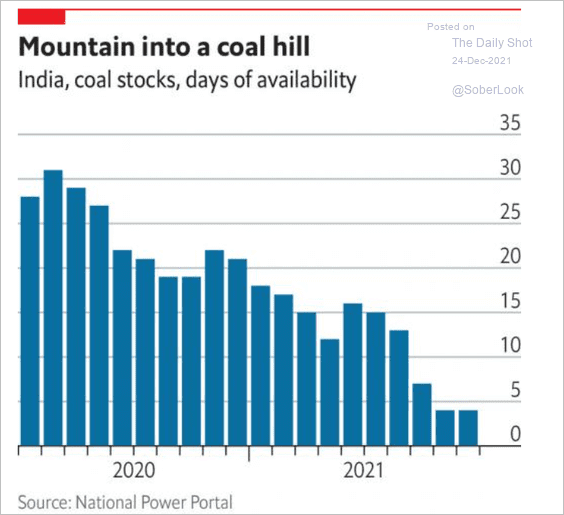
3. India’s coal supplies are tight.
 Source: The Economist Read full article
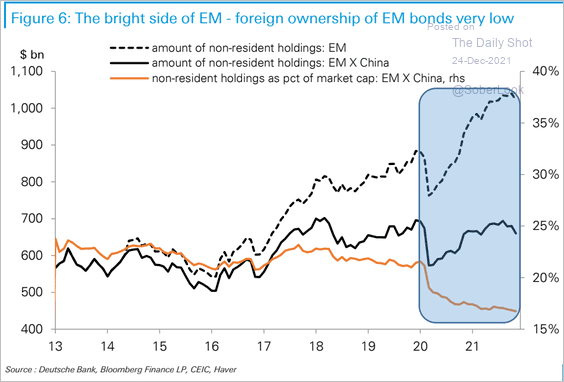
4. Foreign ownership of EM bonds is very low.
 Source: Deutsche Bank Research
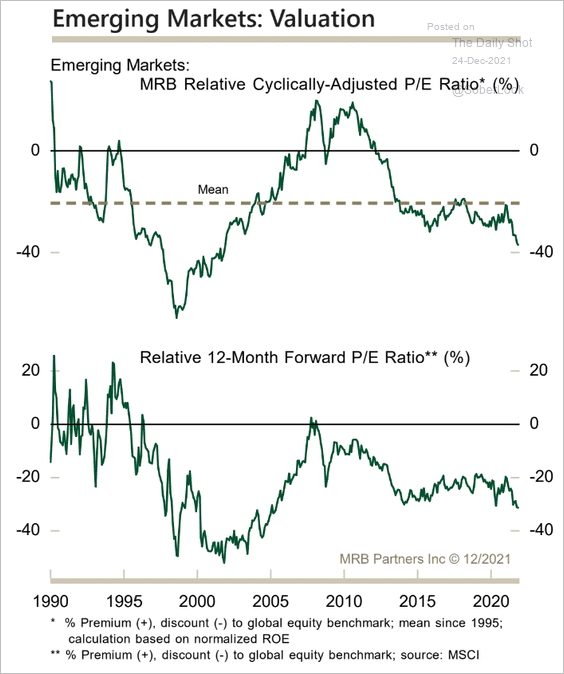
5. Equity valuations remain depressed relative to advanced economies.
 Source: MRB Partners
Back to Index
Cryptocurrency
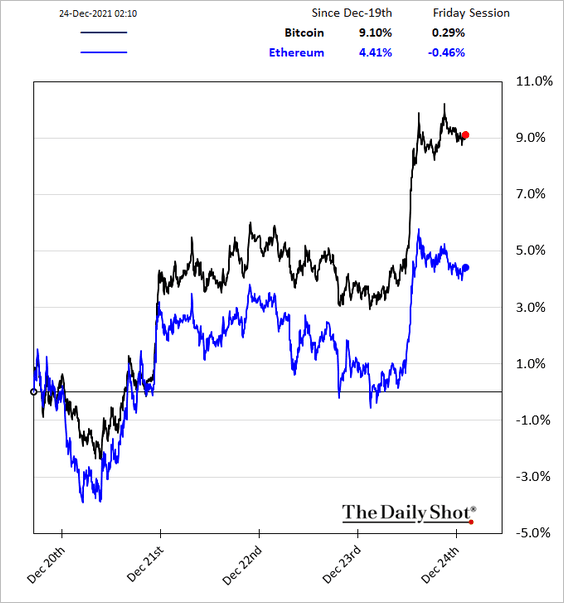
Bitcoin held support at the 200-day moving average, rising above $50k …
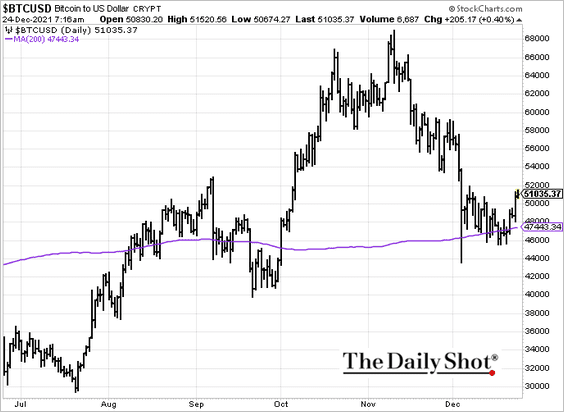
… and outperforming ether.
Back to Index
Energy
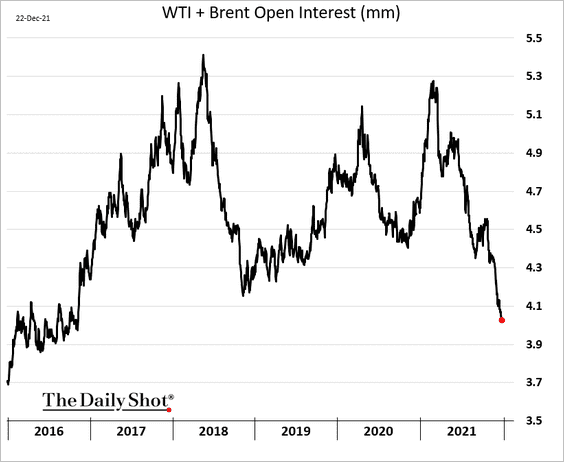
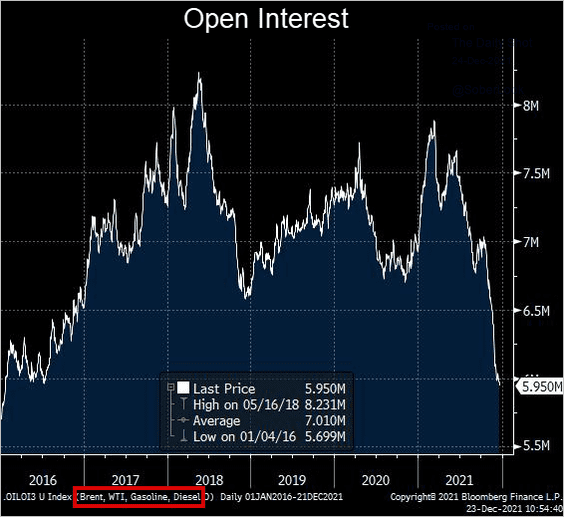
1. Oil futures’ open interest hit the lowest level in five years.
Here is open interest for crude oil and products.
 Source: @alexlongley1
——————–
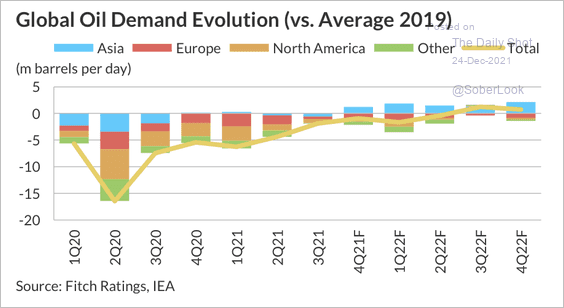
2. Fitch expects global oil demand to move above 2019 levels next year.
 Source: Fitch Ratings
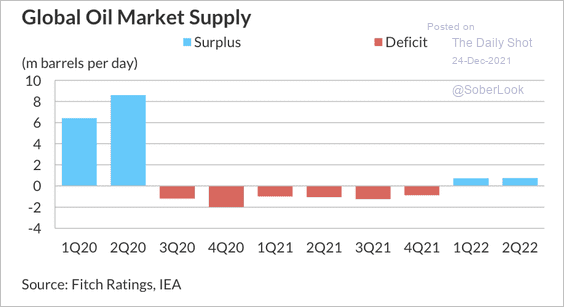
But the global oil market is expected to switch from a deficit to a surplus as OPEC+ nations ramp up production next month.
 Source: Fitch Ratings
——————–
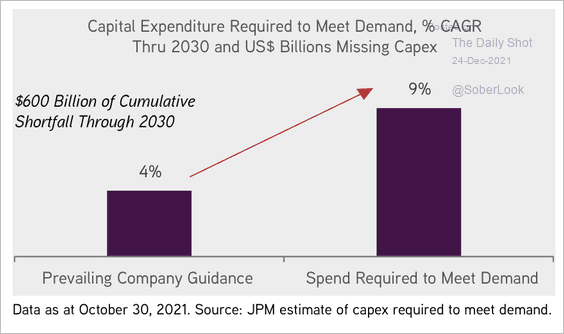
3. Based on current upstream spending plans, there could be an approximate $600 billion spending shortfall by 2030, according to KKR.
 Source: KKR Global Institute
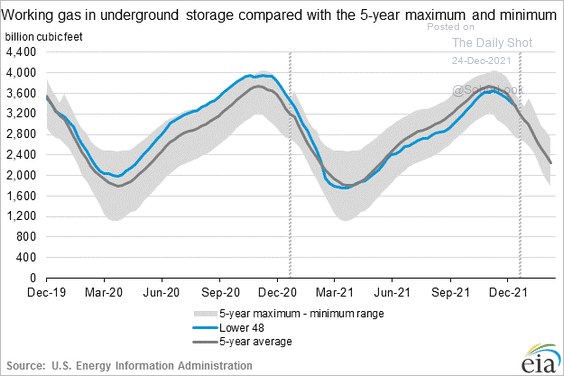
4. There is plenty of natural gas in storage in the US.
Back to Index
Equities
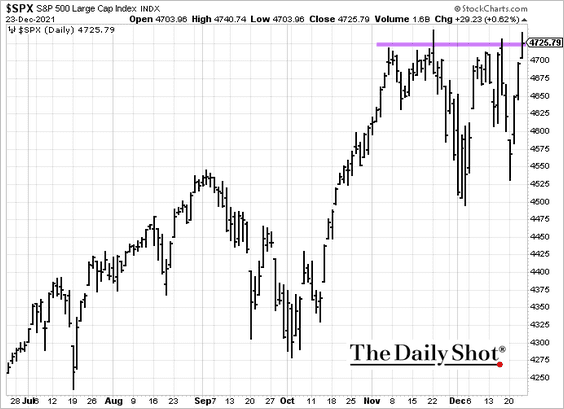
1. The S&P 500 posted a record-high close and is now at resistance.
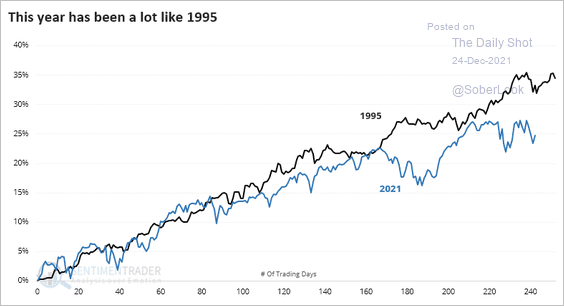
2. This year has been a lot like 1995, aside from the weak September.
 Source: SentimenTrader
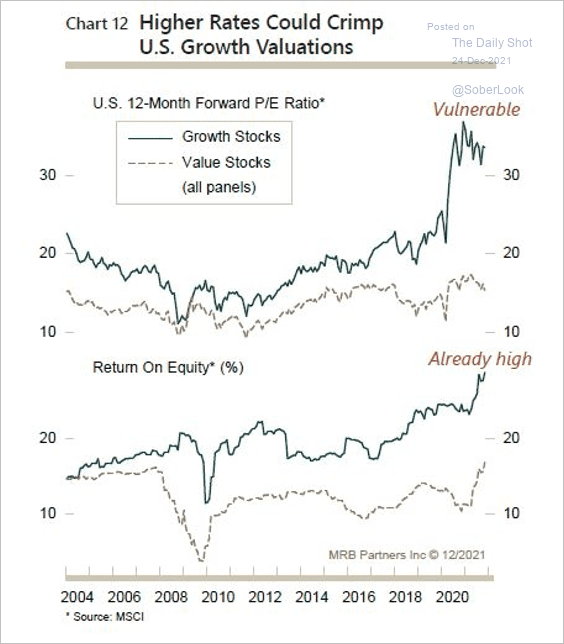
3. Growth stock valuations appear stretched and could be vulnerable to higher interest rates.
 Source: MRB Partners
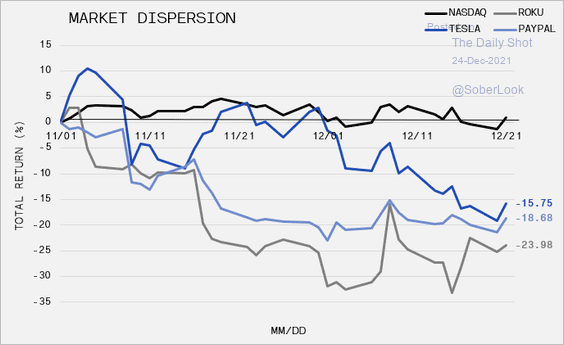
4. The overall Nasdaq Index remained resilient over the past month, while other prominent names have been battered.
 Source: Gavin Hockey Wealth Specialists Read full article
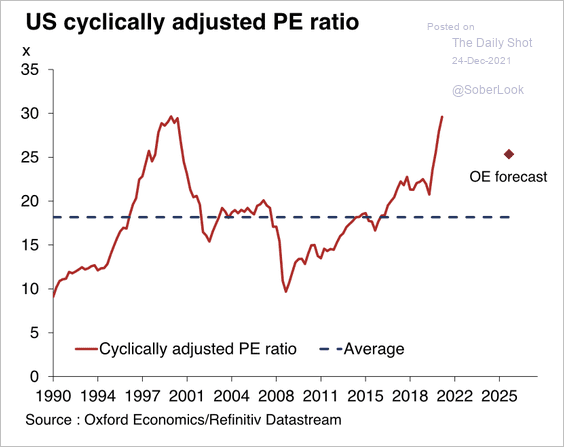
5. Oxford Economics expects US equity valuations to decline going forward.
 Source: Oxford Economics
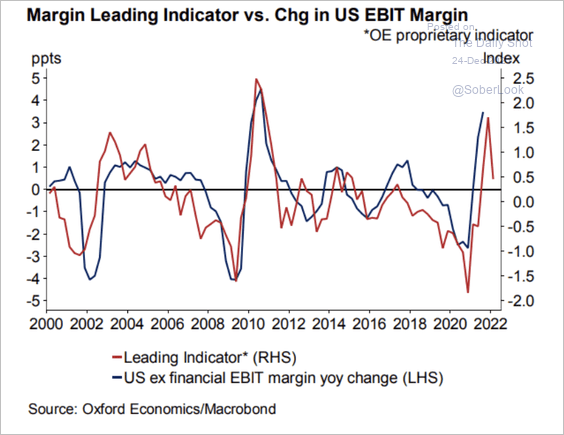
Profit margins will likely provide less support for earnings growth from here.
 Source: Oxford Economics
——————–
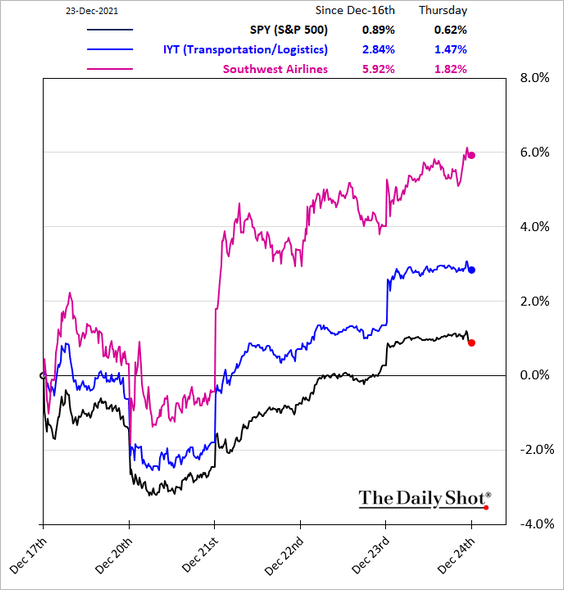
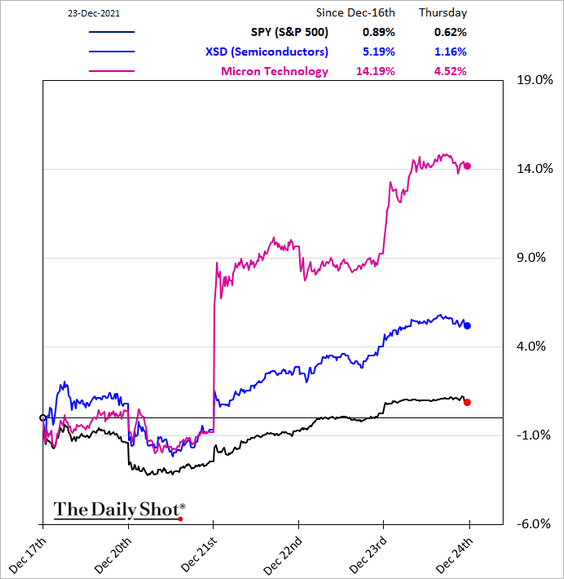
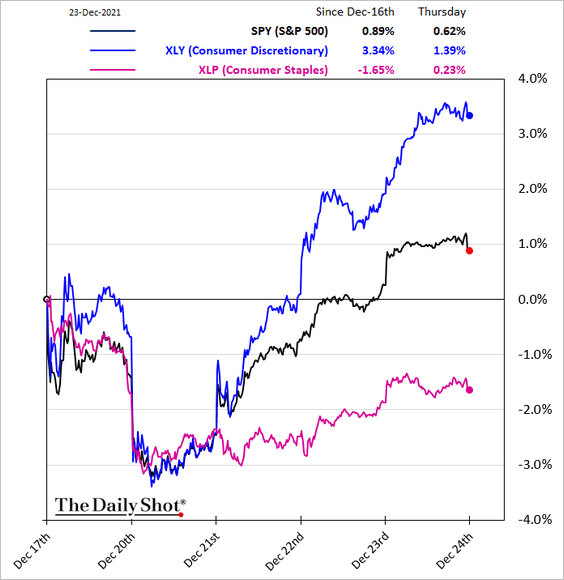
6. Next, we have some sector updates.
• Transportation:
• Semiconductors:
• Consumer discretionary vs. consumer staples:
• Biotech:
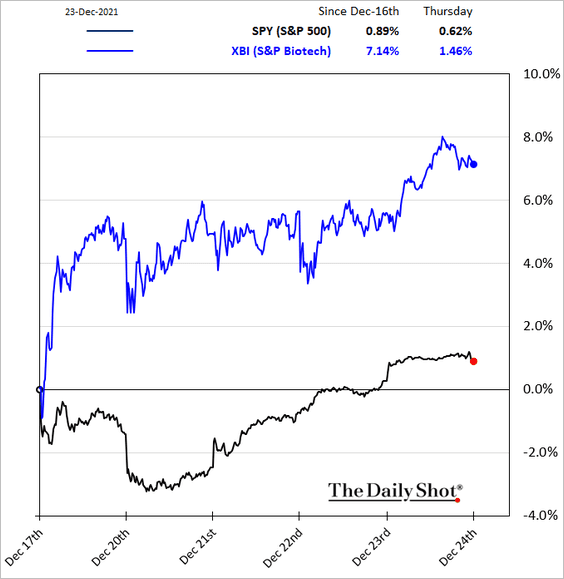
By the way, extreme bearish sentiment in the SPDR S&P Biotech ETF (XBI) is starting to reverse.
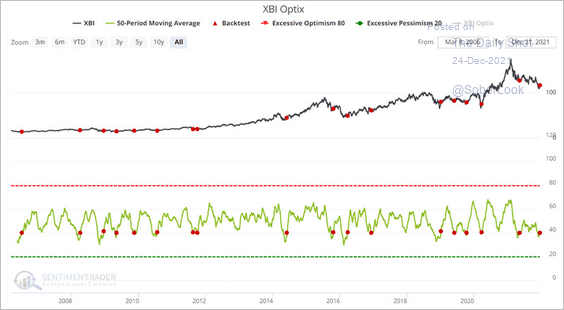 Source: SentimenTrader
7. The MRB Momentum Indicator suggests that US stocks are significantly overbought relative to the rest of the world.
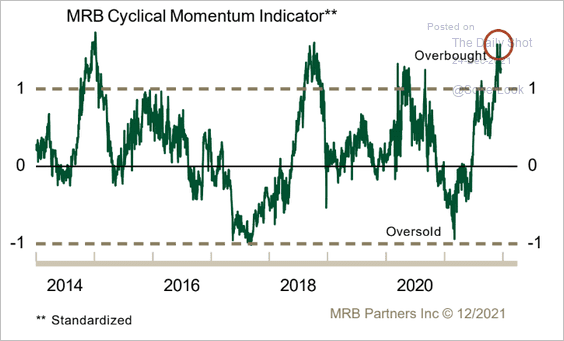 Source: MRB Partners
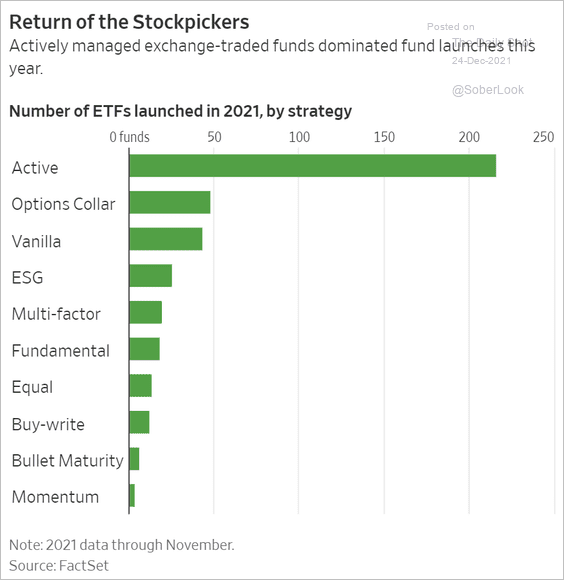
8. ETF launches surged this year, …
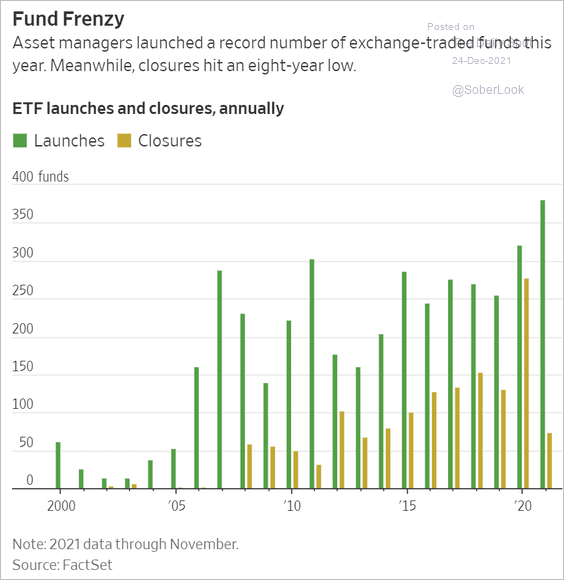 Source: @WSJ Read full article
… boosted by active funds.
 Source: @WSJ Read full article
Back to Index
Global Developments
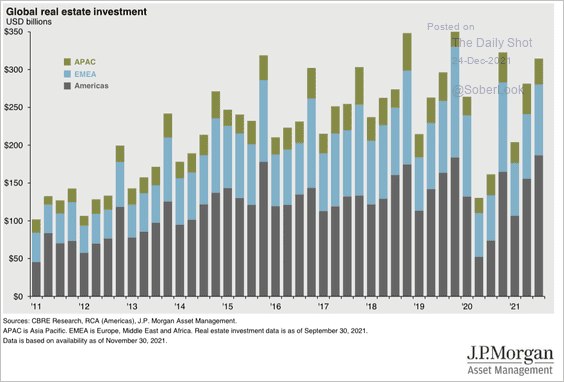
1. Real estate investment is once again heating up after the pandemic slump.
 Source: J.P. Morgan Asset Management
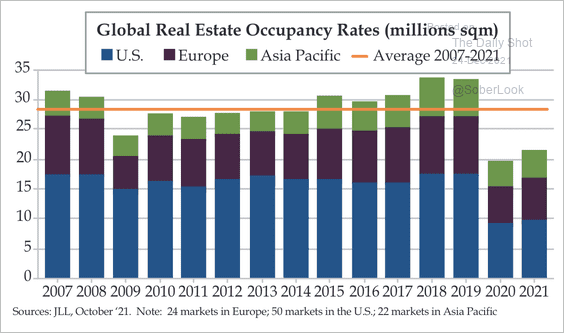
Still, occupancy rates remain below pre-pandemic levels.
 Source: Quill Intelligence
——————–
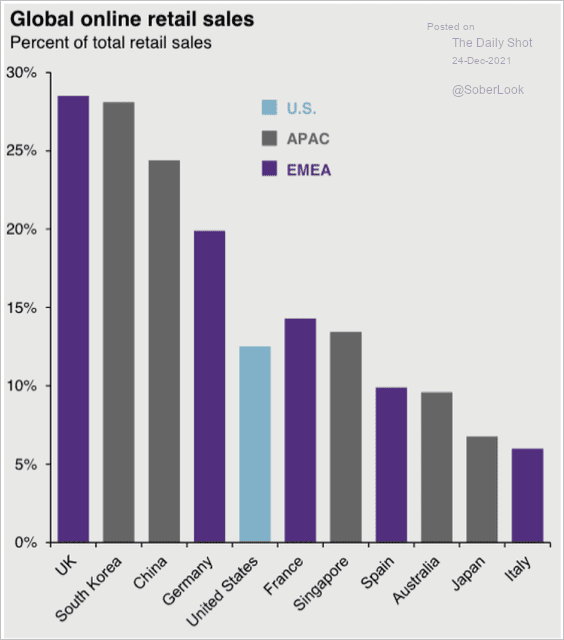
2. This chart shows online retail sales as a percent of total retail sales by nation.
 Source: J.P. Morgan Asset Management
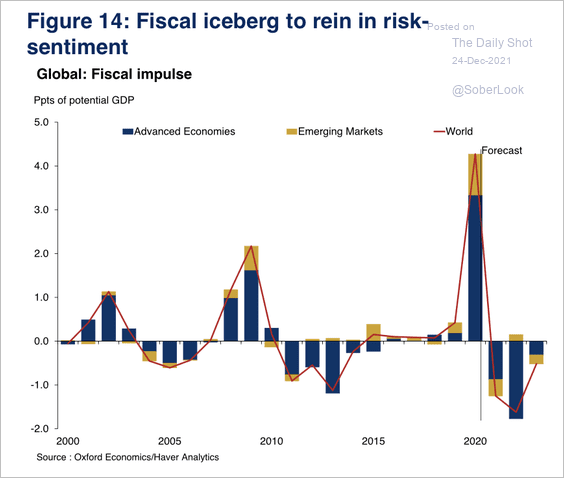
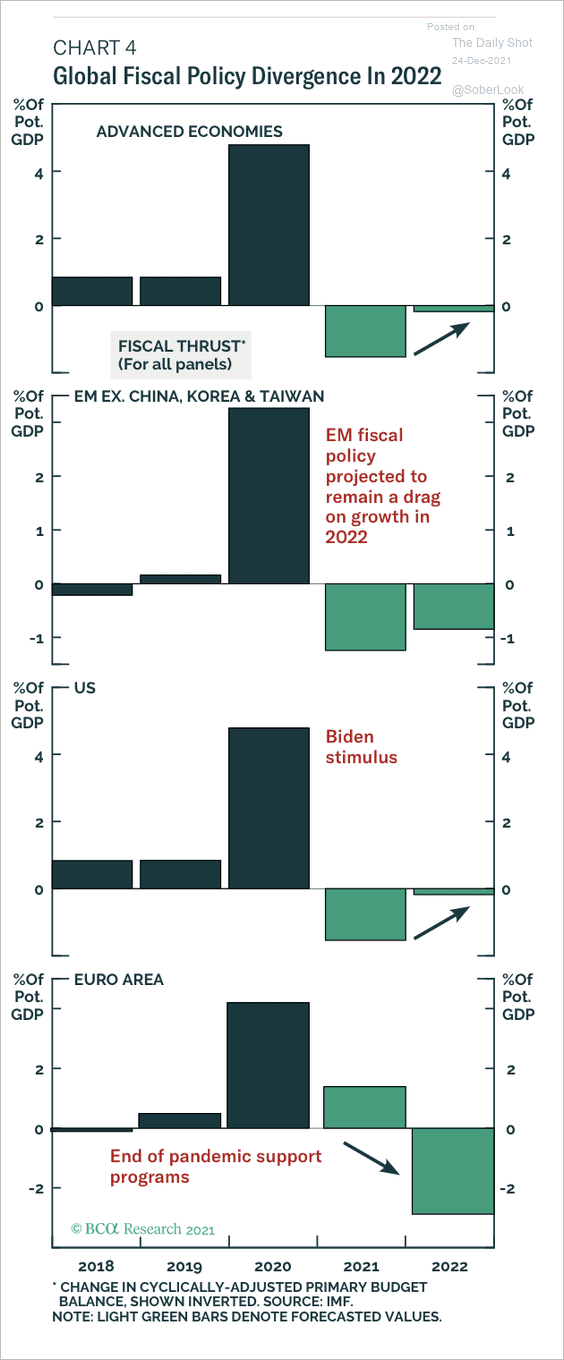
3. A sharp decline in the global fiscal impulse could weigh on risk-assets next year (2 charts):
 Source: Oxford Economics
 Source: BCA Research
——————–
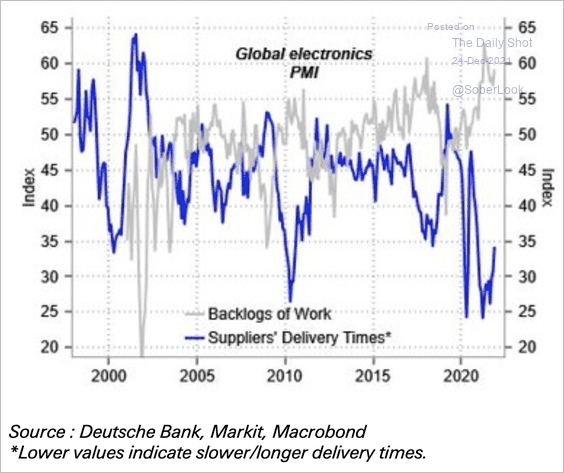
4. Supply disruptions in the electronics sector have started to moderate, but still have a long way to go.
 Source: Deutsche Bank Research
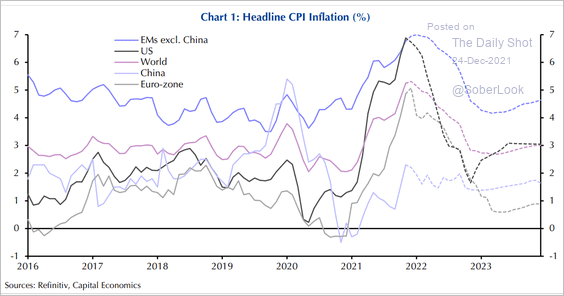
5. Finally, we have inflation projections from Capital Economics.
 Source: Capital Economics
——————–
Food for Thought
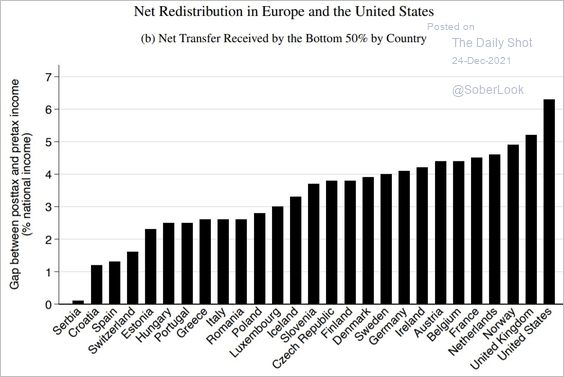
1. US tax-and-transfer is more redistributive than Europe’s system.
 Source: @amorygethin, @thomas_blncht, @lucas_chancel
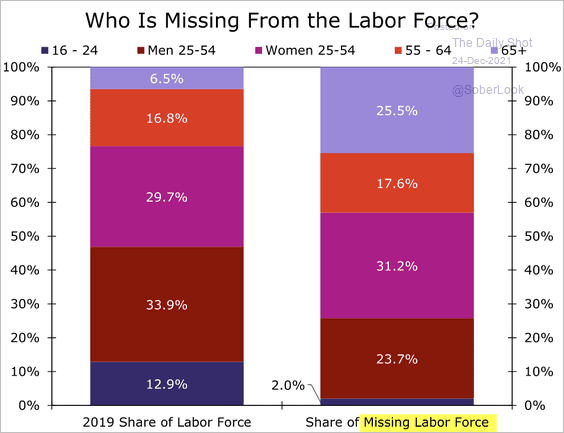
2. Who is missing from the labor force?
 Source: Wells Fargo Securities
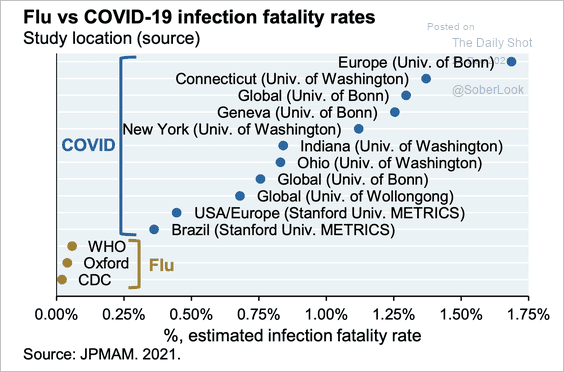
3. Flu vs. COVID fatality rates:
 Source: J.P. Morgan Asset Management
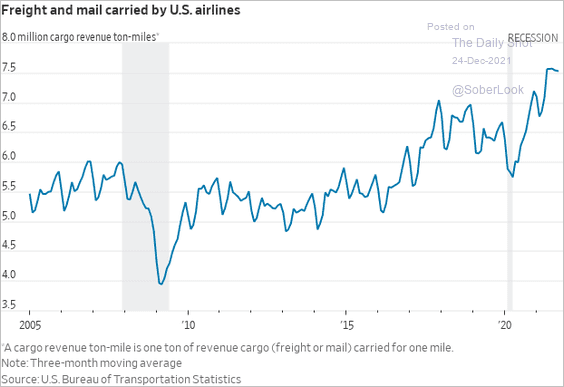
4. US air freight volume:
 Source: @WSJ Read full article
5. Weekend box office proceeds:
 Source: Statista
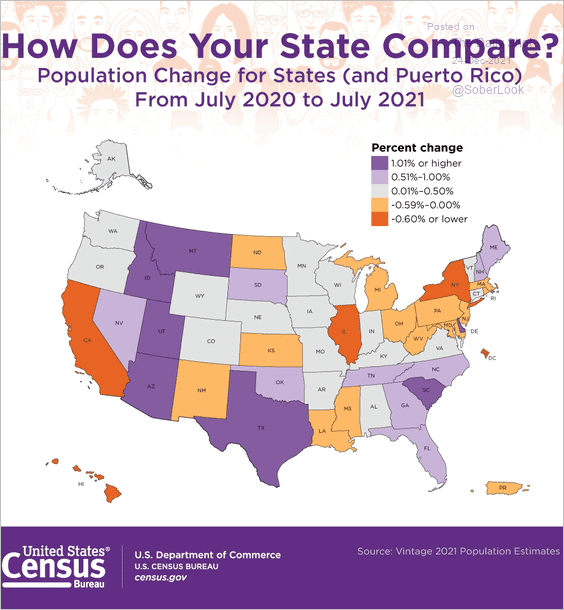
6. Recent population changes by state:
 Source: U.S. Census Bureau Read full article
7. Launching the James Webb space telescope:
 Source: @financialtimes Read full article
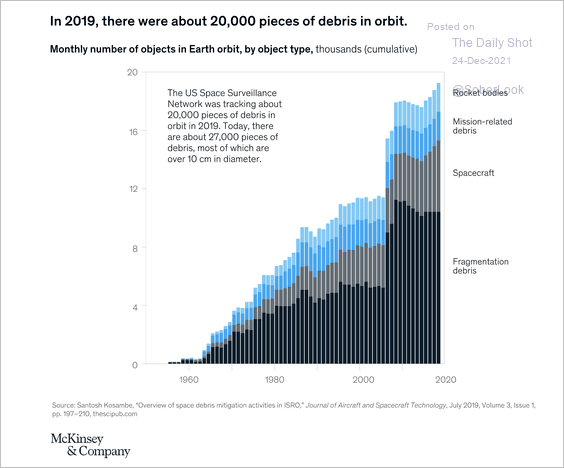
8. Space debris:
 Source: McKinsey
9. Happy holidays!
• Essential holiday traditions:
 Source: Statista
• Plastic trees:
 Source: Statista
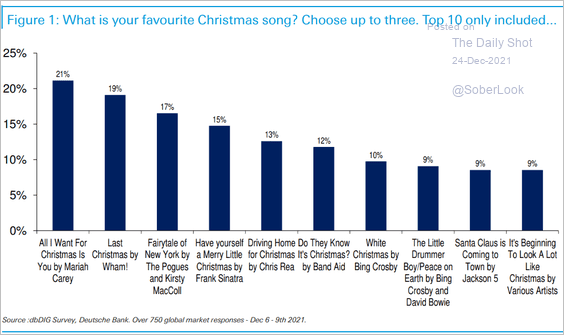
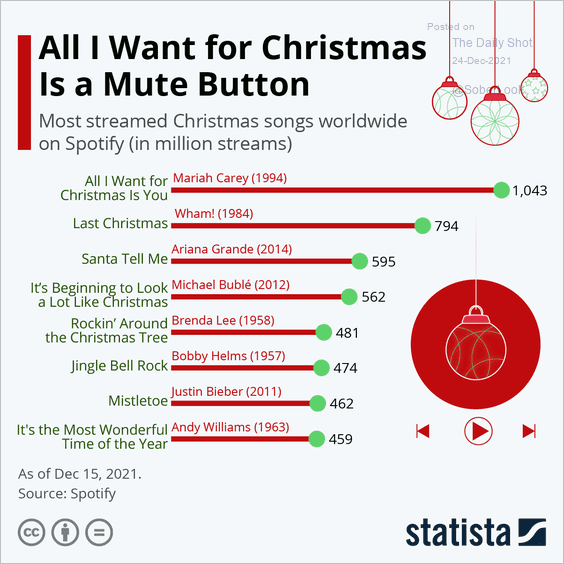
• What is your favorite Christmas song (2 charts)?
 Source: Deutsche Bank Research
 Source: Statista
——————–
We will be back on Monday, January 3rd.
Back to Index
