
The Daily Shot: 01-Feb-22
• The United States
• Canada
• The United Kingdom
• The Eurozone
• Europe
• Asia – Pacific
• China
• Emerging Markets
• Cryptocurrency
• Commodities
• Equities
• Credit
• Rates
• Global Developments
• Food for Thought
The United States
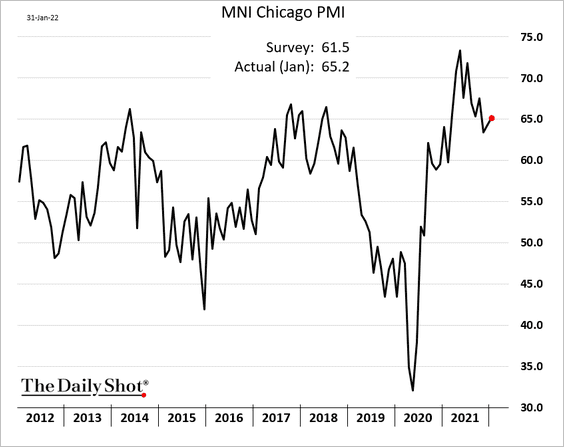
1. The Chicago PMI index was stronger than expected, pointing to robust business activity in the Midwest region.
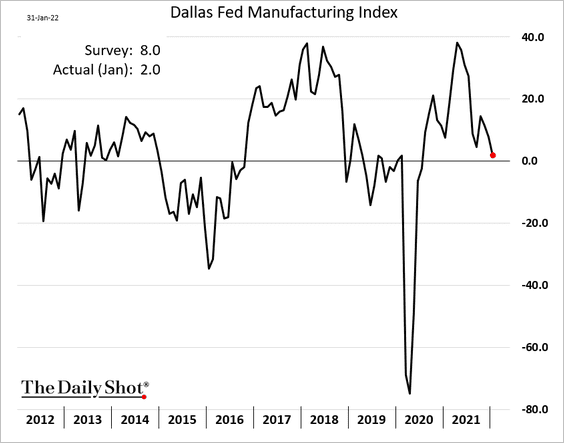
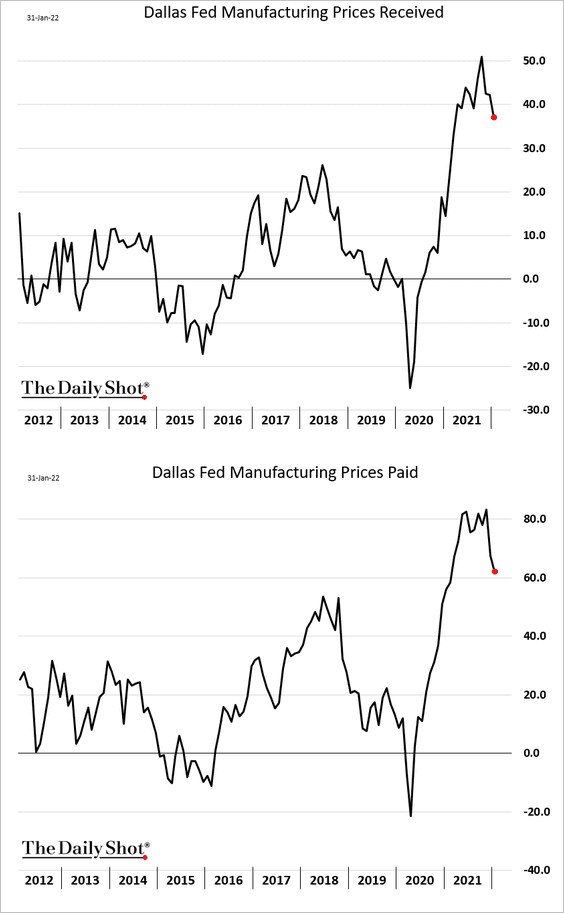
2. On the other hand, the Dallas Fed’s factory index hit the lowest level since mid-2020.
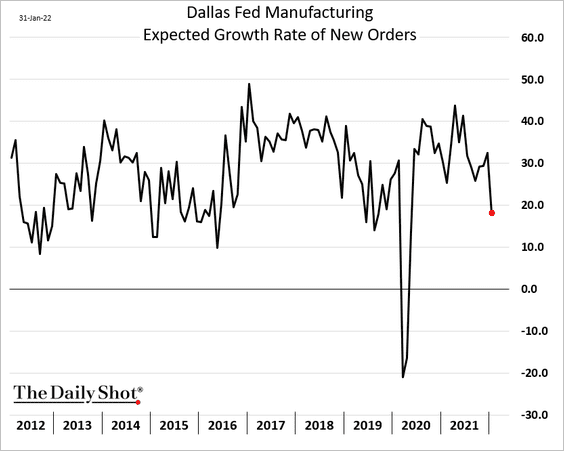
• Expectations of growth in new orders weakened sharply.
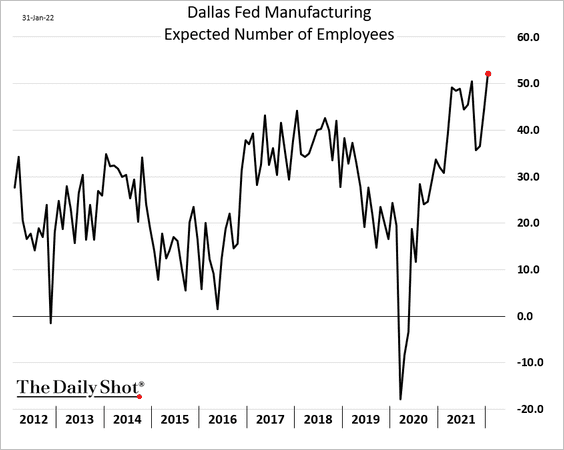
• However, the region’s factories are gearing up for rapid-fire hiring in the months ahead.
• The good news from the report was price moderation. The indices still point to sharp price gains, but we are well off the peaks.
——————–
3. Manufacturers’ backlogs remain massive, suggesting that factories will keep busy in the months ahead.
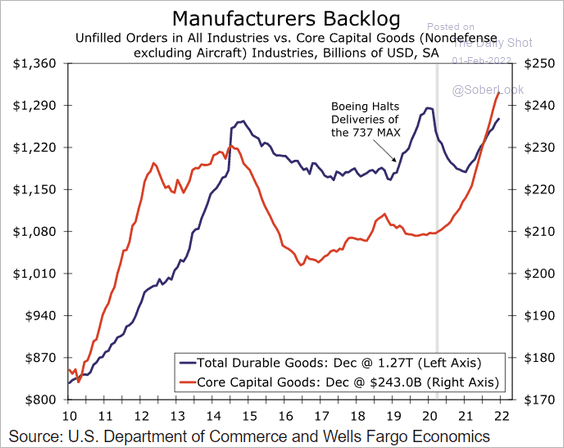 Source: Wells Fargo Securities
The divergence between orders and output indicates that manufacturers haven’t been able to keep up.
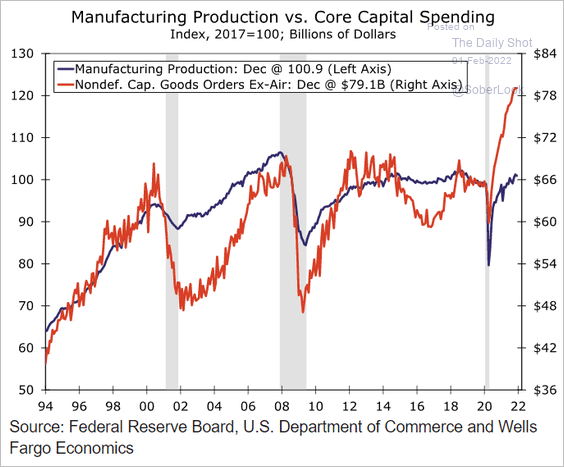 Source: Wells Fargo Securities
——————–
4. Next, we have some updates on the labor market.
• The GDP and payrolls continue to diverge.
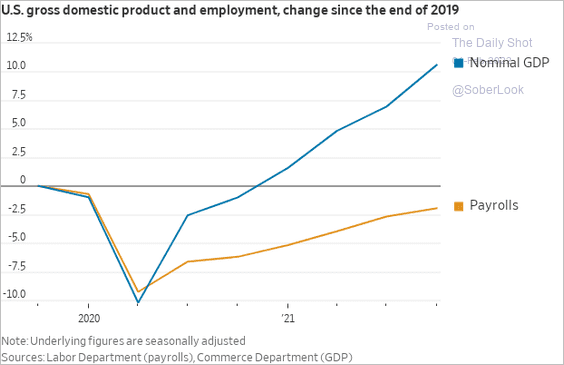 Source: @WSJecon
• Weak labor force participation is now driven by demographics and the COVID-era reluctance to return to work.
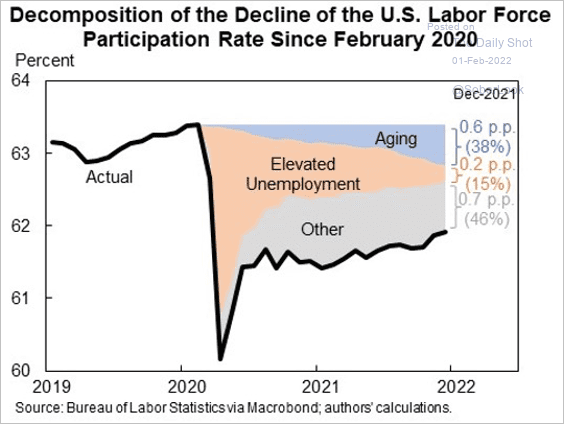 Source: @jasonfurman
• But rising wages are encouraging some workers to re-enter the labor force.
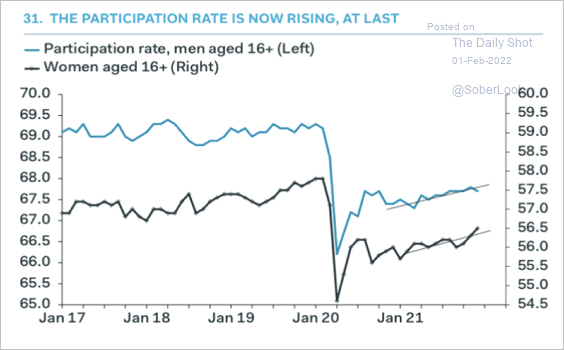 Source: Pantheon Macroeconomics
• Is the unemployment rate about to hit new lows?
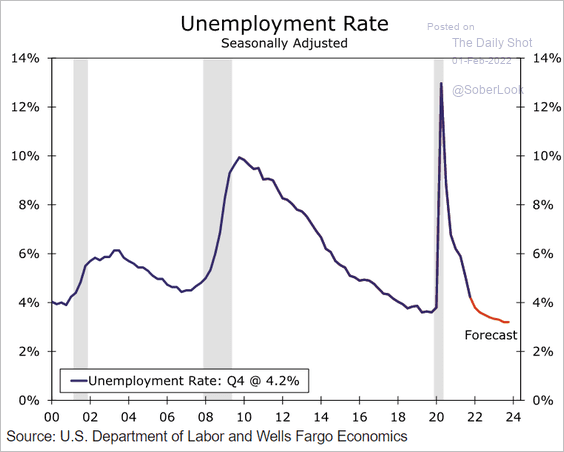 Source: Wells Fargo Securities
• A high employee quit rate indicates further wage growth ahead.
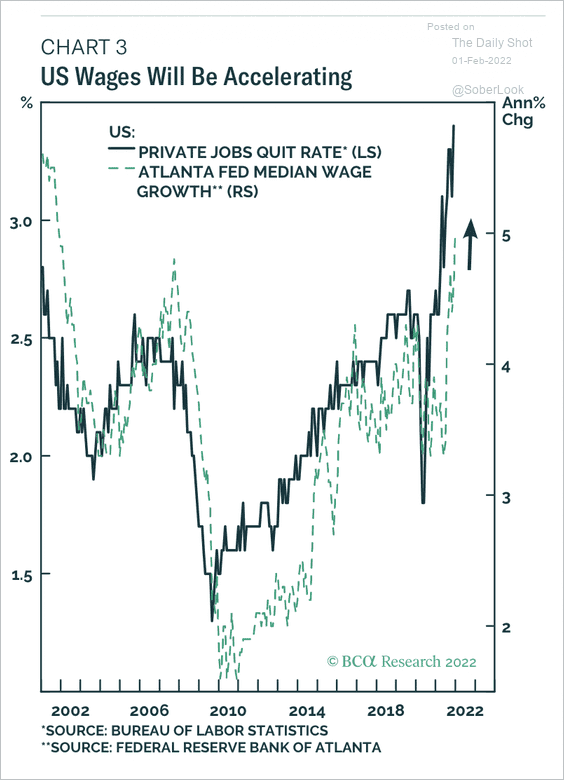 Source: BCA Research
• Real compensation dipped below the trend in December.
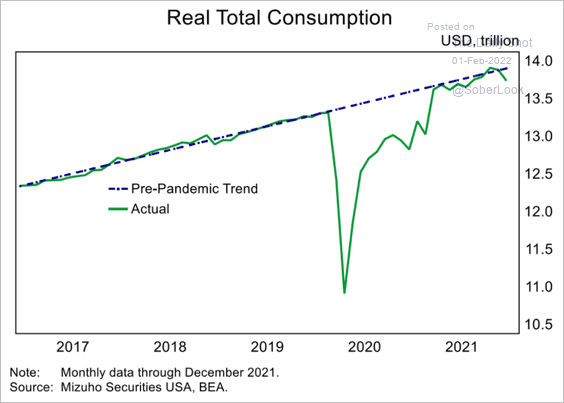 Source: Mizuho Securities USA
• Could we see a decline in payrolls in January? Will it force the Fed to become more cautious?
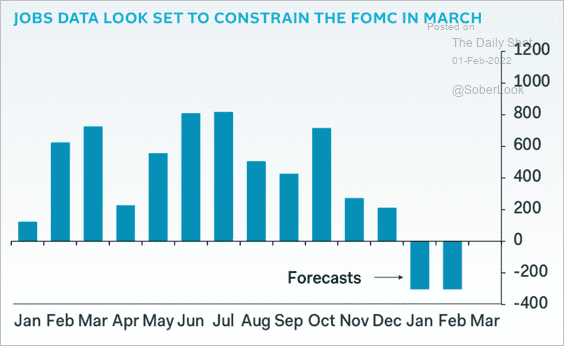 Source: Pantheon Macroeconomics
——————–
5. The federal debt-to-GDP ratio has stabilized earlier than expected. And according to Morgan Stanley, the ratio will be declining over the next couple of years.
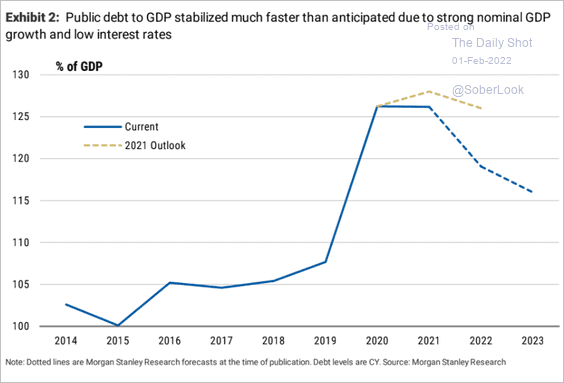 Source: Morgan Stanley Research
Which factors will drive the decline in the US debt-to-GDP ratio?
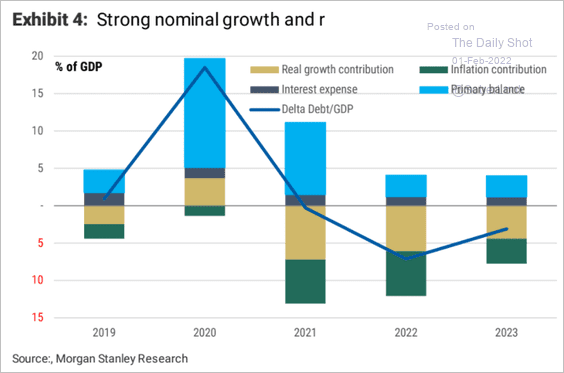 Source: Morgan Stanley Research
Back to Index
Canada
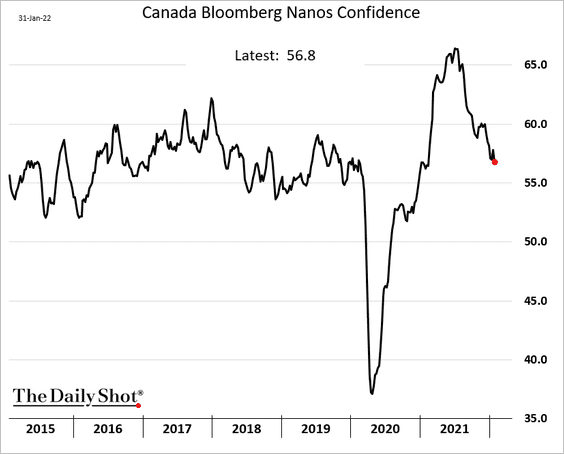
1. Consumer confidence continues to deteriorate.
2. Canada’s high-yield corporate spreads have been very tight as crude oil surges.
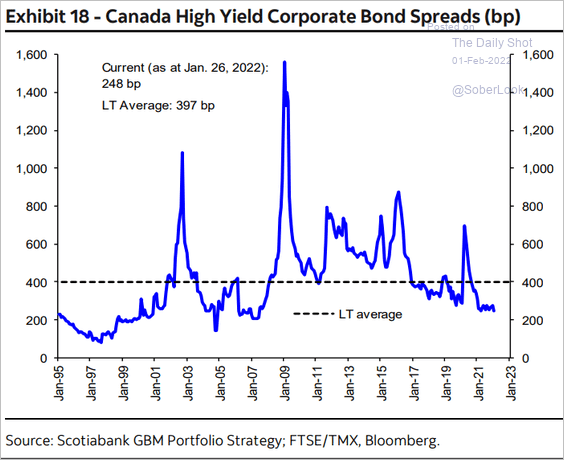 Source: Hugo Ste-Marie, Portfolio & Quantitative Strategy Global Equity Research, Scotia Capital
3. Housing affordability deteriorated in Q3 and is expected to worsen this year.
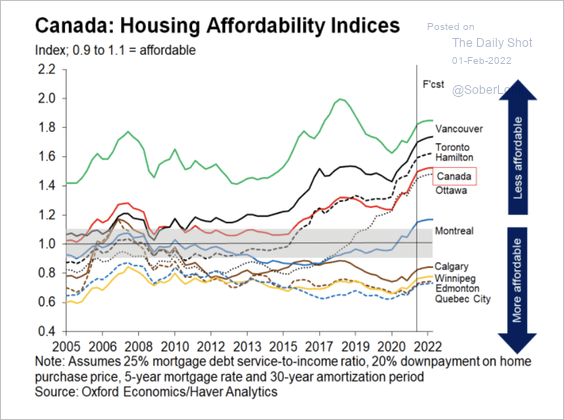 Source: Oxford Economics
Vancouver and Toronto remained the most unaffordable metros in Q3.
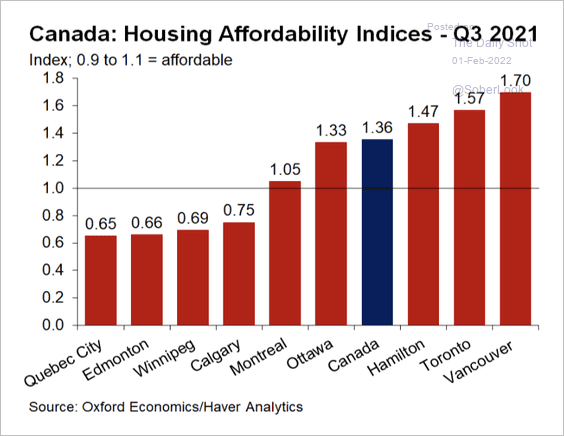 Source: Oxford Economics
Back to Index
The United Kingdom
1. Real wage growth is expected to be negative this year and next, as inflation outstrips wage increases.
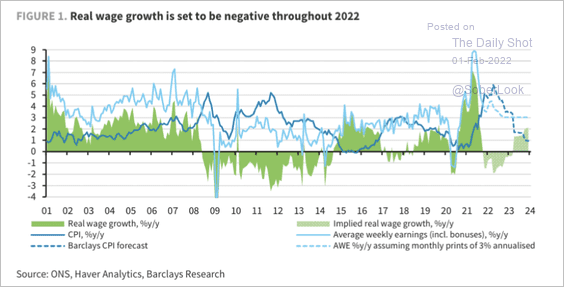 Source: Barclays Research
2. The government has been too optimistic about the UK’s workforce rebound.
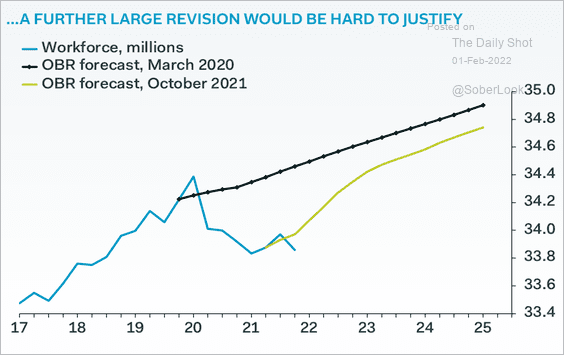 Source: Pantheon Macroeconomics
3. UK emission futures have soared, outpacing those in the EU (2nd chart), as electricity producers are forced to burn more coal.
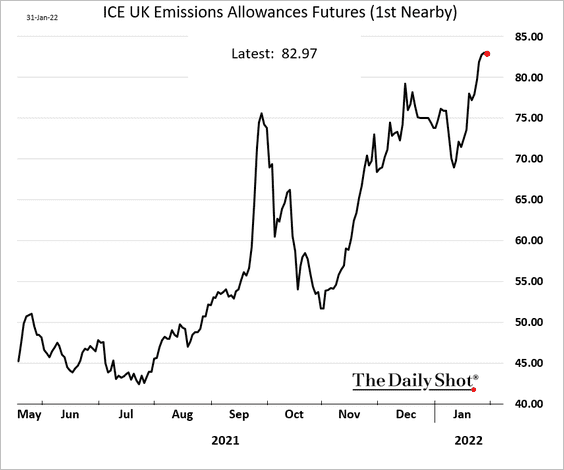
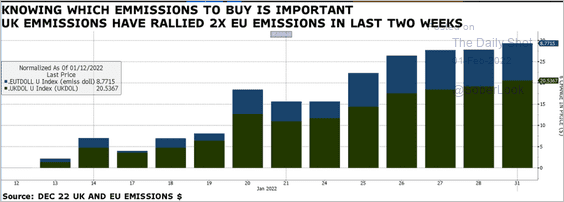 Source: @parrmenidies
Back to Index
The Eurozone
1. Germany’s January CPI came off the highs but was still above 5% on a year-over-year basis. This was another upside inflation shocker.
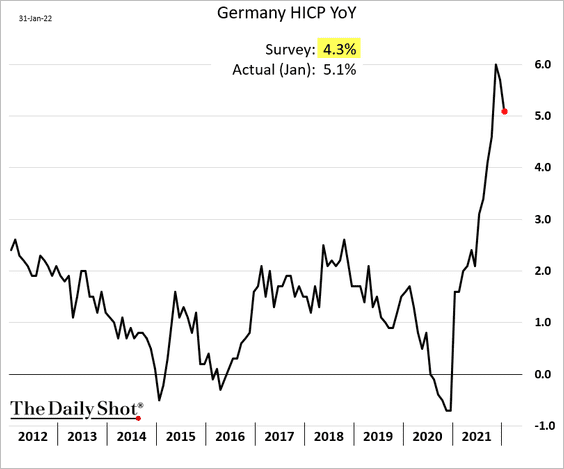
• Adjusting for the VAT effect, Germany’s inflation hasn’t peaked.
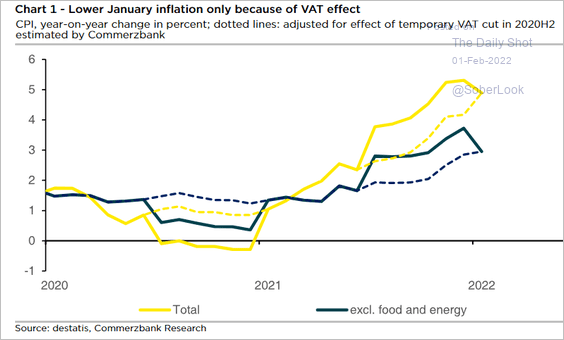 Source: Commerzbank Research
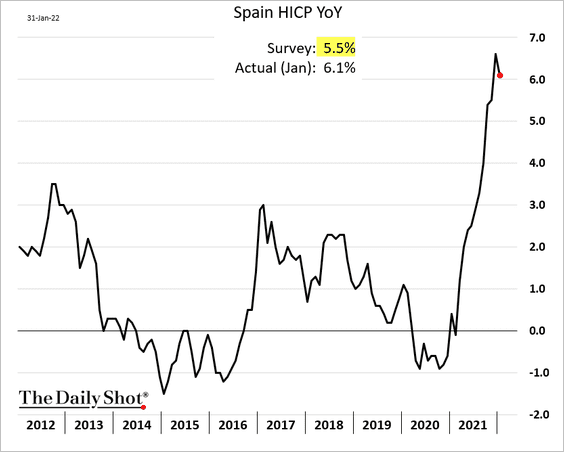
• The situation in Spain was similar.
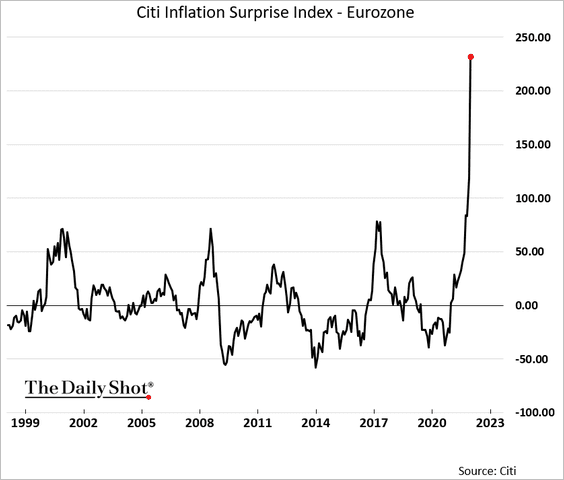
• Here is the Citi euro-area inflation surprise index.
——————–
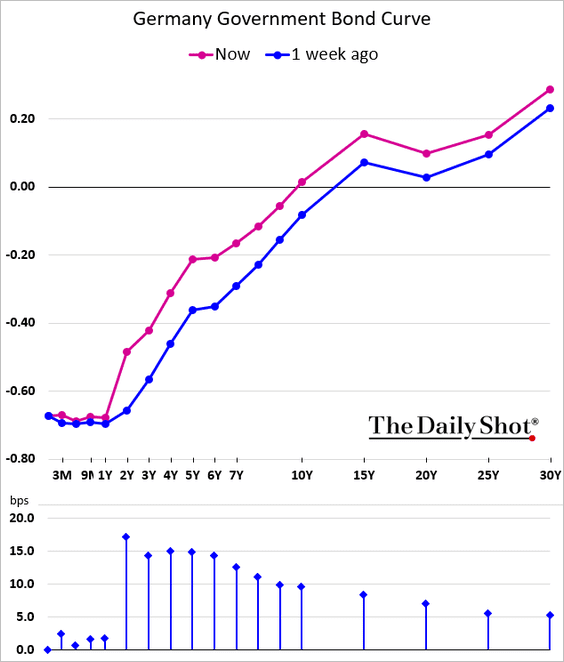
2. How many inflation surprises does the ECB need to see before abandoning its dovish tilt? Shorter euro-area yields are surging, suggesting that the ECB will be changing direction soon.
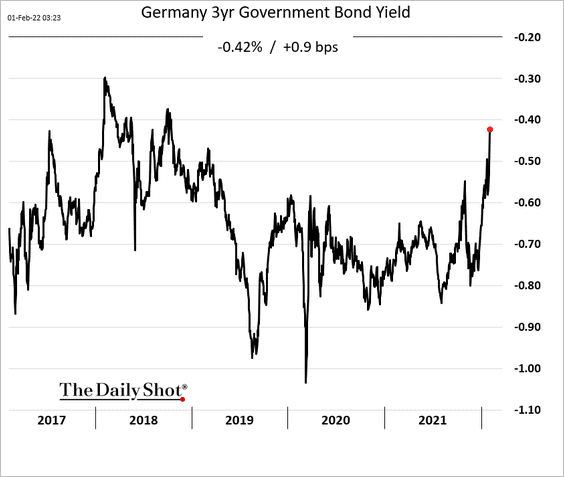
Here is the Bund curve.
And this chart shows the 2-5-10 butterfly (the belly of the curve is under most pressure).
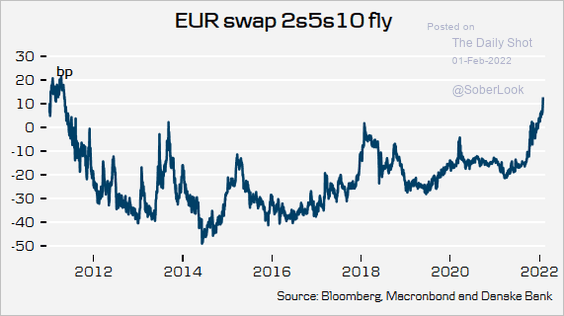 Source: @pietphc
——————–
3. As the TLTRO program ends, the ECB may exempt more excess reserves from the negative deposit rate.
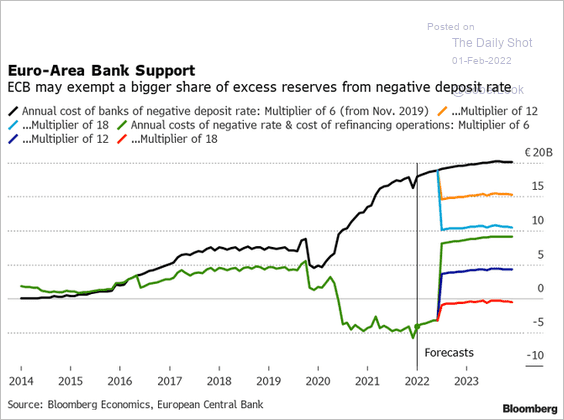 Source: @economics, @davidjpowell24 Read full article
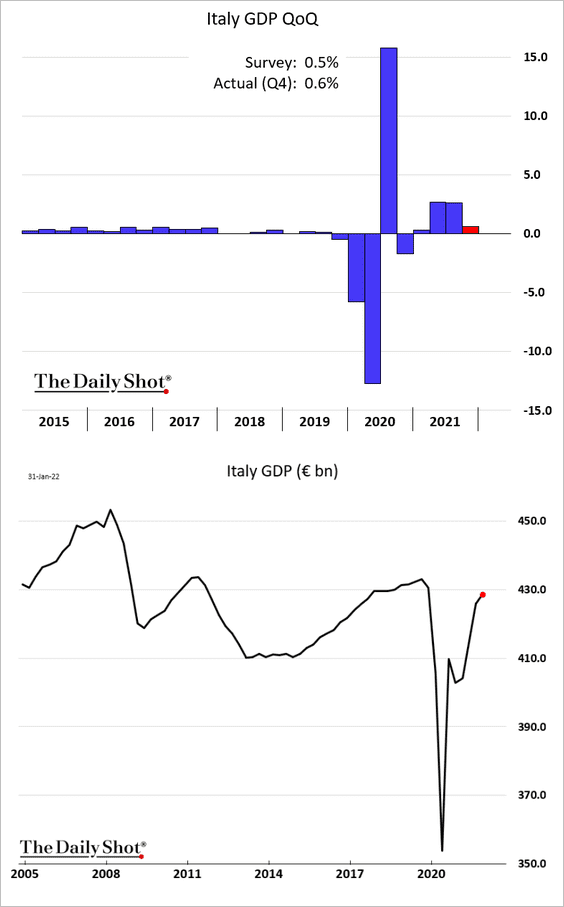
4. Italian Q4 growth was a bit stronger than expected, with the GDP nearing pre-COVID levels.
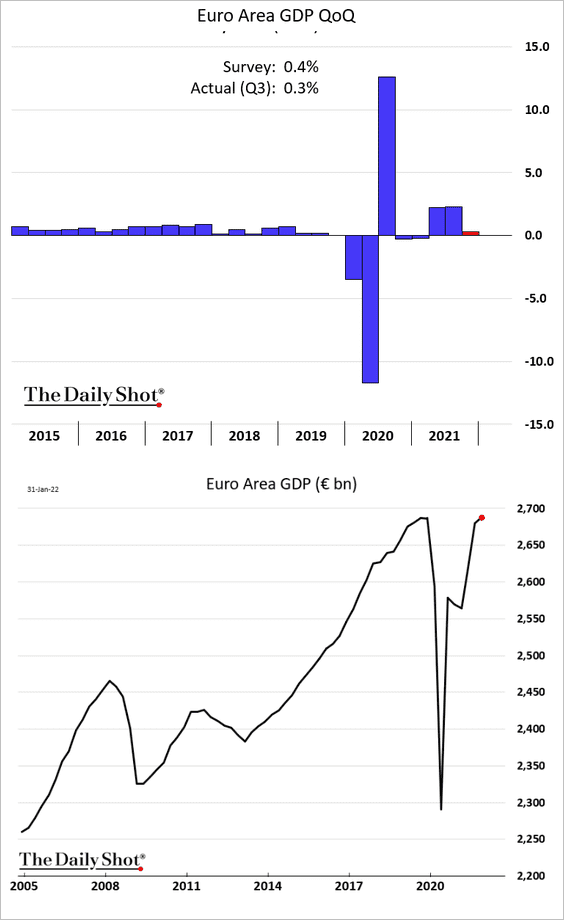
• At the euro-area level, Q4 growth was softer than expected, dragged lower by Germany. But the GDP is now above pre-COVID levels.
• Here is the summary.
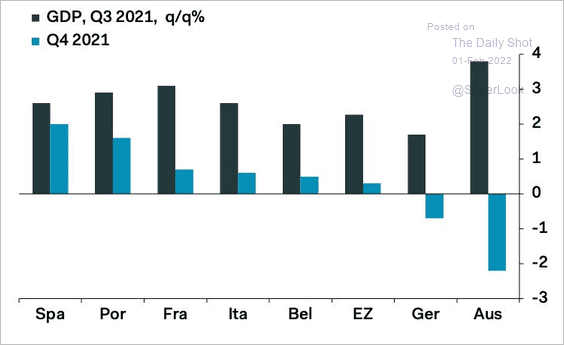 Source: Pantheon Macroeconomics
• Barclays forecasts above-trend growth in the euro area in 2022-2023.
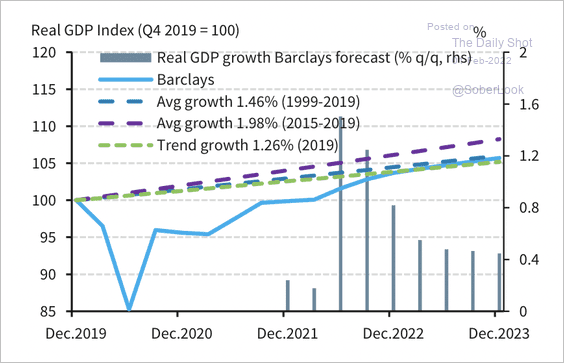 Source: Barclays Research
Back to Index
Europe
1. Swedish PMI (business activity) is still very strong but has started to moderate.
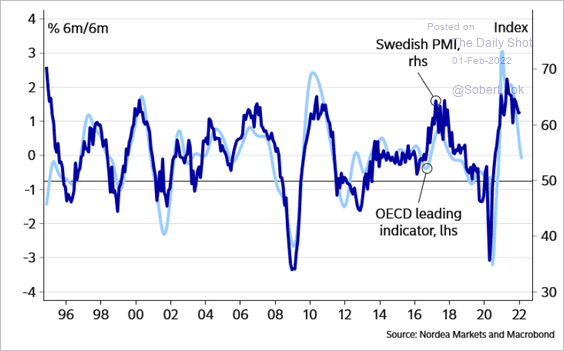 Source: Nordea Markets
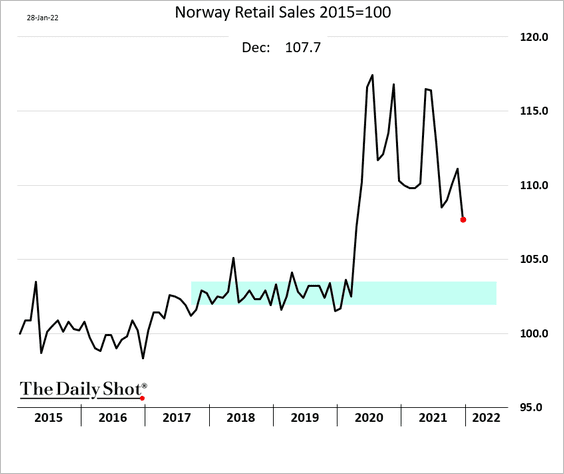
2. Norway’s retail sales are moving back toward pre-COVID levels.
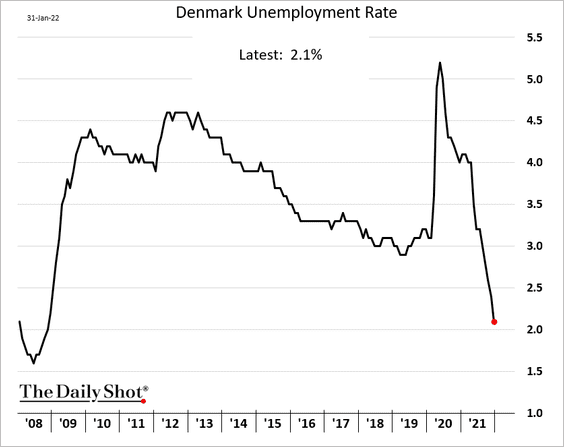
3. Demnamrk’s unemployment rate is approaching 1% for the first time since 2008.
4. Poland’s auto production has outperformed.
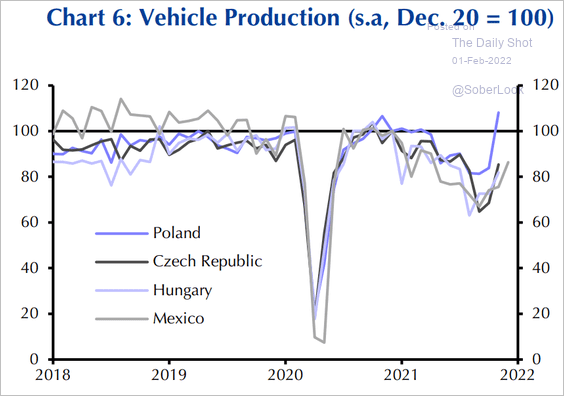 Source: Capital Economics
5. The recent rise in TIPS yields (US real rates) points to outperformance of European equities relative to US equities.
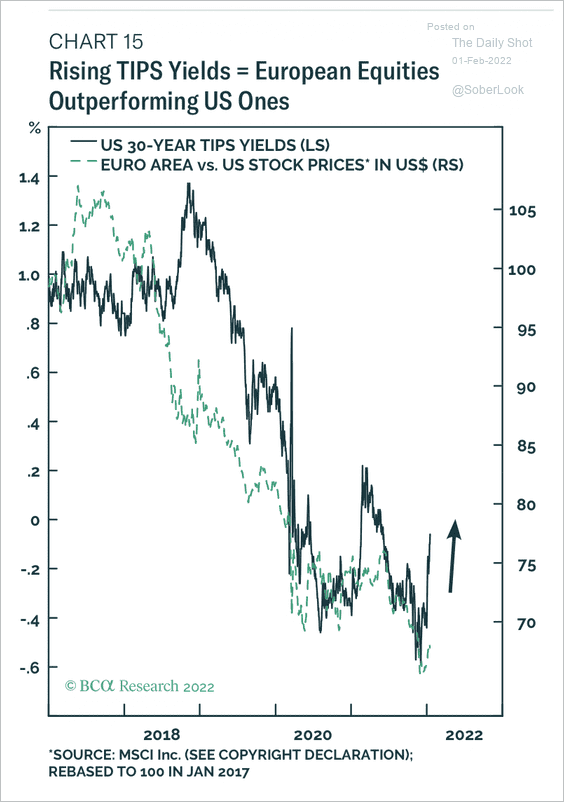 Source: BCA Research
6. Finally, we have household energy prices across the EU.
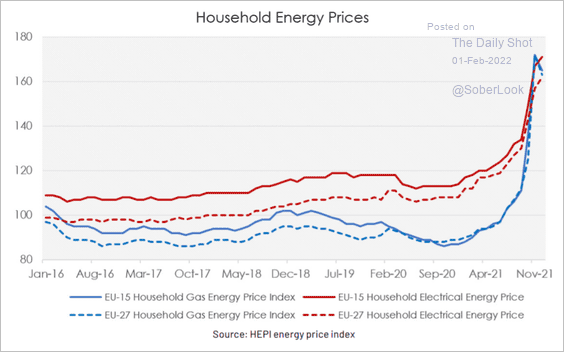 Source: Algebris Investments Read full article
Back to Index
Asia – Pacific
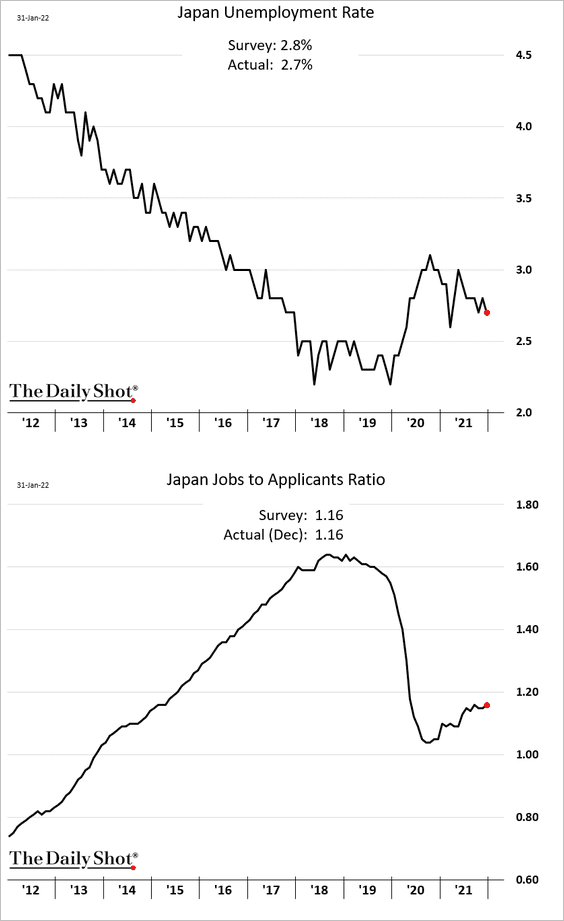
1. Japan’s labor market is improving (very gradually).
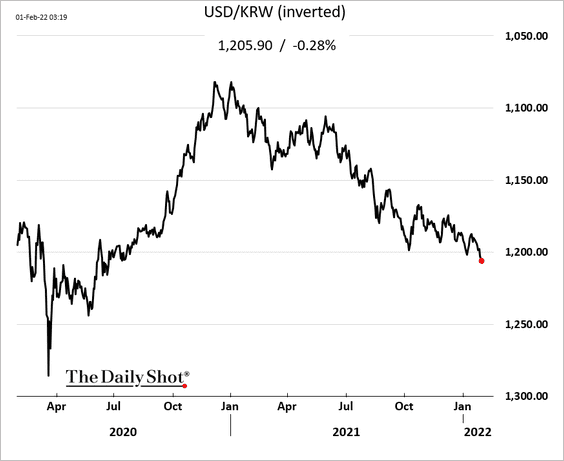
2. The South Korean won remains under pressure.
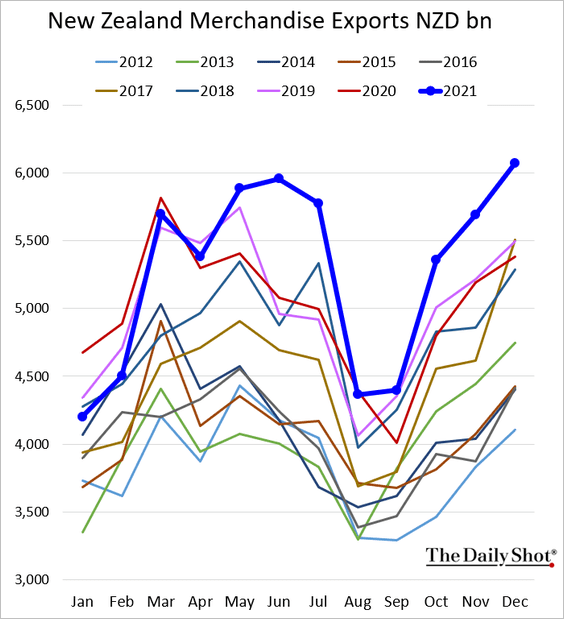
3. New Zealand’s exports surged going into the year-end.
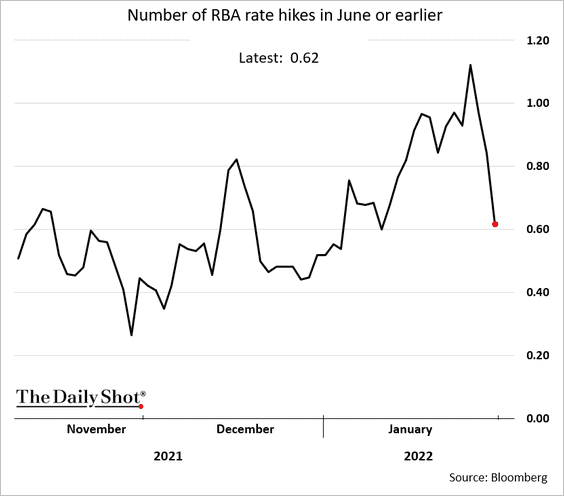
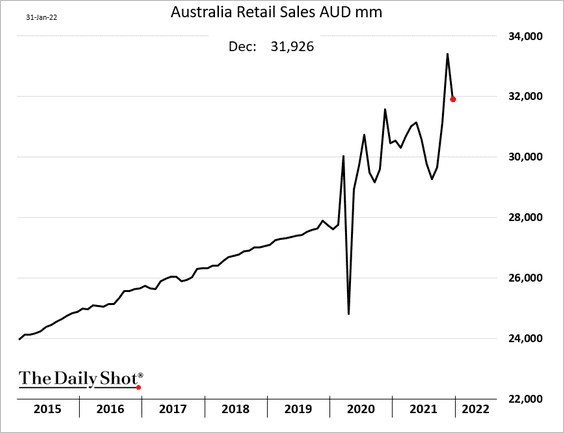
3. Next, we have some updates on Australia.
• The dovish RBA prompted traders to drop the probability of a June hike (approaching 60%).
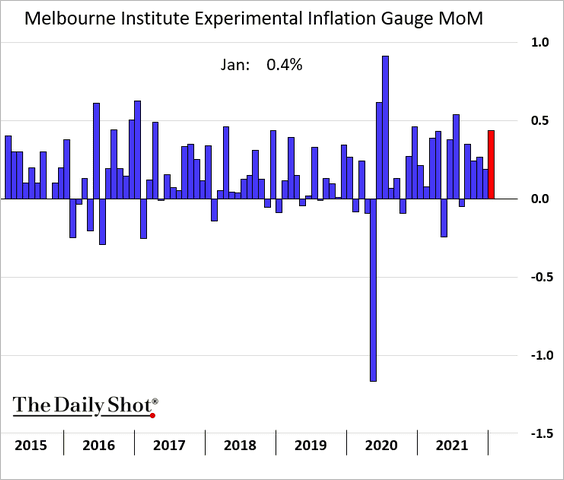
• Inflation firmed up in January.
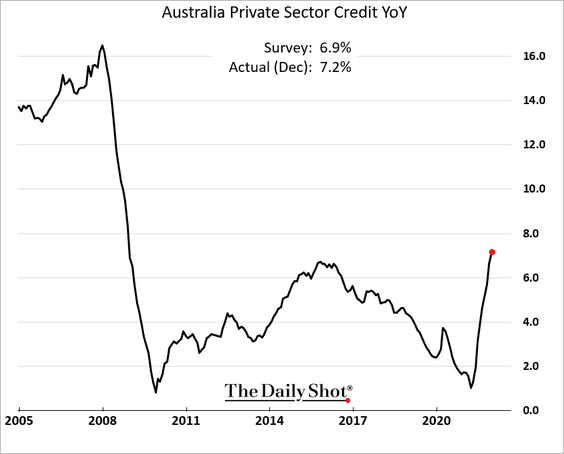
• Credit growth continues to accelerate.
• Retail sales declined more than expected in December, but a separate report showed some improvement in January.
Back to Index
China
1. Here are the components of China’s GDP.
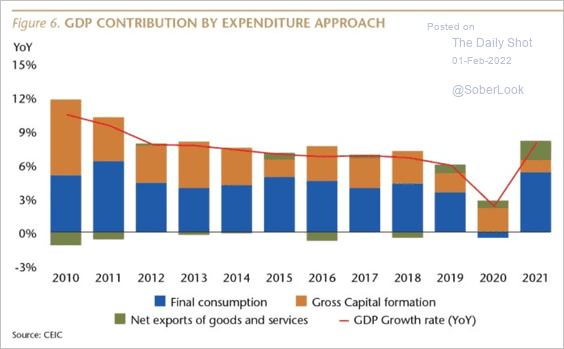 Source: Matthews Asia Read full article
Is Beijing overstating the GDP growth? Below is the Capital Economics China Activity Proxy.
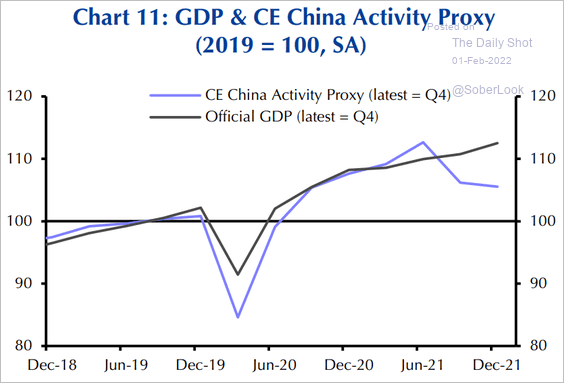 Source: Capital Economics
——————–
2. China saw a pickup in commercial real estate at the back end of 2021.
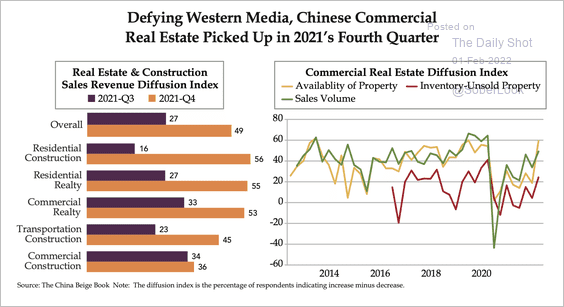 Source: The Weekly Quill
3. Property developers have been issuing a lot of green bonds.
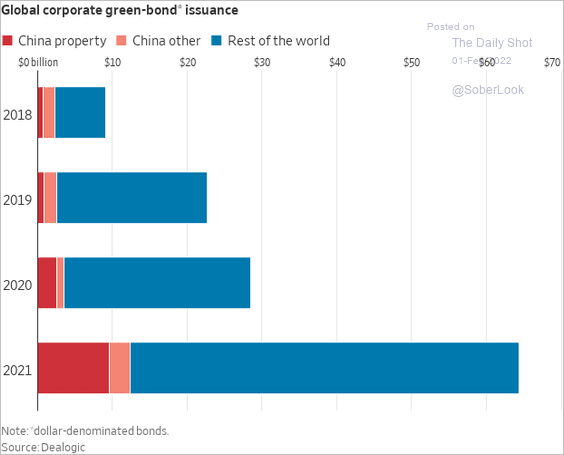 Source: @WSJ Read full article
4. Inventories surged last year.
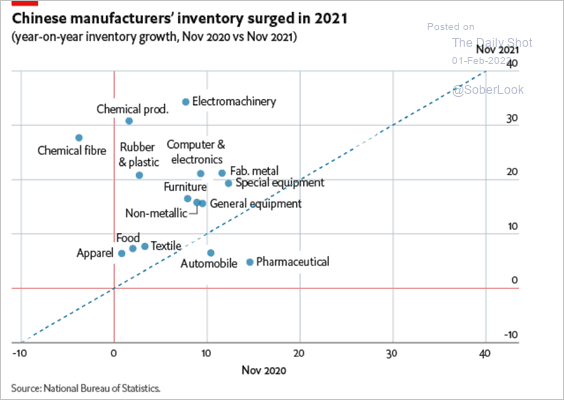 Source: The Economist Read full article
5. Small manufacturers are struggling.
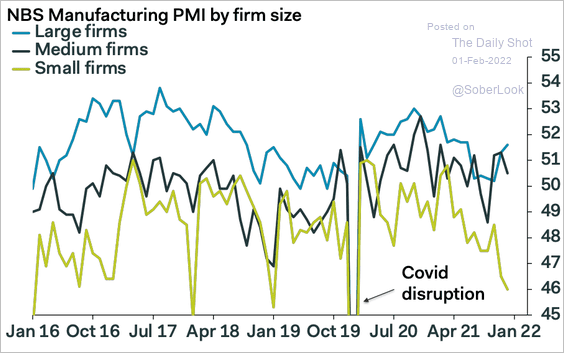 Source: Pantheon Macroeconomics
6. China’s share of global trade keeps rising.
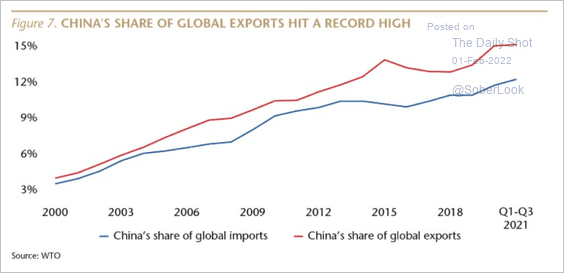 Source: Matthews Asia Read full article
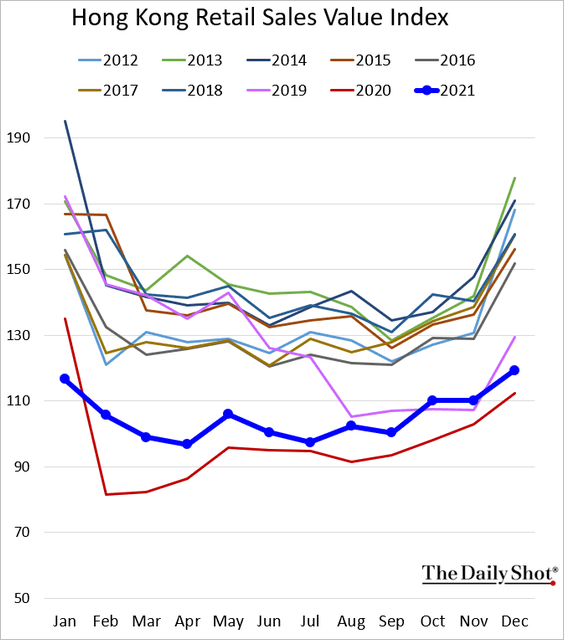
7. Hong Kong’s retail sales were back below 2019 levels in December.
Back to Index
Emerging Markets
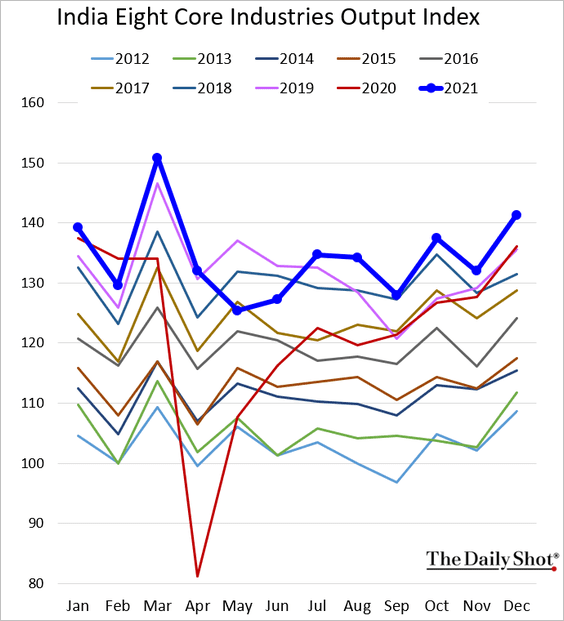
1. India’s production accelerated going into the year-end.
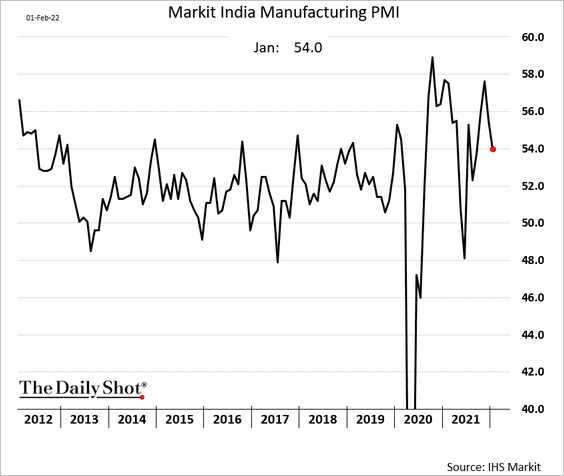
The manufacturing PMI declined in January as omicron hit (but still in growth mode).
——————–
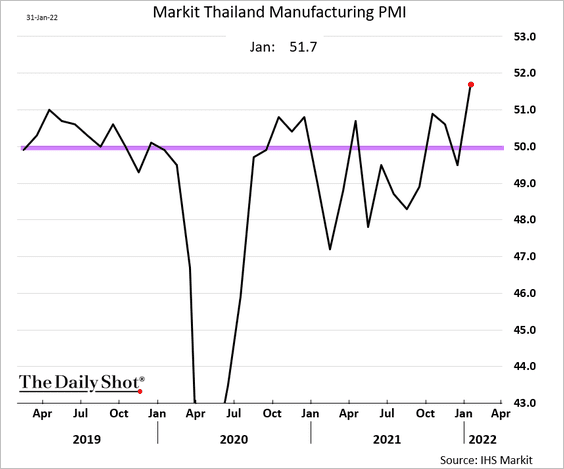
2. Thai factory activity accelerated in January.
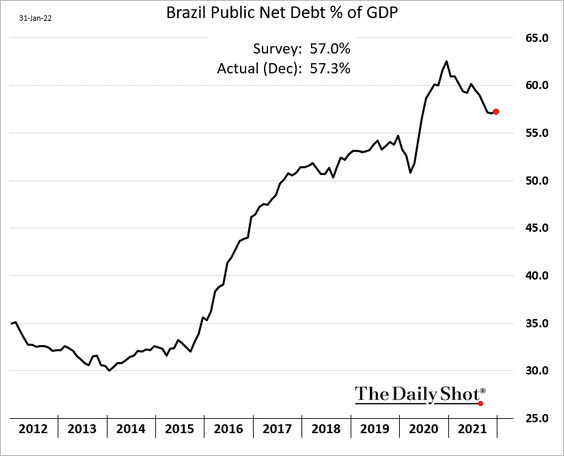
3. Brazil’s debt-to-GDP ratio has stopped declining.
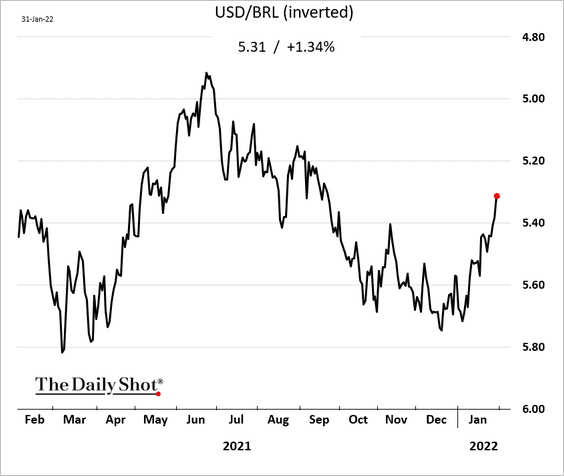
Separately, the real has been rebounding.
——————–
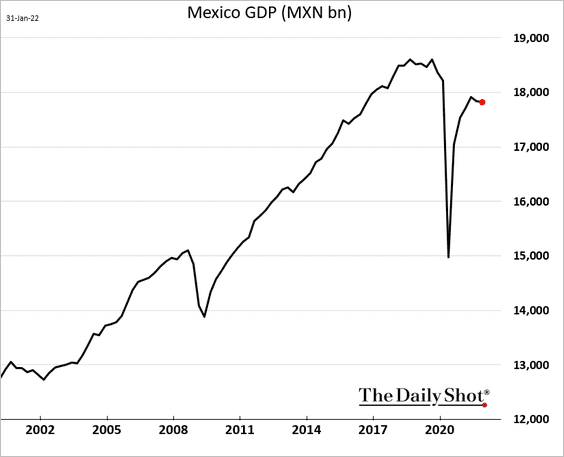
4. Mexico’s Q4 GDP decline was a bit lower than expected.
5. Which countries had the highest inflation surprises?
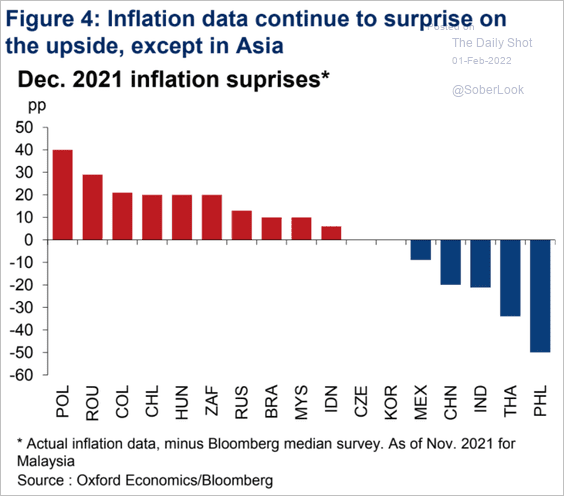 Source: Oxford Economics
6. Will EM corporate earnings disappoint this year?
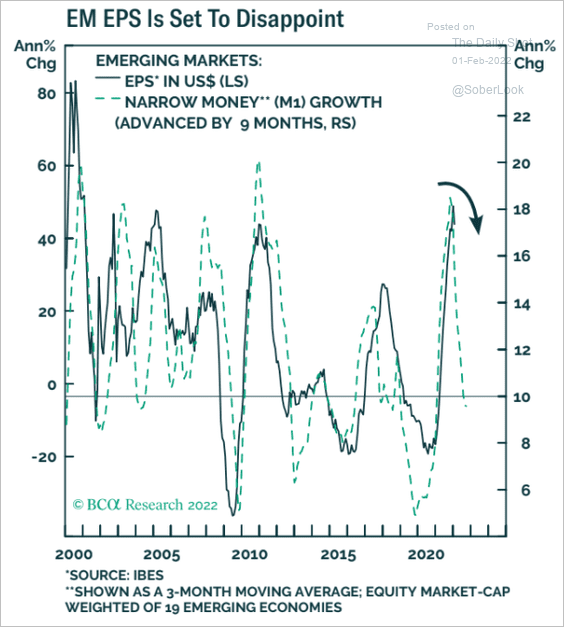 Source: BCA Research
Back to Index
Cryptocurrency
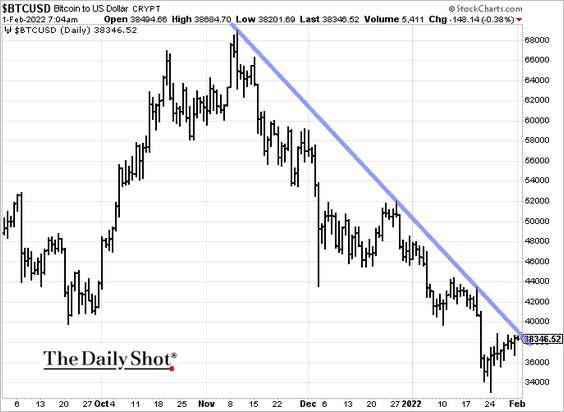
1. Bitcoin is testing resistance.
2. All major cryptocurrencies ended January in the red.
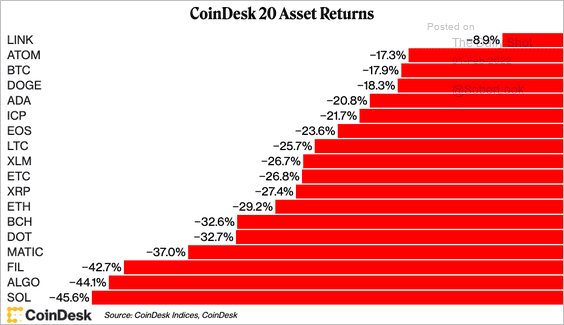 Source: CoinDesk Read full article
3. Bitcoin’s trading volume was significantly lower than a week ago ahead of the Lunar New Year.
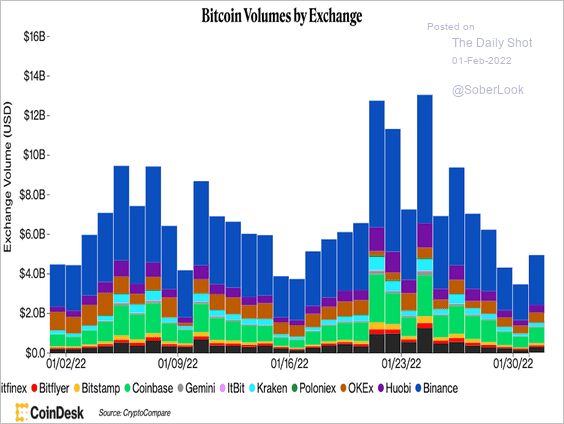 Source: CoinDesk Read full article
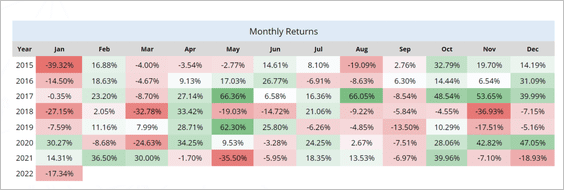
4. February is typically a strong month for bitcoin (2 charts).
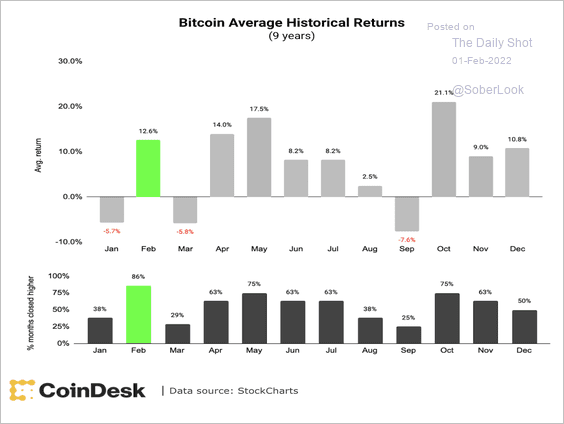 Source: CoinDesk Read full article
 Source: QCP Capital Read full article
——————–
5. Digital asset investment products saw inflows last week, driven by Bitcoin-focused funds. Meanwhile, Ethereum-focused funds saw outflows.
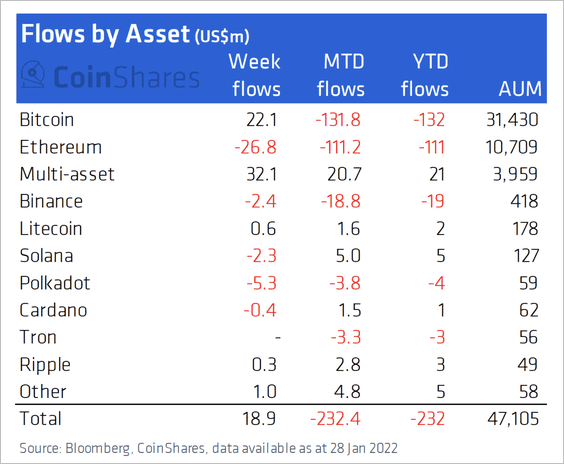 Source: CoinShares Read full article
6. Facebook (now Meta) is officially winding down the stablecoin project it announced in June 2019.
 Source: CoinDesk Read full article
7. What’s the target audience for crypto products?
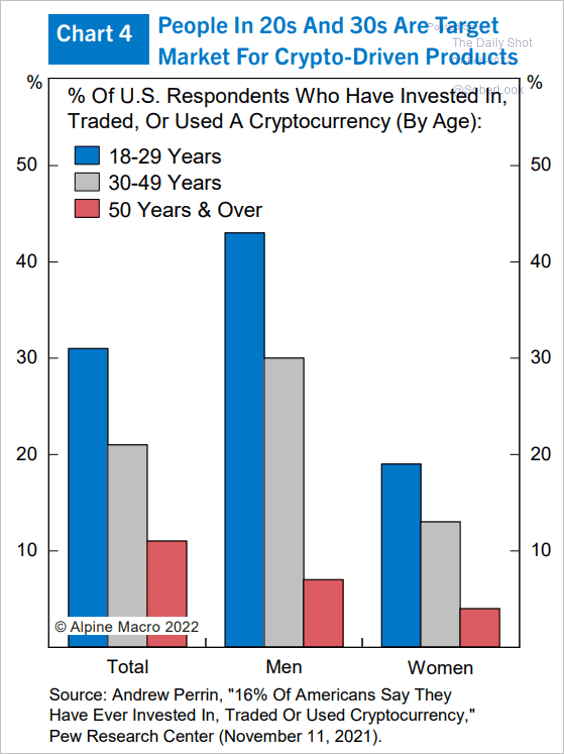 Source: Alpine Macro
Back to Index
Commodities
1. Precious metals ETFs saw massive inflows in January.
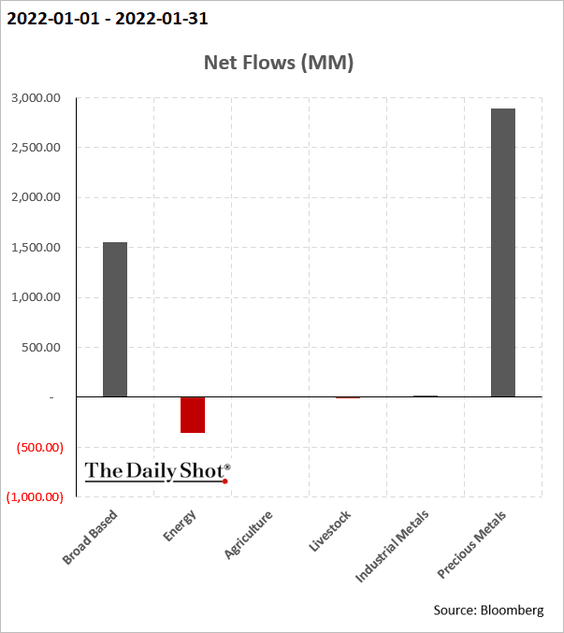
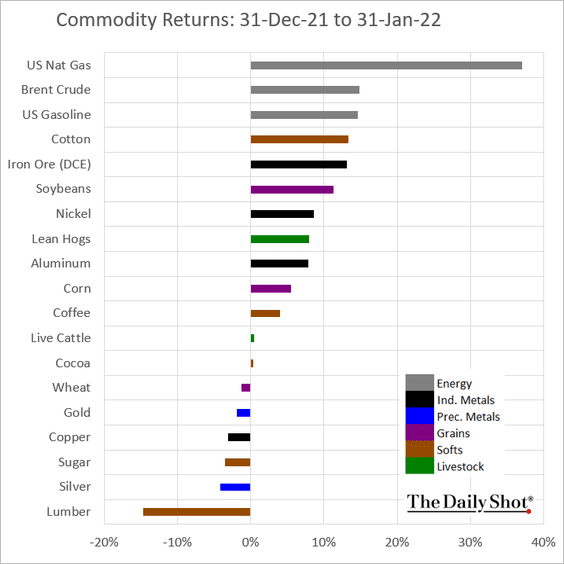
2. Energy outperformed other commodities in January.
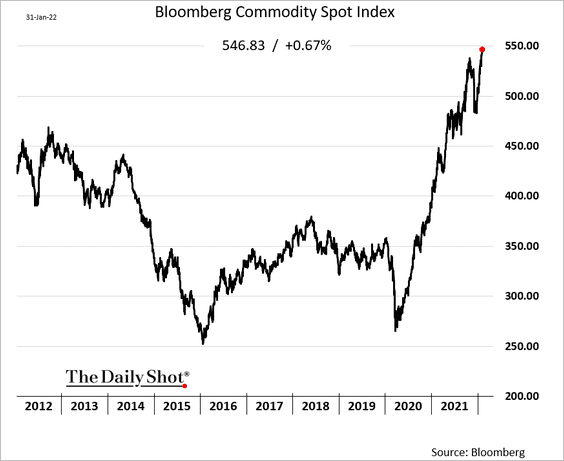
3. Bloomberg’s broad commodity index continues to soar.
4. The nickel market remains exceptionally tight, as backwardation surges.
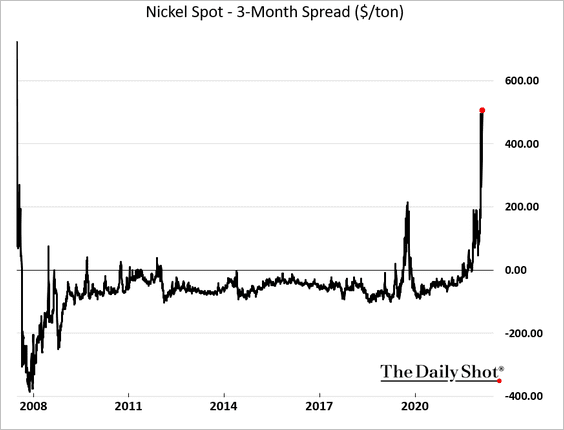 h/t @helloiamyvonne
5. The slowdown in Chinese land prices could lead to further downside in domestic steel prices.
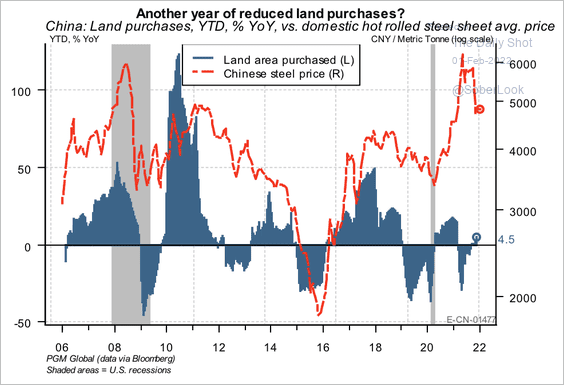 Source: PGM Global
• There has been a sharp buildup of iron ore inventory at Chinese ports over the past year. This is one reason why China has reduced its iron ore imports, which has weighed on prices.
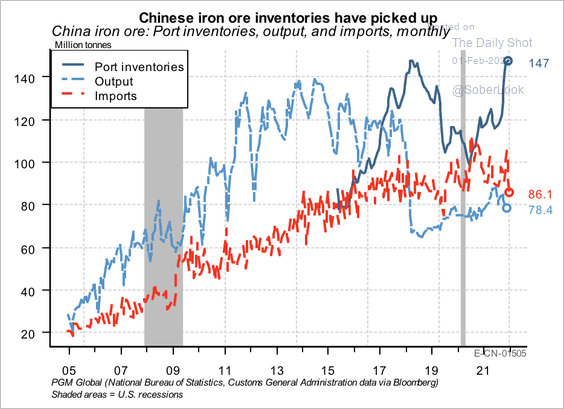 Source: PGM Global
• Iron ore futures have not offered much of a roll yield as the curve flattened. As a result, speculators have little incentive to step in and buy iron ore futures further out the curve.
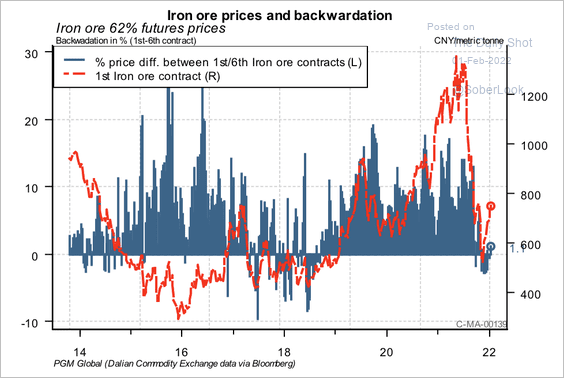 Source: PGM Global
• For now, iron ore mining stocks are starting to recover.
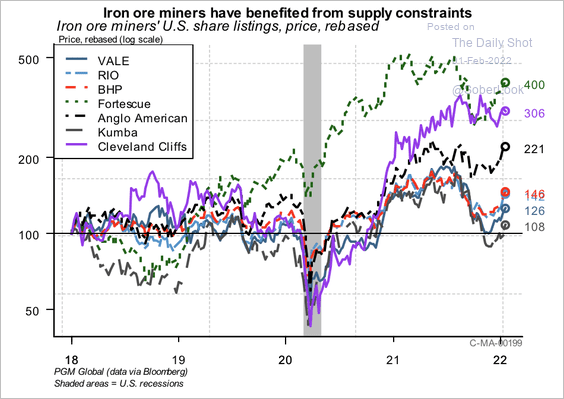 Source: PGM Global
Back to Index
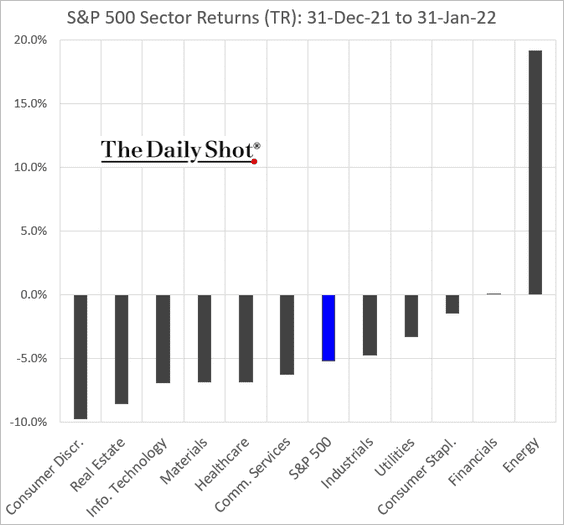
Equities
1. Let’s begin with some performance data for January.
• Returns by sector:
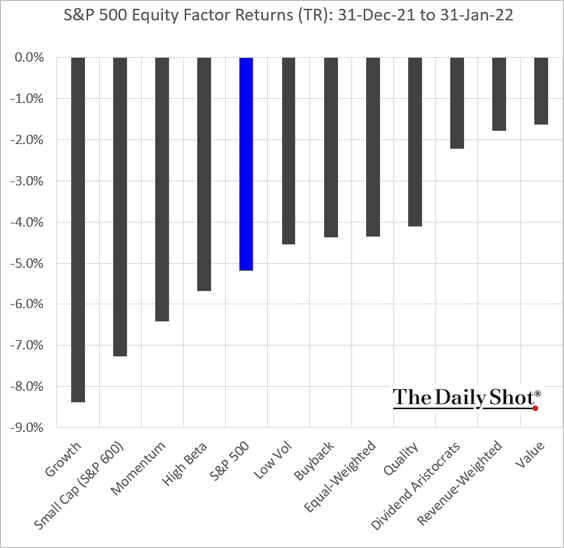
• Equity factors:
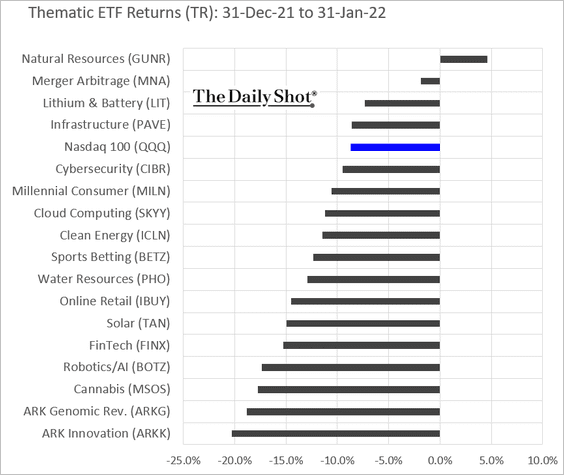
• Thematic ETFs:
——————–
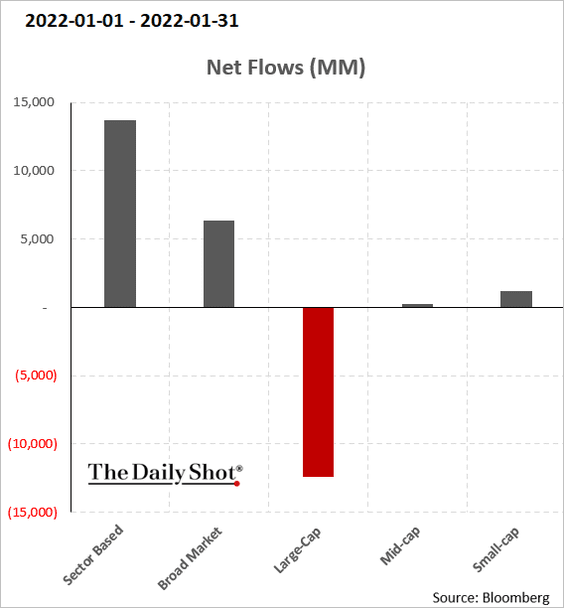
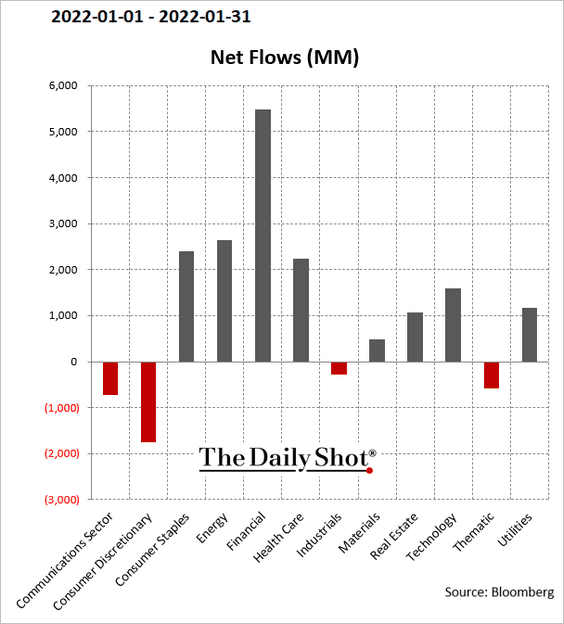
2. Next, we have some fund flow data for January (no signs of capitulation).
• Equity “asset class”:
• Sectors (financials saw massive inflows):
——————–
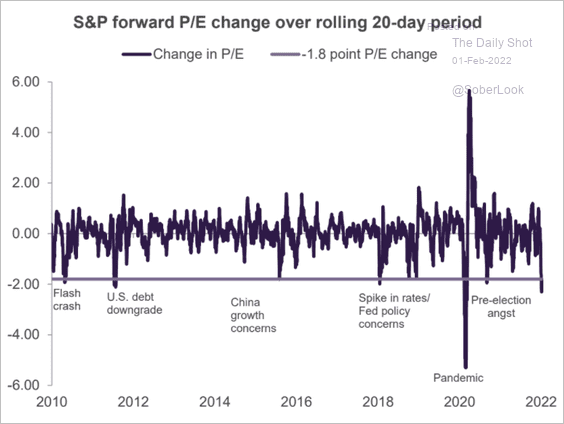
3. January’s decline in the S&P 500 P/E multiple was quite sharp (2 charts).
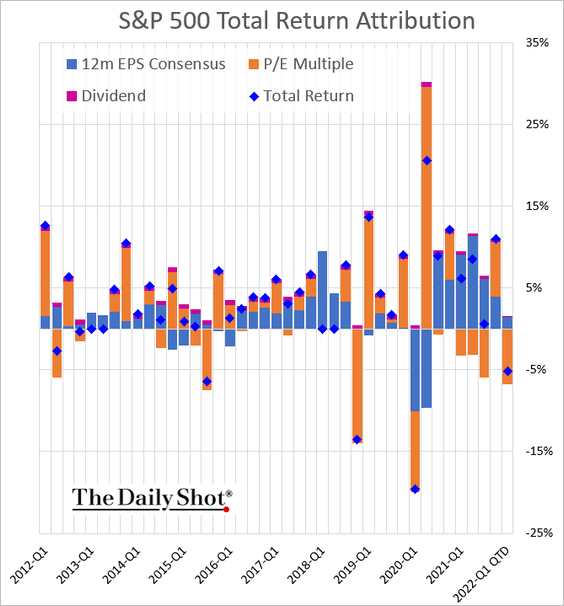
 Source: Truist Advisory Services
Here is the quarterly attribution for the S&P 600 (small caps):
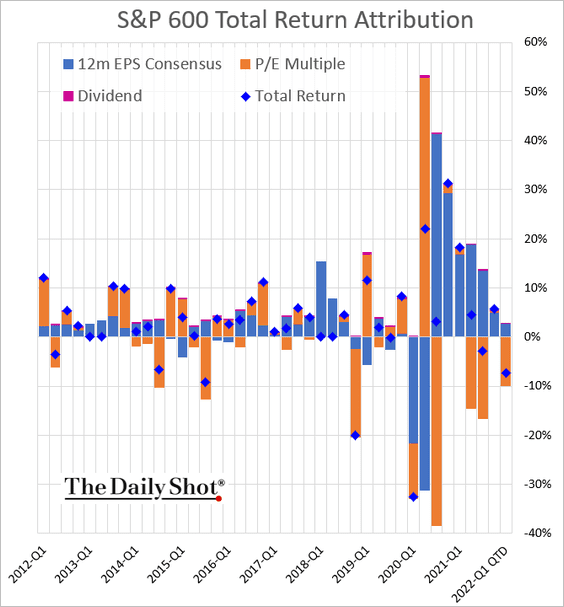
By the way, this attribution analysis adds inflation (as a drag on performance).
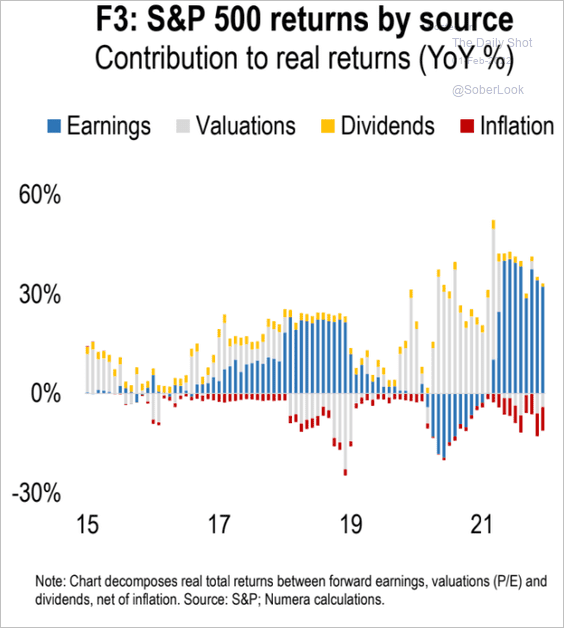 Source: Numera Analytics
——————–
4. The number of money-losing companies in the US keeps climbing.
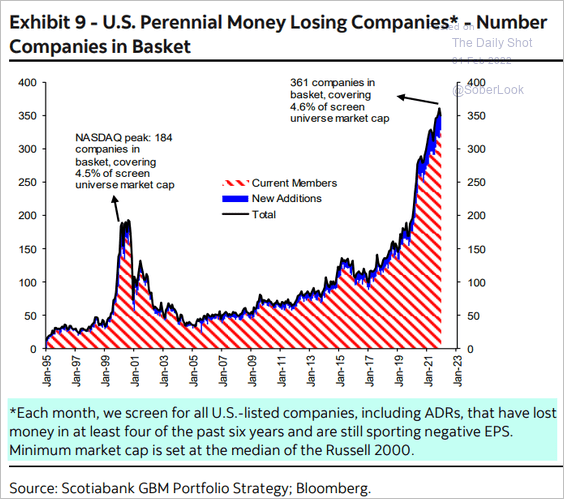 Source: Hugo Ste-Marie, Portfolio & Quantitative Strategy Global Equity Research, Scotia Capital
5. Earnings resumed growth last quarter.
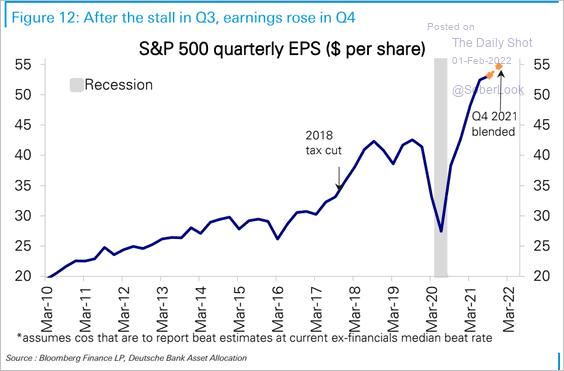 Source: Deutsche Bank Research
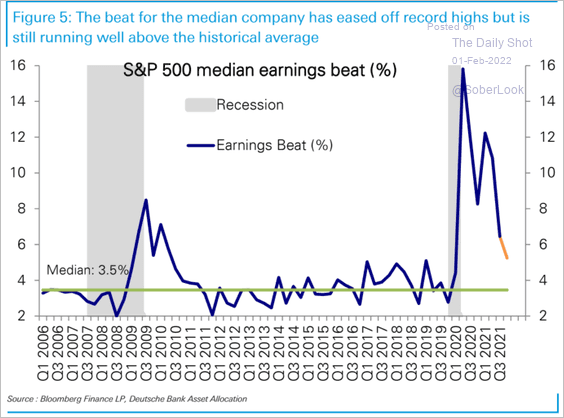
Companies continue to beat earnings forecasts, …
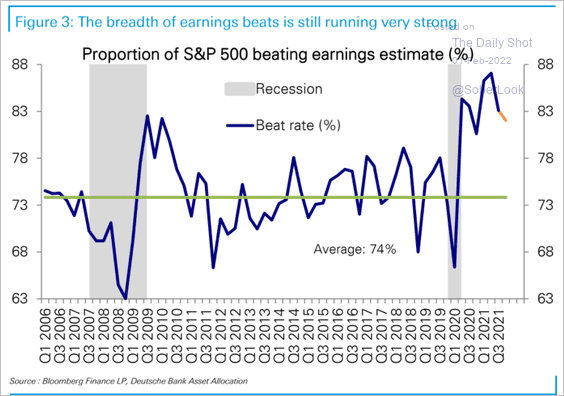 Source: Deutsche Bank Research
… but by not as much as over the past two years.
 Source: Deutsche Bank Research
——————–
6. How concerned should investors be about central banks reducing their balance sheets?
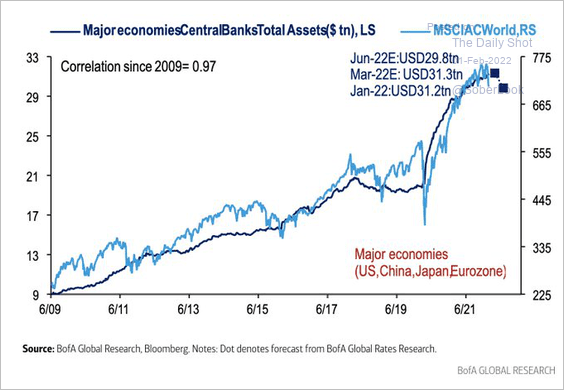 Source: BofA Global Research
7. Demand for call options has been trending lower.
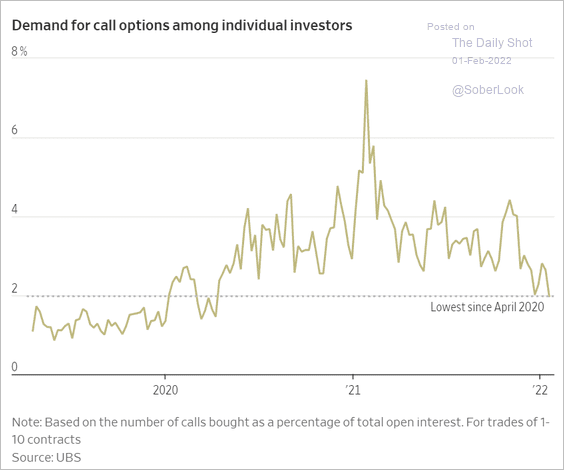 Source: @WSJ Read full article
8. Have ETF assets peaked for now?
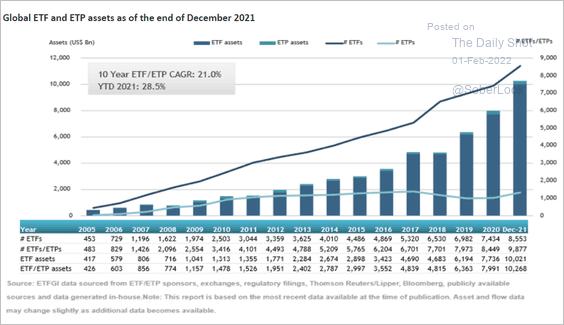 Source: ETFGI Read full article
Back to Index
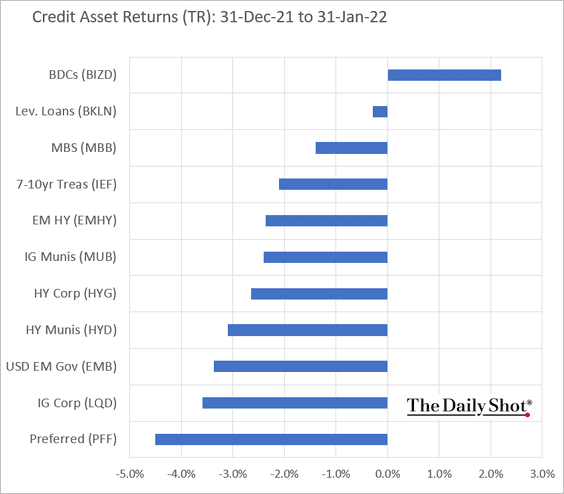
Credit
1. Here are the January returns by credit asset class (with Treasuries included for comparison).
2. High-yield ETF put volume surged during this selloff.
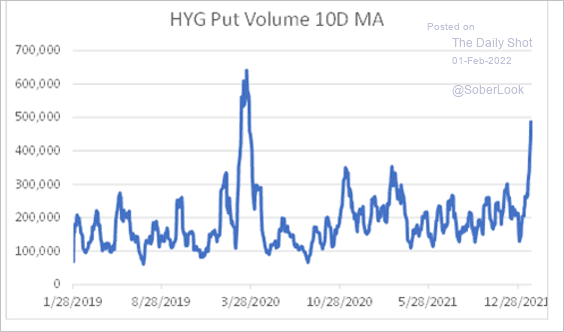 Source: @danny_kirsch
3. US firms are starting to borrow again.
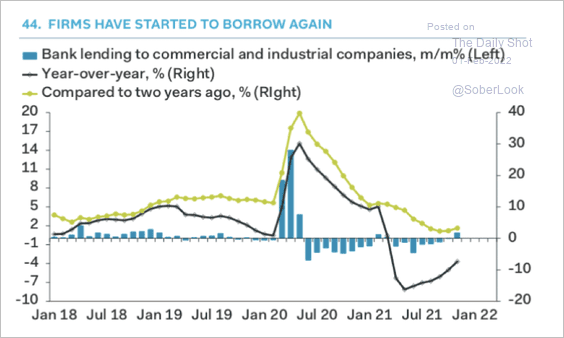 Source: Pantheon Macroeconomics
Back to Index
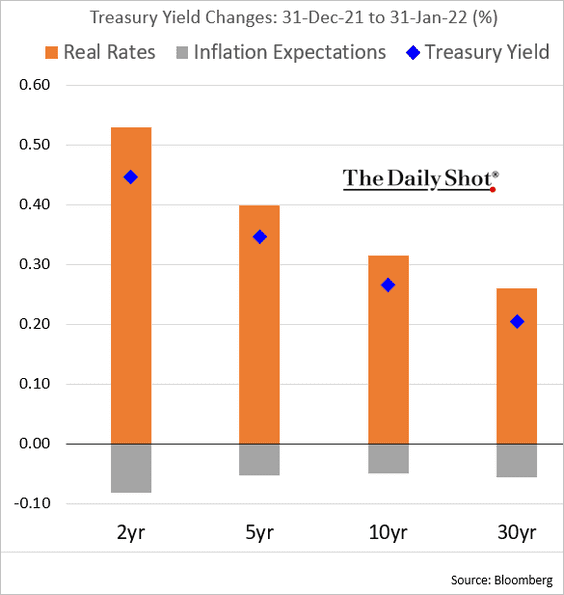
Rates
1. The latest rise in Treasury yields and the curve flattening have been driven by real yields, not inflation expectations (2 charts).
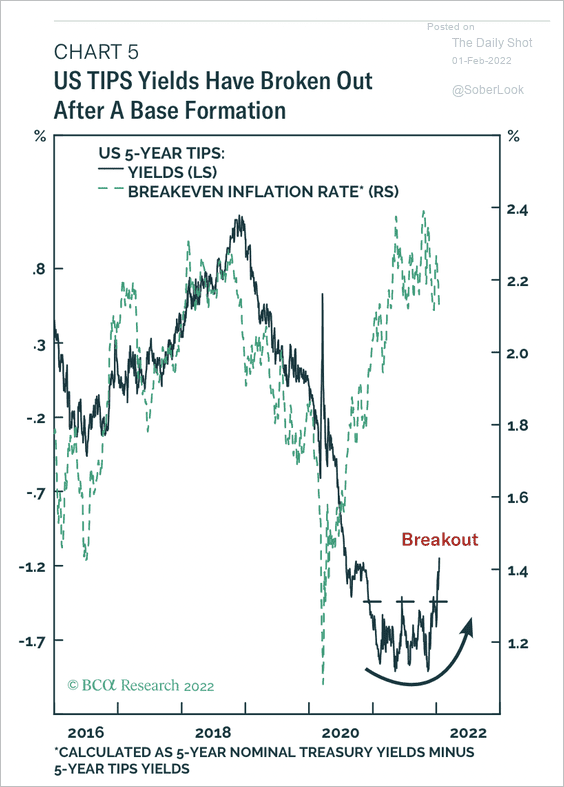 Source: BCA Research
——————–
2. 10-year and 30-year Treasury yields are making another attempt to reverse a downtrend. Previous technical breakouts preceded another 50 basis point rise in yields before a pause/reversal downwards.
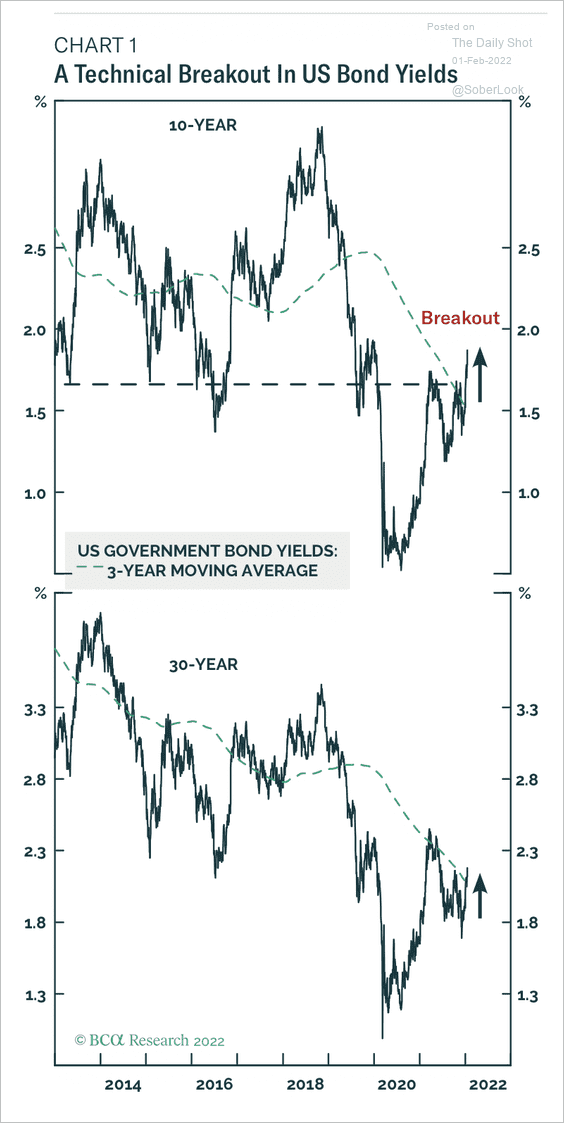 Source: BCA Research
3. The spread between on- and off-the-run Treasuries has been tightening.
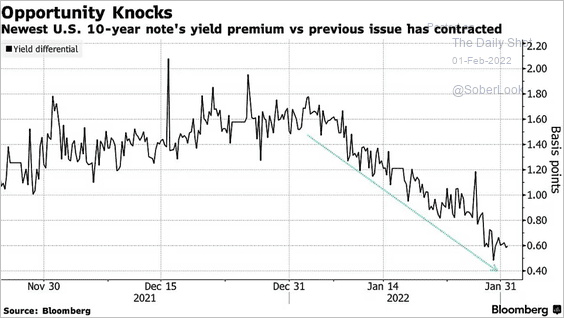 Source: Bloomberg Read full article
4. TIPS saw some outflows recently.
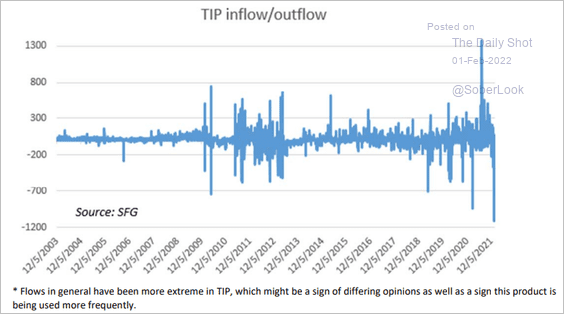 Source: Chris Murphy, Susquehanna International Group
Back to Index
Global Developments
1. DM currencies took a hit relative to USD after the January FOMC meeting.
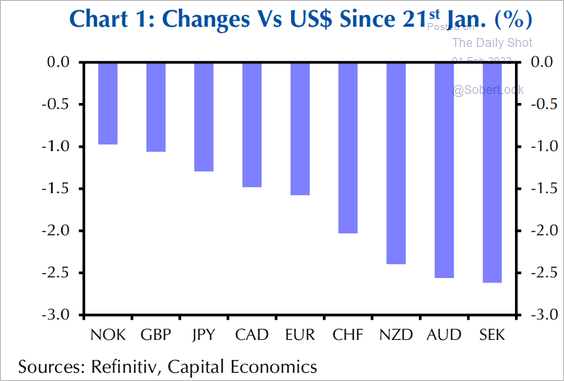 Source: Capital Economics
2. Financial conditions have tightened substantially.
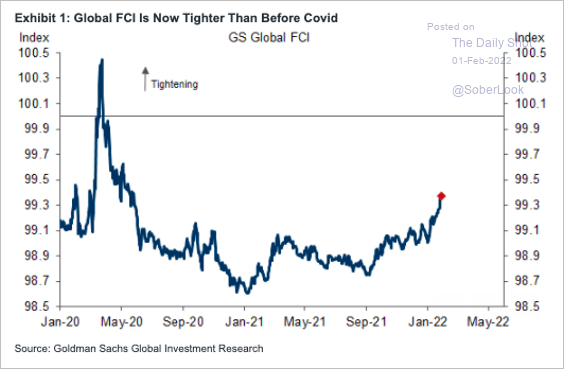 Source: Goldman Sachs; @SamRo
3. The Fed is expected to spearhead quantitative tightening among major central banks.
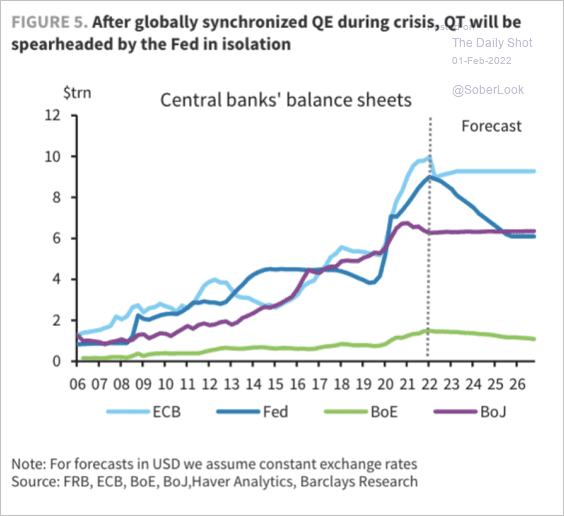 Source: Barclays Research
——————–
Food for Thought
1. Organ transplant waiting lists:
![]() Source: Statista
Source: Statista
• Organ transplants performed:
![]() Source: @axios Read full article
Source: @axios Read full article
——————–
2. The phones emitting the most radiation:
 Source: Statista
3. Spotify listeners:
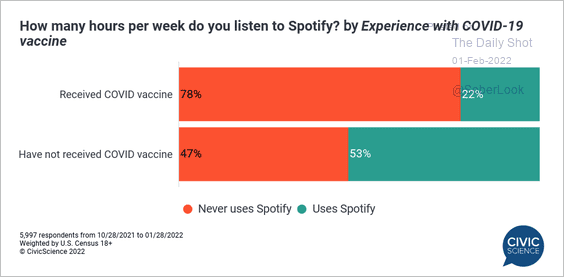 Source: @CivicScience
4. Global nuclear power production:
![]() Source: Visual Capitalist Read full article
Source: Visual Capitalist Read full article
5. Managers supporting employees:
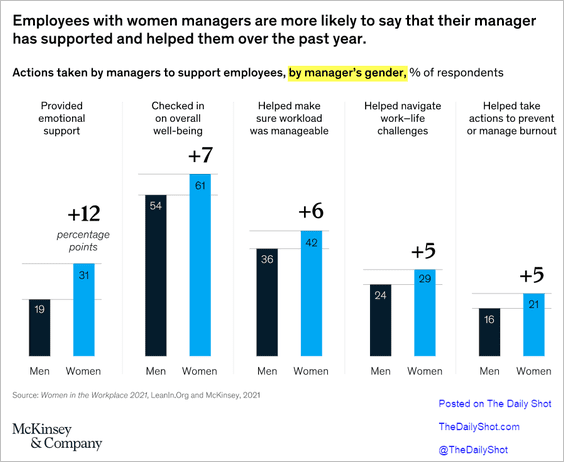 Source: McKinsey Read full article
6. Inflation rates experienced by Americans of different ethnicities and age groups:
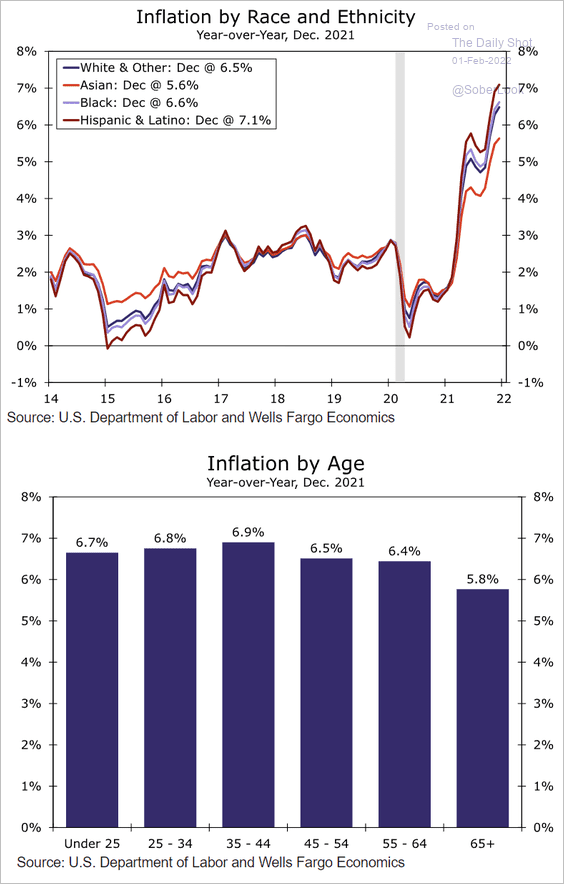 Source: Wells Fargo Securities
7. US corporate earnings as a share of GDP:
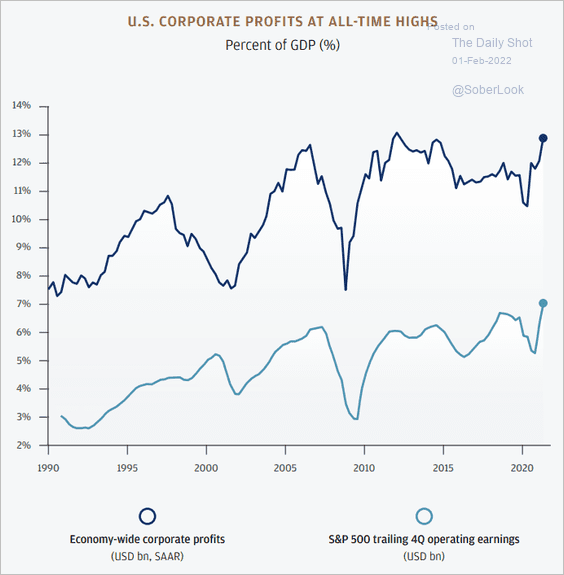 Source: JP Morgan Private Bank
8. Increasing concentrations in US industries:
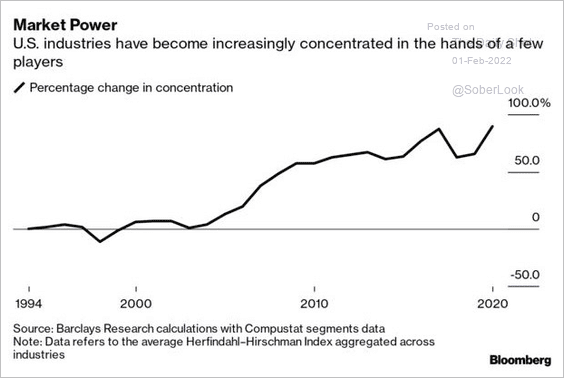 Source: @jessefelder, Bloomberg Read full article
9. Major new year’s celebrations around the world:
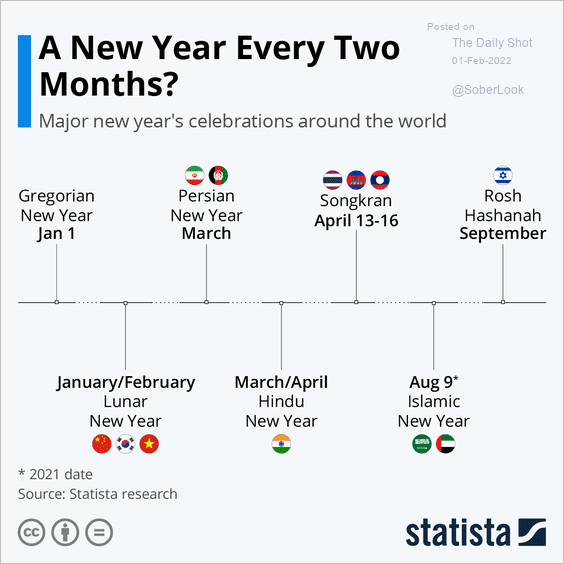 Source: Statista
Happy Lunar New Year!

——————–
Back to Index