
The Daily Shot: 08-Feb-22
• The United States
• The Eurozone
• Europe
• Asia – Pacific
• China
• Emerging Markets
• Cryptocurrency
• Energy
• Equities
• Credit
• Rates
• Global Developments
• Quant Compensation
• Food for Thought
The United States
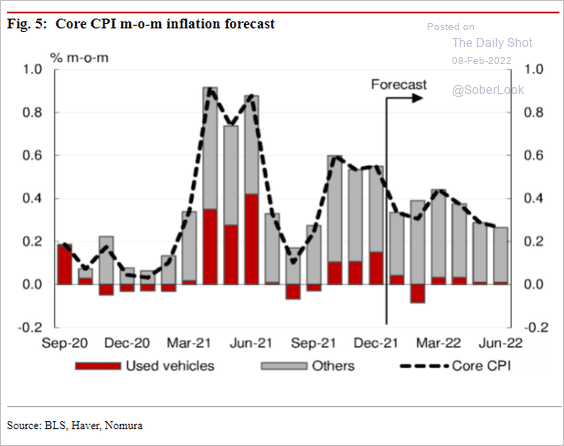
1. Let’s begin with some updates on inflation.
• Slower used car price gains point to a somewhat smaller core CPI increase in January, according to Nomura.
 Source: Nomura Securities
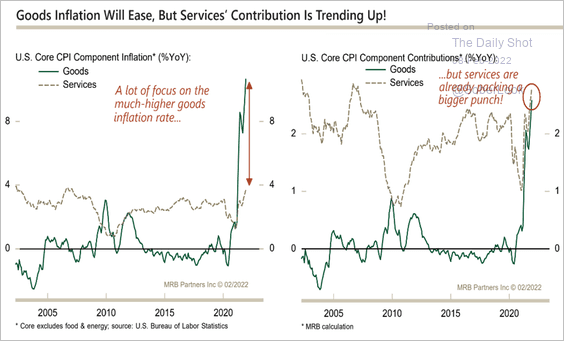
• Services are now taking the lead from goods for the next leg of price increases. Rent will be a key component of that trend (see chart).
 Source: MRB Partners
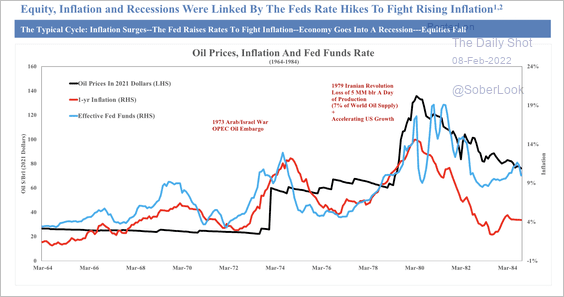
• Here is a look at the inflation/rate cycle during the 1960s-1980s.
 Source: SOM Macro Strategies
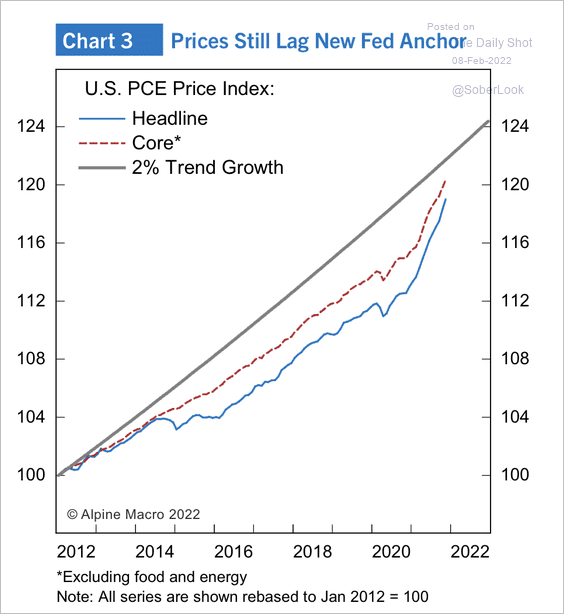
• The inflation surge has not made up for downside misses from the Fed’s 2% target since 2012.
 Source: Alpine Macro
• Real employment costs have declined sharply over the past year.
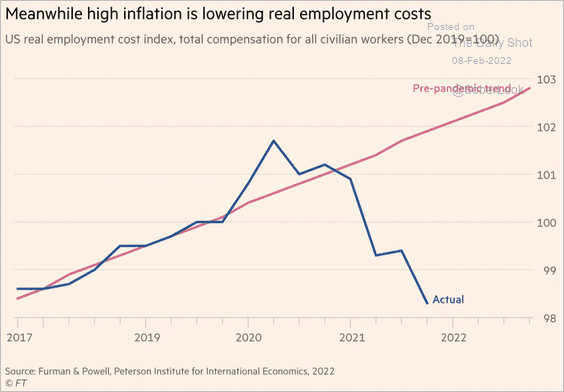 Source: @nomiprins, @FT Read full article
• According to Oxford Economics, supply chains remain stressed.
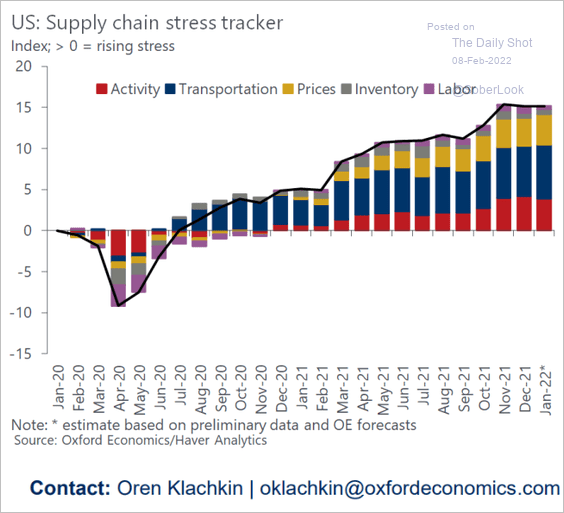 Source: Oxford Economics
——————–
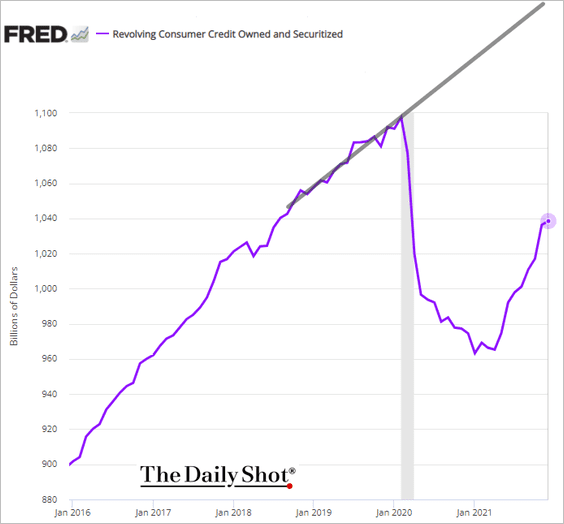
2. US credit card balances are holding below pre-COVID levels (and well under the trend).
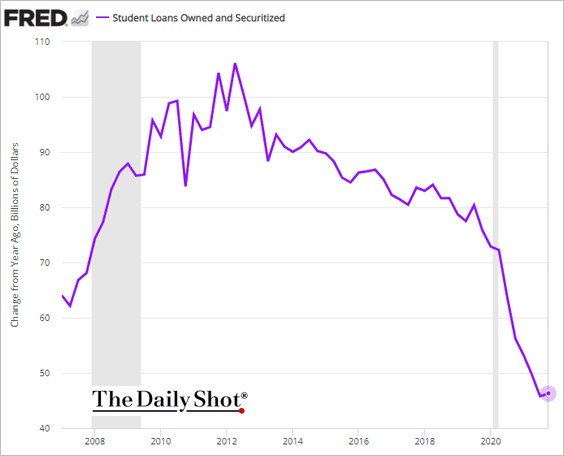
Has student debt growth bottomed?
——————–
3. Based on credit availability, the US is growing at about 1% above potential.
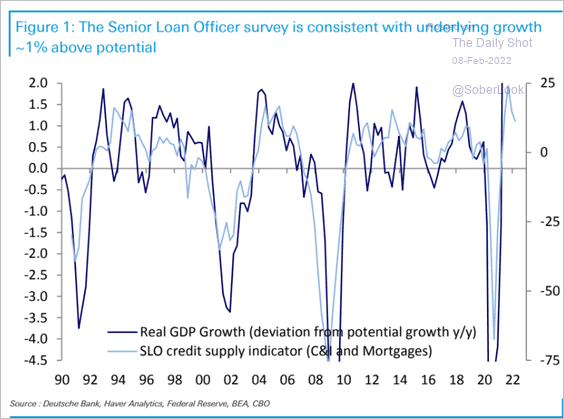 Source: Deutsche Bank Research
4. The Fed’s long-run policy forecast is disconnected from potential nominal GDP growth.
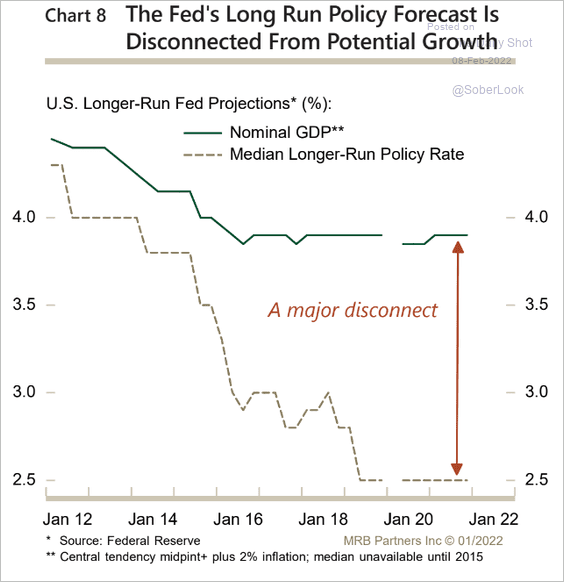 Source: MRB Partners
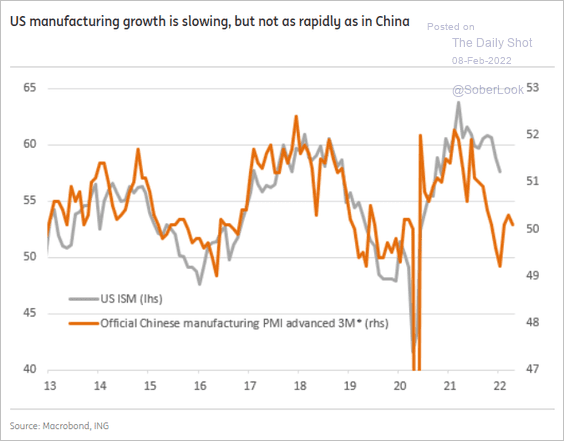
5. Several indicators point to slower growth in US manufacturing activity (ISM Manufacturing PMI) ahead.
• Global central banks’ policy changes:
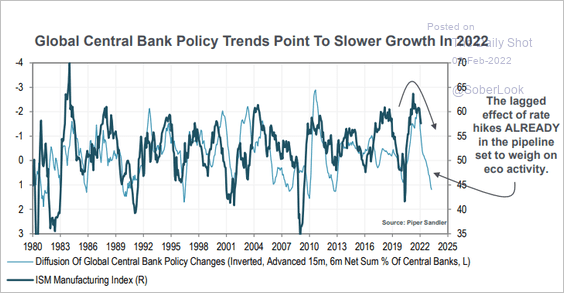 Source: Piper Sandler
• Weakness in China’s economy:
——————–
But inventory rebuilding should be a tailwind for manufacturing.
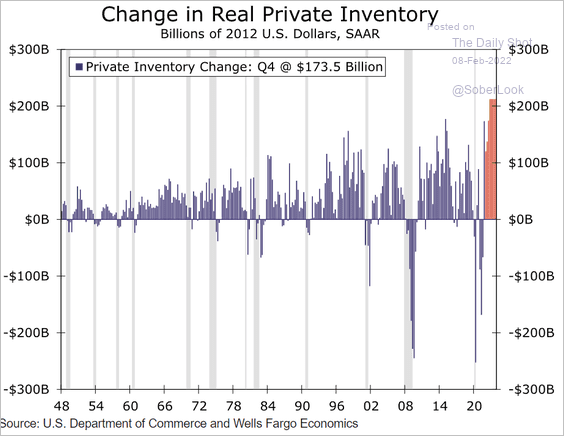 Source: Wells Fargo Securities
——————–
6. According to a survey from Fannie Mae, this is the worst time to buy a house in years (2 charts).
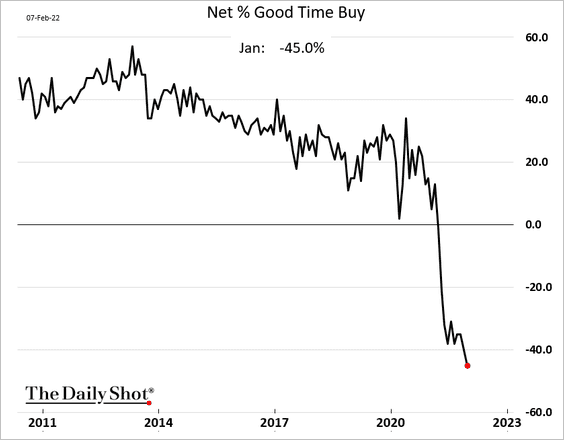
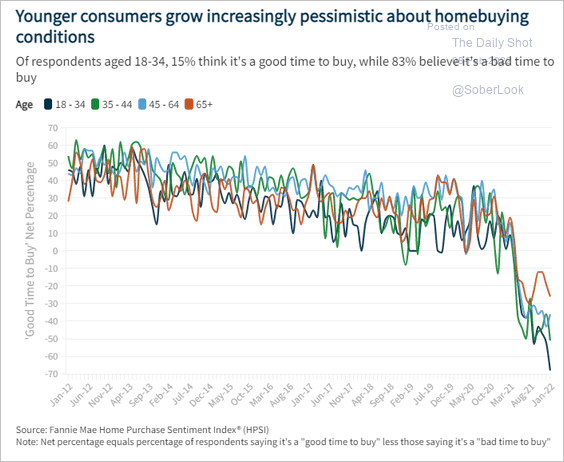 Source: Fannie Mae
And yet, demand remains unusually strong, sending housing inventories to multi-year lows.
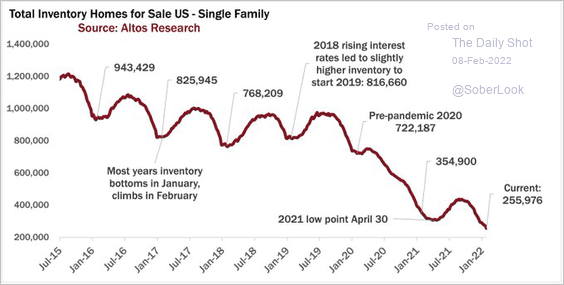 Source: @mikesimonsen, @altosresearch
——————–
7. BofA sees seven 25 bps Fed rate hikes this year (well above market expectations).
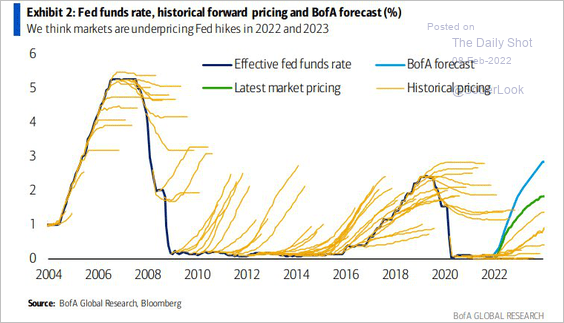 Source: BofA Global Research; @EffMktHype
Barclays estimates the fed funds rate to be at 1.7% by the end of 2023 (a much less aggressive forecast than BofA).
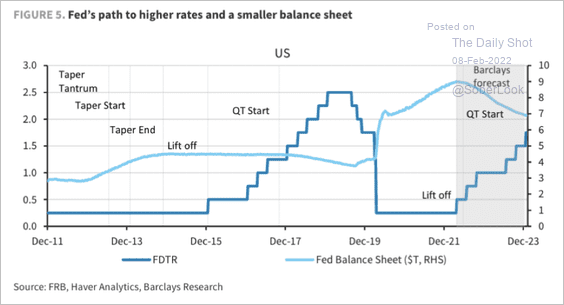 Source: Barclays Research
Back to Index
The Eurozone
1. Will the ECB follow the markets’ new rate trajectory? (2 charts)
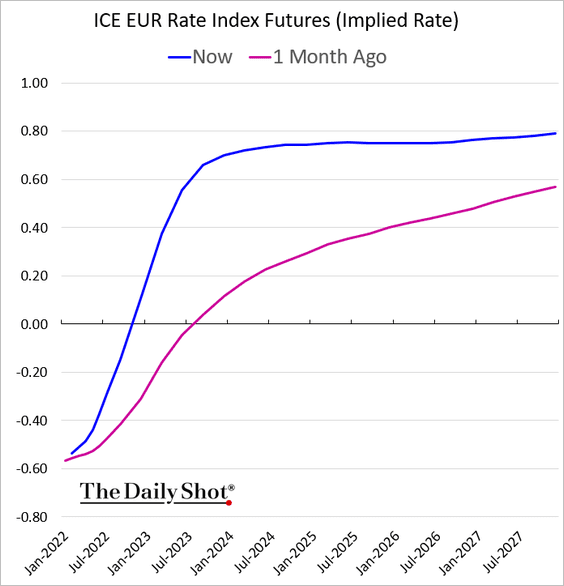
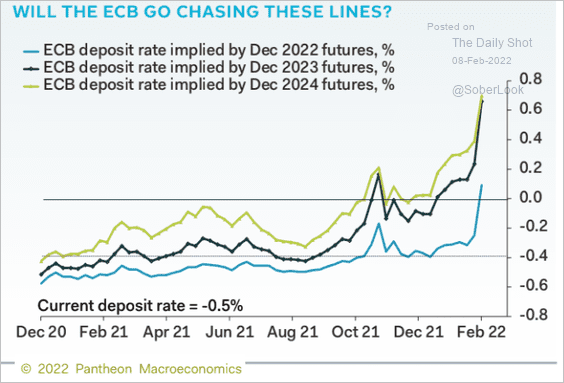 Source: Pantheon Macroeconomics
——————–
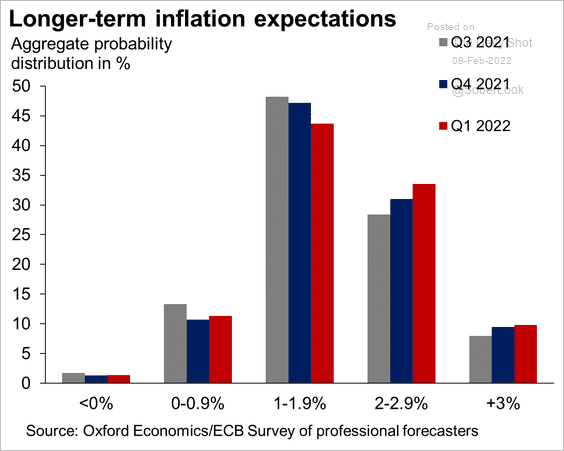
2. Longer-term inflation expectations continue to climb.
 Source: @atalaveraEcon
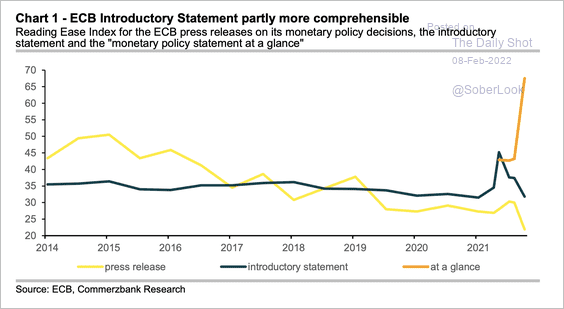
3. The ECB has made an effort to make its releases more comprehensible.
 Source: Commerzbank Research
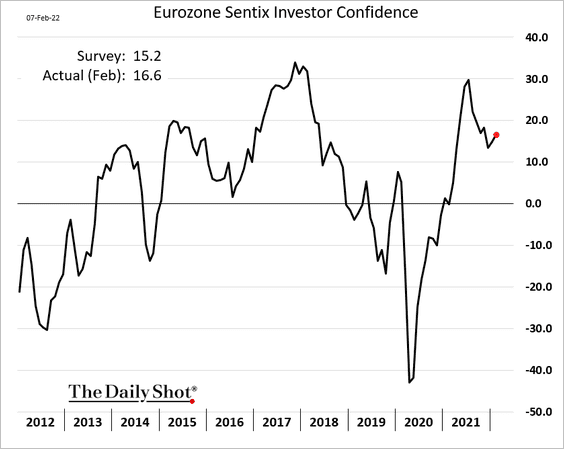
4. The Sentix investor confidence index surprised to the upside this month.
5. The labor market remains tight.
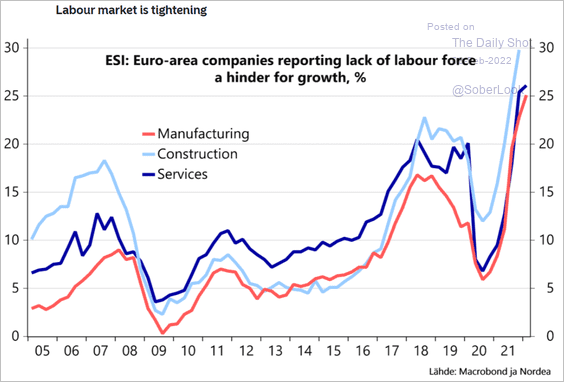 Source: Nordea Markets
• What will happen to inflation and wages as the unemployment rate falls further?
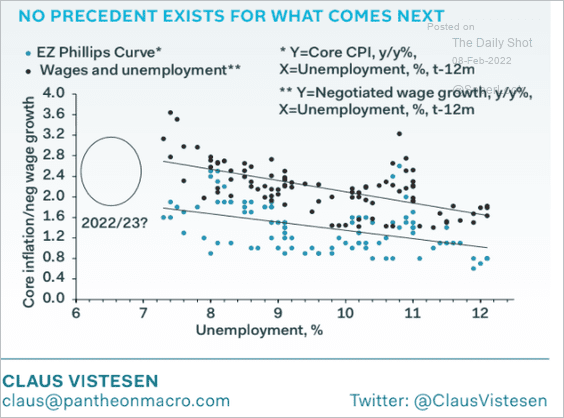 Source: Pantheon Macroeconomics
• The minimum wage in Germany will surge this year.
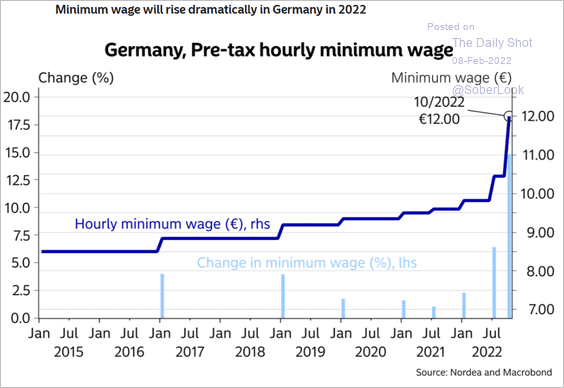 Source: Nordea Markets
——————–
6. European household spending expectations have perked up into the end of 2021, a positive sign for 2022 consumer demand.
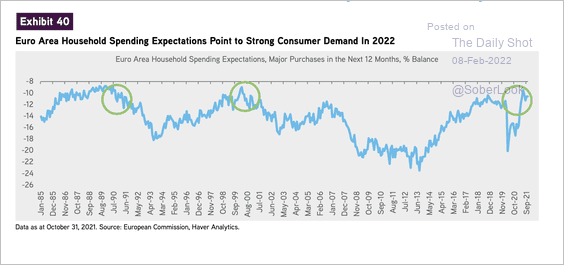 Source: KKR
7. Finally, we have the latest political polls from Italy.
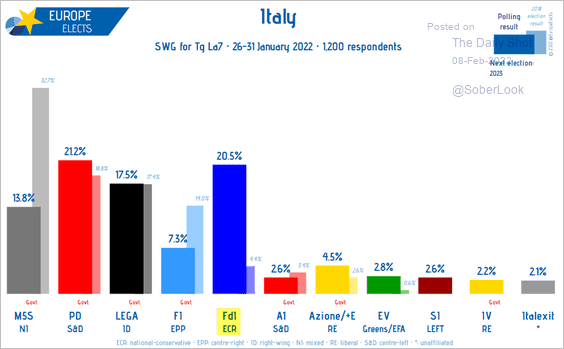 Source: @EuropeElects
Back to Index
Europe
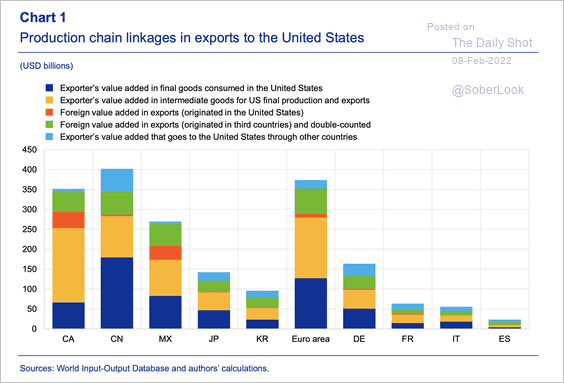
1. Only 1/3 of goods exported from the EU to the US are consumed there. The rest are intermediate goods which are then used to produce final goods for consumption or export to other countries.
 Source: ECB
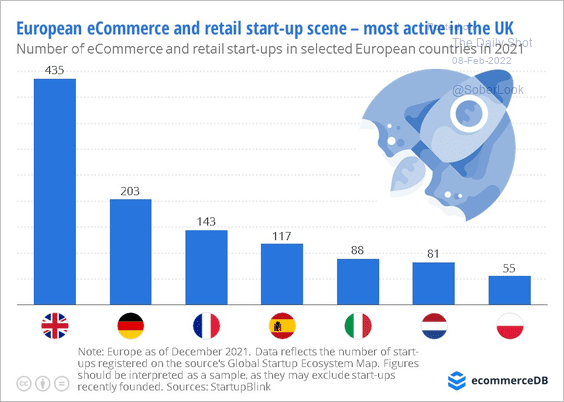
2. Here is the e-commerce/retail start-up scene in Europe.
 Source: EcommerceDB
Back to Index
Asia – Pacific
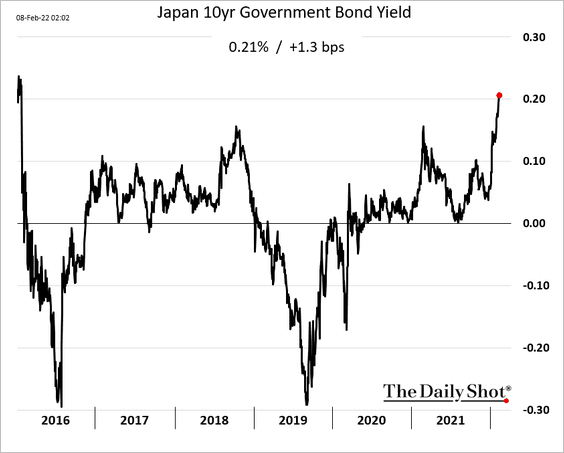
1. The 10yr JGB yield is above 20 bps for the first time since 2016. Will the BoJ act? There is some speculation that the central bank will shift its yield-curve-control target to the 5yr note (from the 10yr). These rumors have been boosting JGB yields.
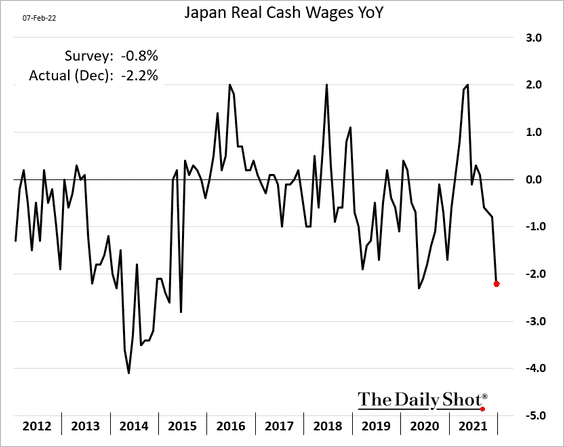
Separately, Japan’s real cash wages slumped at the end of 2021.
——————–
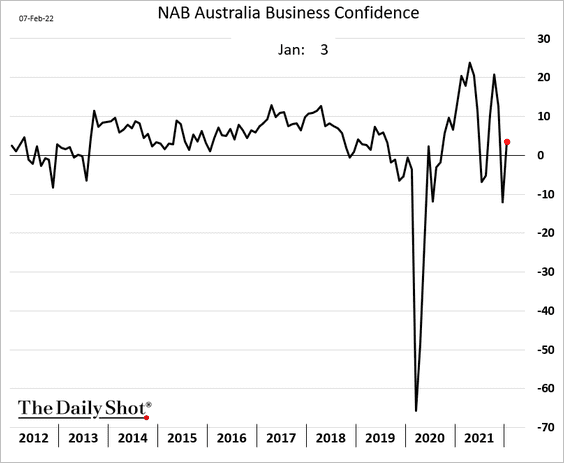
2. Australia’s business confidence rebounded in January.
Back to Index
China
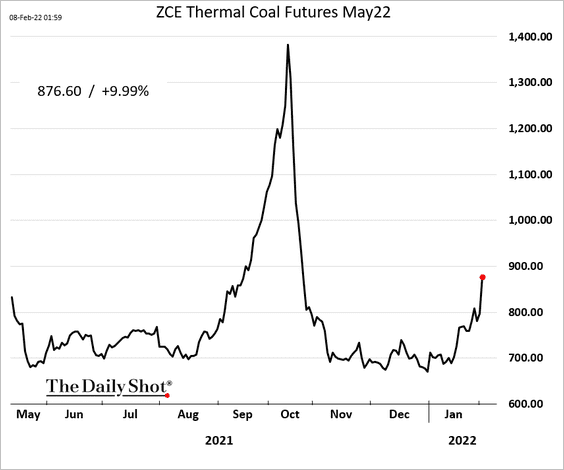
1. Thermal coal prices are surging again.
2. The slowdown in economic growth has weighed on stock market performance over the past year.
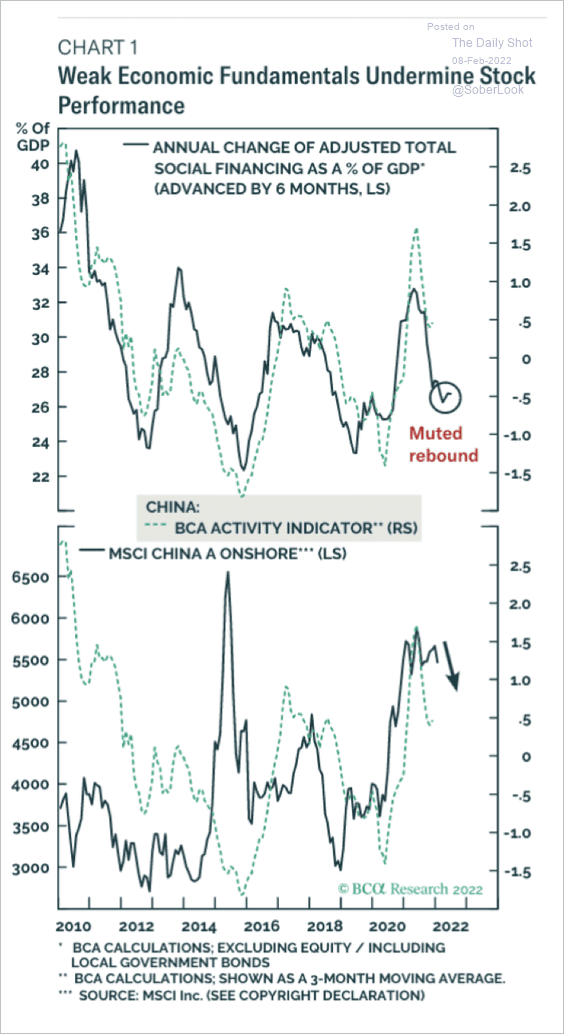 Source: BCA Research
Capital Economics expects economic activity to rise over the next few years, albeit below its pre-pandemic trend.
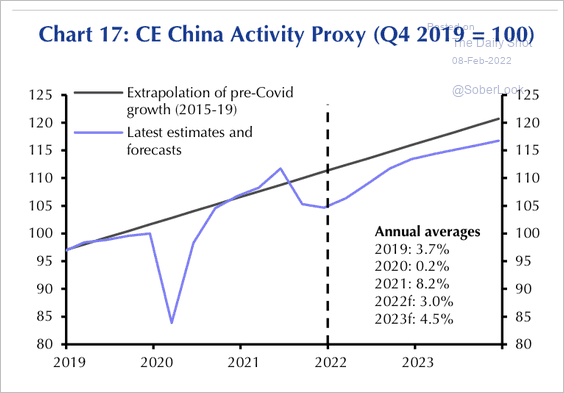 Source: Capital Economics
——————–
3. Auto supply is starting to recover, while steel remains weak.
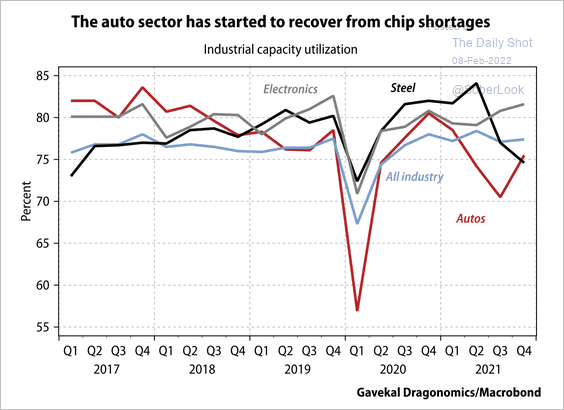 Source: Gavekal Research
4. Corporate bonds with shorter tenors became more favored as wealth managers reduced their portfolios’ duration to mitigate volatility.
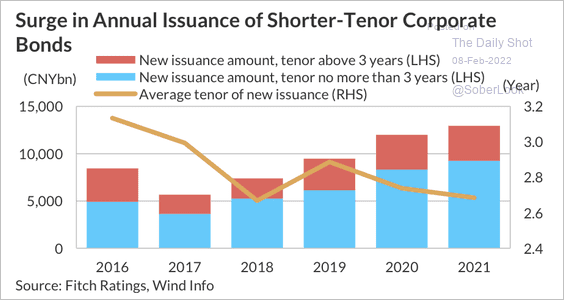 Source: Fitch Ratings
Onshore bond defaults have declined, while offshore defaults have risen over the past year. That’s partly due to the property developers’ credit crisis (2 charts).
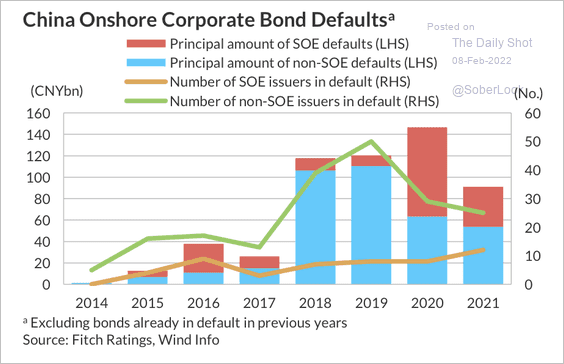 Source: Fitch Ratings
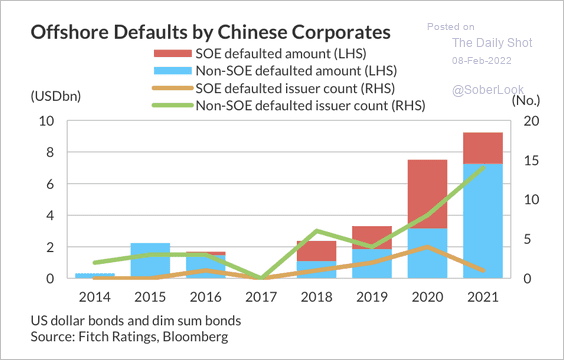 Source: Fitch Ratings
Back to Index
Emerging Markets
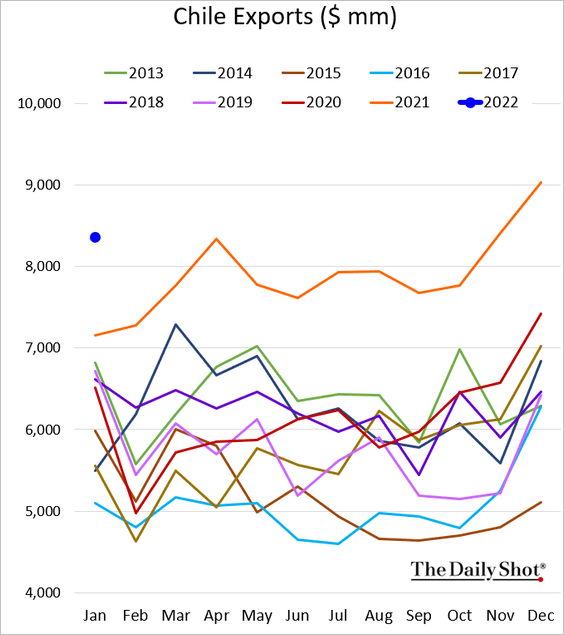
1. Chile’s exports have been very strong.
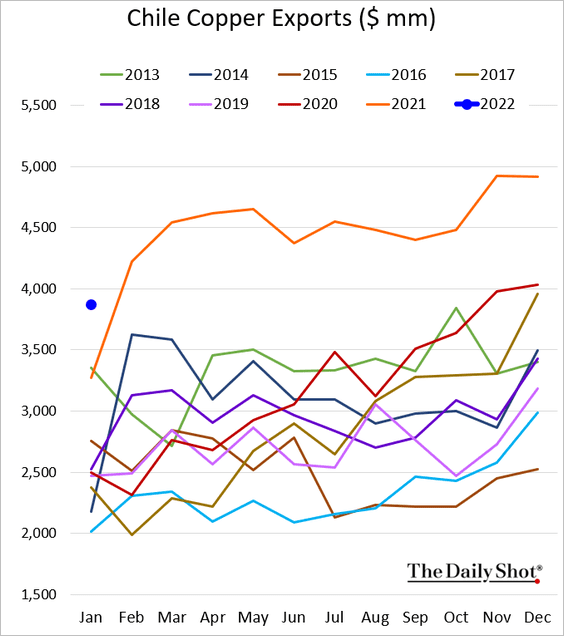
This chart shows copper exports (in dollar terms).
——————–
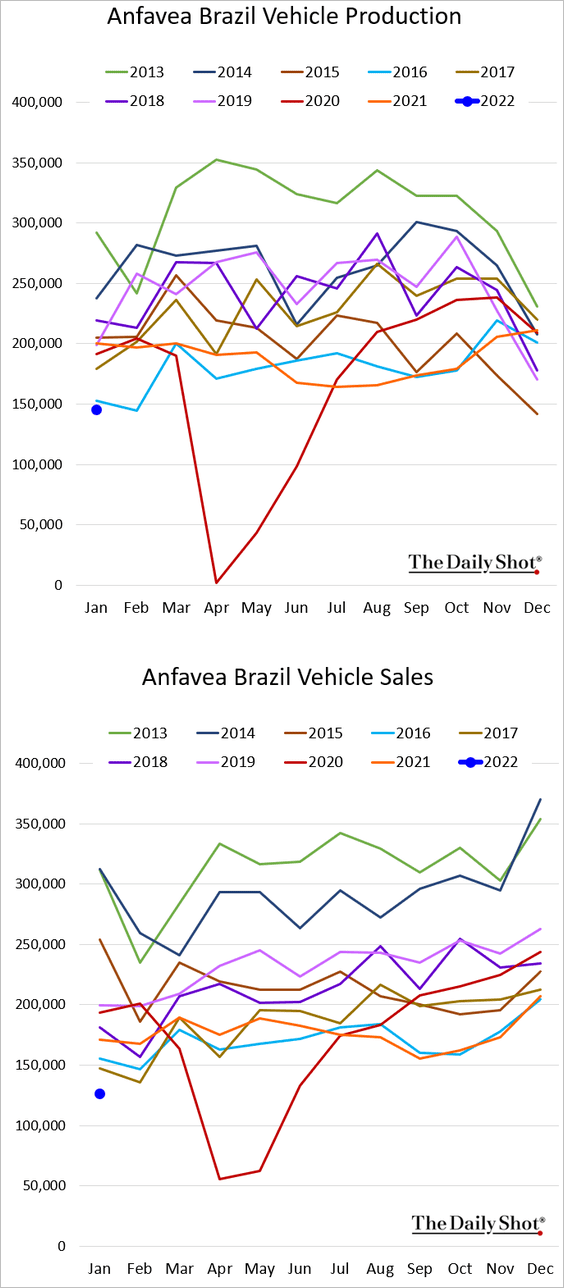
2. Brazil’s vehicle production and sales remain depressed.
3. Which LatAm countries have issued the most green bonds?
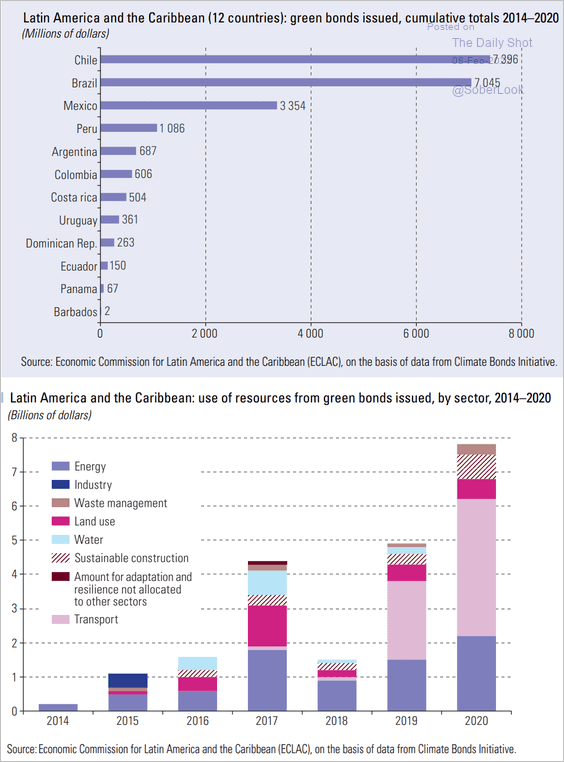 Source: ECLAC Read full article
4. Turkey’s consumer confidence has diverged from business sentiment.
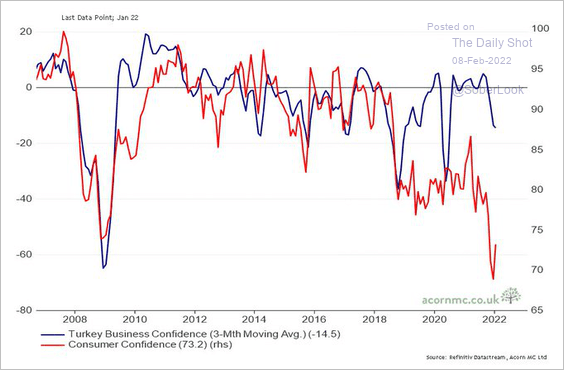 Source: @RichardDias_CFA
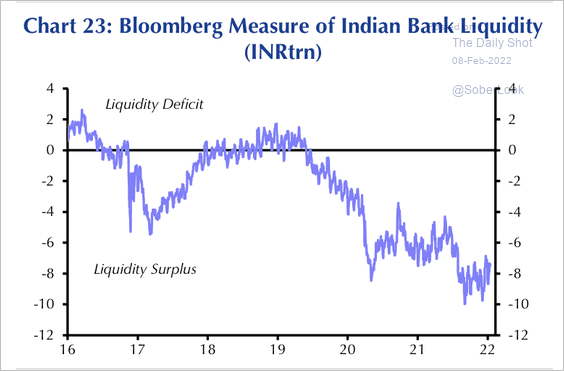
5. India is experiencing a liquidity surplus. …
 Source: Capital Economics
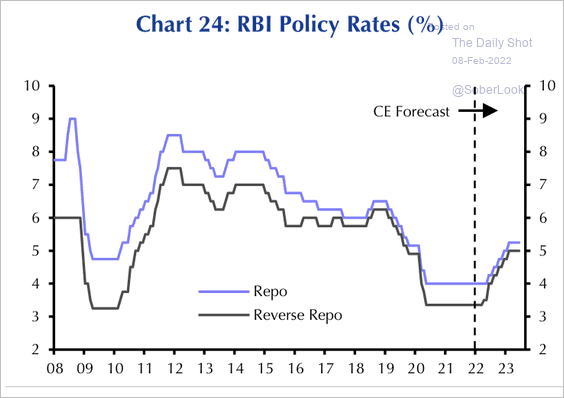
… Will higher rates tighten liquidity?
 Source: Capital Economics
• Indian stocks, especially in the staples sector, appear expensive versus the MSCI EM index.
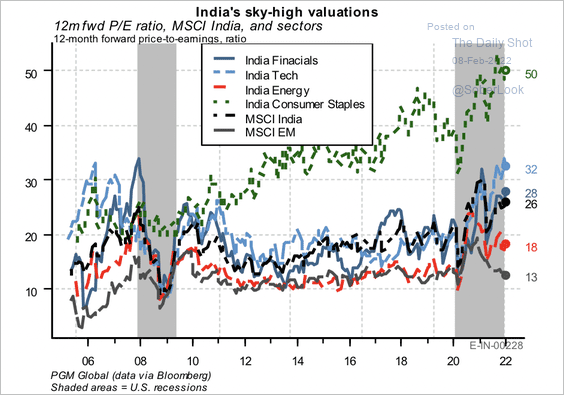 Source: PGM Global
——————–
6. EM growth is expected to outpace advanced economies.
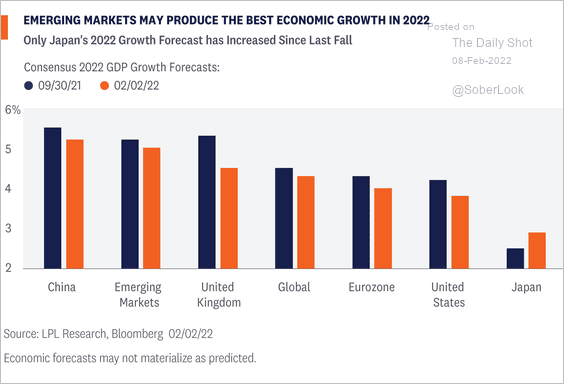 Source: LPL Research
Back to Index
Cryptocurrency
1. Bitcoin is testing the next resistance level at the upper Bollinger Band.
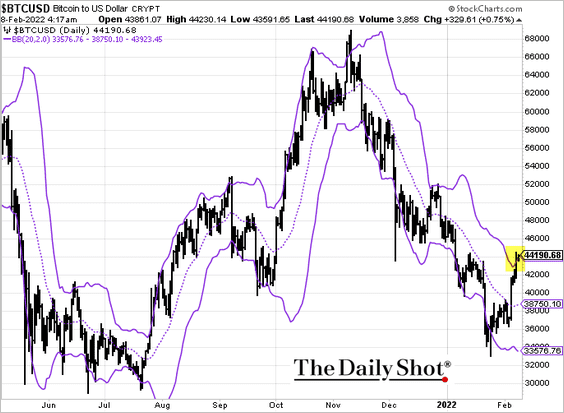 Source: barchart.com, h/t @AkshayChinchal4
2. Bitcoin’s average funding rate, or the cost of holding long positions in the perpetual futures market, remains low despite the recent price rally. That could reflect low conviction, or perhaps some traders remain on the sidelines, scarred by liquidations in the prior sell-off.
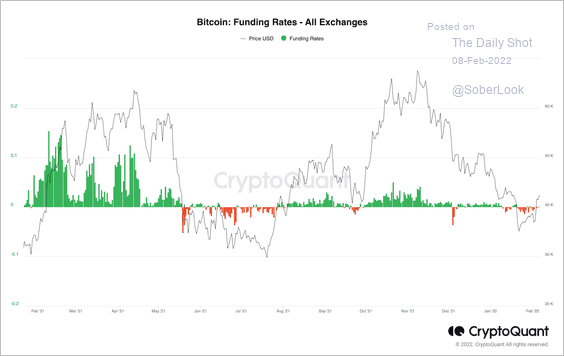 Source: CryptoQuant Read full article
3. Crypto funds saw inflows of $85 million last week. It was the third straight week of net inflows, reflecting improving sentiment among investors.
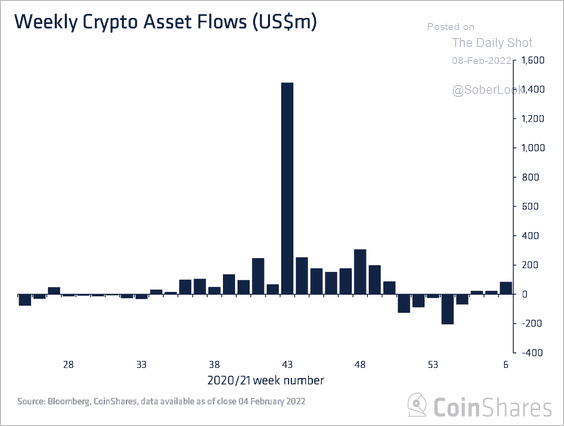 Source: CoinShares Read full article
Bitcoin-focused funds accounted for a majority of fund inflows last week, while Ethereum-focused funds continued to see outflows.
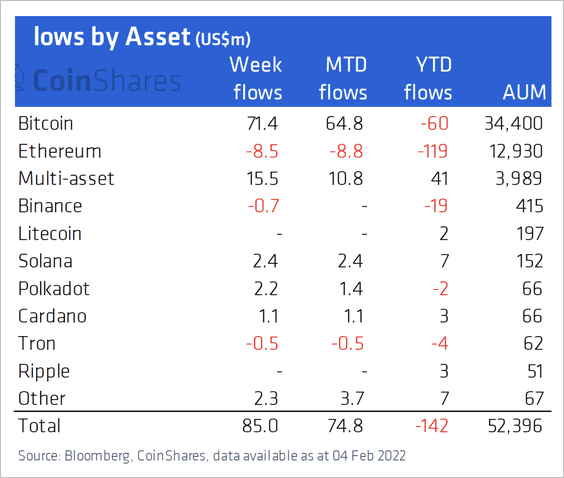 Source: CoinShares Read full article
Back to Index
Energy
1. Let’s start with the EIA’s liquids production forecast.
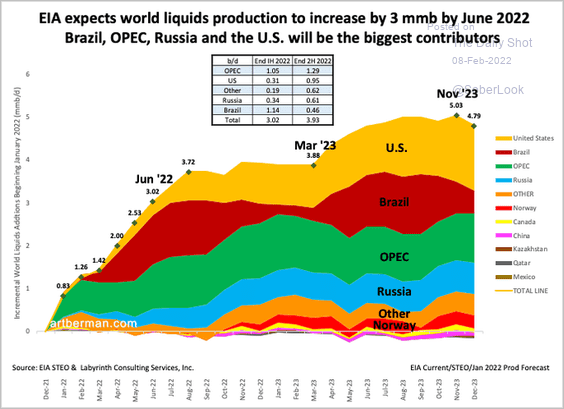 Source: @aeberman12
2. Energy companies have been conservative with capital spending despite the revenue windfall from higher oil prices.
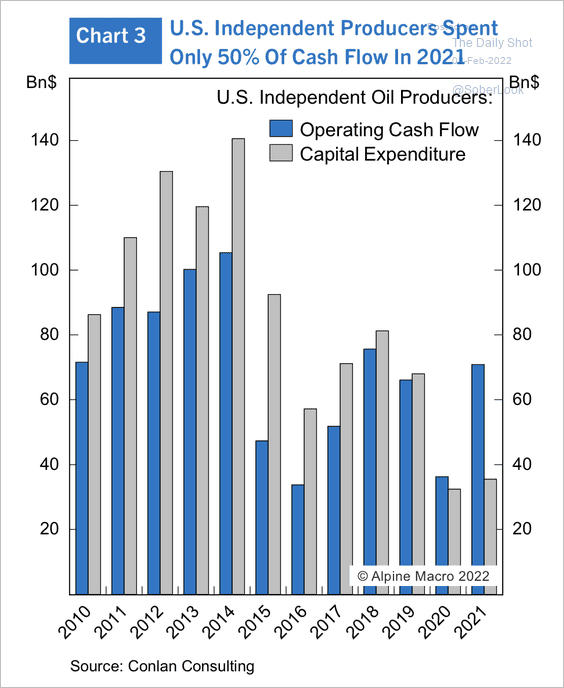 Source: Alpine Macro
3. This chart shows US electricity capacity additions in 2021.
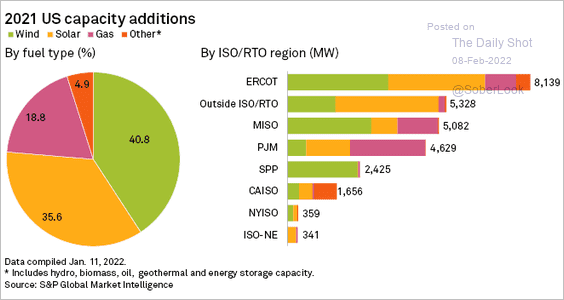 Source: @SPGMarketIntel Read full article
4. Next, we have some updates on Europe’s energy crisis.
• Energy import dependency rate:
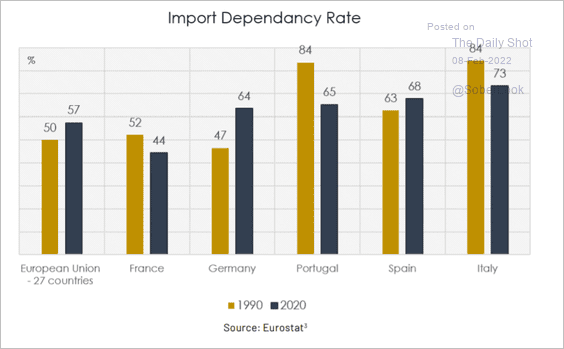 Source: Algebris Investments Read full article
• Vulnerability to a Russian energy embargo:
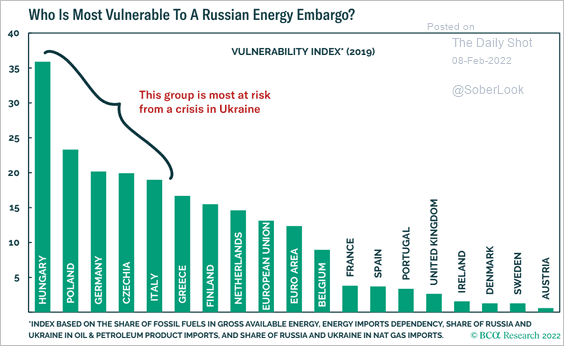 Source: BCA Research
• LNG imports (2 charts):
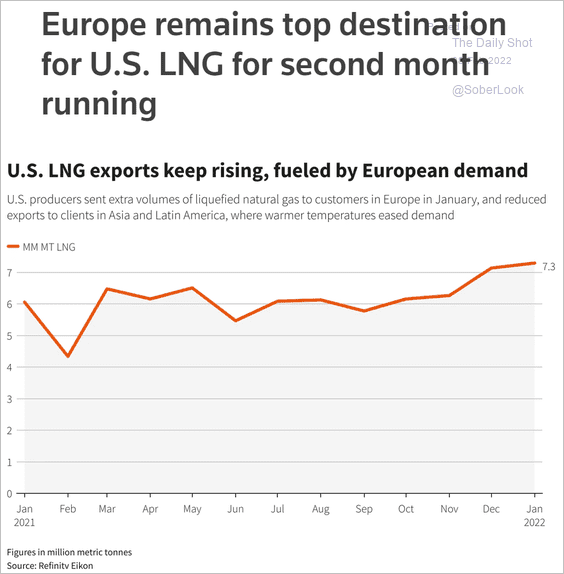 Source: Reuters Read full article
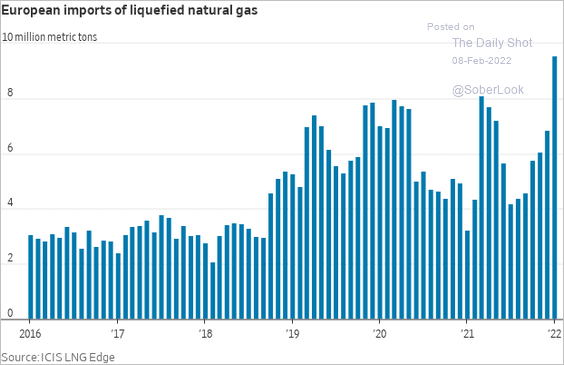 Source: @WSJ Read full article
• Natural gas imports by source:
 Source: @WSJ Read full article
• Estimated natural gas and electricity retail prices (2 charts):
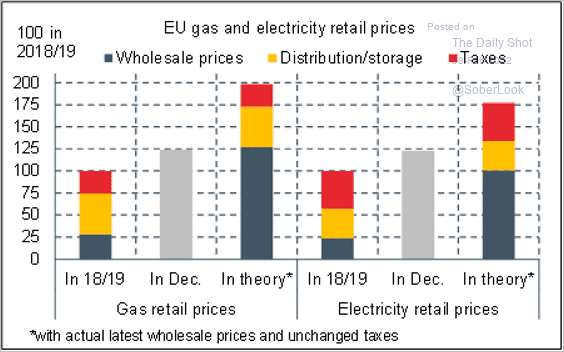 Source: @FabienBossy
 Source: @FabienBossy
• Hit to GDP from doubling energy prices:
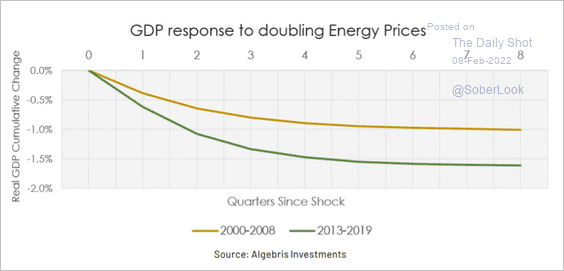 Source: Algebris Investments Read full article
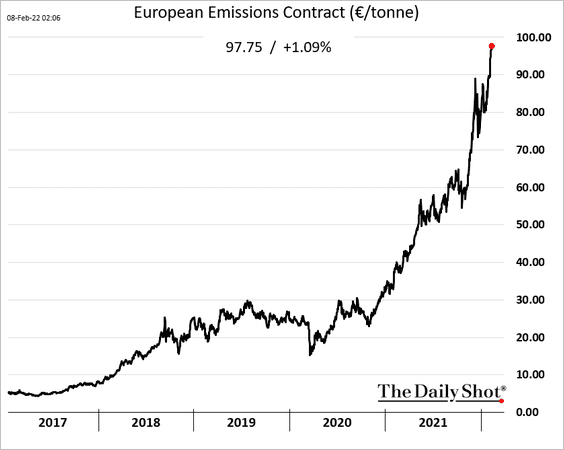
• Emissions contract price (companies burning more coal have to buy these to offset their CO2 emissions):
Back to Index
Equities
1. Overall, Q4 earnings results have been strong.
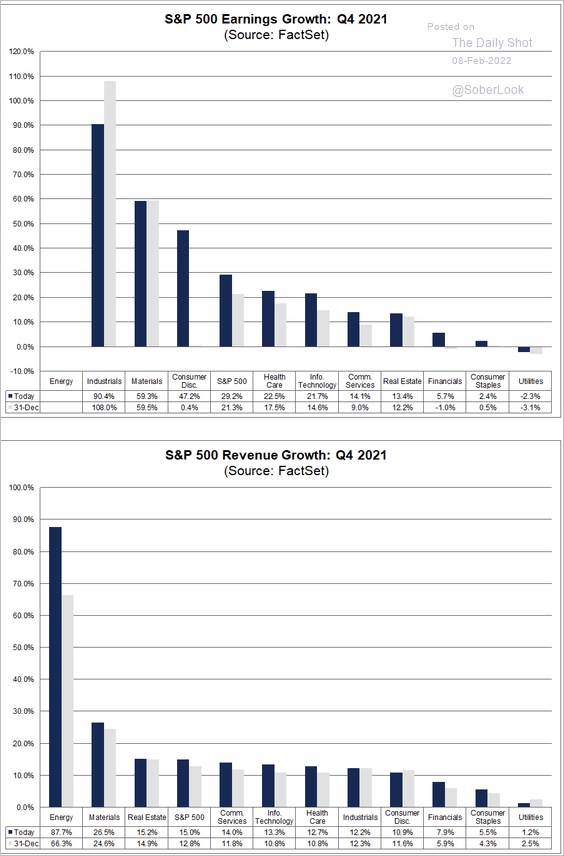 Source: @FactSet Read full article
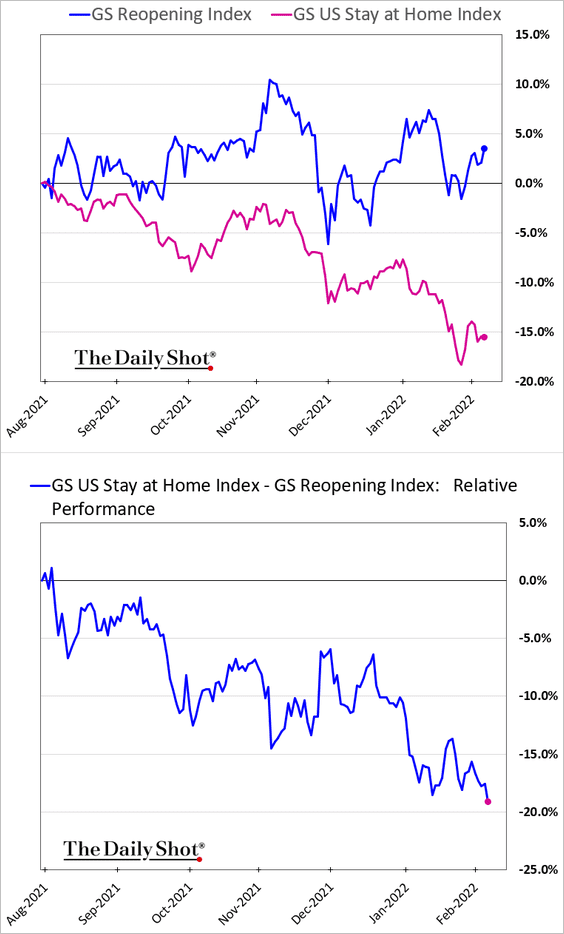
2. Stay-at-home stocks have widened their underperformance.
3. The recent sell-off resulted in many stocks moving away from overbought territory.
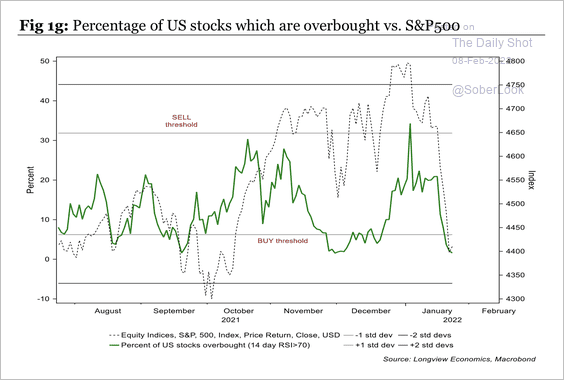 Source: Longview Economics
4. It’s been a rough start of the year for momentum stocks.
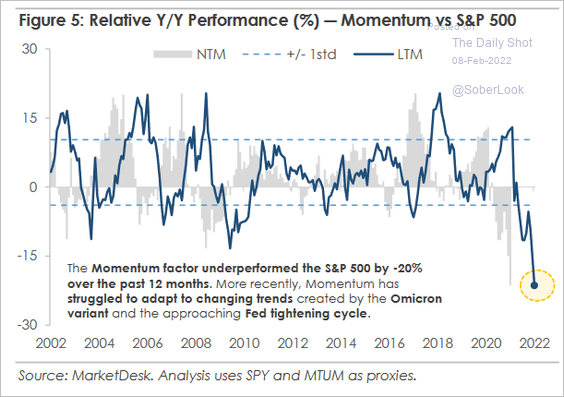 Source: MarketDesk Research
5. Equity markets with the highest valuations have underperformed this year.
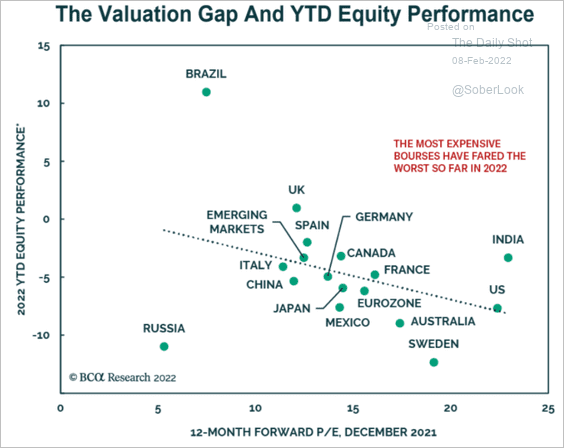 Source: BCA Research
6. Here is the risk/reward profile across US sectors from Numera Analytics.
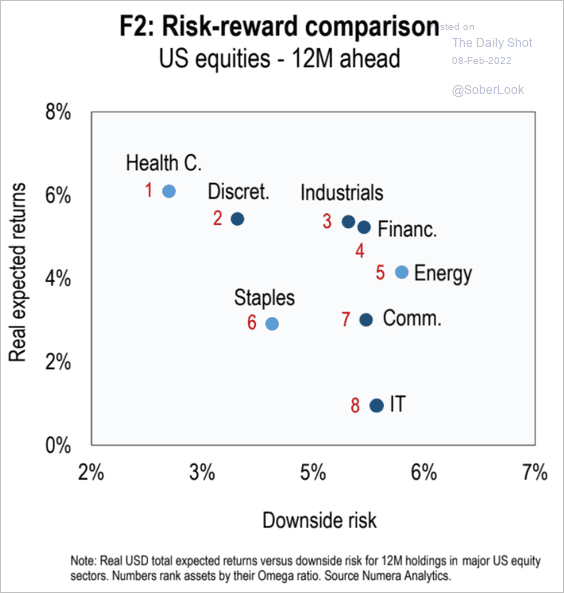 Source: Numera Analytics
7. This chart shows revenue by industry against its pre-covid level.
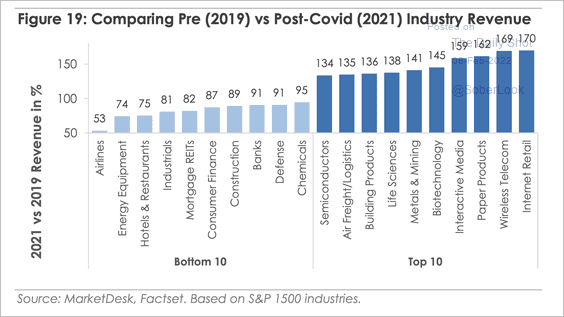 Source: MarketDesk Research
Back to Index
Credit
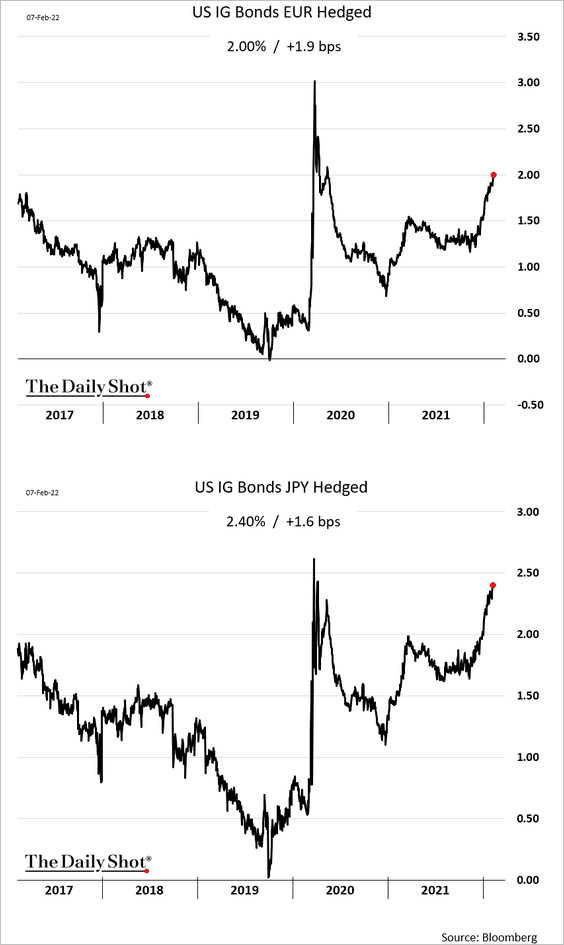
1. US investment-grade bonds look attractive when hedged into euros or yen.
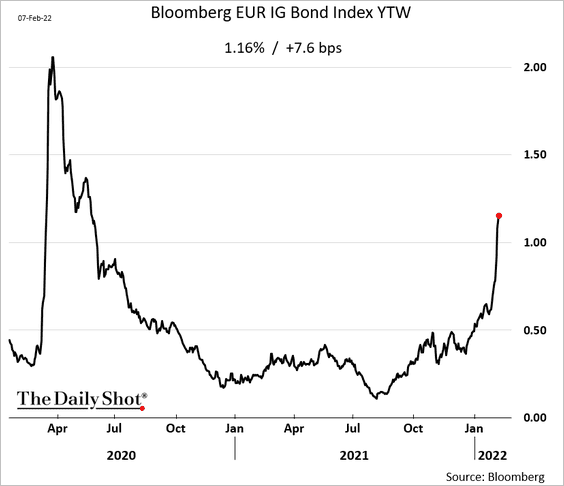
2. European corporate borrowing costs are surging.
Back to Index
Rates
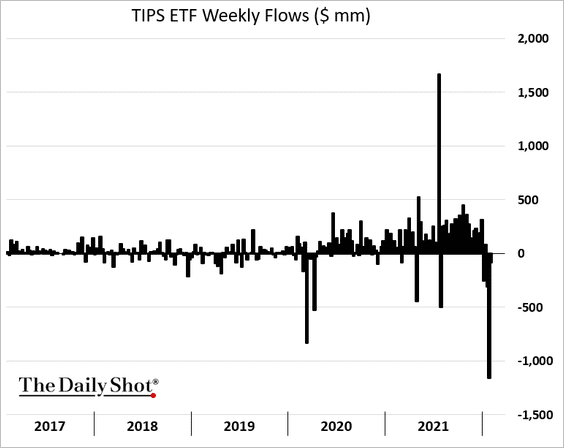
1. US real yields continue to climb, …
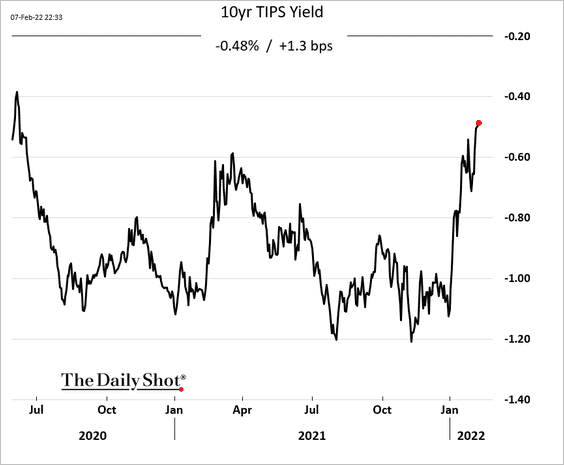
… as TIPS funds experience significant outflows. This trend presents a headwind for growth equities.
——————–
2. Investors haven’t been this gloomy on Treasuries since 2017.
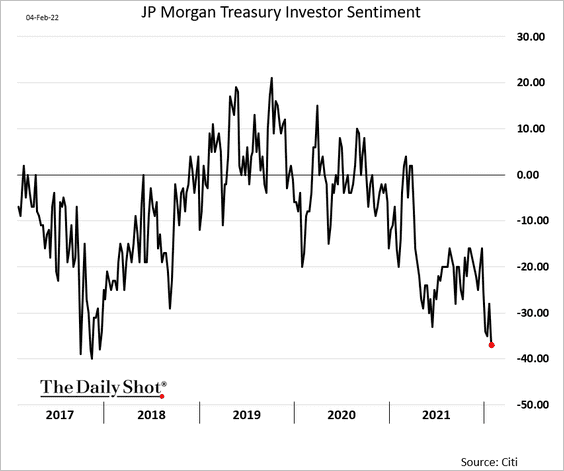
Bearish sentiment toward Treasuries is near an extreme.
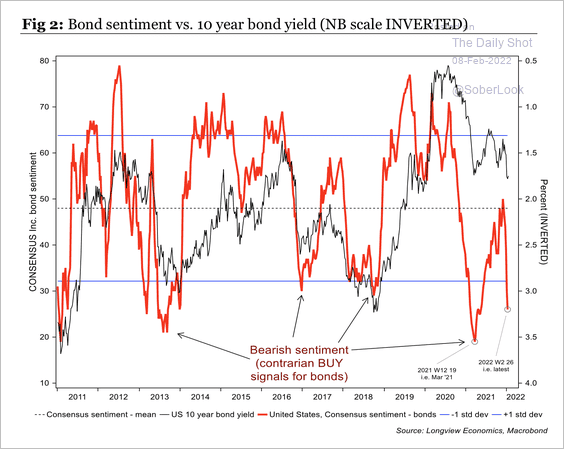 Source: Longview Economics
Back to Index
Global Developments
1. Speculative long positioning in the dollar appears stretched. However, based on Treasury note futures positioning, the dollar could have further room to run.
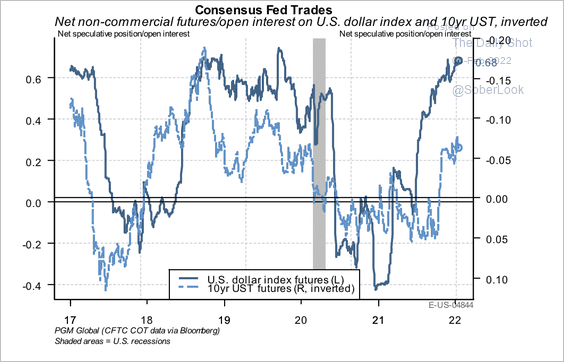 Source: PGM Global
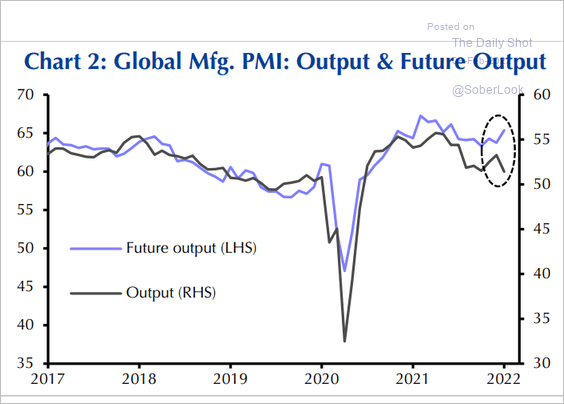
2. Next, we have a summary of manufacturing PMIs (business activity).
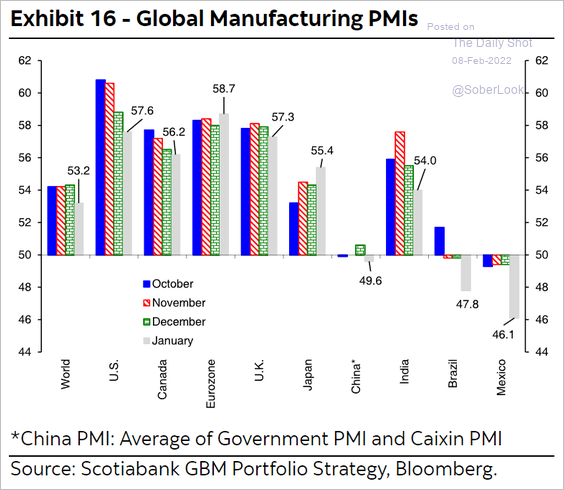 Source: Hugo Ste-Marie, Portfolio & Quantitative Strategy Global Equity Research, Scotia Capital
Factories have been more upbeat about future growth (2 charts).
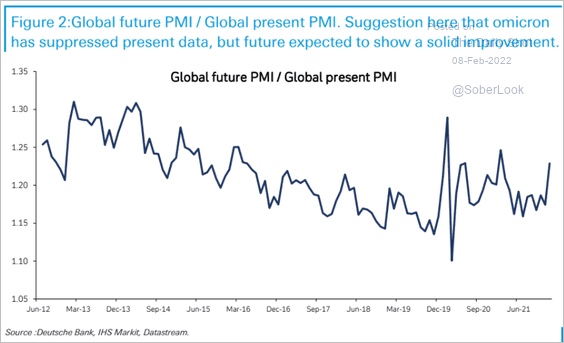 Source: Deutsche Bank Research
 Source: Capital Economics
——————–
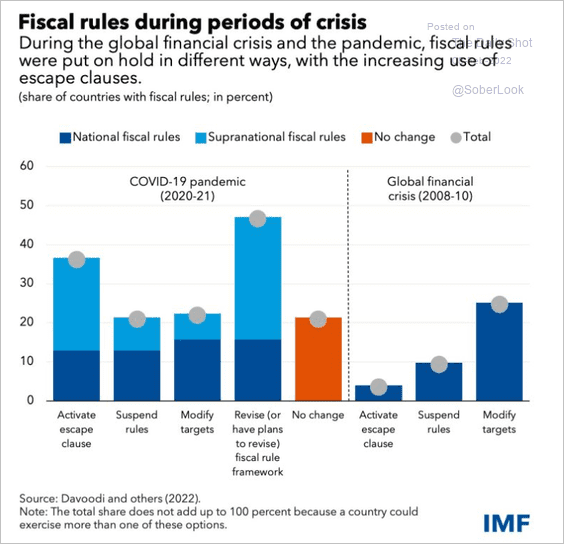
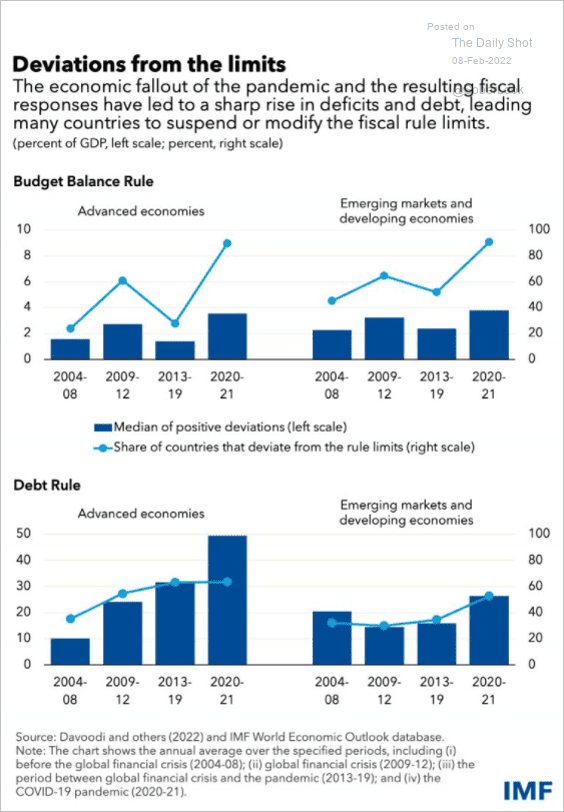
3. Many fiscal rules were suspended during the pandemic.
 Source: IMF Read full article
 Source: IMF Read full article
Back to Index
Quant Compensation
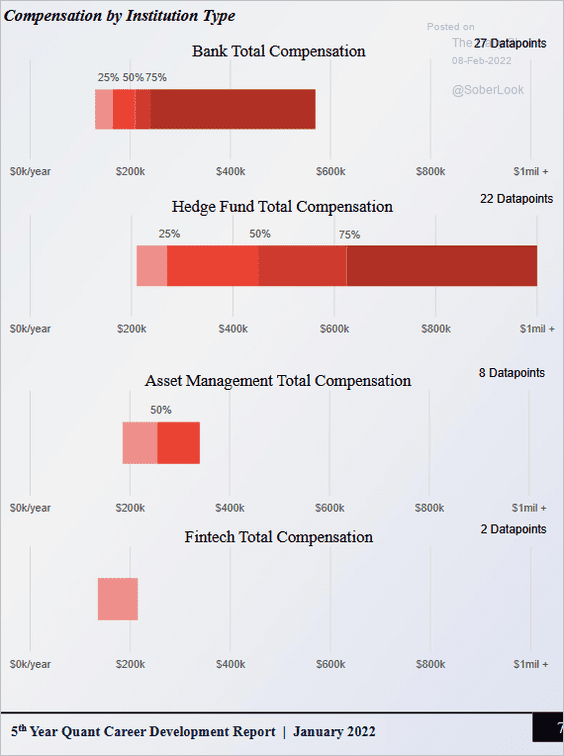
How much do Wall Street quants get paid? Here are the results from Baruch MFE’s latest alumni survey.
• By institution type:
 Source: Baruch MFE
• By role:
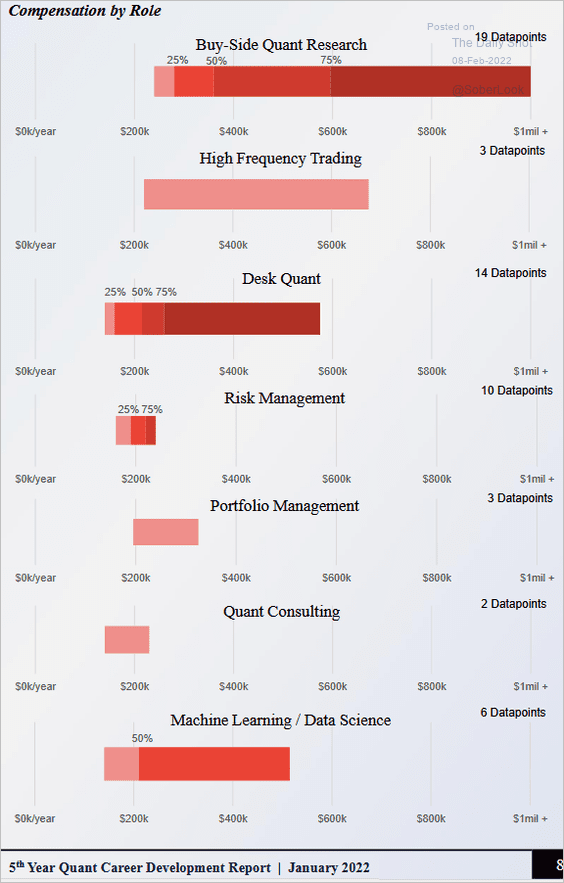 Source: Baruch MFE
——————–
Food for Thought
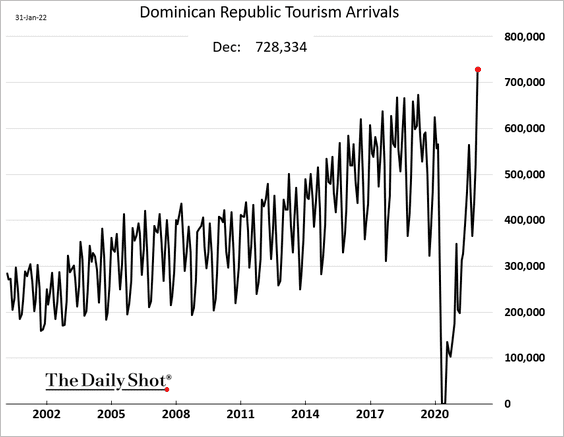
1. Dominican Republic tourism arrivals:
2. Miles driven by vehicle type:
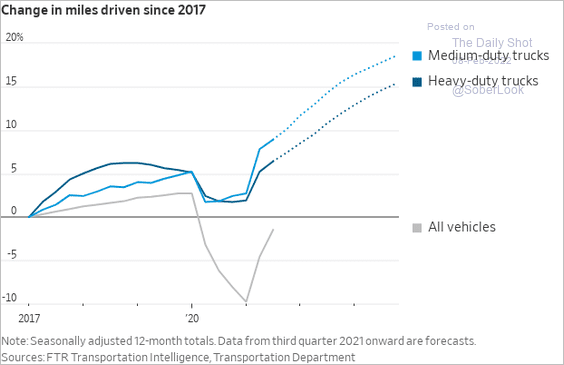 Source: @WSJ Read full article
3. Vehicle production and domestic demand:
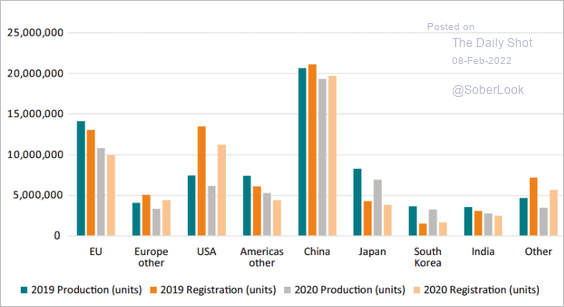 Source: ECIPE Read full article
4. Home price appreciation by city:
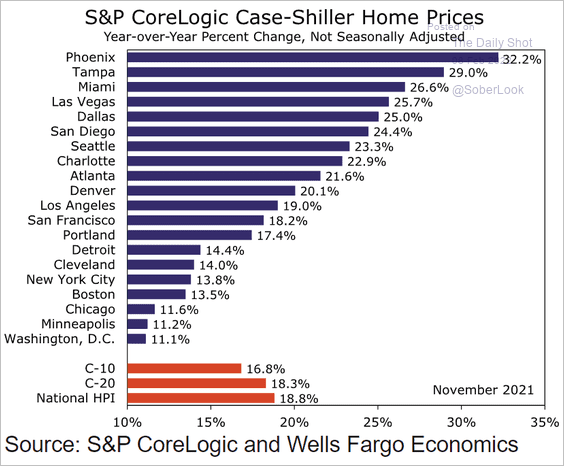 Source: Wells Fargo Securities
5. US birth rates by mother’s birth cohort:
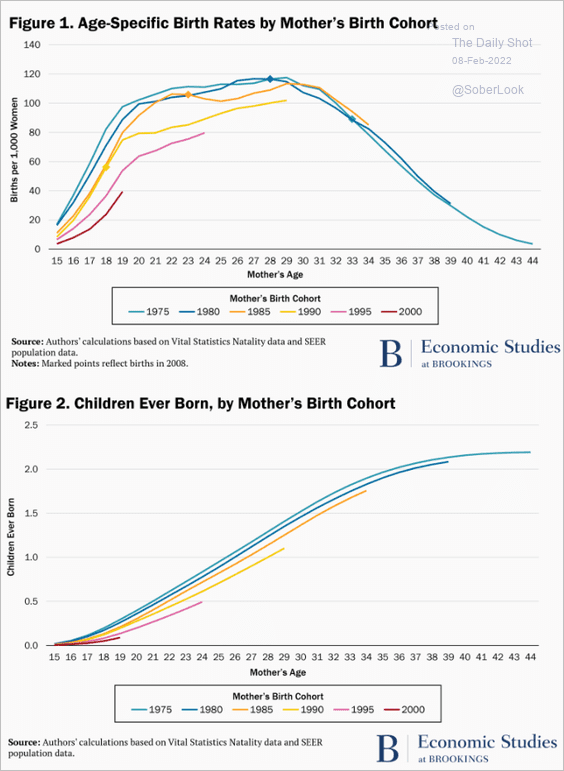 Source: Brookings Read full article
6. Cash balances as a percent of consumer credit by education cohort:
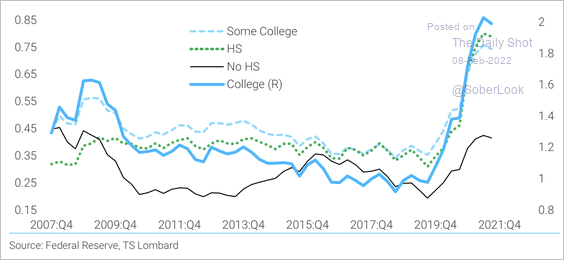 Source: TS Lombard
7. US military aid in 2020:
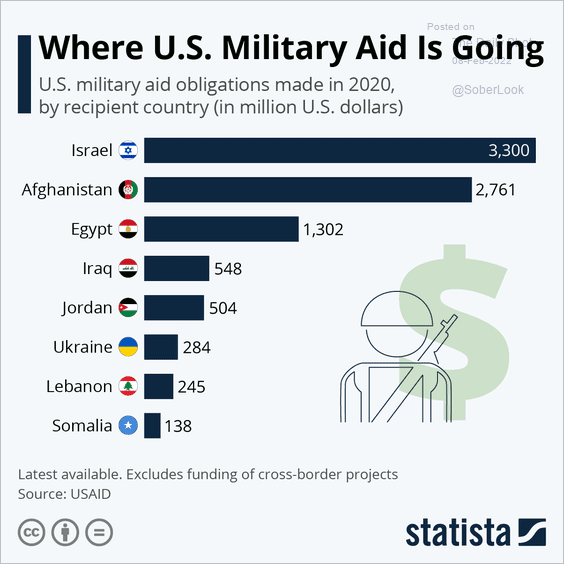 Source: Statista
8. Global surface temperature:
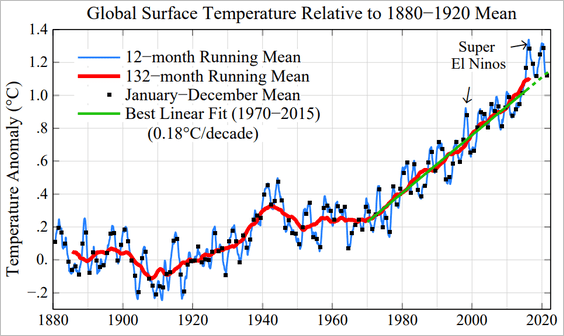 Source: Columbia University Read full article
9. Winter Olympics medal count (1924-2018):
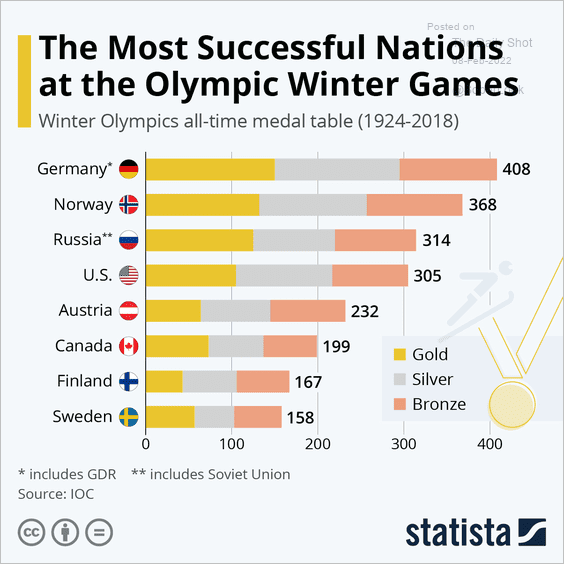 Source: Statista
10. Most frequent letters in Wordle vs. the English language:
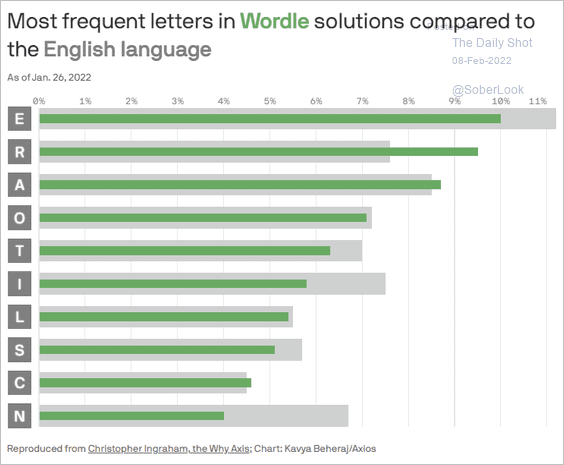 Source: @axios Read full article
——————–
Back to Index