
The Daily Shot: 25-Feb-22
• Equities
• Rates
• Energy
• Commodities
• Cryptocurrency
• Emerging Markets
• China
• Asia – Pacific
• Japan
• Europe
• The United Kingdom
• Canada
• The United States
• Global Developments
• Food for Thought
Equities
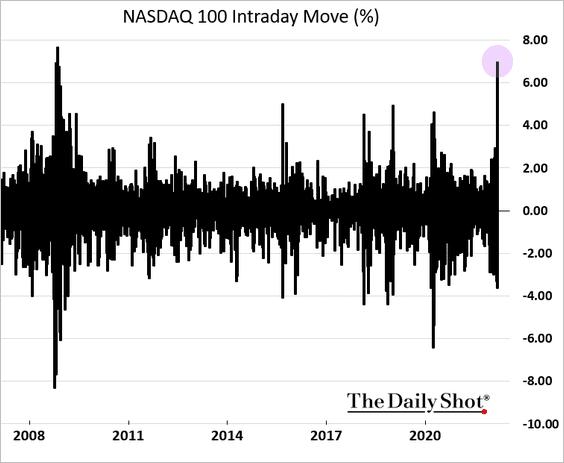
1. Stocks staged a spectacular rebound but futures are heavy again this morning.
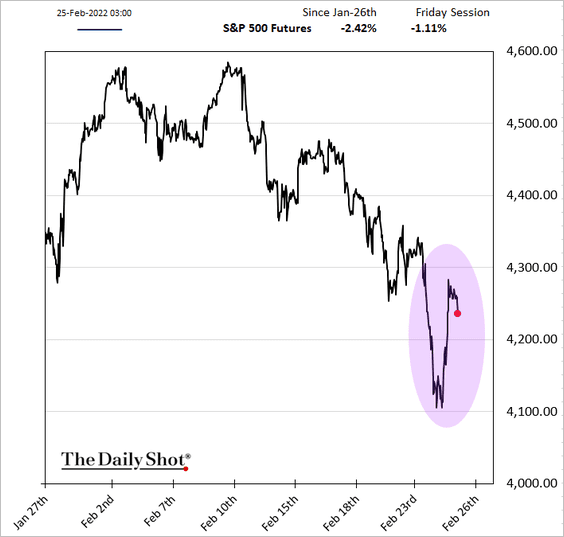
The Nasdaq 100 saw the largest daily swing since 2008.
——————–
2. As we saw earlier this week (from Numera Analytics), the geopolitical threat tends to be more damaging to stocks than the geopolitical act. Of course, equities are likely to see extreme volatility continuing.
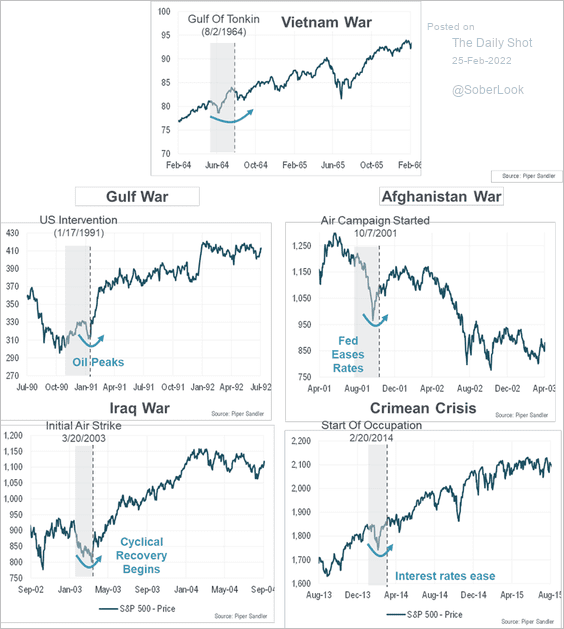 Source: Michael Kantrowitz, Piper Sandler
——————–
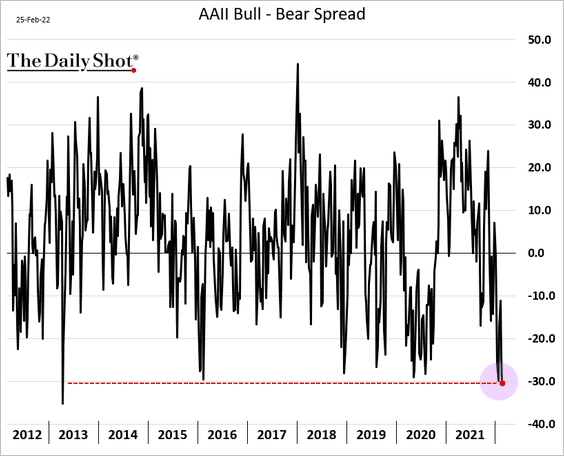
3. Investors remain very bearish.
• The AAII bull-bear spread:
• Scotiabank’s panic/euphoria indicator:
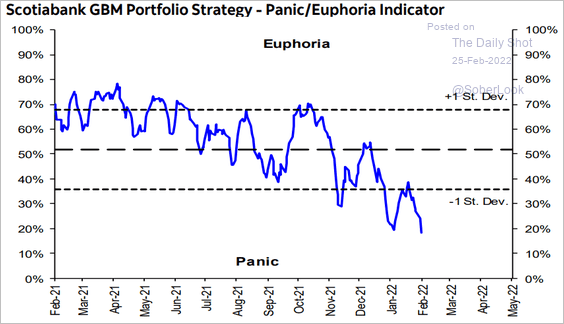 Source: Hugo Ste-Marie, Portfolio & Quantitative Strategy Global Equity Research, Scotia Capital
——————–
4. When VIX is above 30, S&P 500 returns are skewed to the upside, but the tail risk is higher.
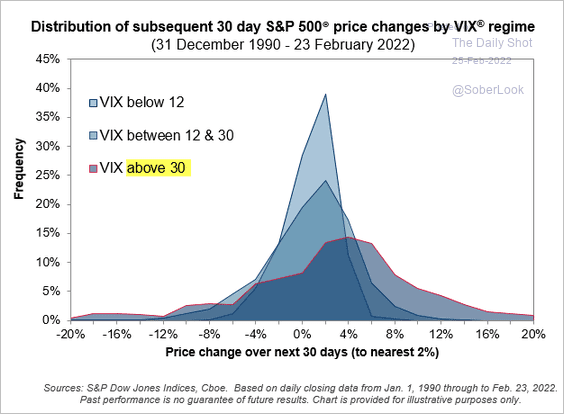 Source: S&P Global Market Intelligence
5. The S&P 500 was only 33 days removed from its most recent multi-year high before the recent correction.
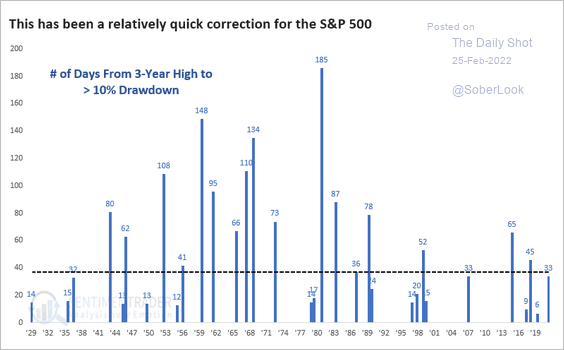 Source: SentimenTrader
6. It’s been over a decade since we saw this level of growth factor underperformance vs. value (over a 3-month period).
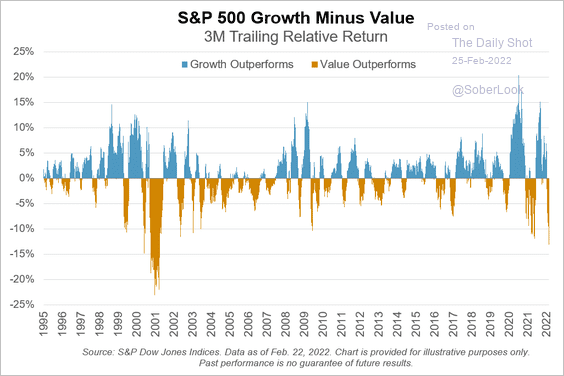 Source: S&P Global Market Intelligence
7. Hedge funds were bullish consumer discretionary stocks going into this week, according to a survey from Evercore ISI.
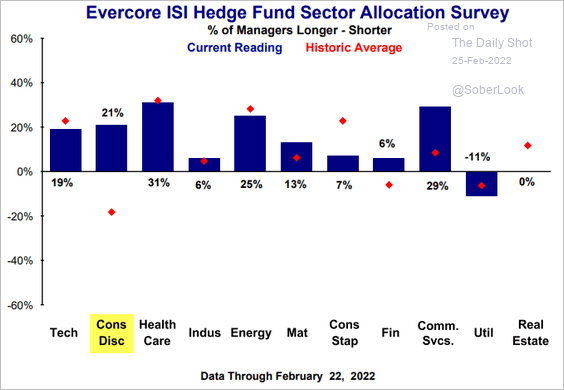 Source: Evercore ISI Research
Back to Index
Rates
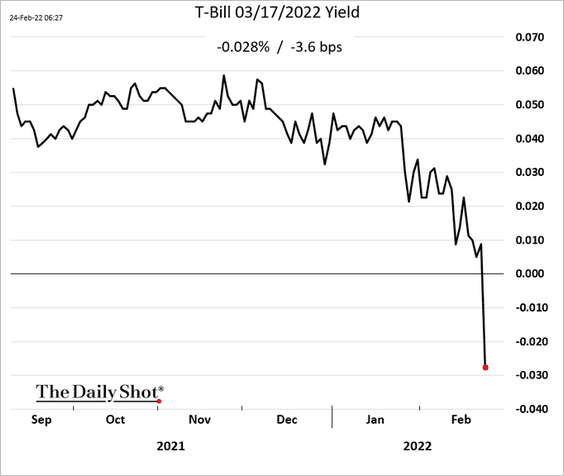
1. The 1-month Treasury bill yield turned negative yesterday as investors rushed into cash.
2. There is a high probability that the 10-year Treasury yield will continue to trend higher, according to Numera Analytics.
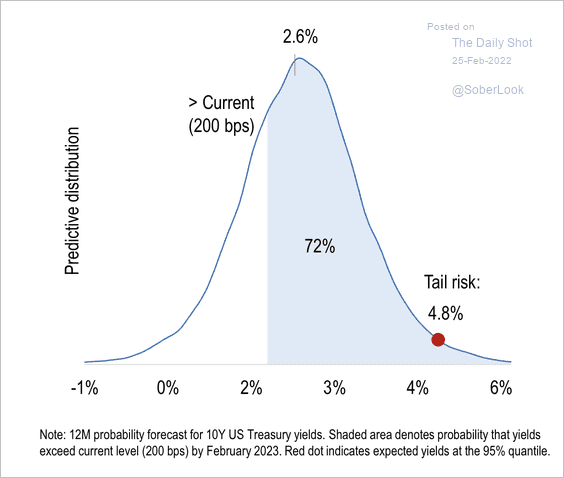 Source: Numera Analytics
3. How much does the yield curve flatten across tightening cycles?
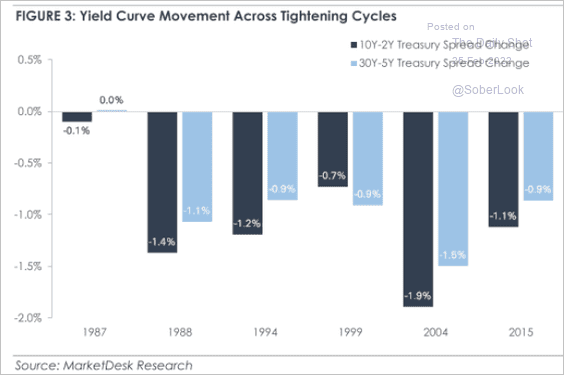 Source: MarketDesk Research
Back to Index
Energy
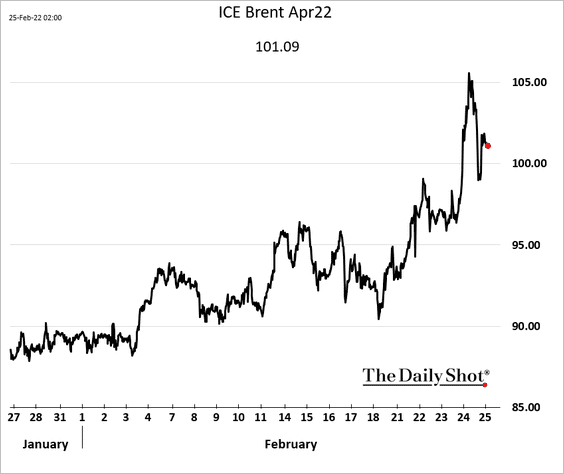
1. The latest Russia sanctions excluded energy and did not block Russia from the international payment system. As a result, Brent dipped from the highs but is holding above $100/bbl.
2. Oil and refined products inventories remain tight.
• US crude oil inventories:
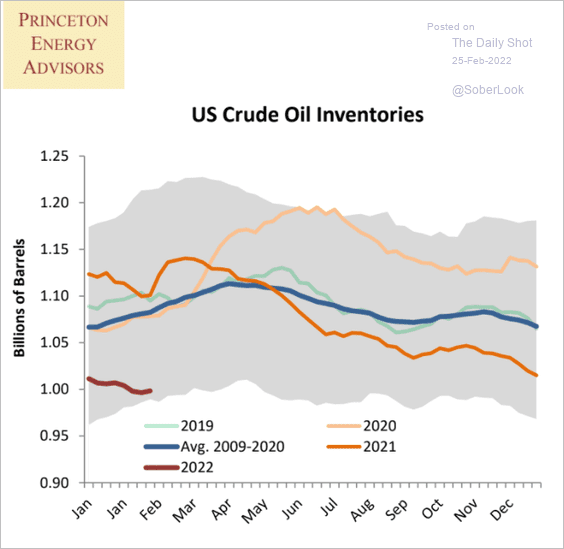 Source: Princeton Energy Advisors
• Cushing, OK oil stocks:
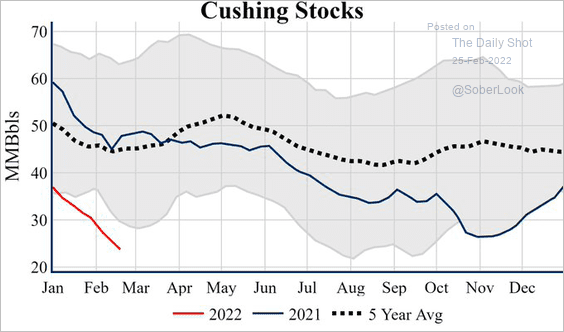 Source: @nhillman_energy
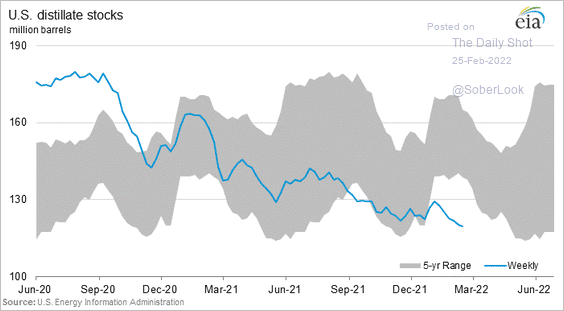
• US distillates inventories:
• US total liquids inventories:
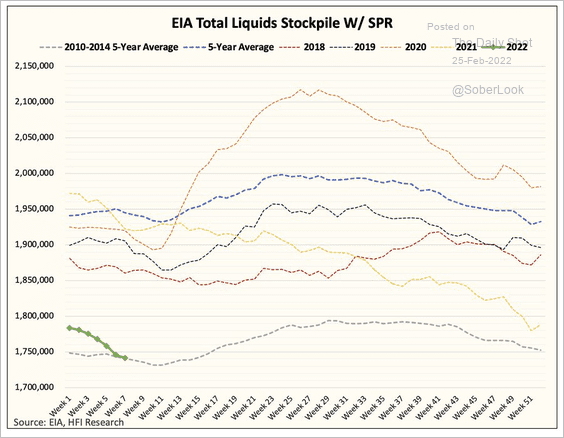 Source: @HFI_Research
Not only are global liquids inventories below normal levels, but OPEC’s spare capacity is tight.
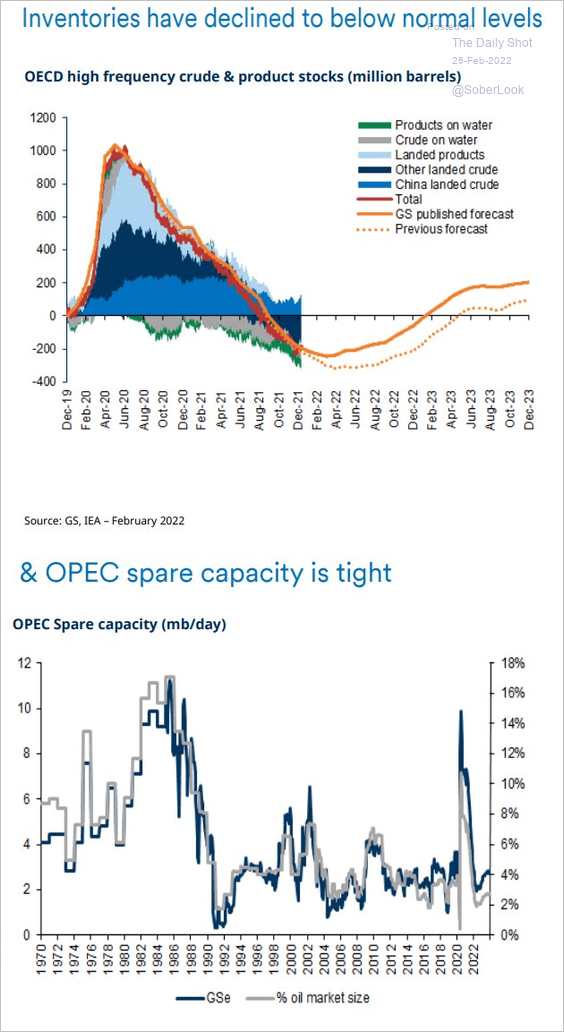 Source: Goldman Sachs; @dlacalle_IA
——————–
3. Next, we have some updates on the European energy crisis.
• Russian natural gas exports:
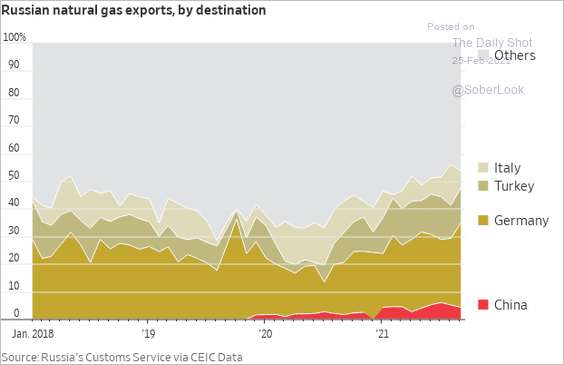 Source: @WSJ Read full article
• EU LNG imports:
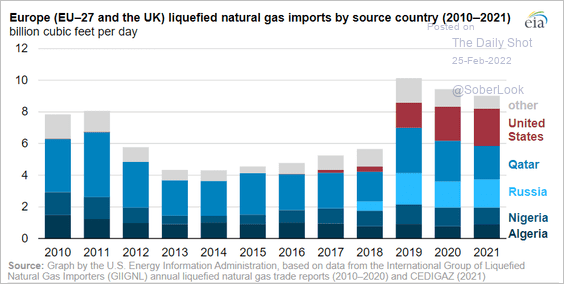 Source: EIA Read full article
• Germany’s source of natural gas:
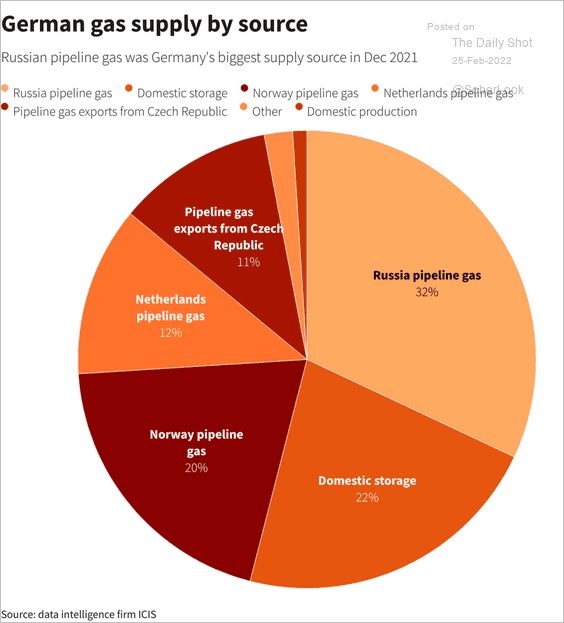 Source: Reuters Read full article
• German power production by source (2 charts):
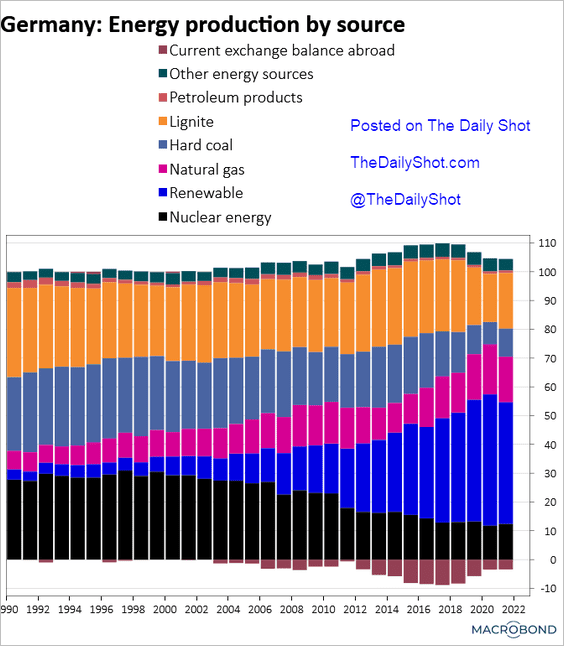 Source: @TheTerminal, Bloomberg Finance L.P.
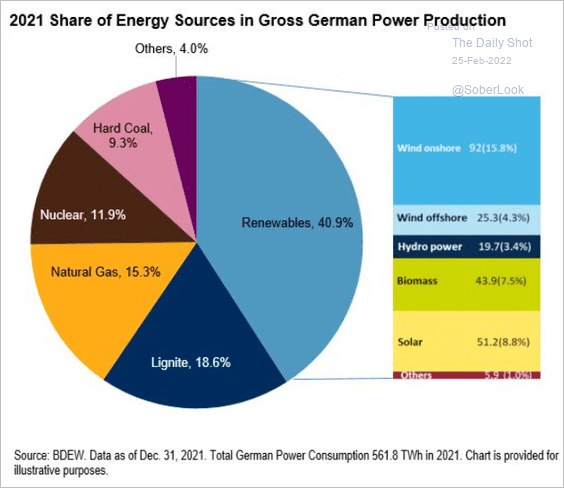 Source: S&P Global Market Intelligence
Back to Index
Commodities
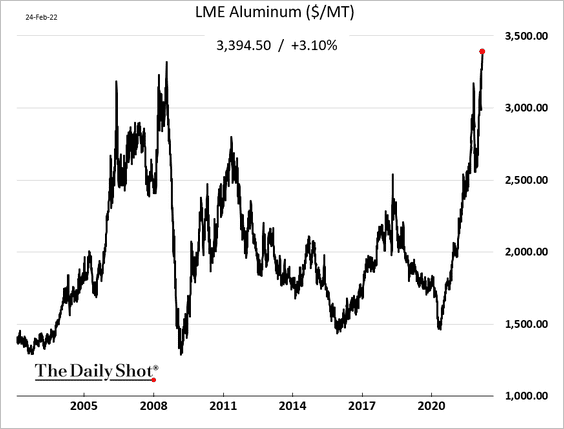
1. Aluminum prices set a record high.
2. More gold mining stocks are exiting bear market territory.
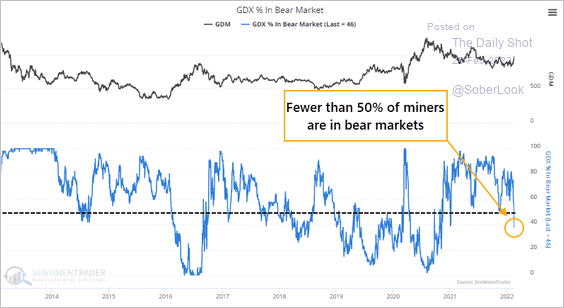 Source: SentimenTrader
Gold is attempting a breakout from a year-long consolidation phase.
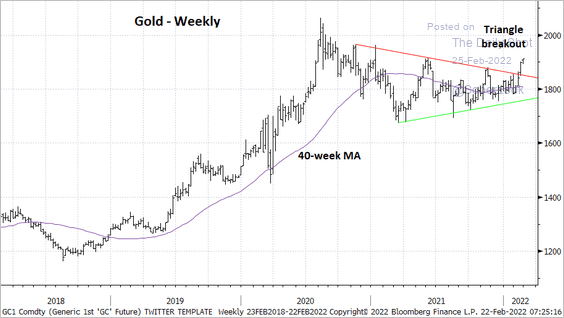 Source: @StocktonKatie
——————–
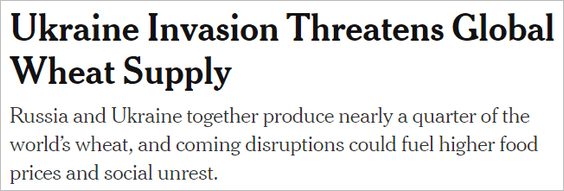
3. Wheat prices have been surging.
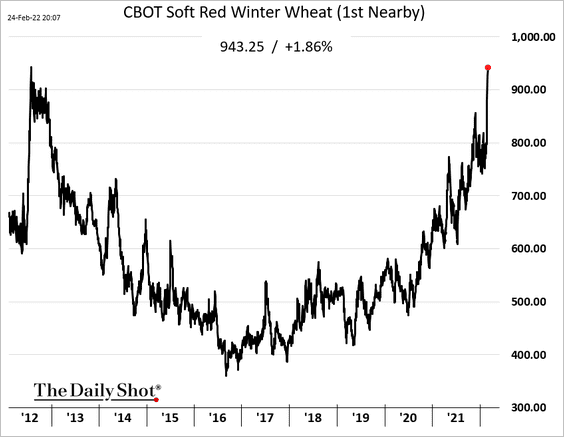
 Source: The New York Times Read full article
Here is why.
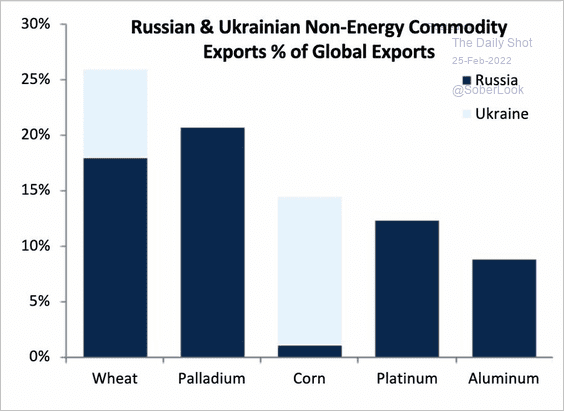 Source: RBC; @Schuldensuehner
Back to Index
Cryptocurrency
1. It’s been a rough week for cryptocurrencies, although the sell-off is starting to stabilize.
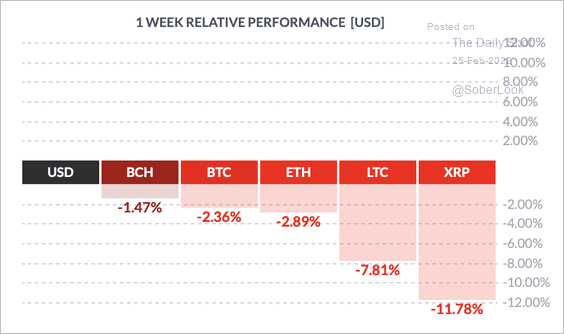 Source: FinViz
2. Long liquidations spiked as Putin announced military operations in Eastern Ukraine. However, later in the New York trading day, a large number of short positions were liquidated.
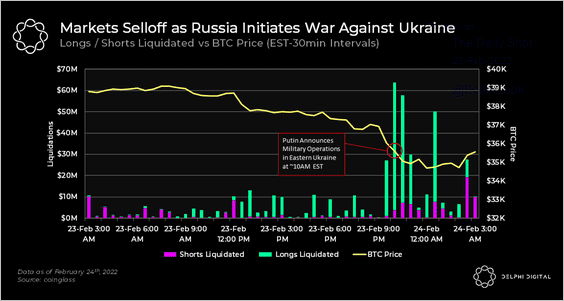 Source: @Delphi_Digital
3. Bitcoin has underperformed equities and traditional safe havens so far this year.
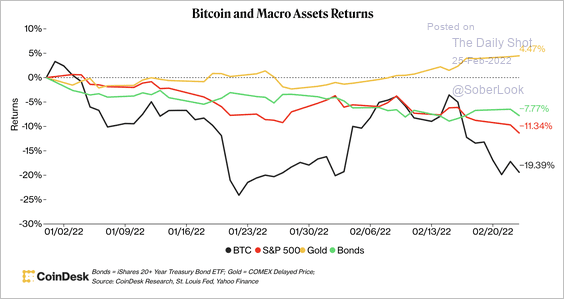 Source: CoinDesk Read full article
4. Bitcoin has been inversely correlated with gold …
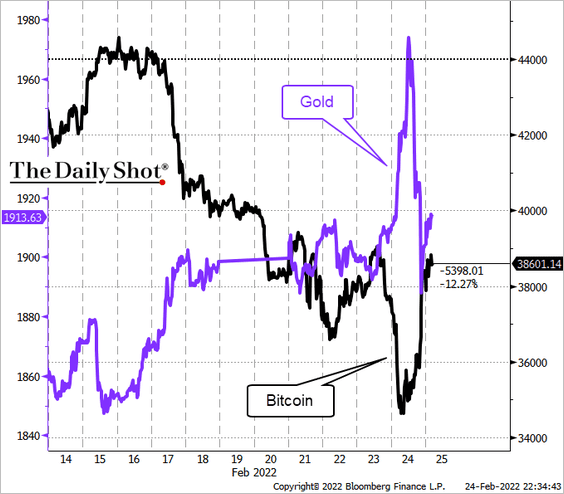 Source: @TheTerminal, Bloomberg Finance L.P.
… and positively correlated to stocks.
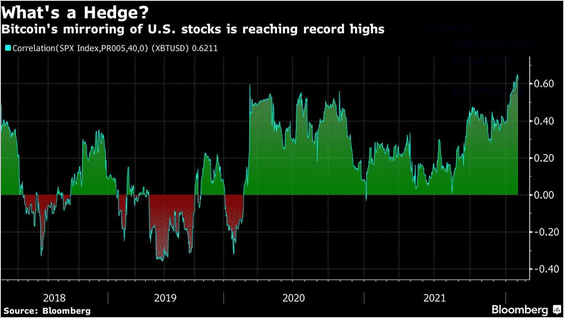 Source: @crypto Read full article
——————–
5. This chart shows the adoption of digital assets by region.
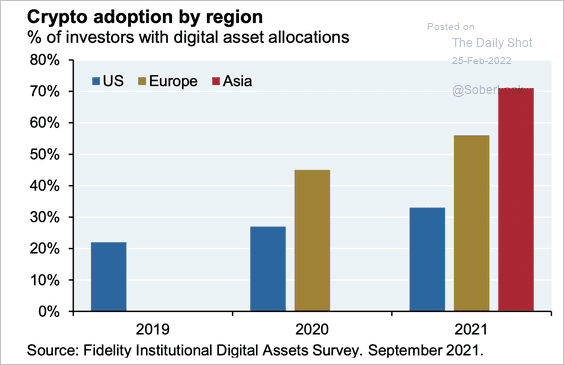 Source: J.P. Morgan Asset Management
Back to Index
Emerging Markets
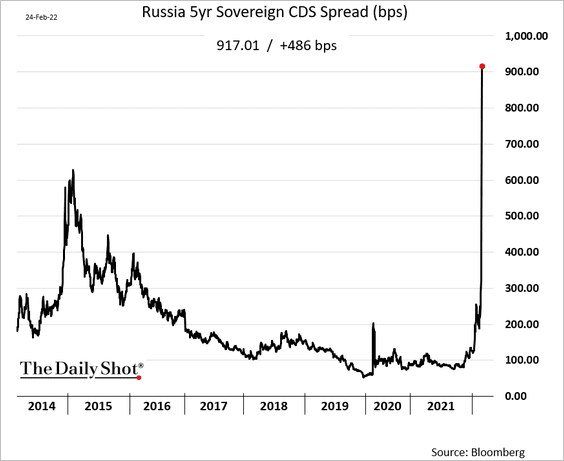
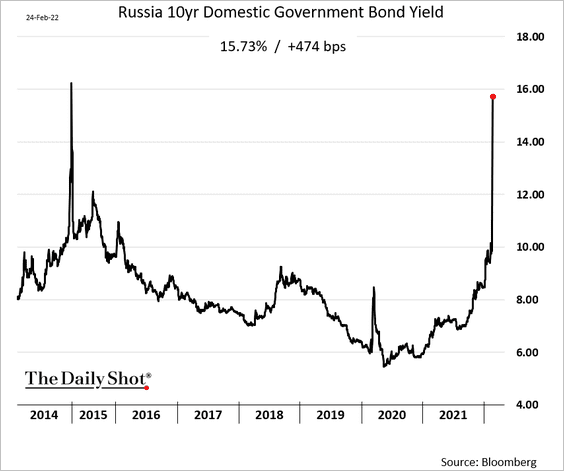
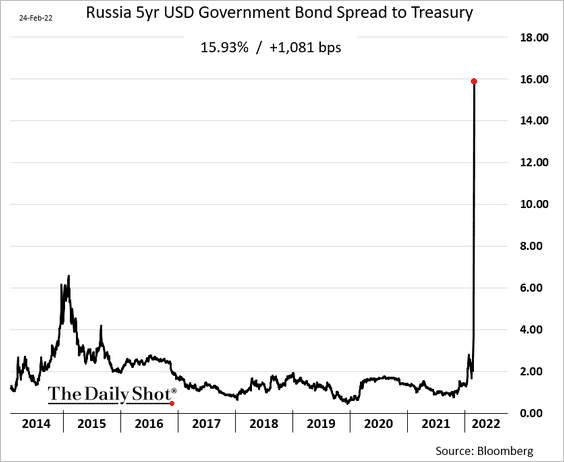
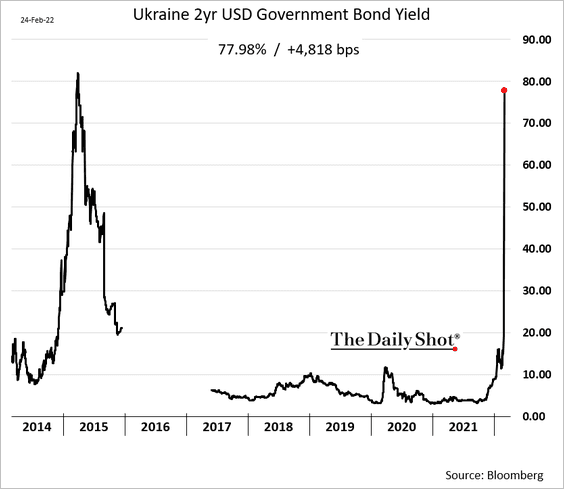
1. Russian and Ukrainian assets experienced extreme losses this week.
• Russian sovereign CDS spread:
• Domestic government bond yield:
• USD bond spread to Treasuries:
• Russian stock market relative to other market crashes:
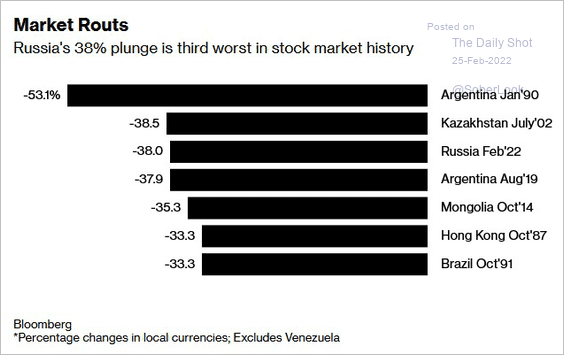 Source: @jessefelder, @markets Read full article
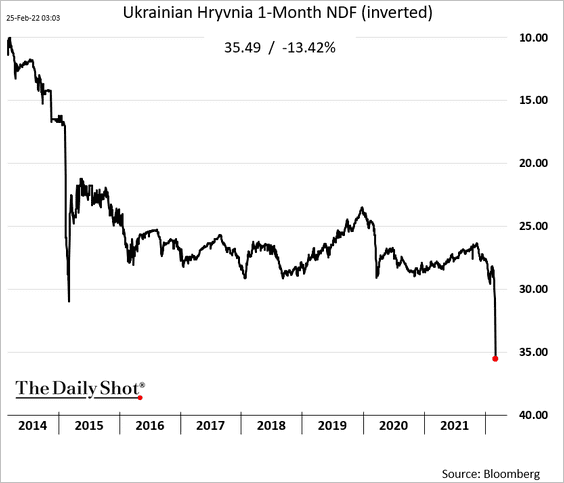
• Ukraine’s 2yr USD bond yield:
• Ukraine’s currency, the hryvnia:
——————–
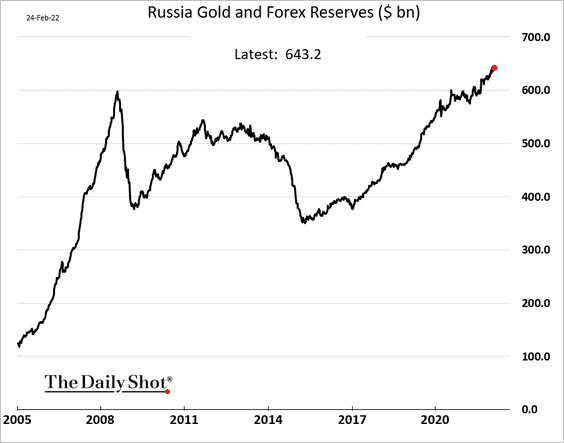
2. Russia’s F/X reserves hit a record high as gold prices climb.
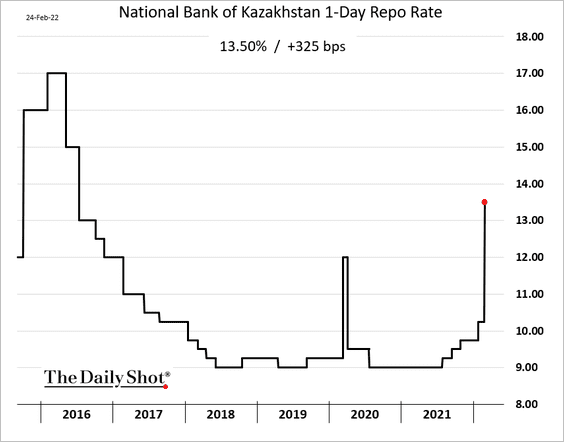
3. Kazakhstan’s central bank hiked rates by 325 bps as the nation’s currency comes under pressure.
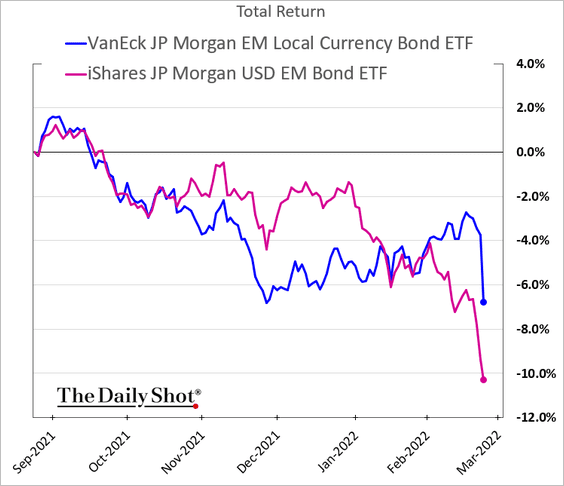
4. EM bonds have been selling off across the board, especially hard-currency debt.
Back to Index
China
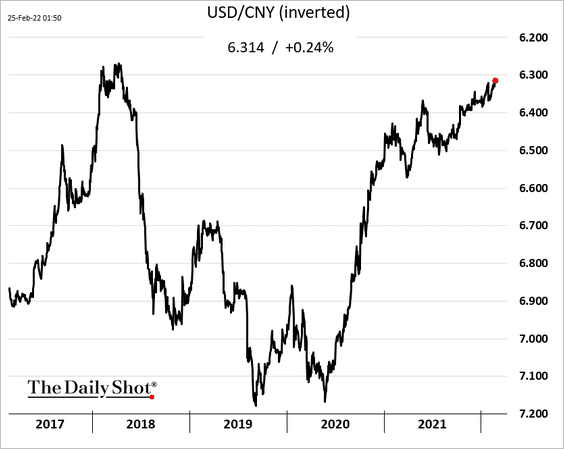
1. The renminbi hit the highest level vs. USD since 2018 (it’s somewhat of a safe haven in this environment).
2. Developers continue to face a funding squeeze. Here is Shimao’s bond price.
![]()
![]() Source: Reuters Read full article
Source: Reuters Read full article
![]() Source: Moody’s Investors Service Read full article
Source: Moody’s Investors Service Read full article
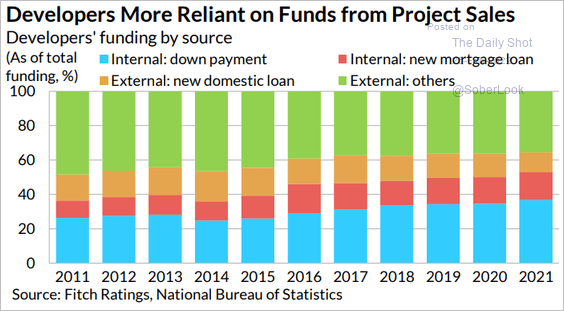
• Below are some trends in the property development funding market.
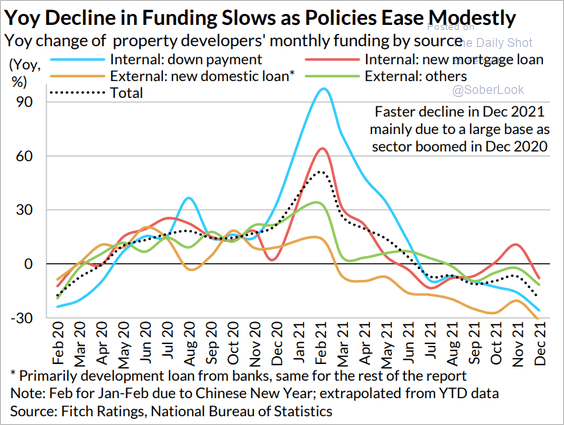 Source: Fitch Ratings
 Source: Fitch Ratings
• Residential housing development has slowed sharply.
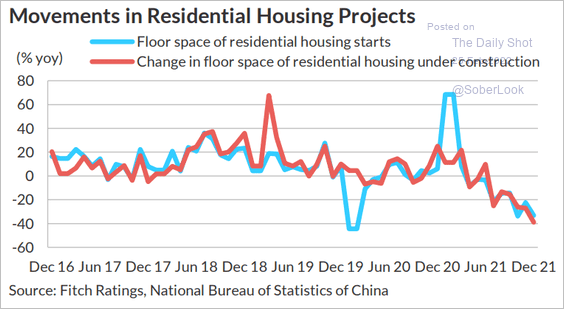 Source: Fitch Ratings
——————–
3. Policy has led to a sharp decline in residential development land supply in China.
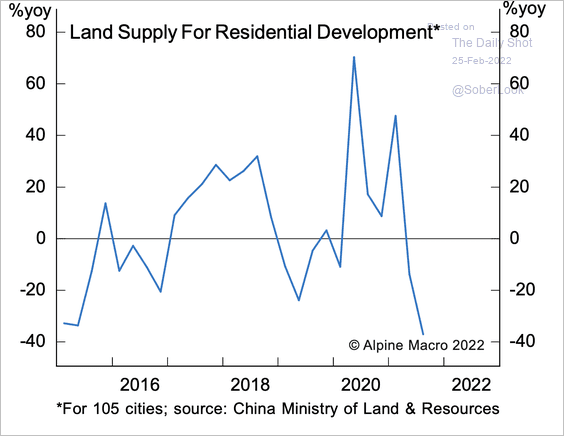 Source: Alpine Macro
4. Shadow banking in China is down massively from its 2017 peak.
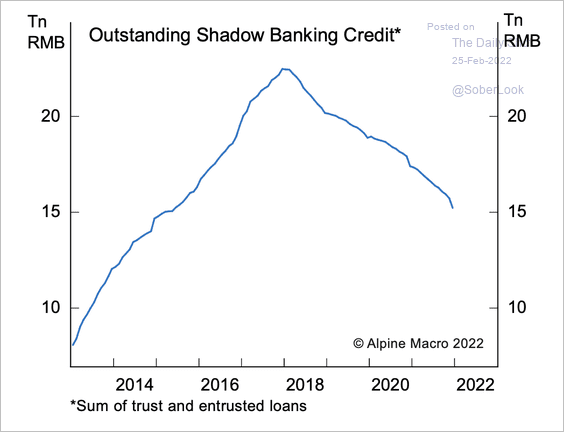 Source: Alpine Macro
5. Steel production and emissions are expected to rise over the next few years.
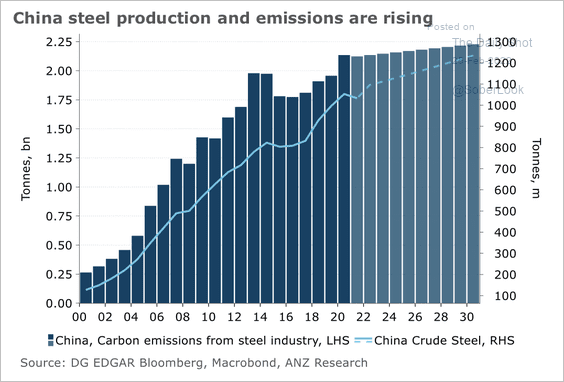 Source: ANZ Research
Back to Index
Asia – Pacific
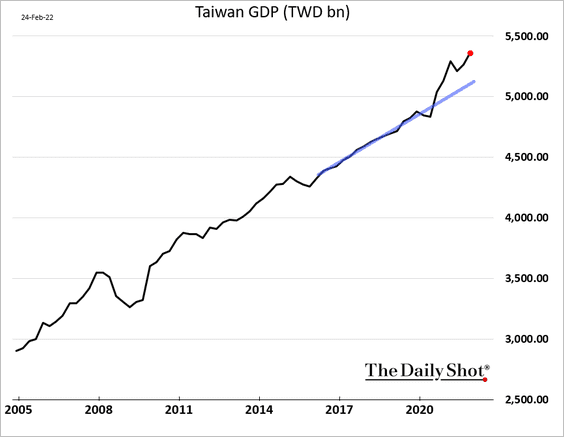
1. Taiwan’s economic growth continues to power ahead.
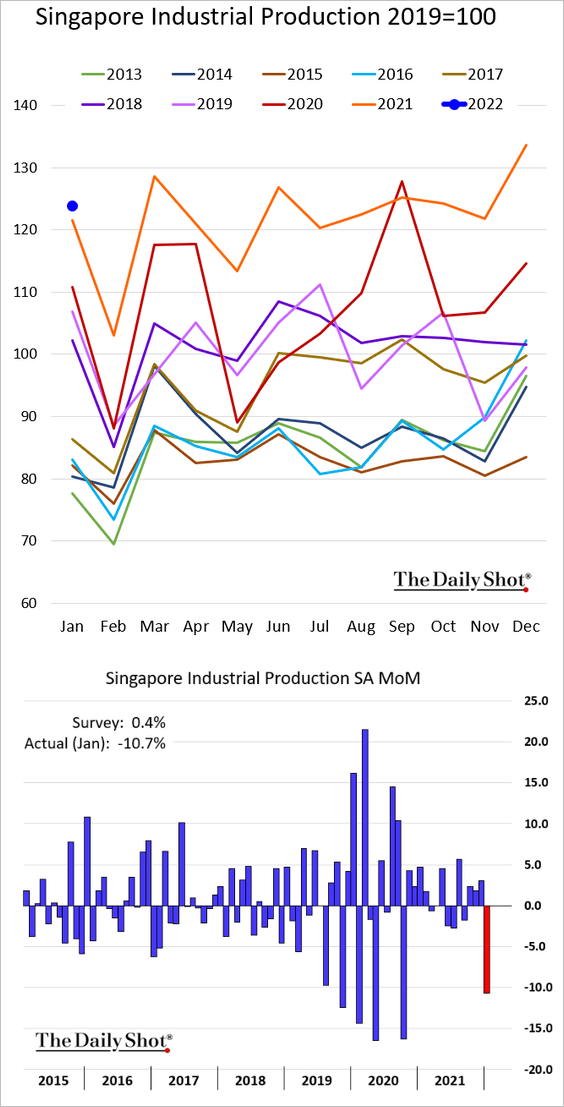
2. Singapore’s December industrial production was disappointing (2nd panel shows seasonally-adjusted monthly changes).
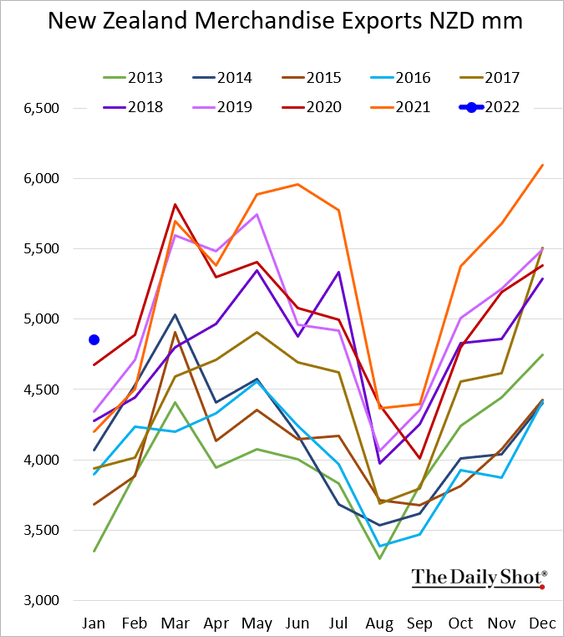
3. New Zealand’s exports were well above 2021 levels in January.
Separately, what will the RBNZ’s QT look like?
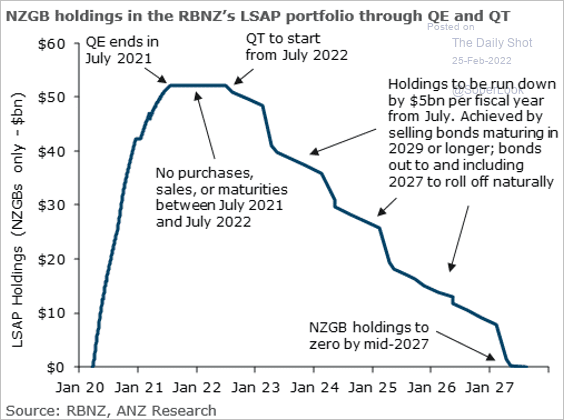 Source: @sharon_zollner, @ANZ_NZ
Back to Index
Japan
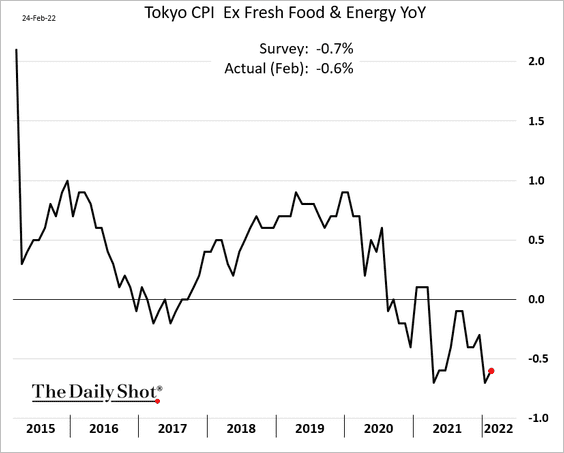
1. Has Japan’s core CPI bottomed? Here is Tokyo’s core CPI (which comes out well ahead of the national figure).
2. Japanese corporate profits are negatively correlated to the terms of trade.
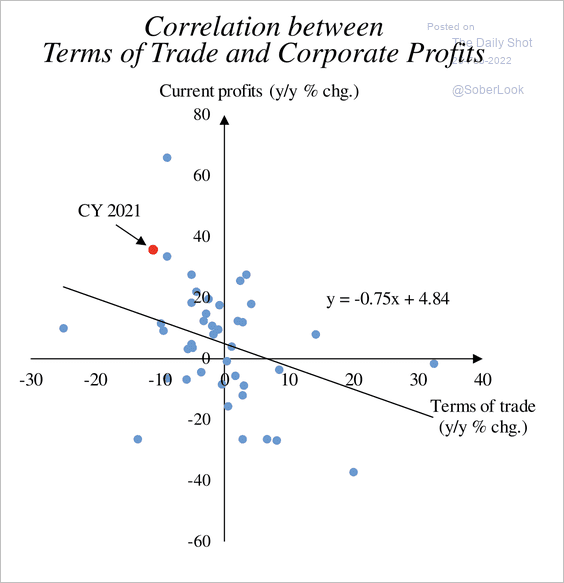 Source: Bank of Japan
3. The manufacturing PMI shows a margin squeeze.
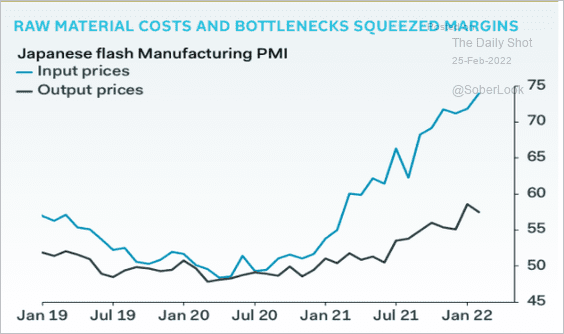 Source: Pantheon Macroeconomics
4. Japan’s real effective exchange rate is at multi-decade lows.
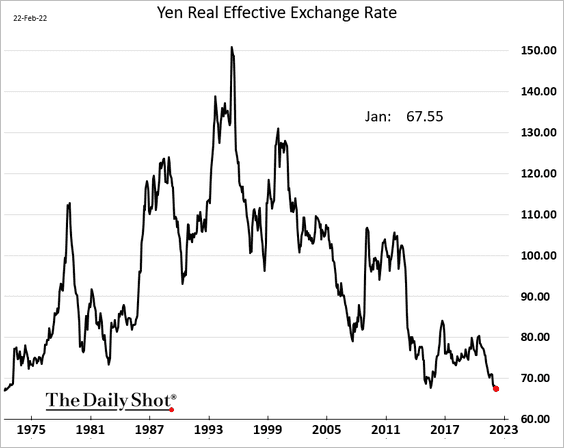 h/t Chikako Mogi Read full article
5. Japan’s GDP and inflation have lagged other developed economies.
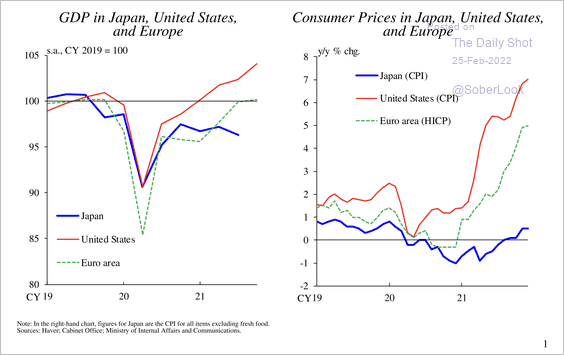 Source: Bank of Japan
Back to Index
Europe
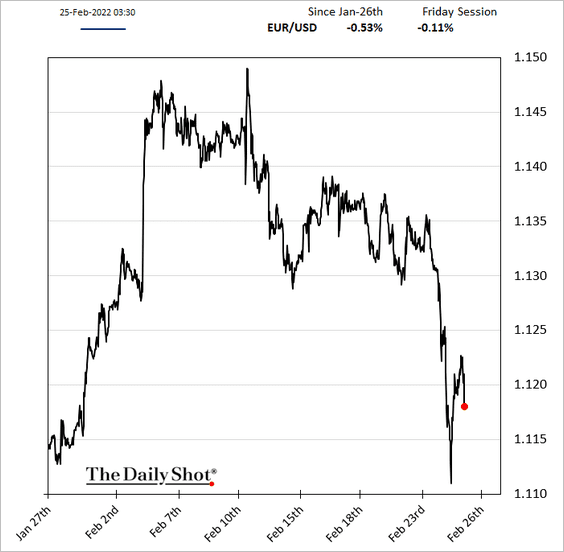
1. The Eurozone’s economy will take a hit from Russia’s attack on Ukraine. Will the ECB delay its rate hikes?
 Source: Reuters Read full article
The euro rebounded from this week’s lows but could remain under pressure.
——————–
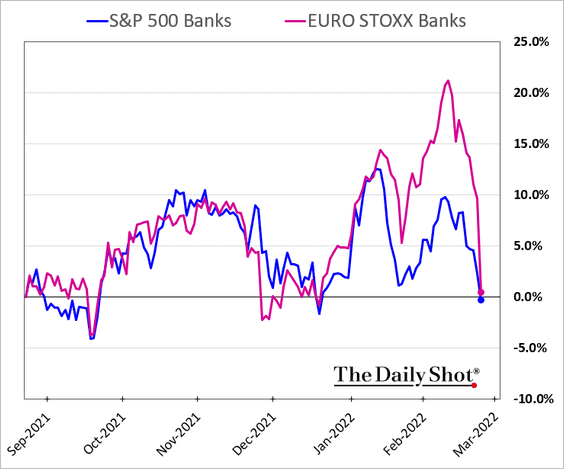
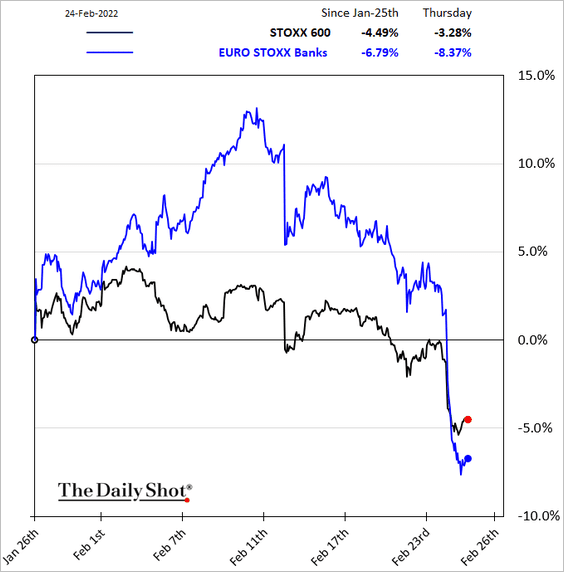
2. European bank shares were hammered yesterday due to their exposure to Russia.
——————–
3. German real yields tumbled as inflation expectations jumped.
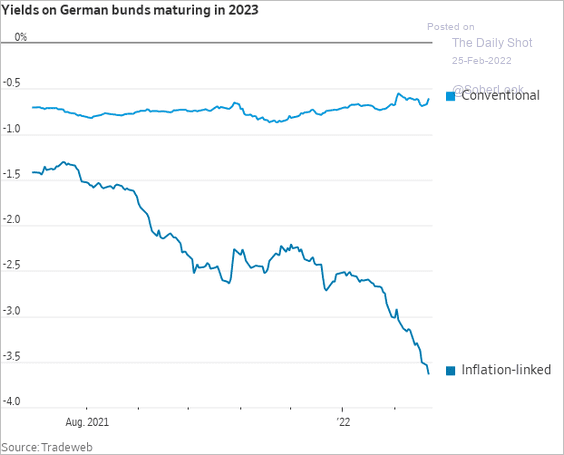 Source: @WSJ Read full article
4. Below is the EU’s exposure to Russia and Ukraine.
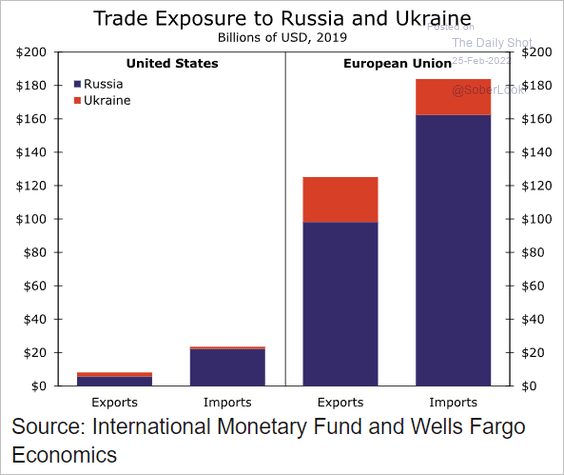 Source: Wells Fargo Securities
5. Here is a look at NATO’s enlargement across the continent.
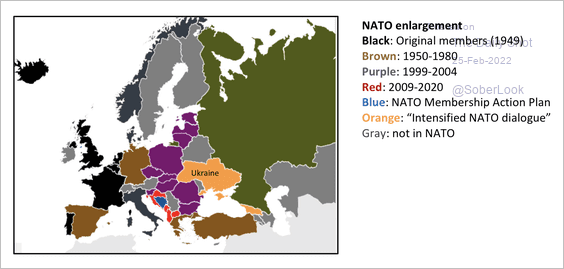 Source: Michael Cembalest, J.P. Morgan Asset Management
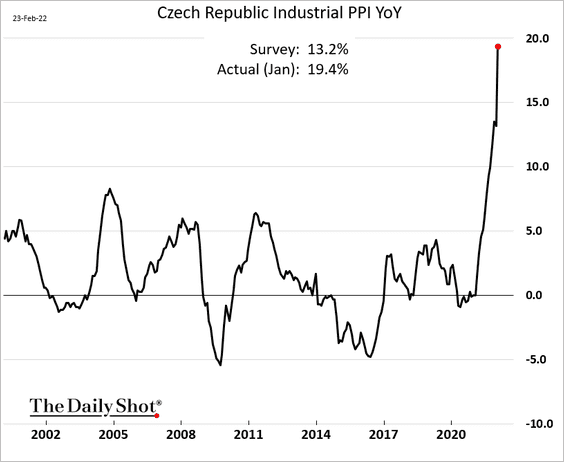
6. Producer prices are surging across Europe and are likely to accelerate further after this week.
Back to Index
The United Kingdom
1. Retail sales eased this month amid price pressures.
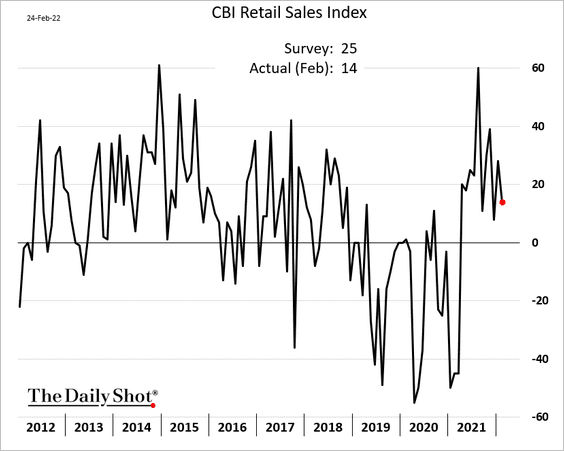
 Source: Reuters Read full article
——————–
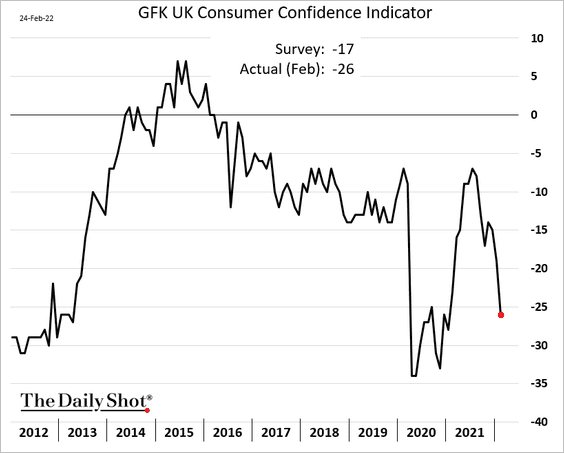
2. Consumer confidence is deteriorating.
3. This chart shows UK natural gas supplies by source.
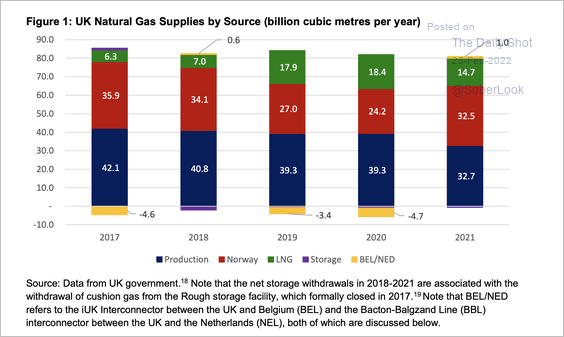 Source: Oxford Institute for Energy Studies
4. Construction sector shortages in the UK have eased significantly.
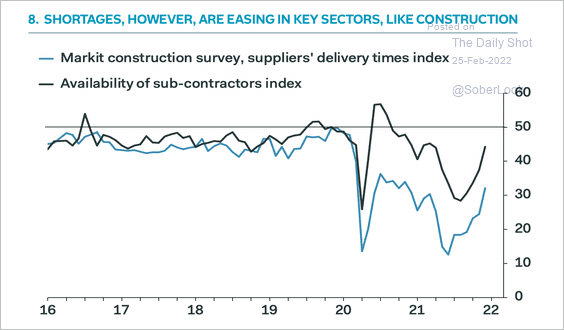 Source: Pantheon Macroeconomics
Back to Index
Canada
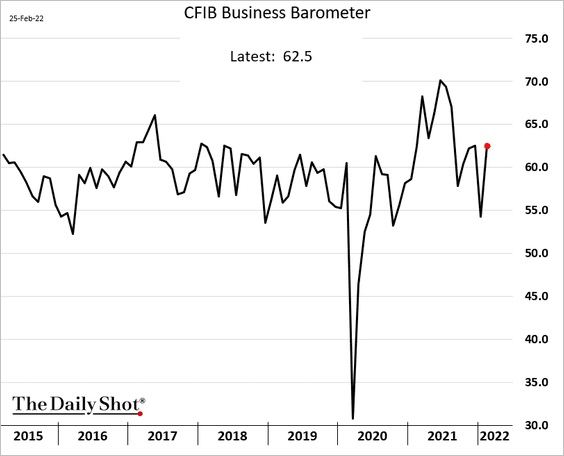
1. The CFIB small/medium-size business activity indicator rebounded this month.
2. The house price/income ratio has peaked, but remains well above the UK and US.
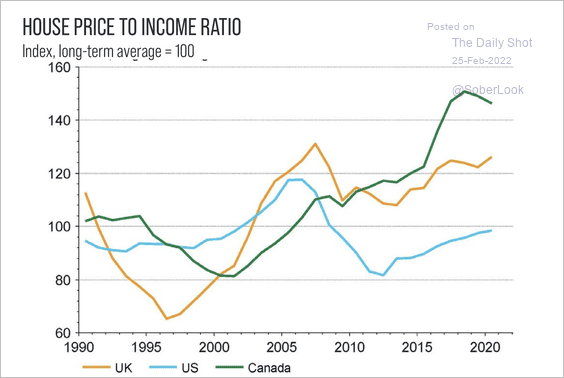 Source: 5iResearch
Back to Index
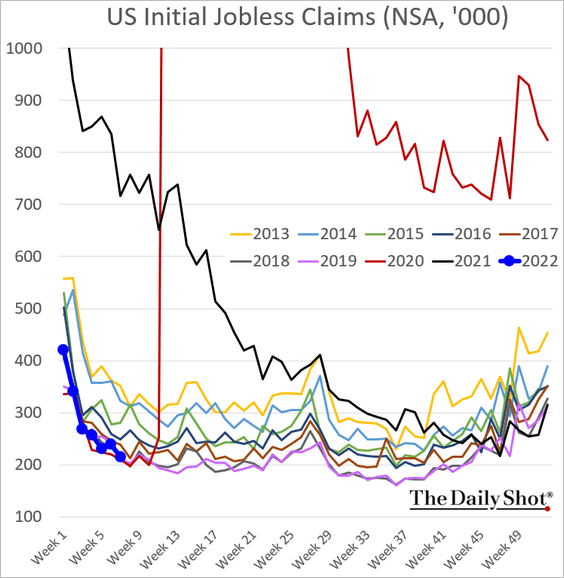
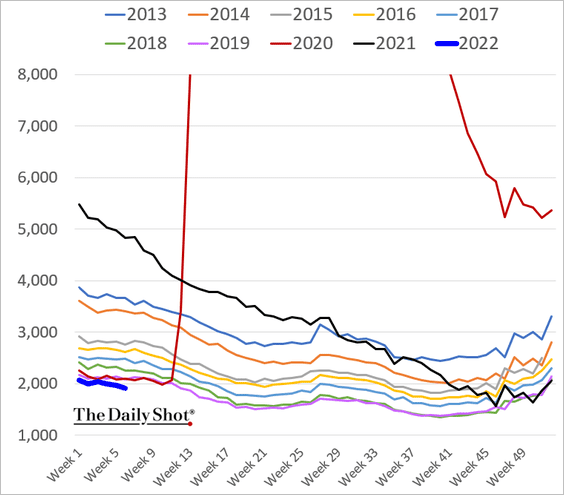
The United States
1. The labor market continues to show strength.
• New jobless claims:
• Existing jobless claims:
——————–
2. Are stocks pricing in lower GDP growth ahead?
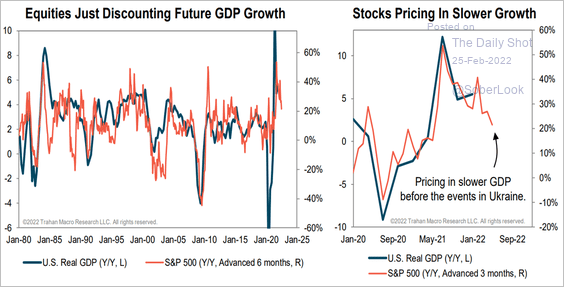 Source: Trahan Macro Research
3. Consumers plan to spend less on discretionary items.
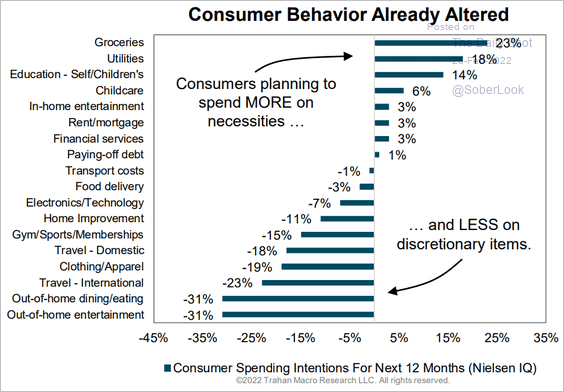 Source: Trahan Macro Research
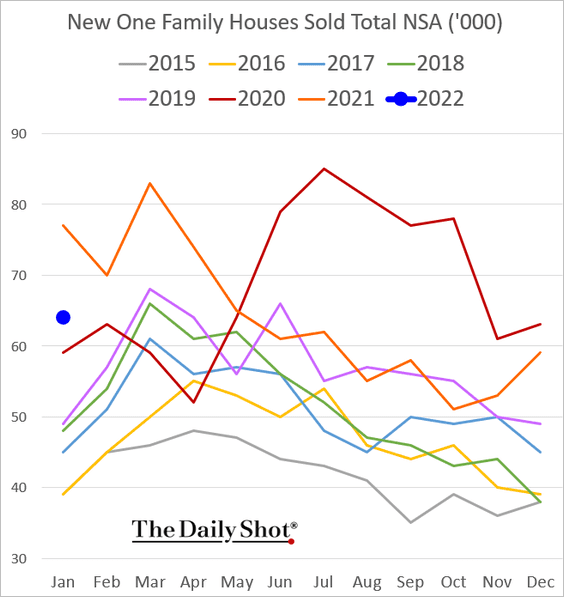
4. Sales of new homes were well below last year’s levels.
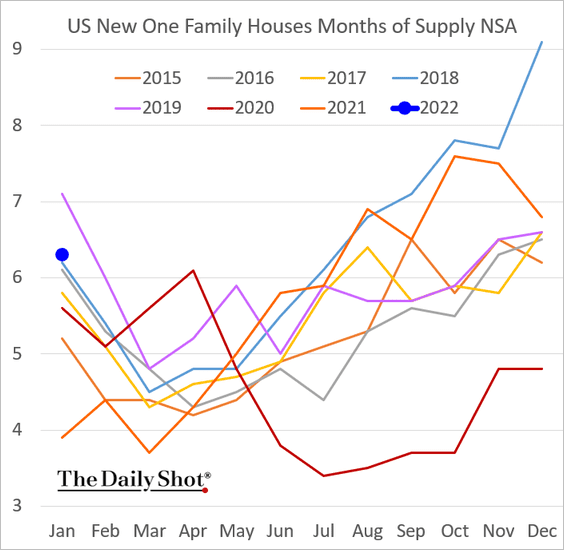
• Here are the inventories measured in terms of months of supply.
• This chart shows homes for sale that have not been started yet.
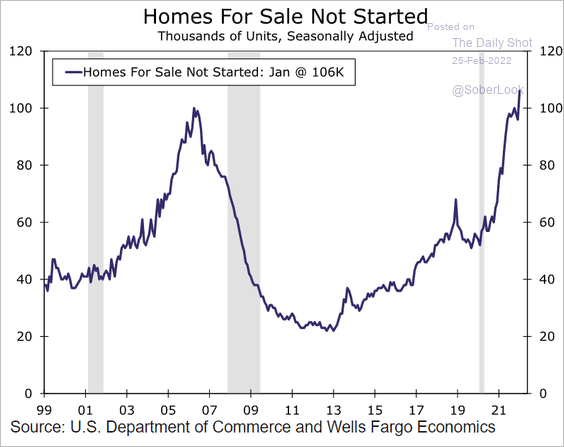 Source: Wells Fargo Securities
——————–
5. Supply chain issues seem to be easing.
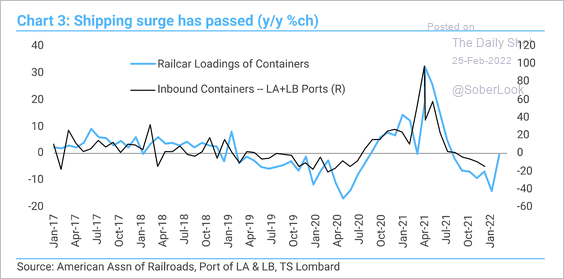 Source: TS Lombard
Here is the Evercore ISI trucking company sales survey.
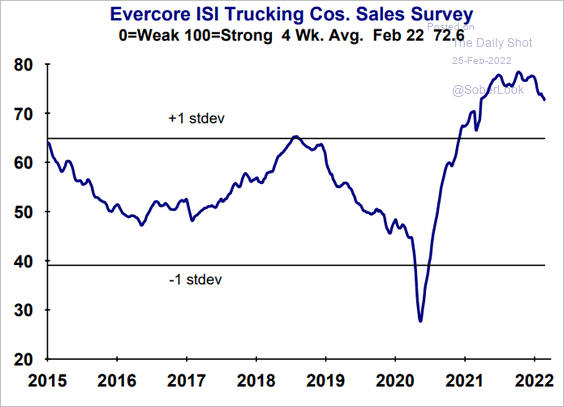 Source: Evercore ISI Research
——————–
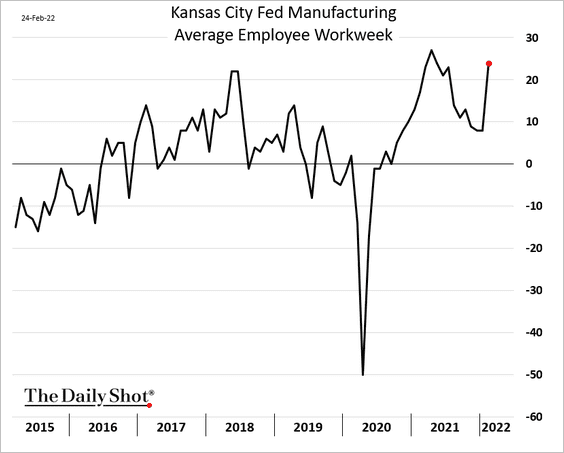
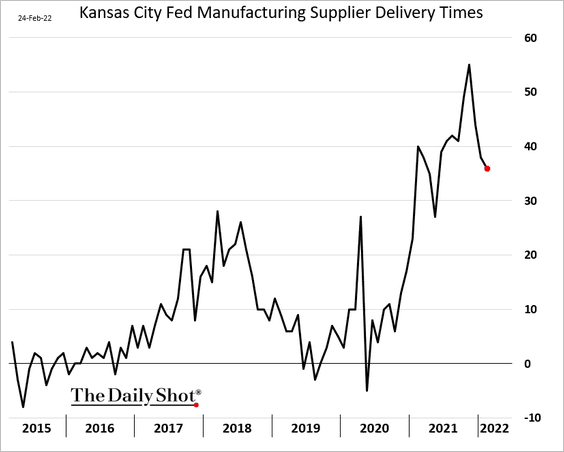
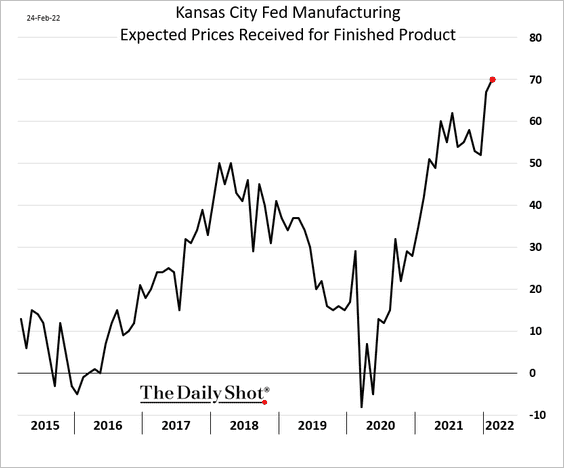
6. The February Kansas City Fed’s manufacturing report was quite strong.
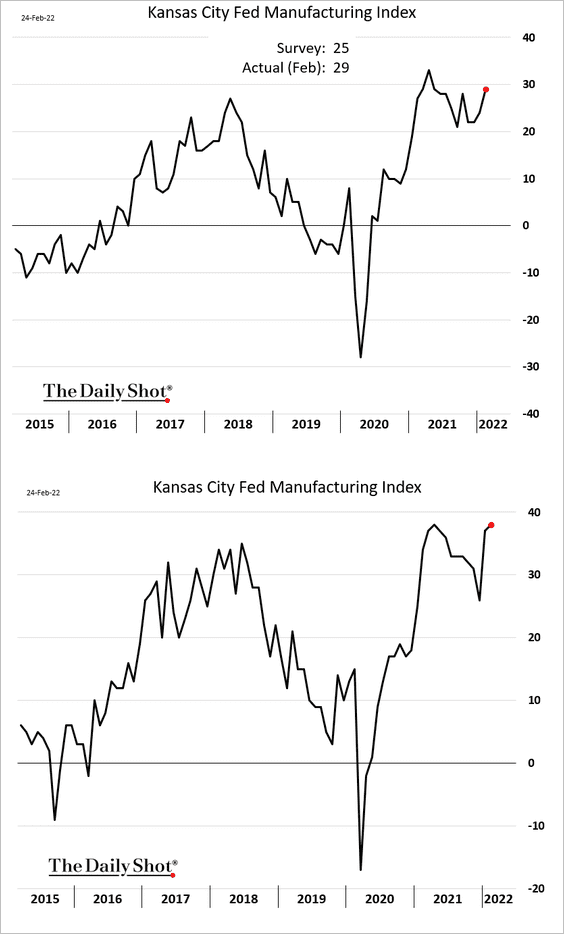
• Factory workers have been busy.
• Supply issues are still extreme but off the highs.
• Most businesses expect to raise prices in the months ahead.
Back to Index
Global Developments
1. The dollar is not yet overbought, although it is 5% away from long-term resistance.
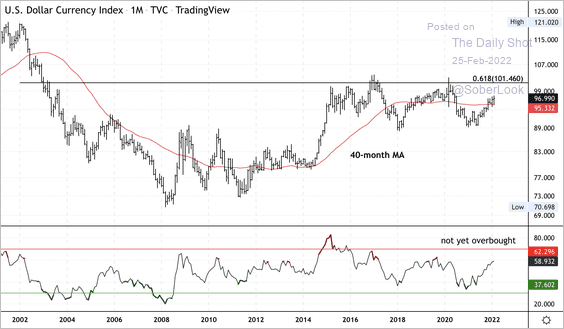 Source: Dantes Outlook
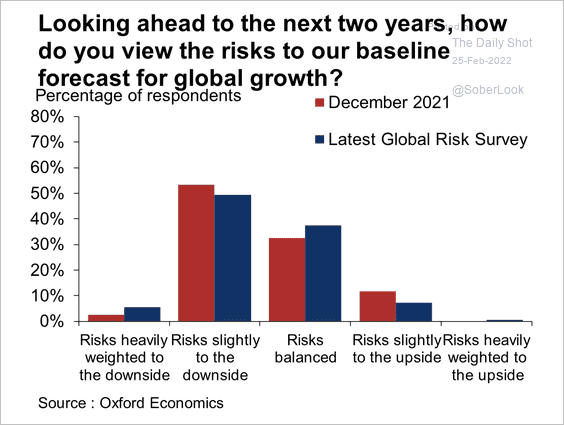
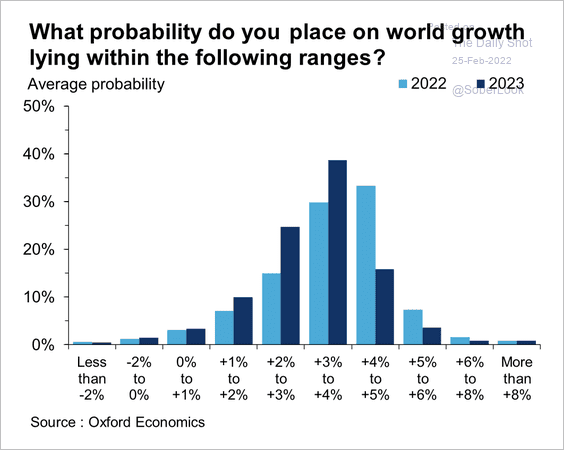
2. Businesses still see risks weighted to the downside, according to a global survey by Oxford Economics.
 Source: Oxford Economics
Growth is expected to slow next year, but remain solid.
 Source: Oxford Economics
——————–
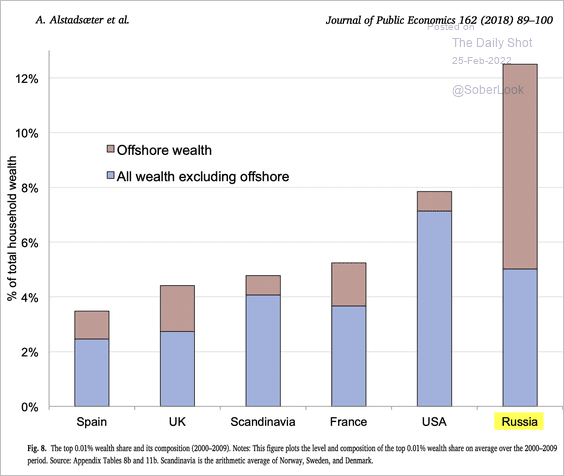
3. This chart shows the offshore wealth of the top 0.01%.
 Source: @gabriel_zucman
——————–
Food for Thought
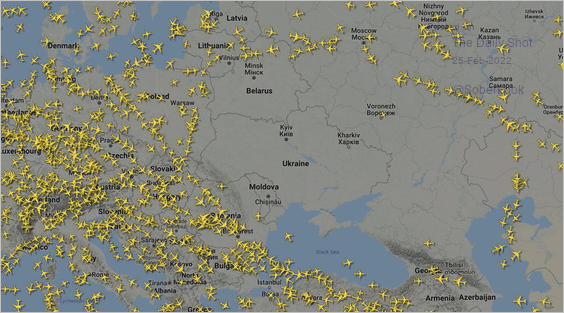
1. Air traffic across Central and Eastern Europe:
 Source: @JakeSherman
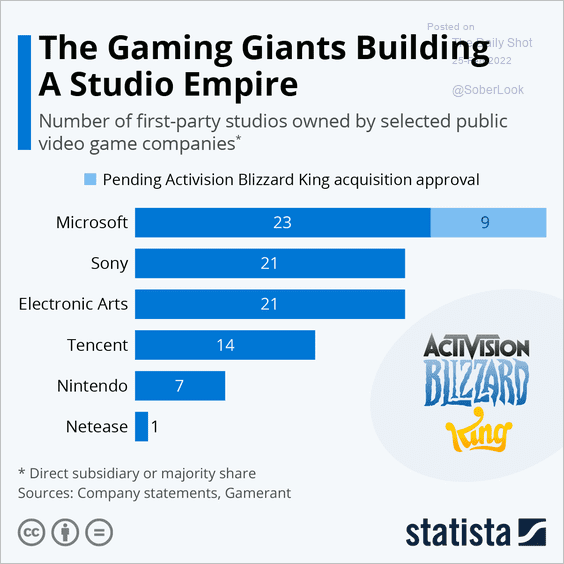
2. Studios owned by video game companies:
 Source: Statista
3. Booster doses administered by various countries:
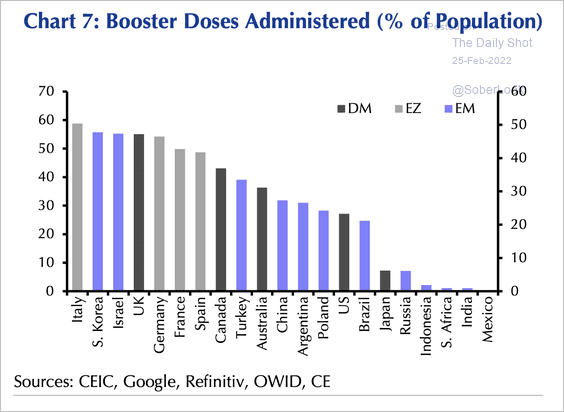 Source: Capital Economics
4. “Long” COVID:
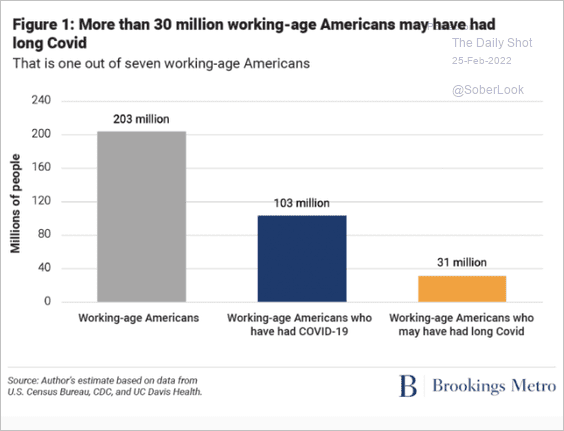 Source: Brookings Read full article Further reading
5. Dissatisfaction with immigration levels in the US:
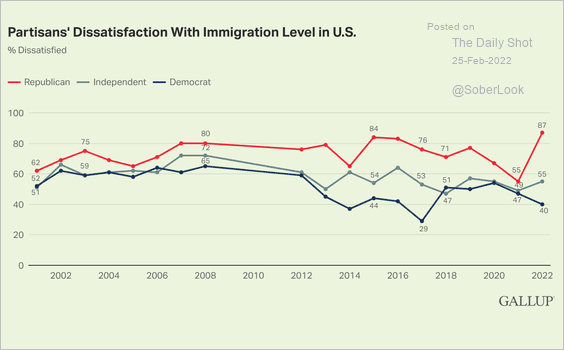 Source: Gallup Read full article
6. Changes in extreme poverty:
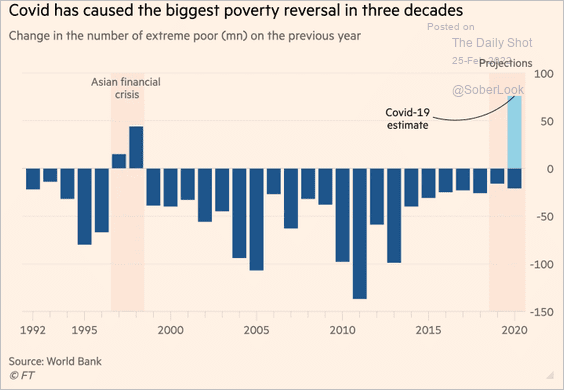 Source: @financialtimes Read full article
7. Annual hours worked:
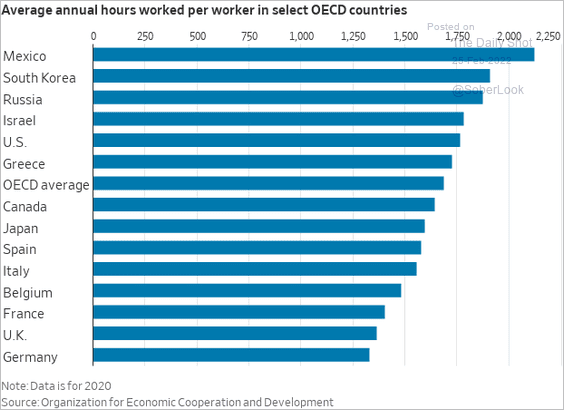 Source: @WSJ Read full article
8. When was the last time you changed jobs?
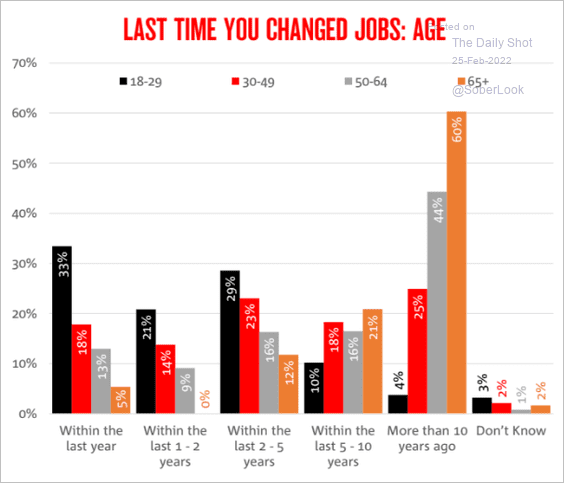 Source: @AnnetteBeacher
9. Other “intelligent” life in the Milky Way:
 Source: Statista
——————–
Have a great weekend!
Back to Index