
The Daily Shot: 02-Mar-22
• The United States
• Canada
• The United Kingdom
• The Eurozone
• Asia – Pacific
• China
• Emerging Markets
• Cryptocurrency
• Commodities
• Energy
• Equities
• Credit
• Rates
• Food for Thought
The United States
1. Crude oil is now up about 45% year-to-date, with Brent blasting past $110/bbl.
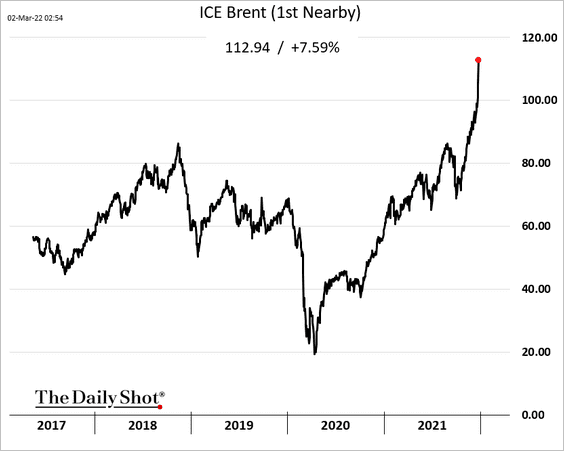
• There are growing concerns that the massive price surge will become a substantial drag on the US and global economy this year.
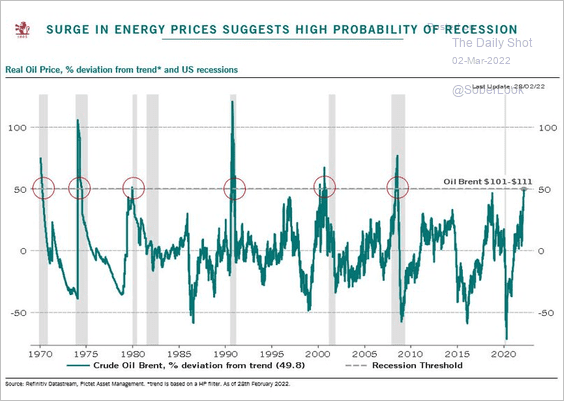 Source: @luca_paolini, @PictetAM
• Here is Bloomberg’s scenario result of a 40% oil shock. This, of course, doesn’t take into account other commodity prices and supply chain issues exacerbated by Russia’s invasion.
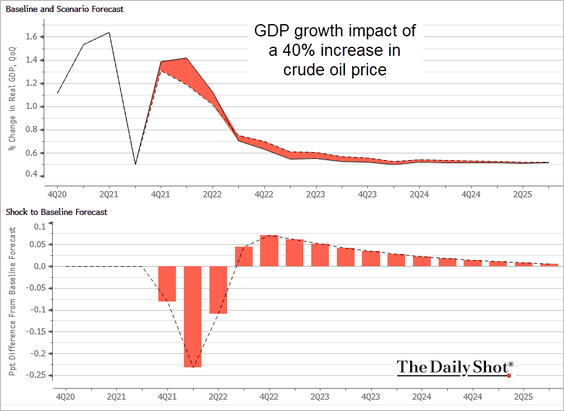 Source: @TheTerminal, Bloomberg Finance L.P.
• Gasoline prices are highly correlated with Brent crude, …
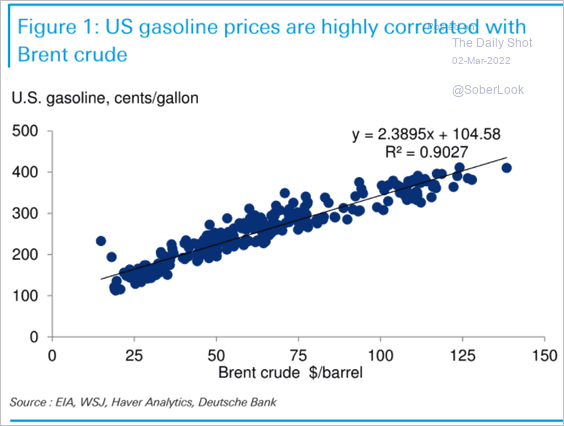 Source: Deutsche Bank Research
… and the increase in fuel prices amounts to a meaningful tax increase.
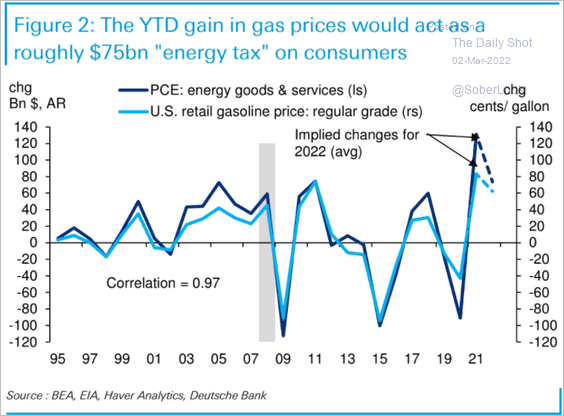 Source: Deutsche Bank Research
——————–
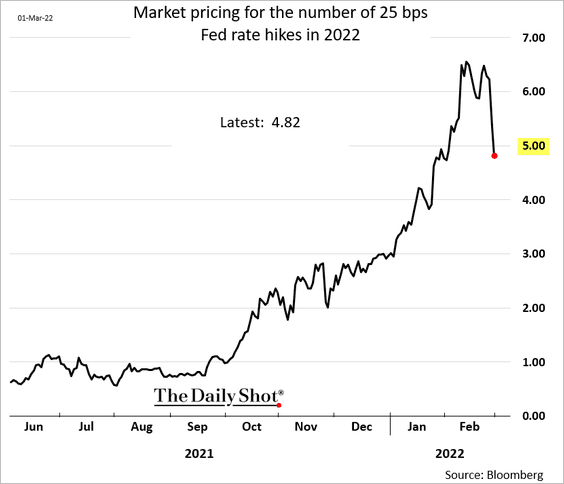
2. Concerns about growth sent Treasury yields sharply lower, …
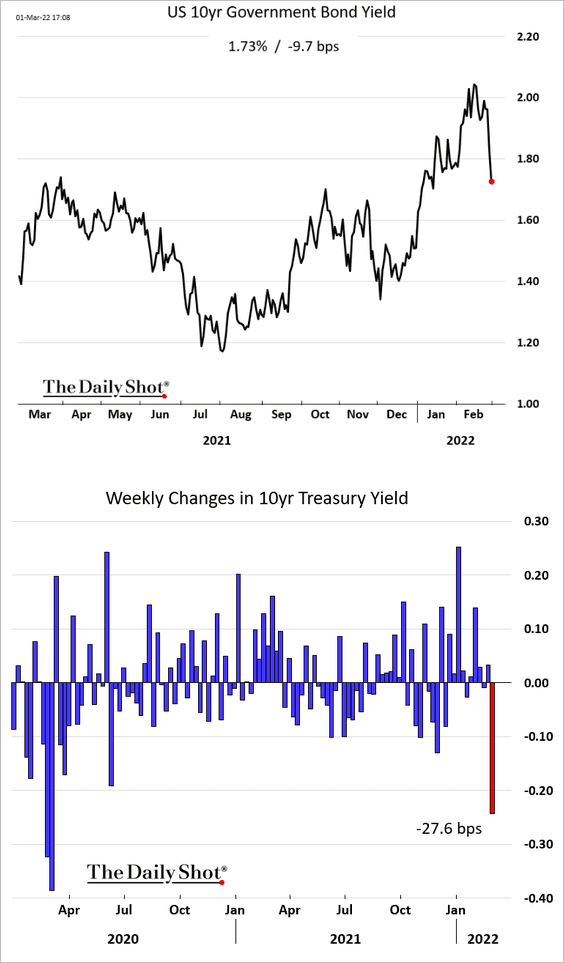
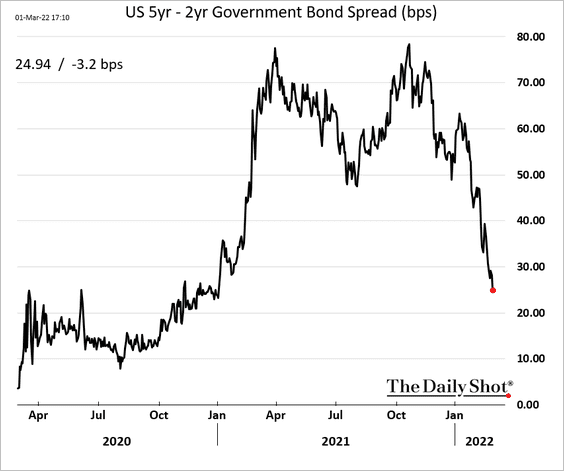
… with the yield curve rapidly flattening at the short end.
A 50 basis-point rate hike this month is now off the table.
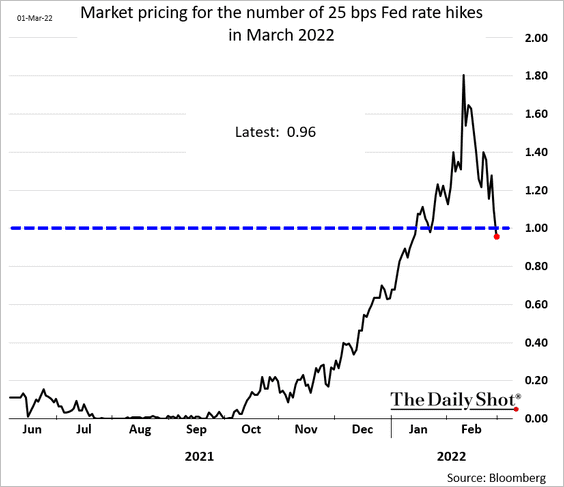
And the market is not even confident we are getting five hikes this year.
——————–
3. As oil prices surge, the projected CPI peak keeps moving further out.
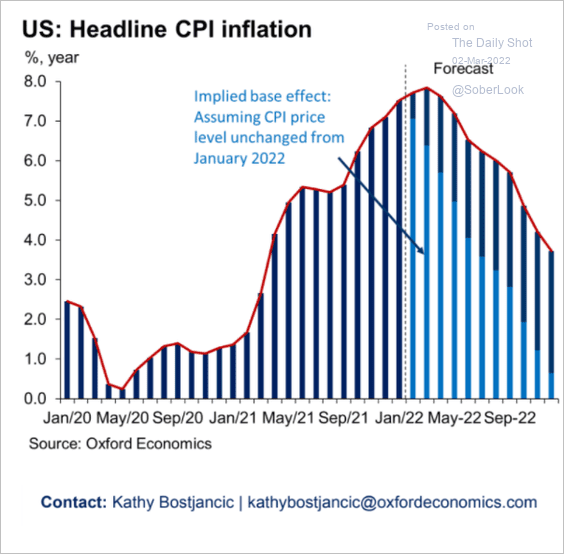 Source: Oxford Economics
• How will a 40% increase in crude oil impact the CPI?
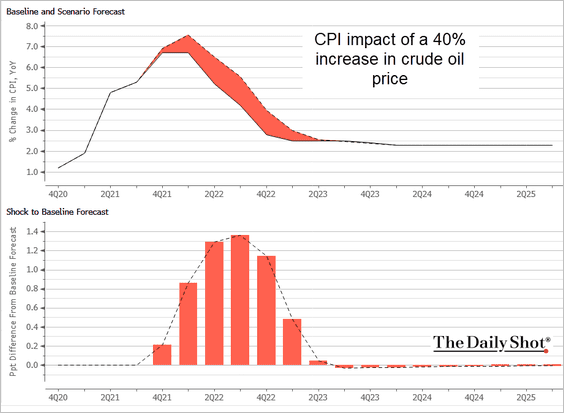 Source: @TheTerminal, Bloomberg Finance L.P.
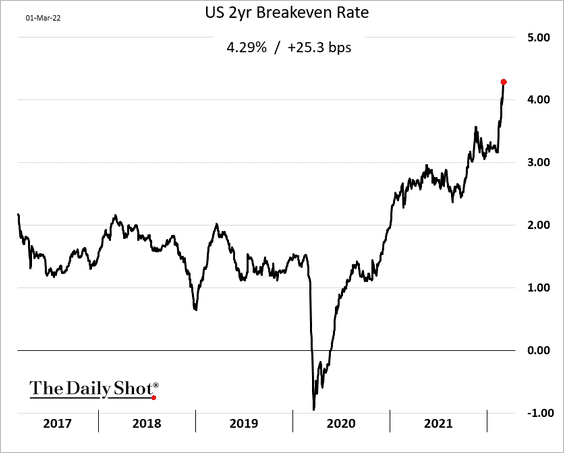
• Short-term inflation expectations are surging.
——————–
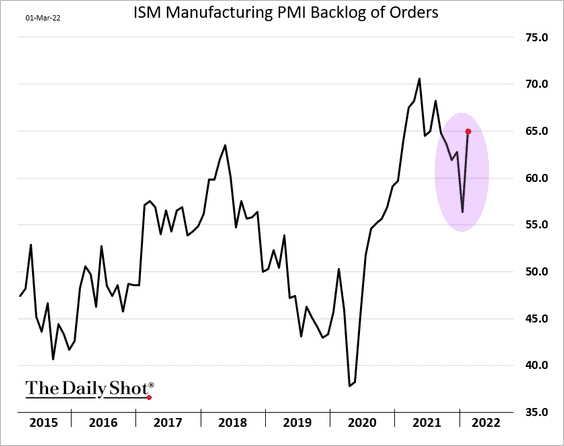
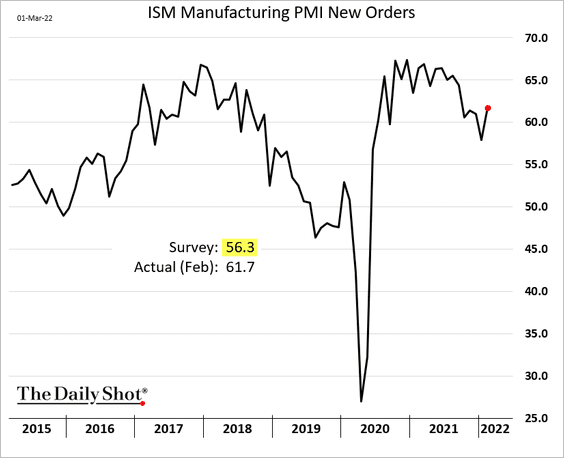
4. The ISM manufacturing PMI ticked higher last month.
 Source: @TheTerminal, Bloomberg Finance L.P.
Supply chain issues worsened again, …
… as demand increased.
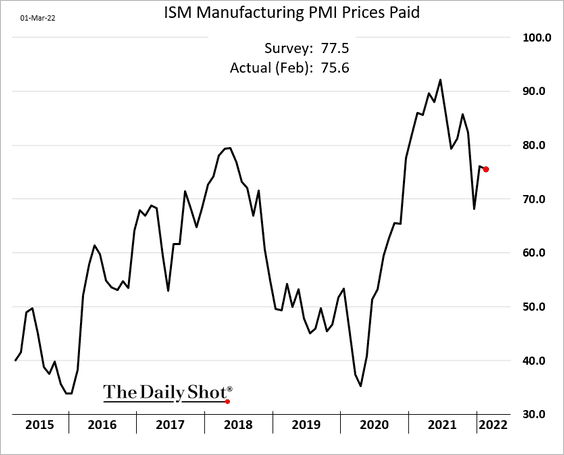
The “prices paid” index edged lower, but that was before the latest surge in energy.
——————–
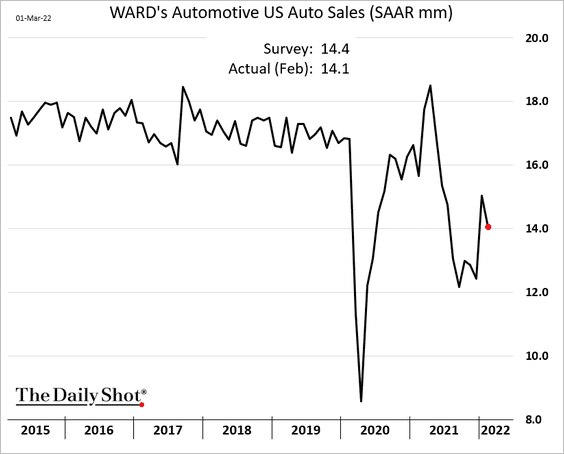
5. Automobile sales declined in February and remain well below pre-COVID levels.
6. Private construction spending continues to move higher, with non-residential expenditures gradually recovering.
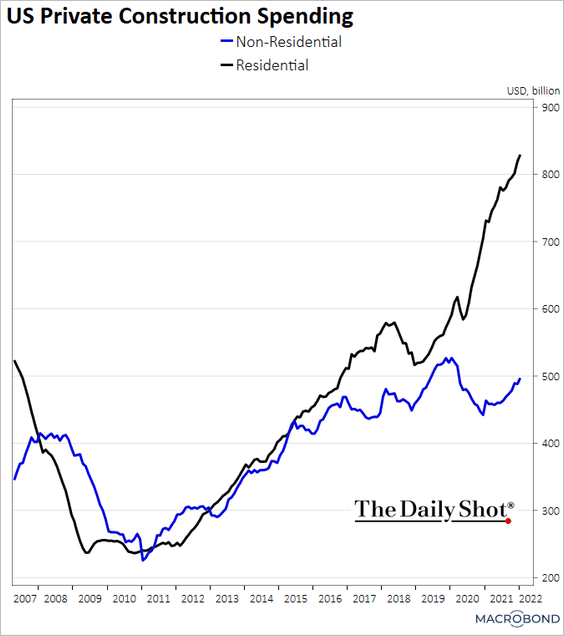 Source: Chart and data provided by Macrobond
7. Restaurant visits have rebounded from the omicron slump, which was worse than Delta for mobility.
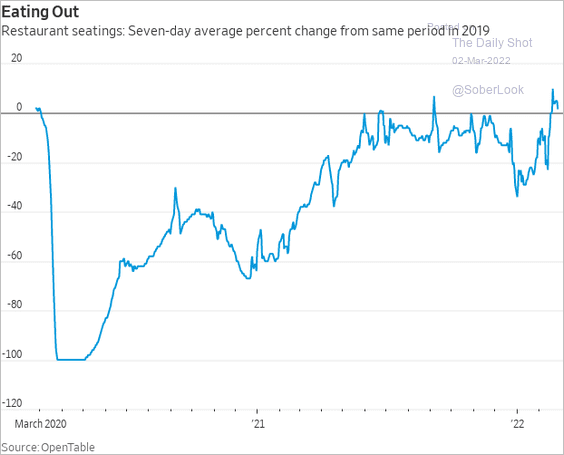 Source: @WSJ Read full article
Back to Index
Canada
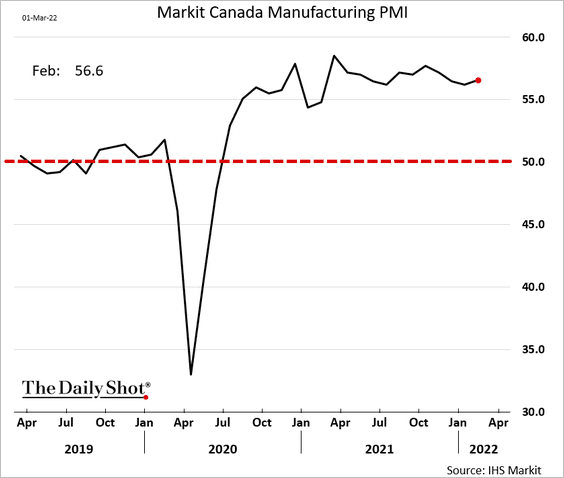
1. Factory activity has been growing at a steady pace.
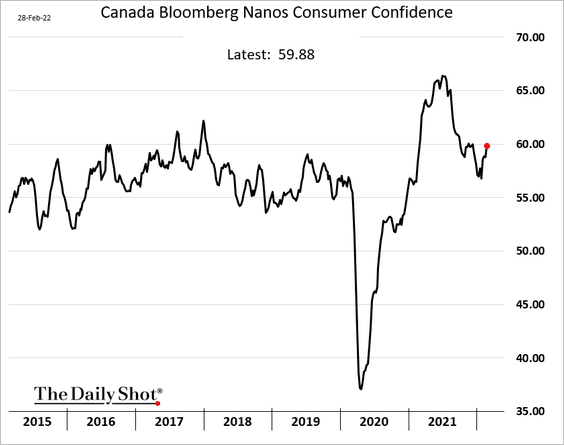
2. Consumer sentiment improved somewhat in recent weeks as omicron ebbs.
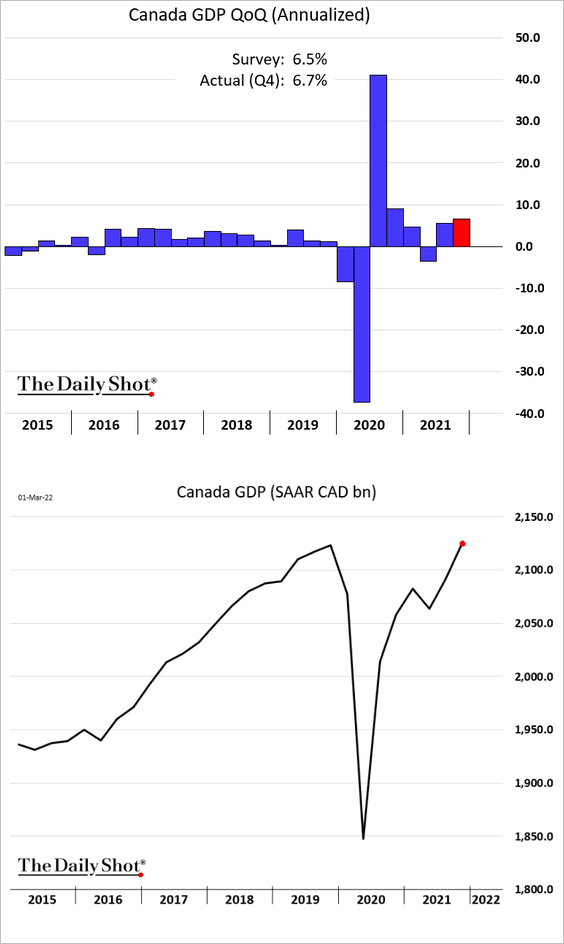
3. The Q4 GDP growth was a bit stronger than expected. The economy has now fully recovered.
4. The pandemic-era household loan growth has been impressive.
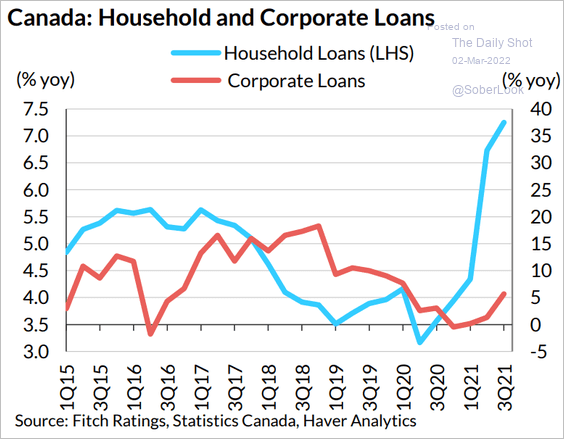 Source: Fitch Ratings
Back to Index
The United Kingdom
1. The manufacturing backlog has been receding.
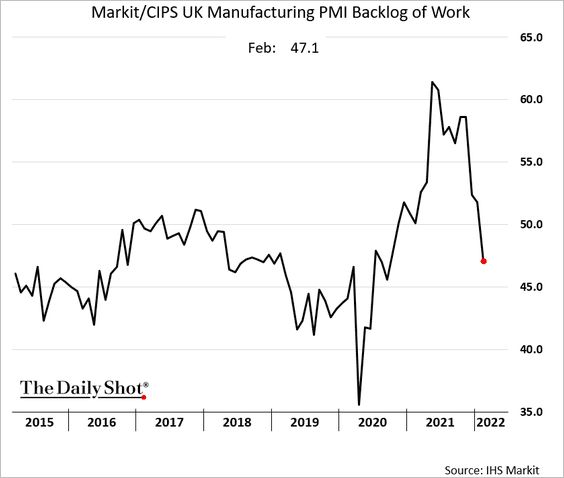
The PMI price index points to a peak in PPI growth.
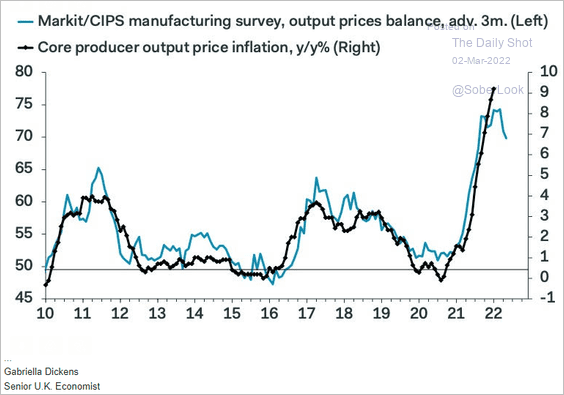 Source: Pantheon Macroeconomics
——————–
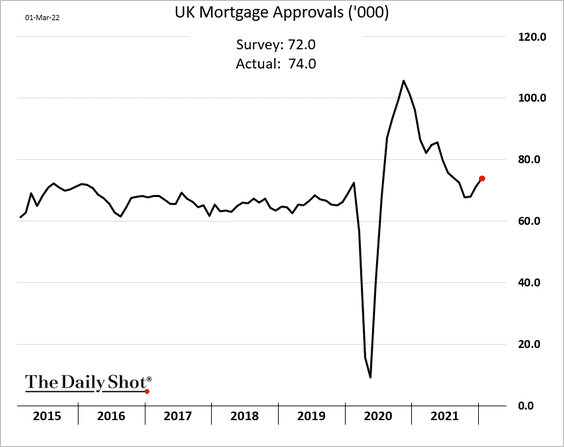
2. Mortgage approvals are rebounding.
3. Business investment should improve this year.
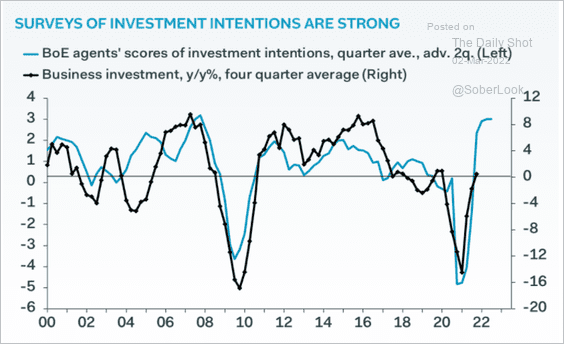 Source: Pantheon Macroeconomics
Back to Index
The Eurozone
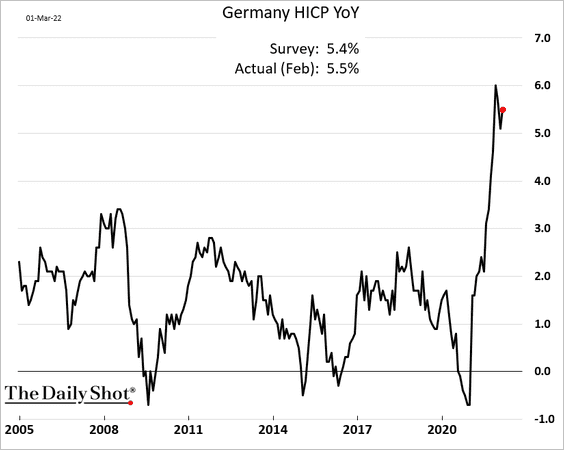
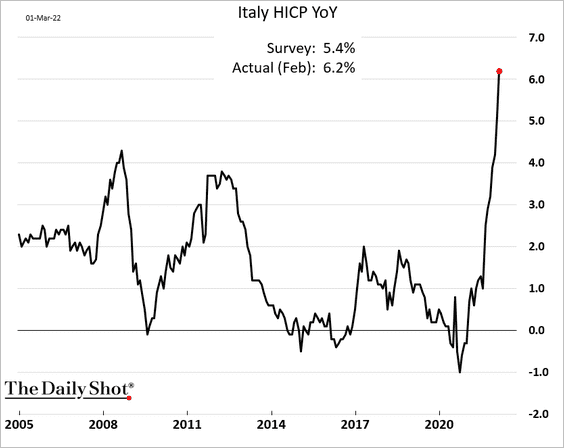
1. Inflation reports continue to surprise to the upside.
• Germany:
• Italy:
• Spain:

——————–
2. Pipeline pressures and supply chain issues have caused a sharp rise in import prices and domestic producer prices.
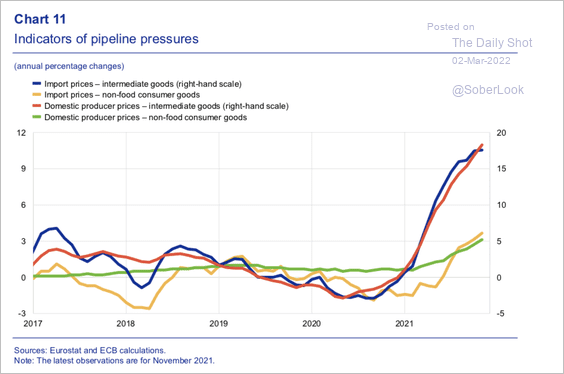 Source: ECB
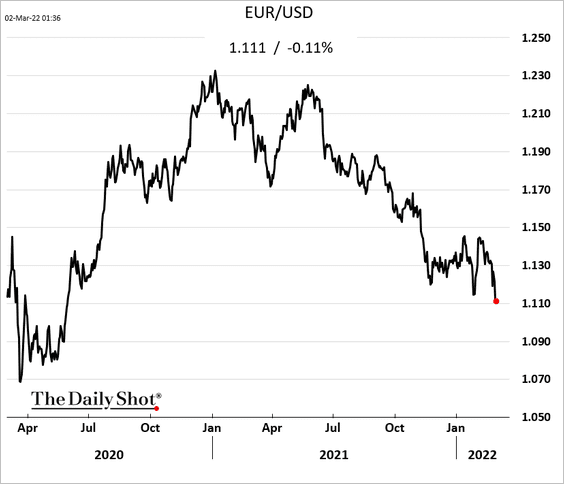
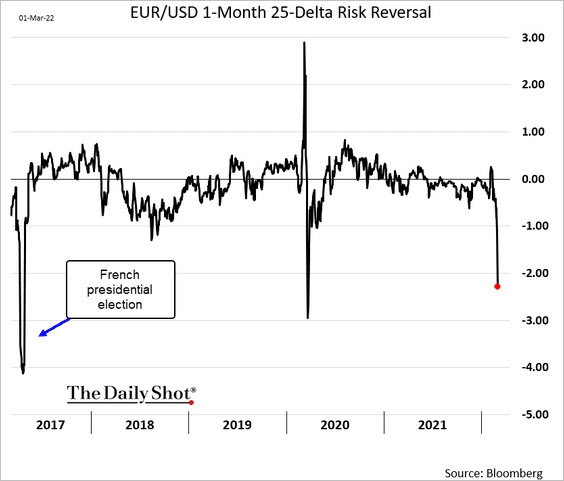
3. The euro keeps moving lower.
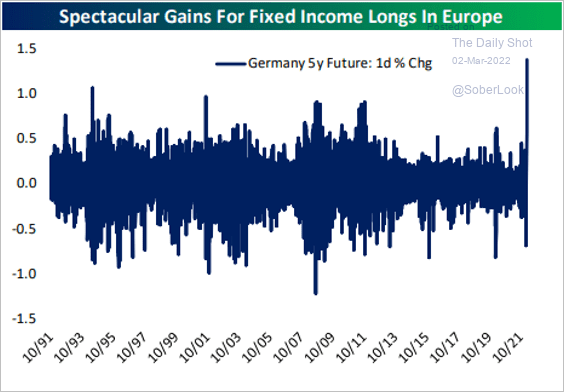
The EUR/USD risk reversal points to perceived downside risks for the euro.
Bonds continue to rally amid concerns about economic growth.
 Source: @bespokeinvest Read full article
——————–
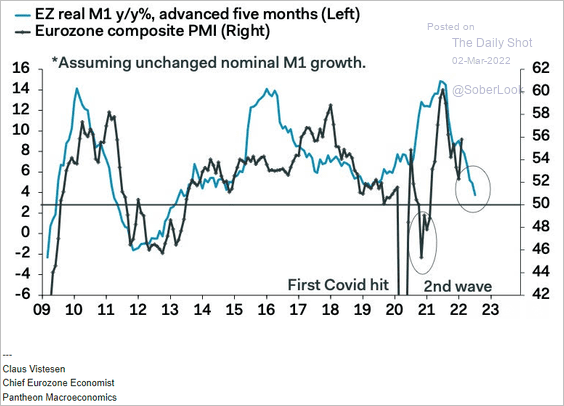
4. The money supply growth has been moderating, …
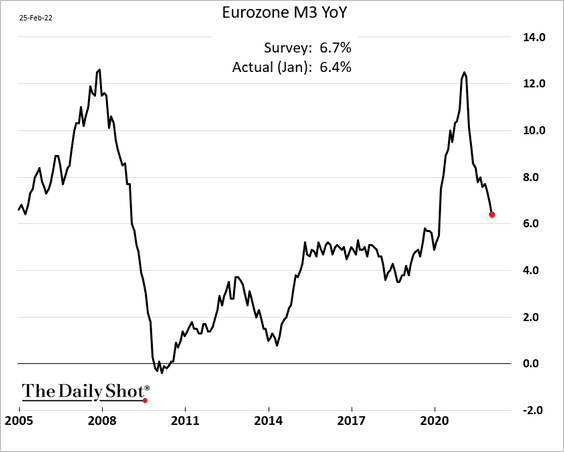
… which could result in slower business activity later this year.
 Source: Pantheon Macroeconomics
——————–
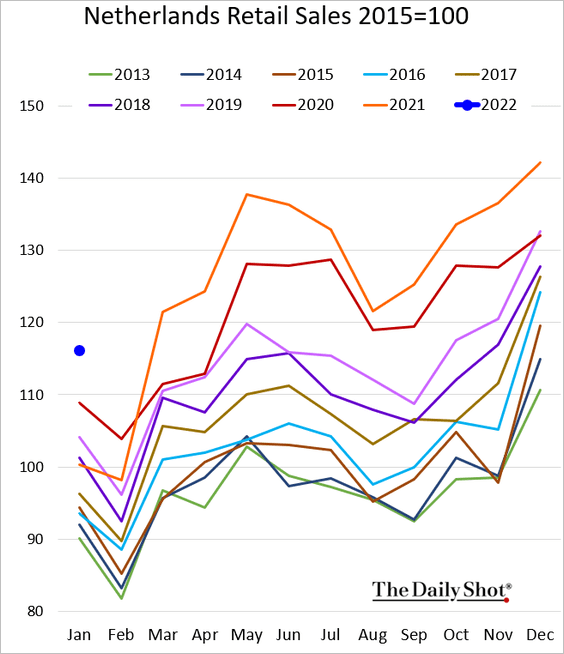
5. Dutch retail sales were quite strong in January.
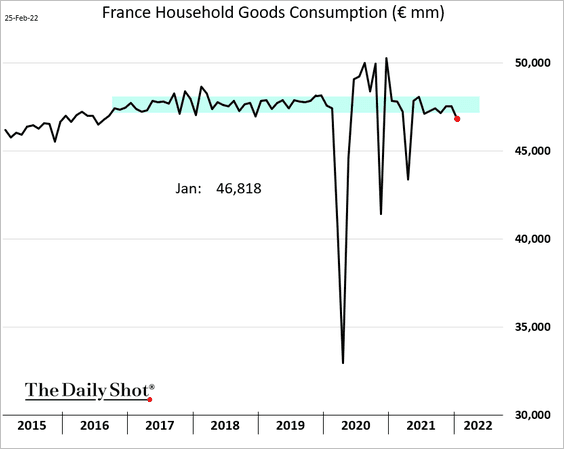
But French household consumption slowed.
Back to Index
Asia – Pacific
1. Japan’s vehicle sales last month were awful.

2. South Korea’s industrial production remains very strong.

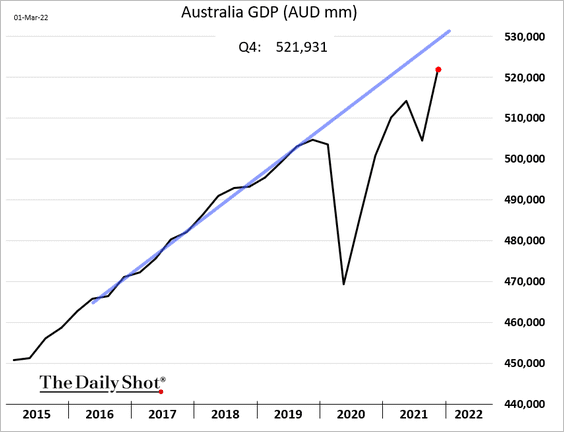
3. Australia’s GDP is approaching the pre-COVID trend.
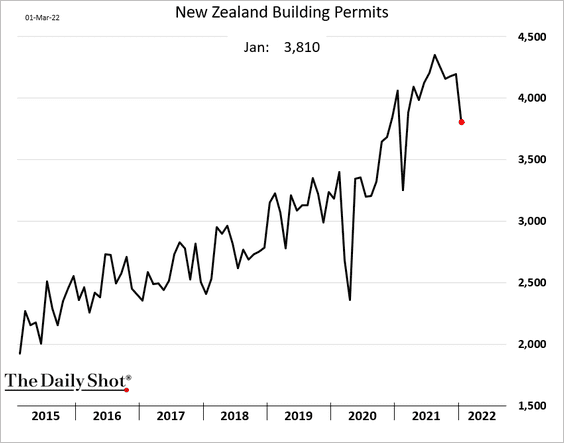
4. New Zealand’s building permits declined sharply in January.
Back to Index
China
1. Developers have been struggling to raise capital from traditional sources.
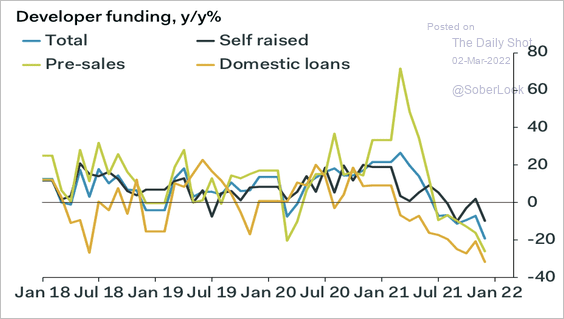 Source: Pantheon Macroeconomics
And funding squeezes result in slower construction activity.
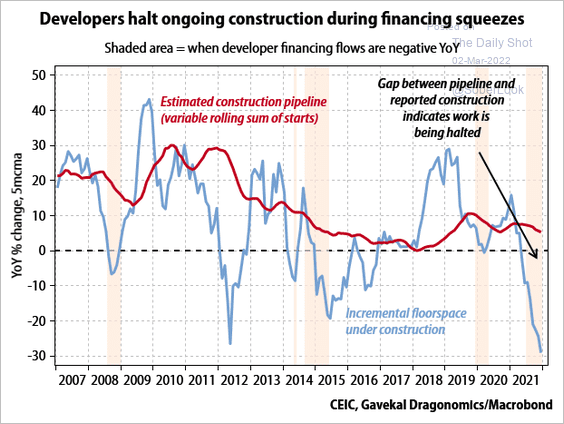 Source: Gavekal Research
——————–
2. China’s government bonds continue to outperform.
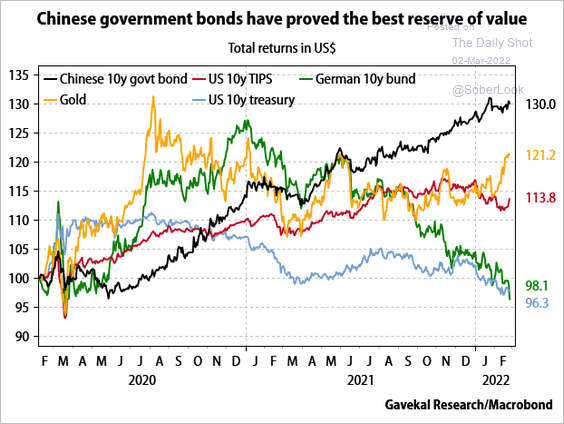 Source: Gavekal Research
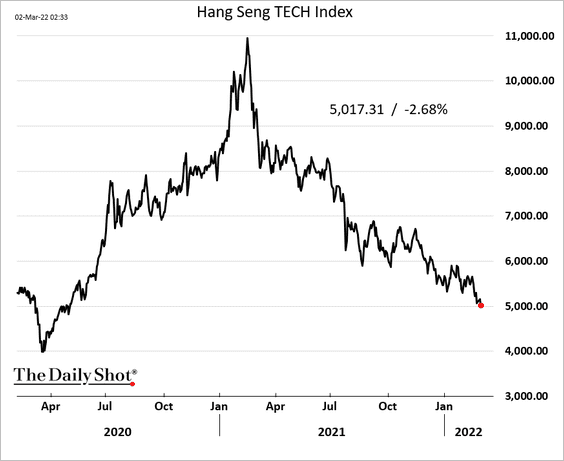
3. Tech shares in Hong Kong are trading at the lowest level since the spring of 2020.
Back to Index
Emerging Markets
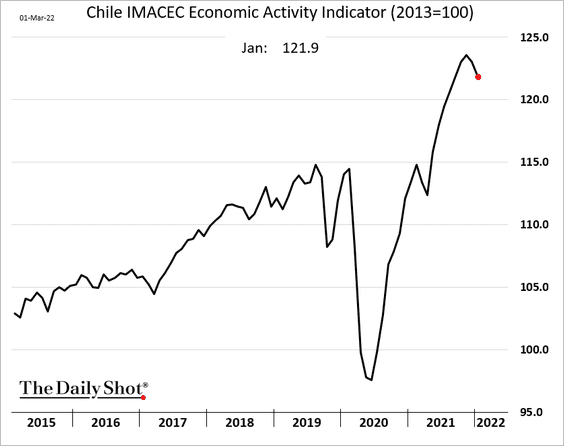
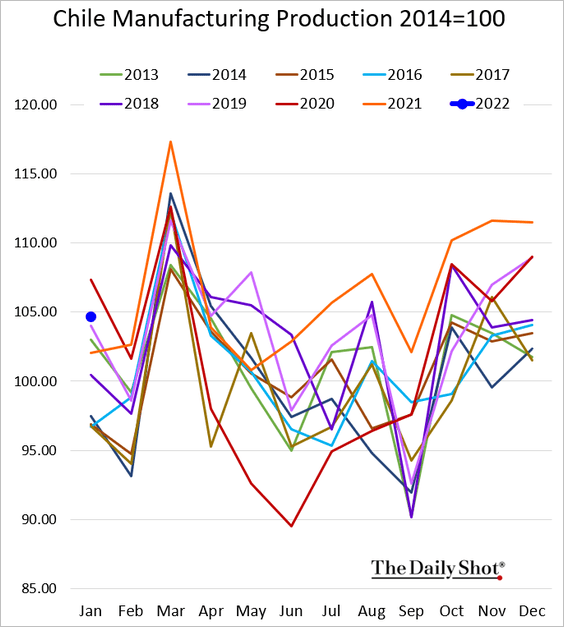
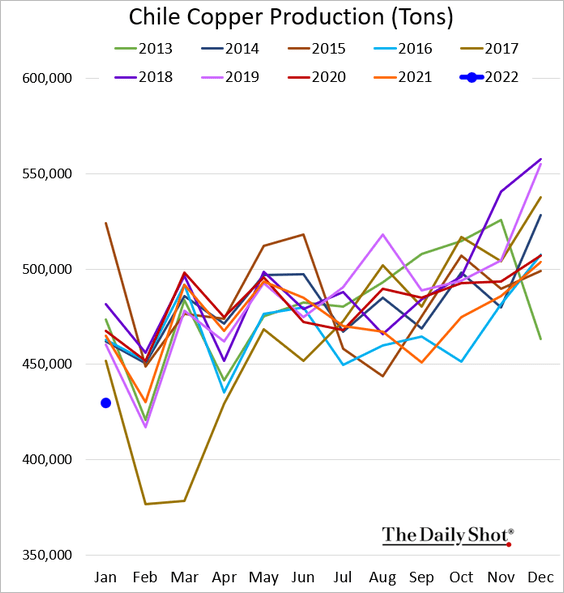
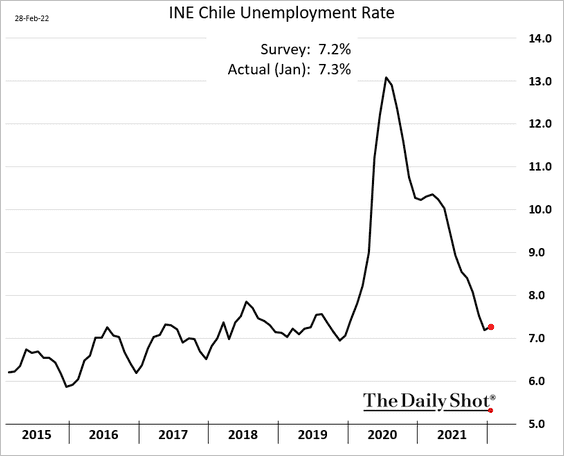
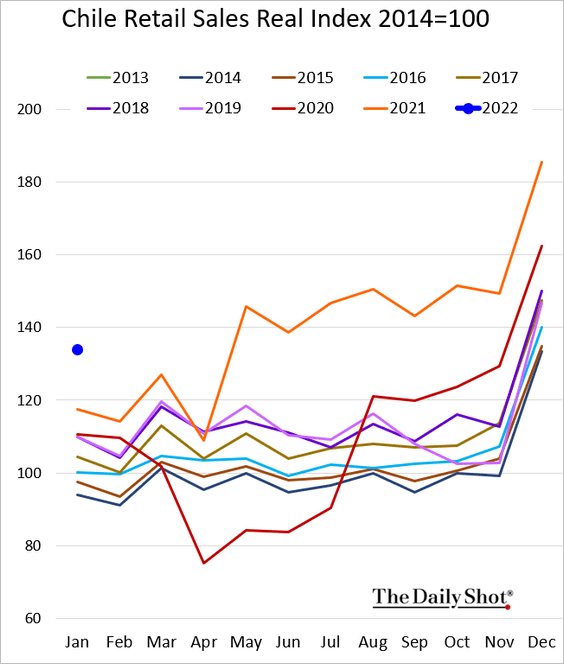
1. Let’s begin with some updates on Chile, where economic activity has been moderating.
• Economic activity:
• Industrial production:
• Copper production:
• The unemployment rate:
• Retail sales (very strong in January):
——————–
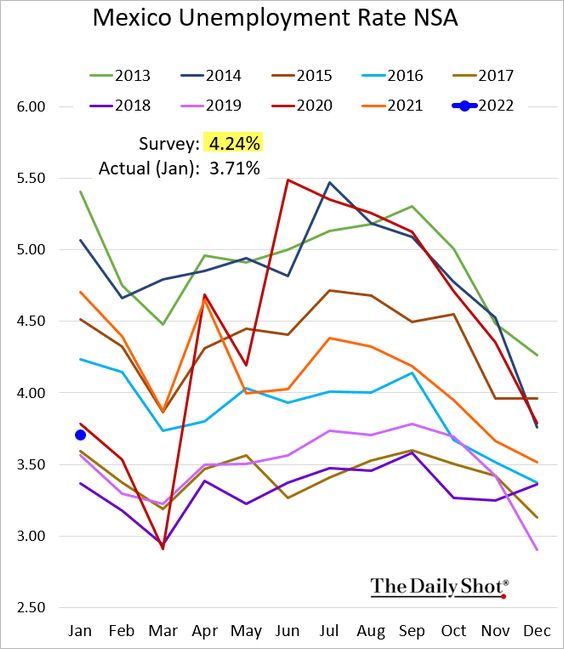
3. Mexico’s unemployment rate is below pre-COVID levels.
Factory activity remains in contraction territory.
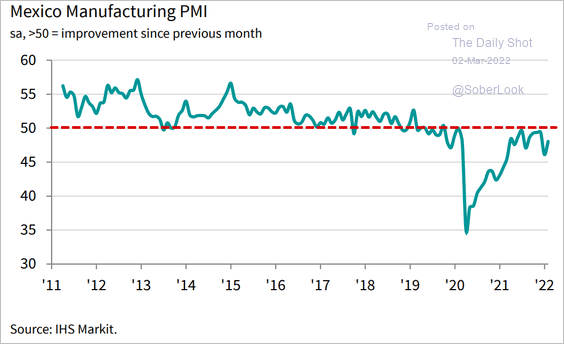 Source: IHS Markit
——————–
4. India’s PMI shows steady growth.
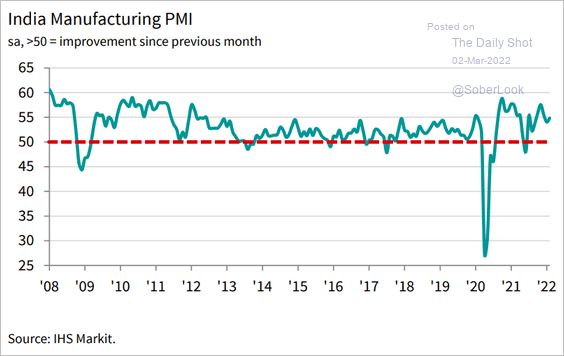 Source: IHS Markit
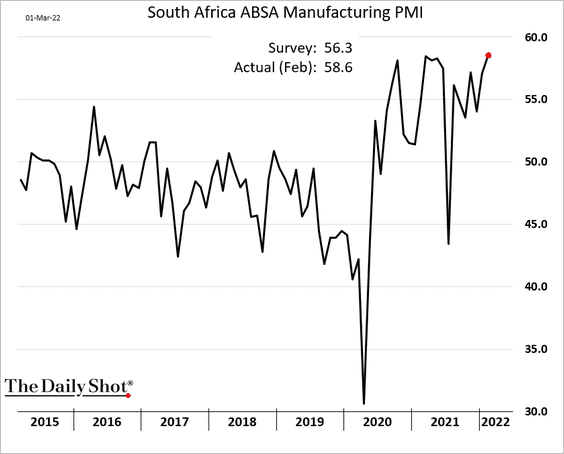
5. South Africa’s manufacturing PMI hit a multi-year high.
Separately, here is South Africa’s per-capita GDP.
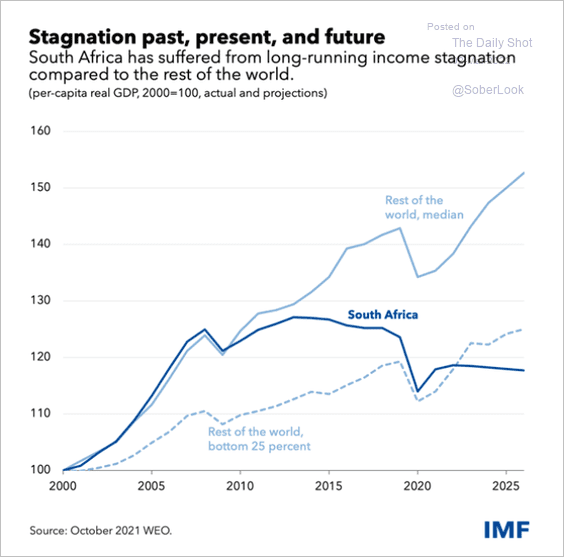 Source: IMF Read full article
——————–
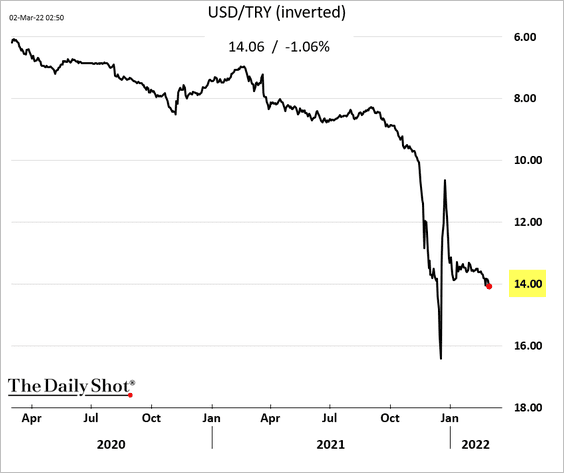
6. The Turkish lira weakened past 14 to the dollar again.
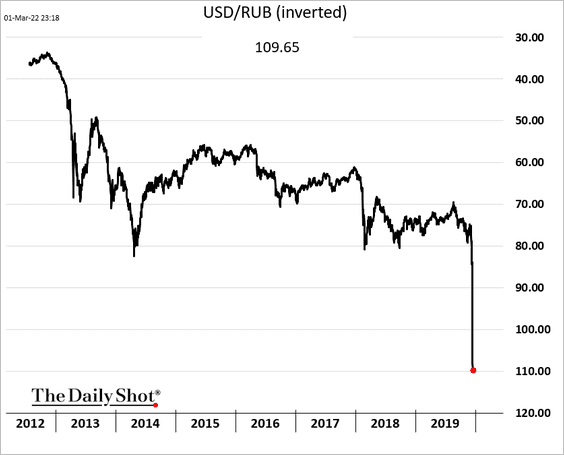
7. Finally, we have some updates on Russia.
• The ruble keeps hitting new lows.
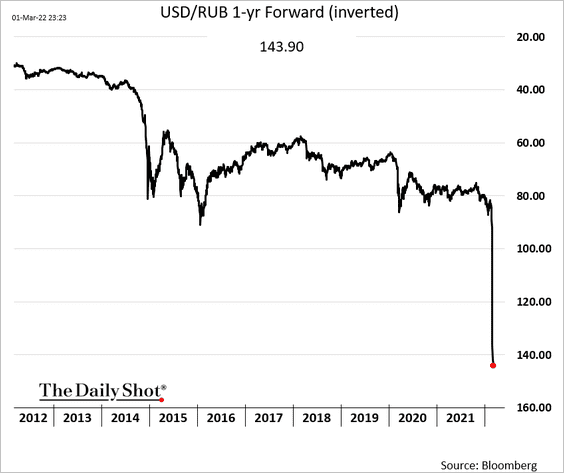
Here is the USD/RUB 12-month forward.
• This chart illustrates this collapse in Russia’s USD-denominated government bonds as coupon payments are shut off.
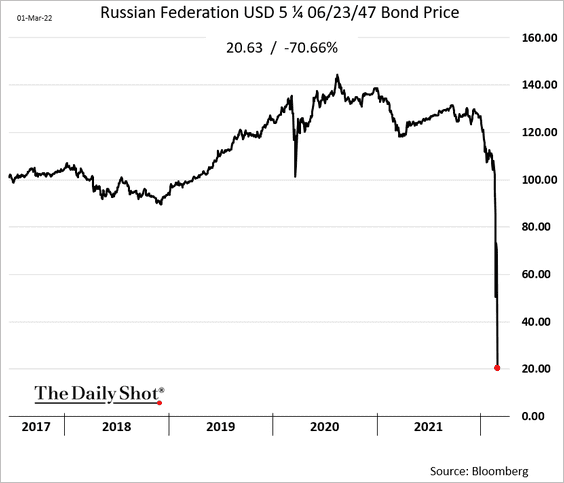
 Source: Bloomberg Read full article
• Factory activity was already slowing before the start of the war.
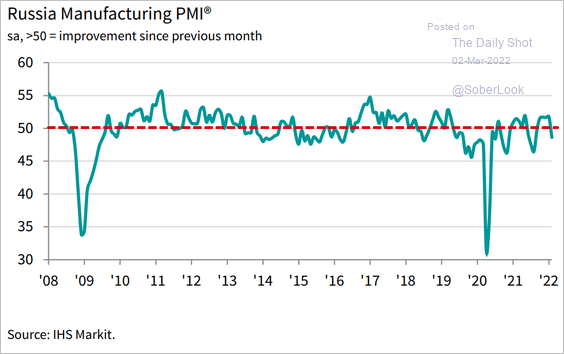 Source: IHS Markit
Back to Index
Cryptocurrency
1. XRP outperformed other large cryptocurrencies last month, while BTC was higher than most altcoins.
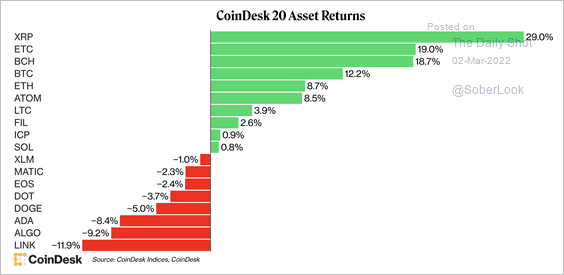 Source: CoinDesk
2. Bitcoin’s sharp rebound over the past few days contributed to its positive return in February, well ahead of traditional markets.
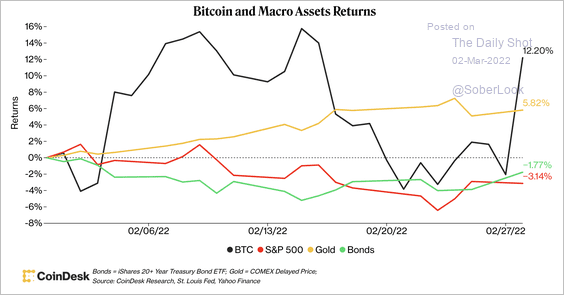 Source: CoinDesk Read full article
3. Over 10% of the bitcoin supply returned to profit on Monday, according to blockchain data that compares the market price to the average cost basis.
 Source: @glassnode
4. On average, March tends to be a tough month for bitcoin.
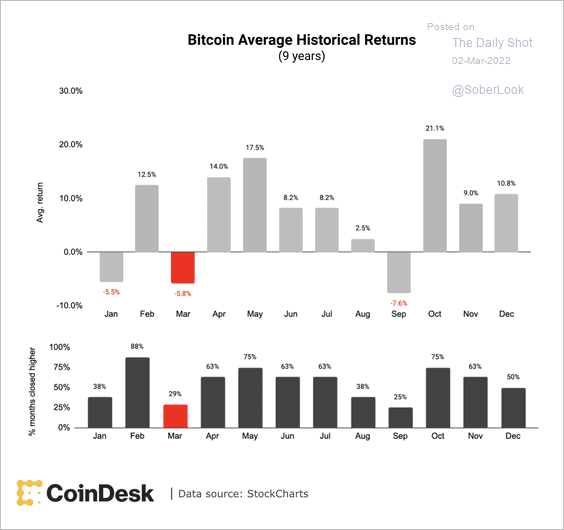 Source: CoinDesk Read full article
Back to Index
Commodities
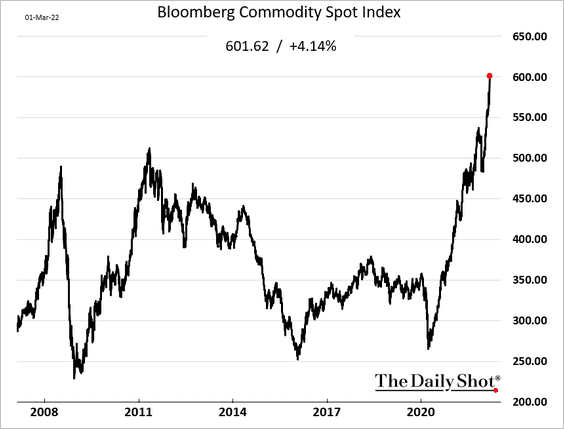
1. Bloomberg’s spot commodity index continues to hit record highs.
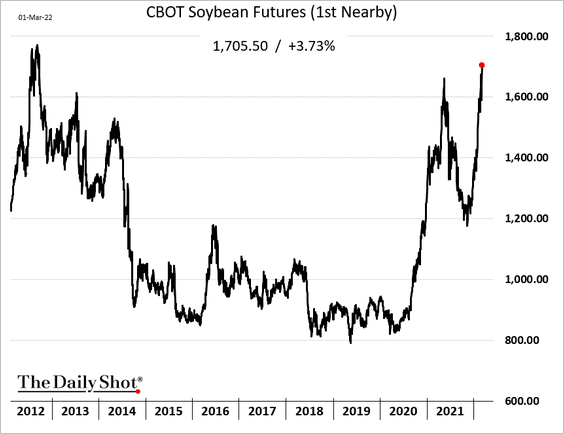
2. Wheat prices broke through $10 per bushel as Russia’s invasion halts the Black Sea trade.
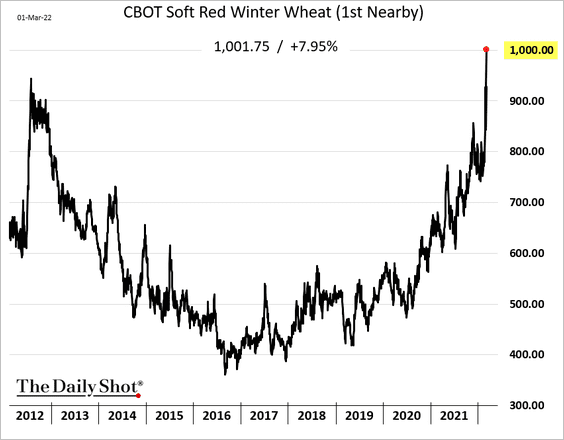
Soybean futures are surging as well.
——————–
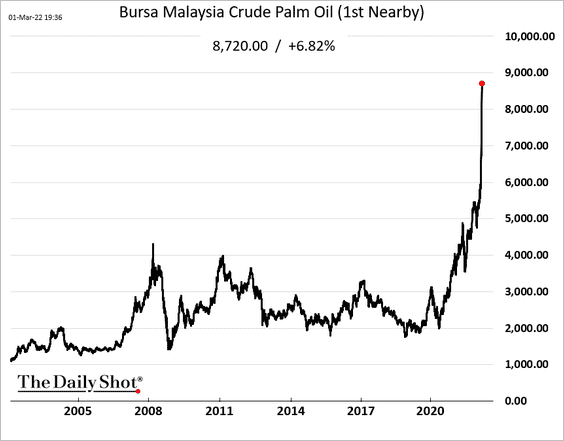
3. Palm oil has gone vertical.
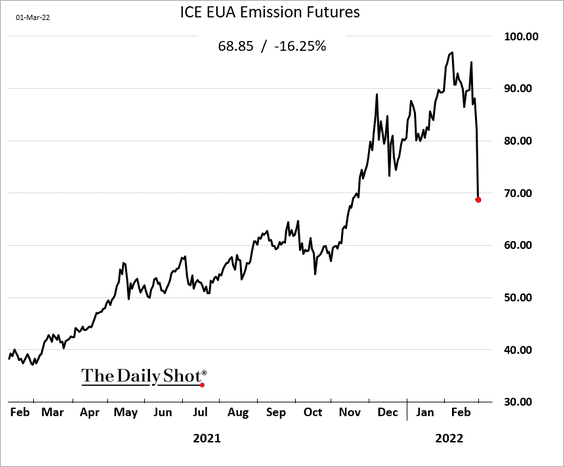
4. The European emissions contract tumbled on Tuesday.
 Source: @business Read full article
——————–
5. Copper production is not keeping up with GDP growth.
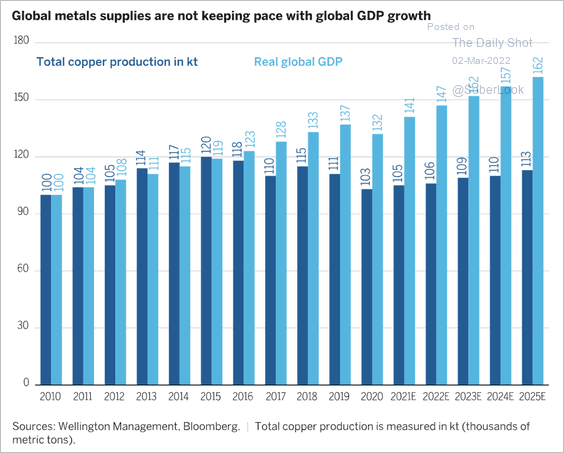 Source: @trevornoren; Wellington Management Read full article
Back to Index
Energy
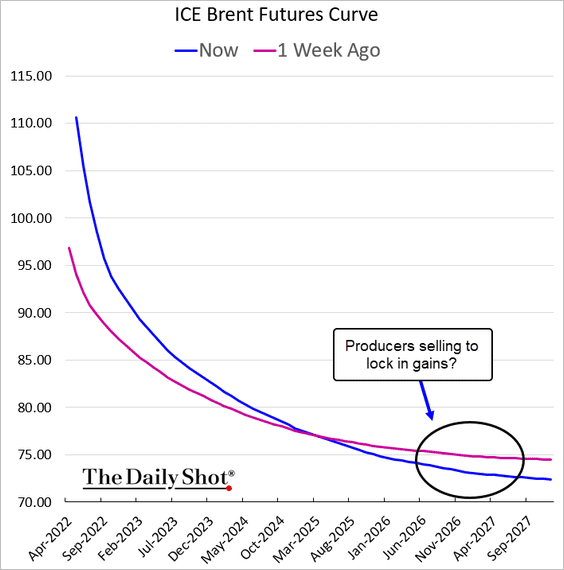
1. Brent’s backwardation continues to hit record highs.
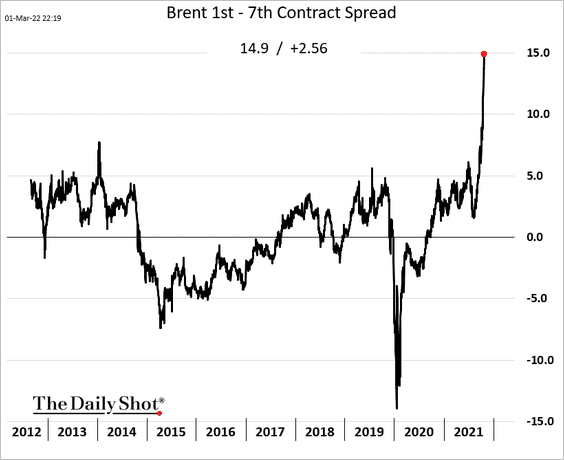
Here is the WTI 1st-2nd contract spread.
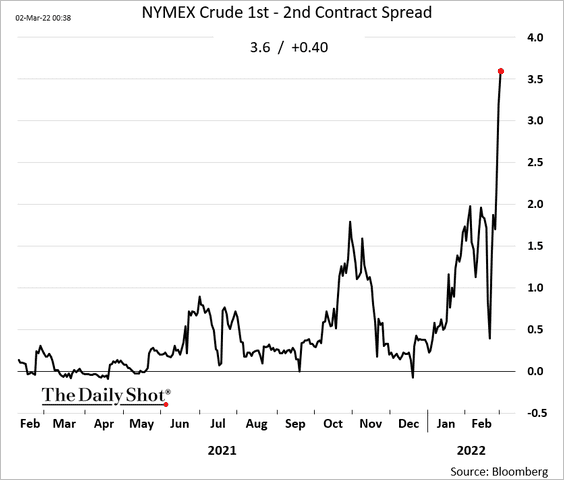 h/t @helloimserene
——————–
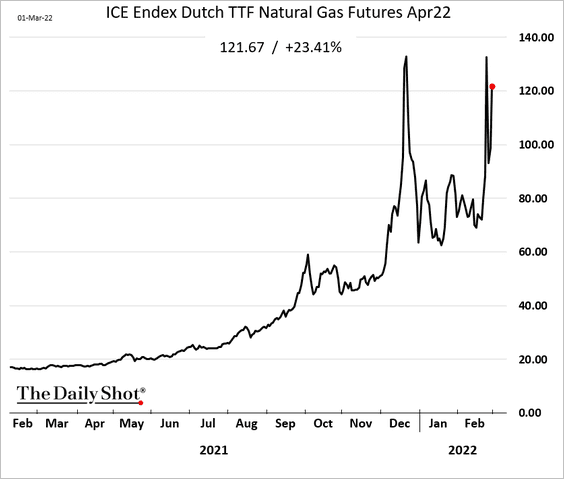
2. European natural gas is trading near the highs.
This chart shows natural gas entering the EU from Ukraine.
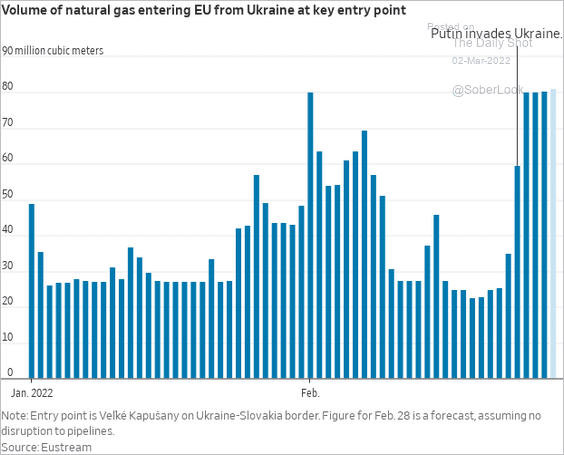 Source: @WSJ Read full article
Back to Index
Equities
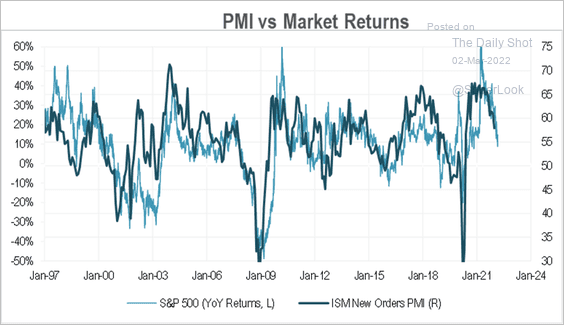
1. The ISM PMI peak last year points to slower sales growth and weaker performance ahead (2 charts).
 Source: @RichardDias_CFA
 Source: Michael Kantrowitz, Piper Sandler
——————–
2. Are US earnings projections too optimistic?
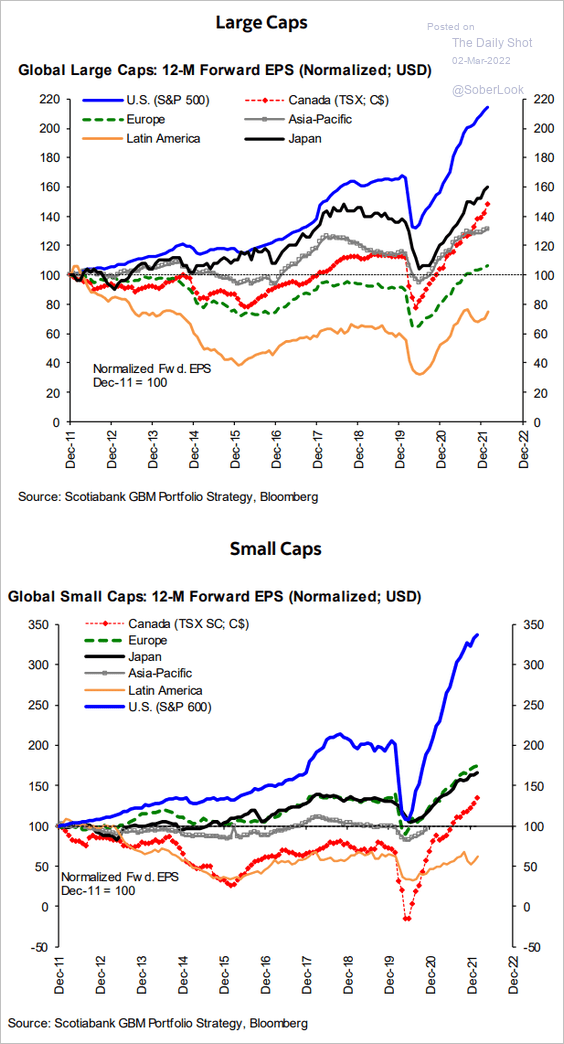 Source: Hugo Ste-Marie, Portfolio & Quantitative Strategy Global Equity Research, Scotia Capital
3. A support line at 18x P/E valuation?
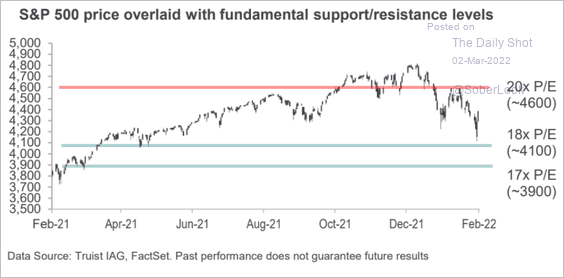 Source: Truist Advisory Services
4. Small option traders aggressively bought puts over the past week.
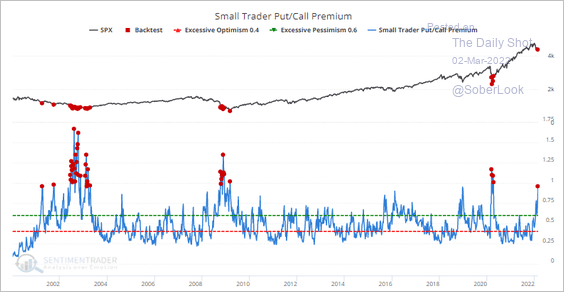 Source: SentimenTrader
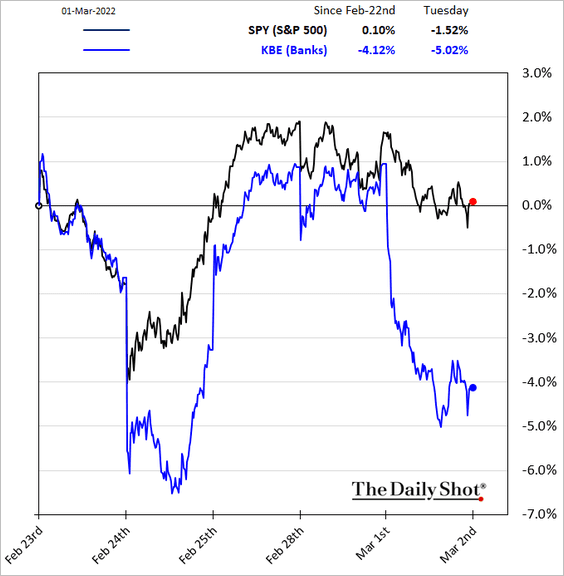
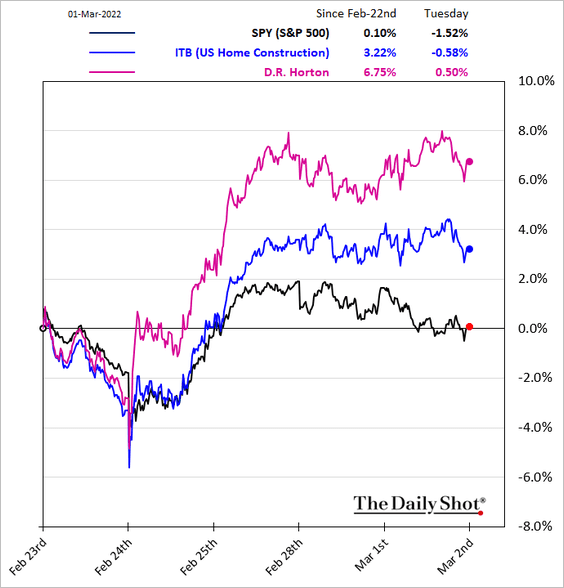
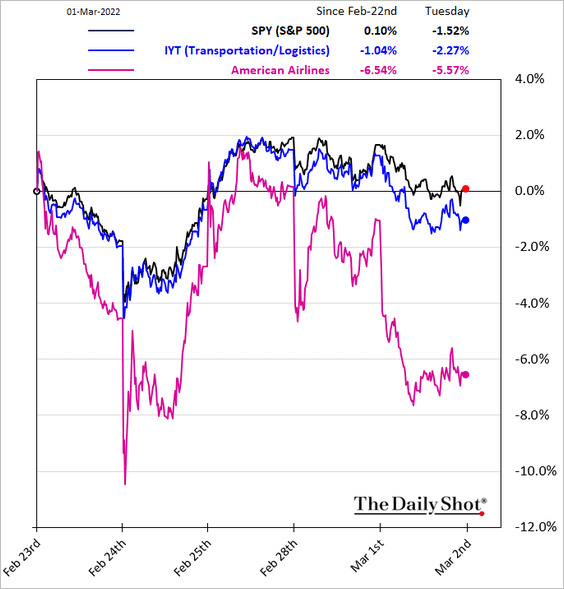
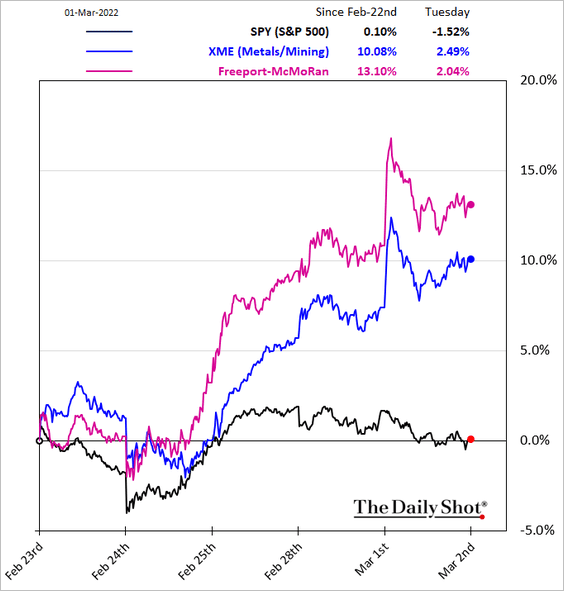
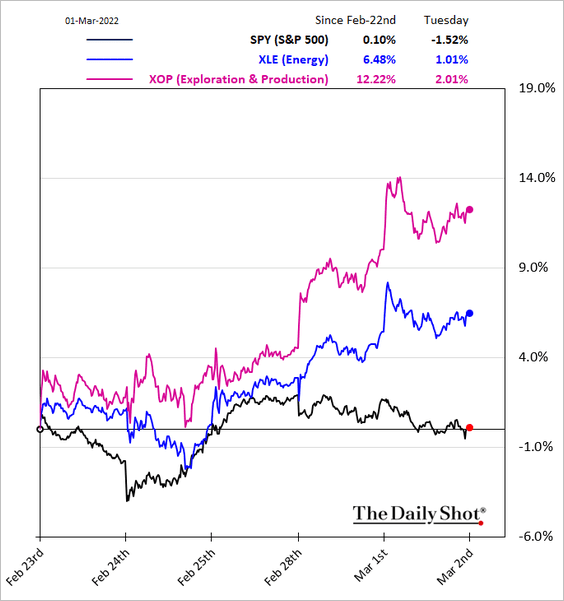
5. Next, we have some sector updates.
• Banks (hurt by falling Treasury yields):
• Housing (helped by lower Treasury yields):
• Transportation (hit by surging fuel prices):
• Metals & Mining:
• Energy:
——————–
6. Finally, this chart shows last month’s large-cap performance around the world.
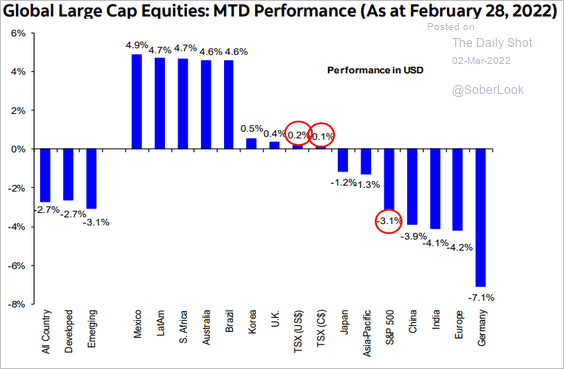 Source: Hugo Ste-Marie, Portfolio & Quantitative Strategy Global Equity Research, Scotia Capital
Back to Index
Credit
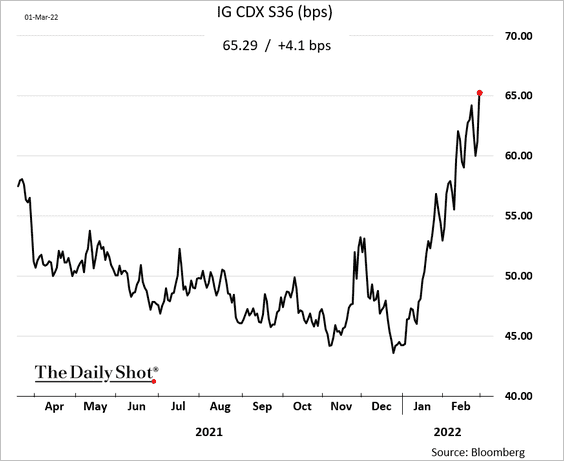
1. Investment-grade corporate CDS spreads keep widening.
2. US corporations have issued more debt than equity (preference for share buybacks) over the past year.
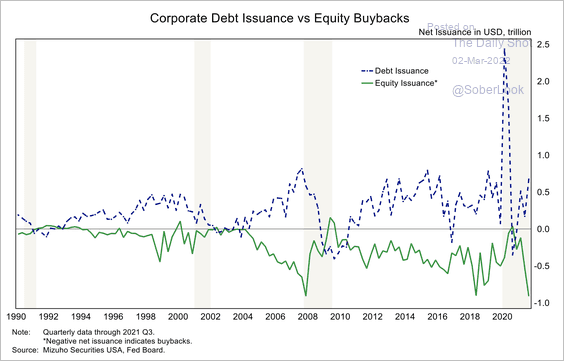 Source: Mizuho Securities USA
Back to Index
Rates
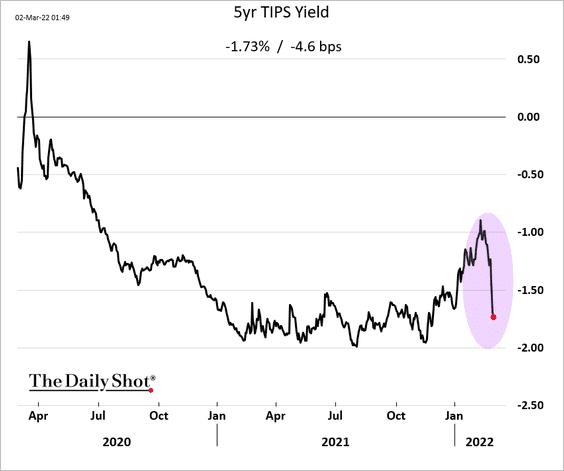
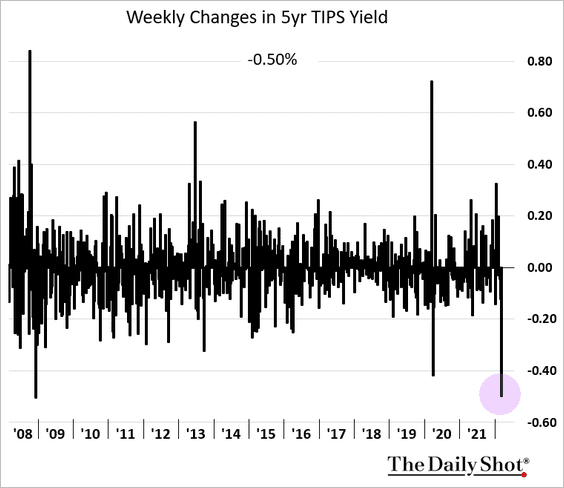
1. Real rates tumbled this week (2 charts).
——————–
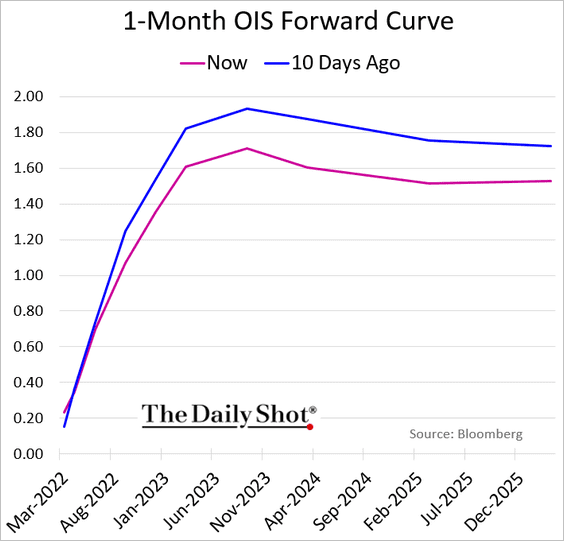
2. The market has downshifted Fed rate hike expectations. This chart shows the expected trajectory of short-term rates over the next few years.
——————–
Food for Thought
1. Rerouting flights:
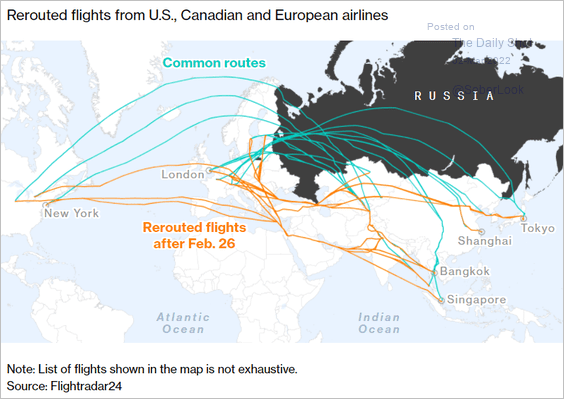 Source: Bloomberg Read full article
2. Russia’s control of terrain in Ukraine:
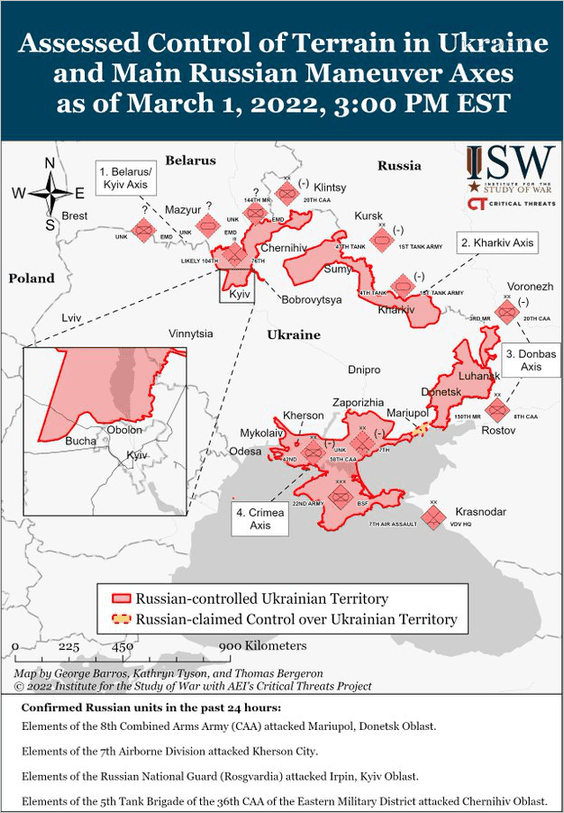 Source: @TheStudyofWar, @criticalthreats Read full article
3. Who is justifying the use of force against Ukraine?
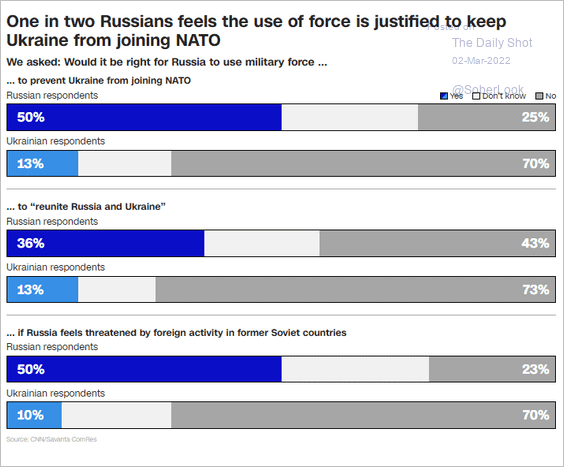 Source: CNN Read full article
4. 2021 customer growth at post-IPO companies:
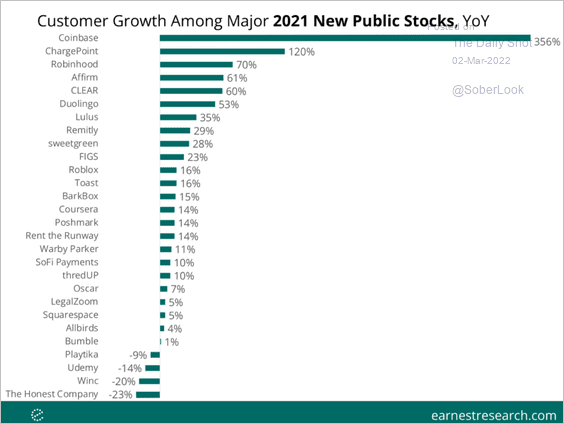 Source: Earnest
5. Disney’s parks business:
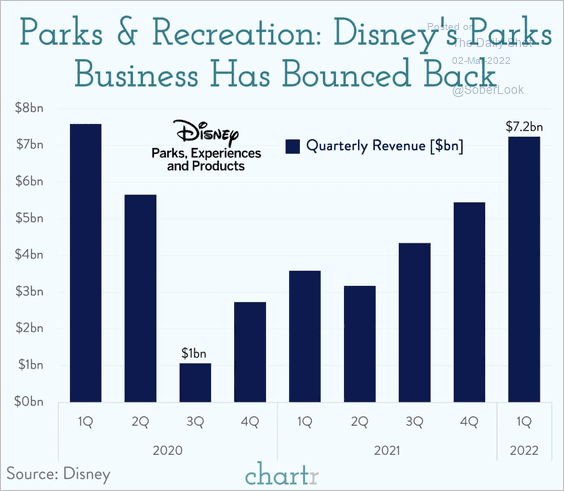 Source: @chartrdaily
6. E-commerce unicorns:
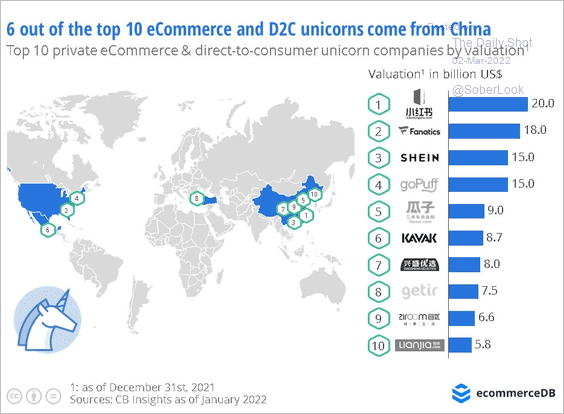 Source: EcommerceDB Read full article
7. Pfizer’s 2021 fiscal year:
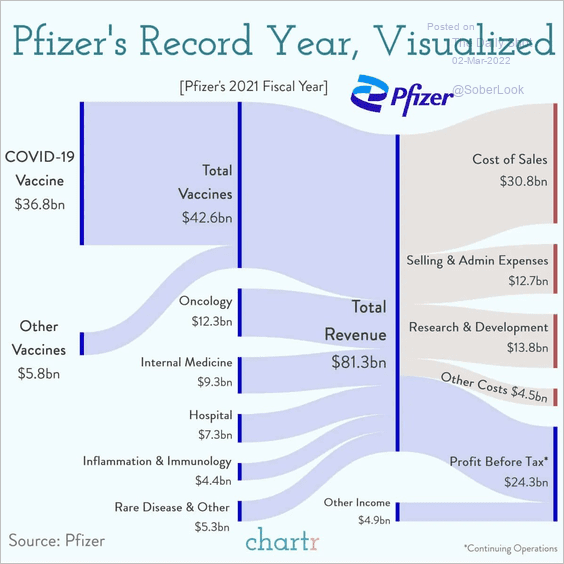 Source: @chartrdaily Read full article
8. Sports betting:
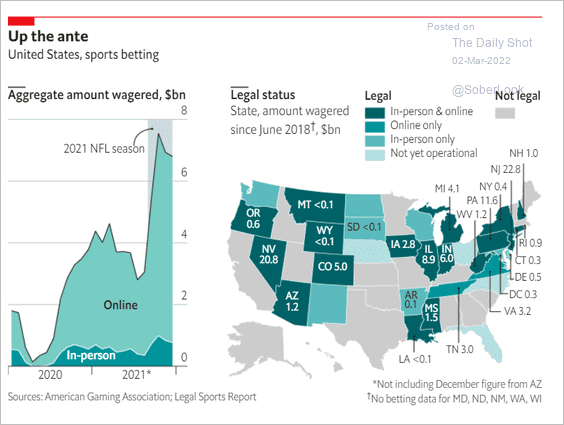 Source: The Economist Read full article
9. Solar activity and protest movements (a spurious correlation?):
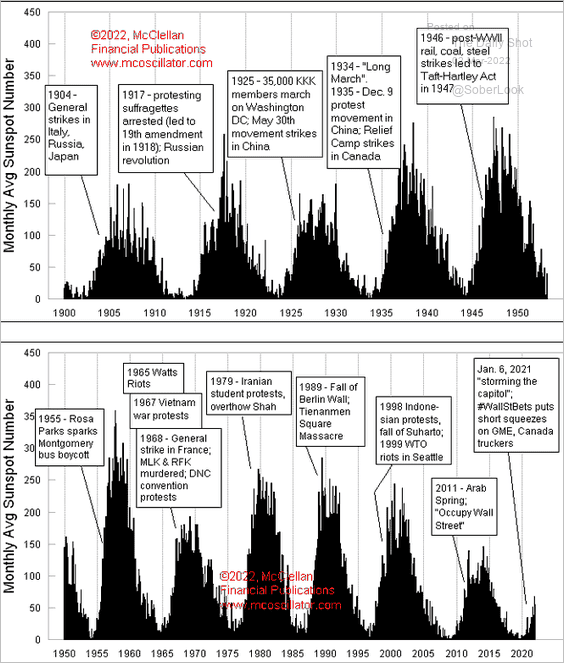 Source: @McClellanOsc Read full article
——————–
Back to Index