
The Daily Shot: 03-Mar-22
• Commodities
• Energy
• Equities
• Credit
• Rates
• Cryptocurrency
• Emerging Markets
• China
• Asia – Pacific
• The Eurozone
• The United Kingdom
• Canada
• The United States
• Food for Thought
Commodities
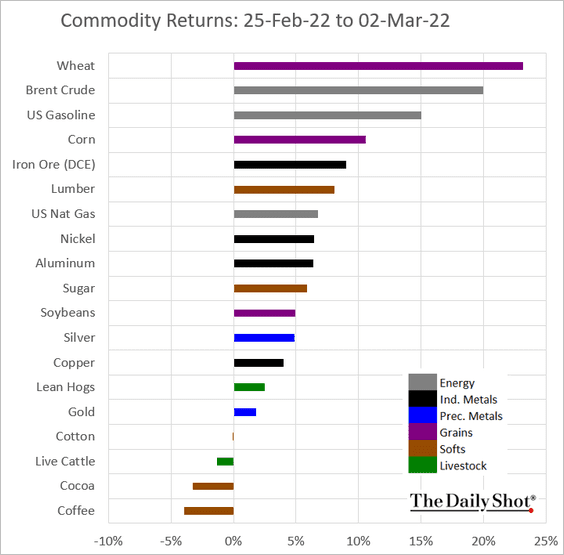
1. Commodities have posted the biggest weekly gain since the mid-1970s, with massive increases in prices of grains, energy, and industrial metals.
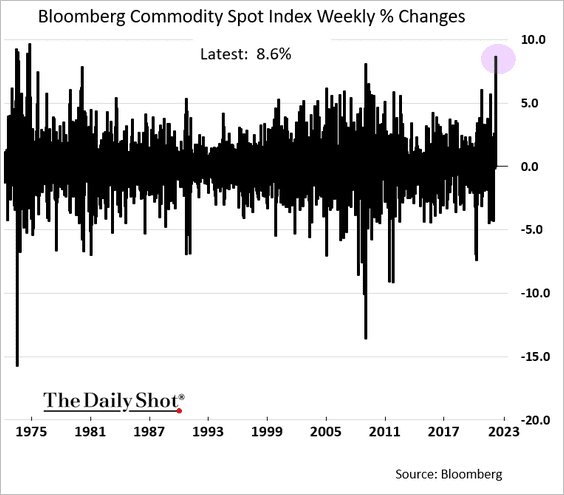 h/t Sunil Jagtiani
The Invesco Commodity ETF (DBC) has further room toward upper resistance levels.
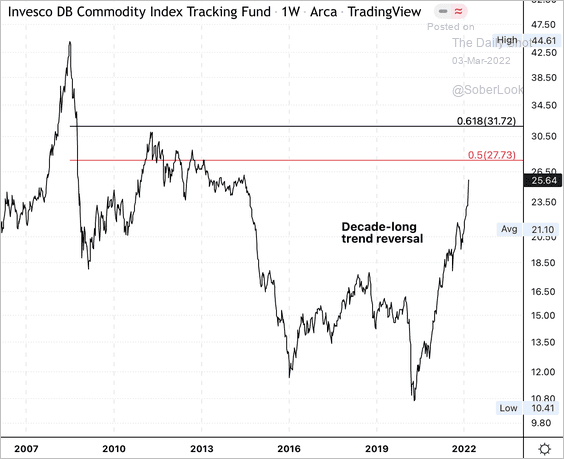 Source: Dantes Outlook
——————–
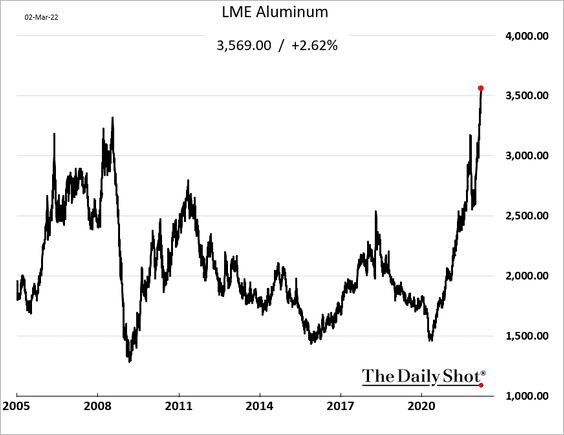
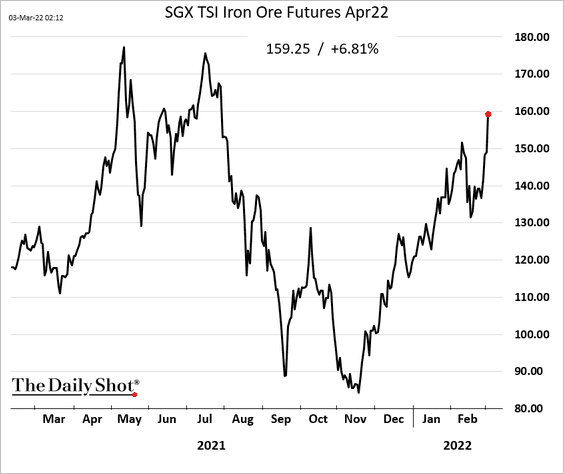
2. Industrial commodities continue to surge.
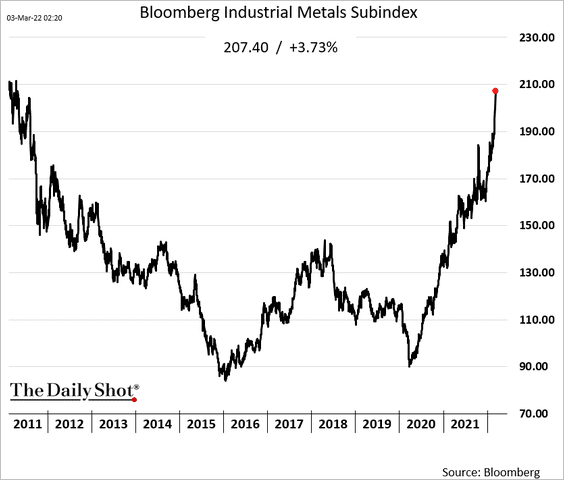
• Aluminum hit another record high.
• Iron ore has nearly recovered last year’s losses.
Over the long-term, Fitch expects iron ore prices to trend downwards as lower Chinese steel production and higher output from global producers continue to loosen the market.
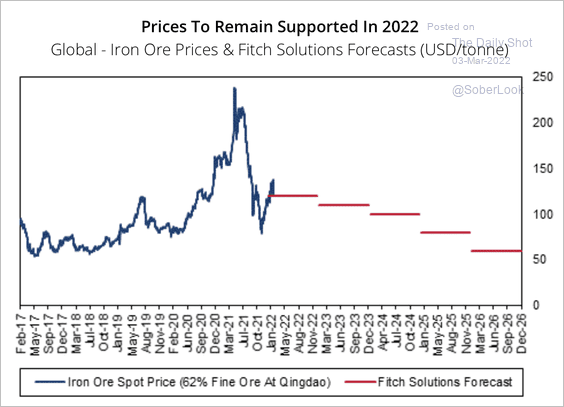 Source: Fitch Solutions Macro Research
Brazil could see a rebound in iron ore production over the next few years.
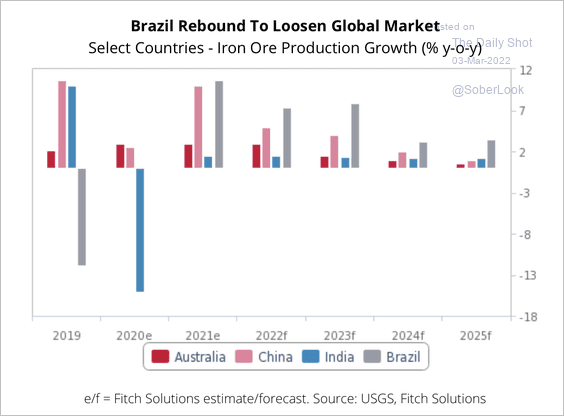 Source: Fitch Solutions Macro Research
——————–
3. Commodity inventories have been drawing down to near-record lows over the past year.
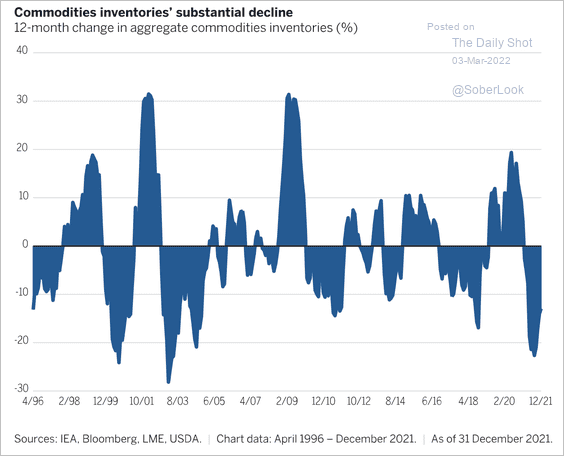 Source: Trevor Noren, Wellington Management Read full article
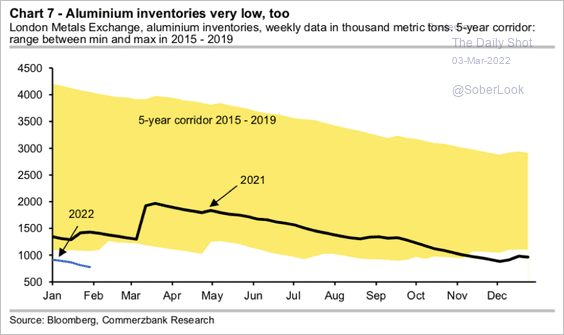
Copper and aluminum inventories remain extremely low (2 charts).
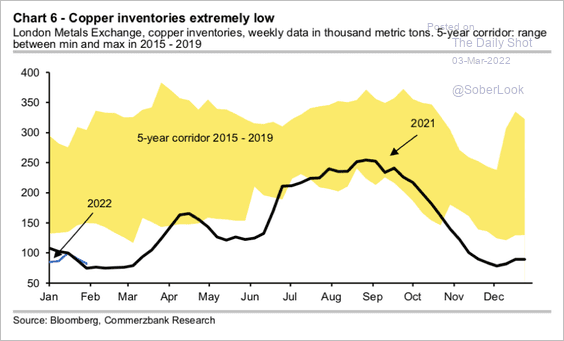 Source: Commerzbank Research
 Source: Commerzbank Research
——————–
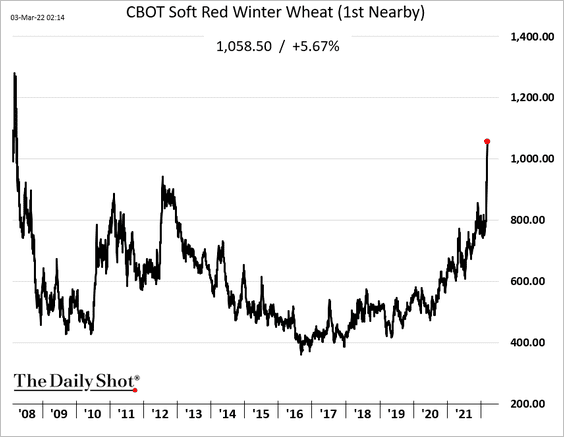
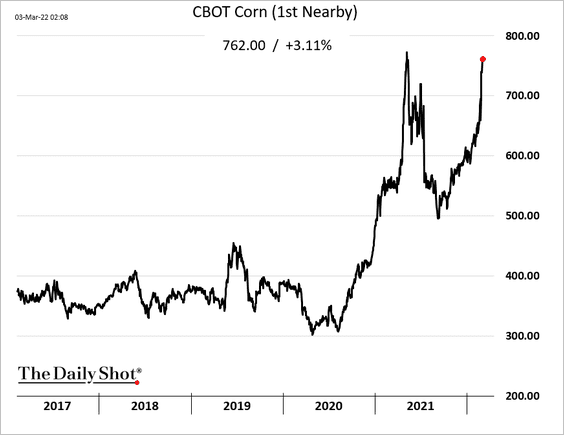
4. Wheat continues to surge.
US corn futures are nearing last year’s peak.
——————–
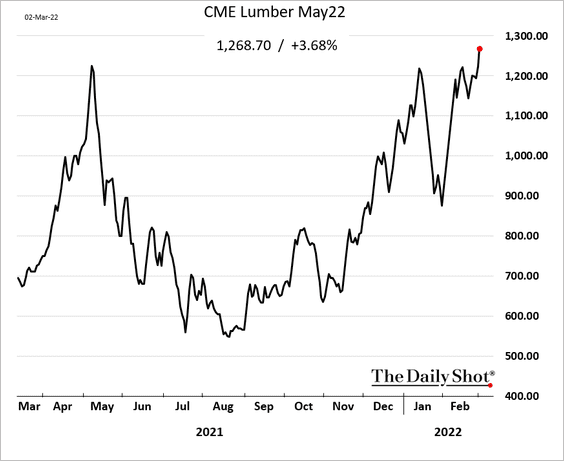
5. US lumber futures have been rallying.
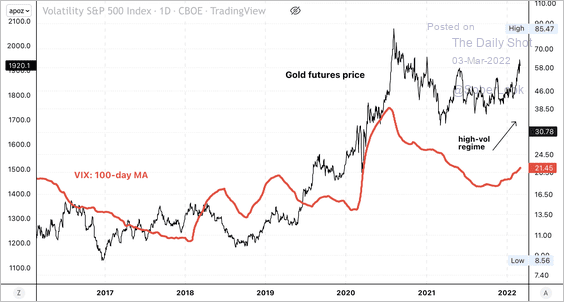
6. Gold tends to perform well when volatility rises.
 Source: Dantes Outlook
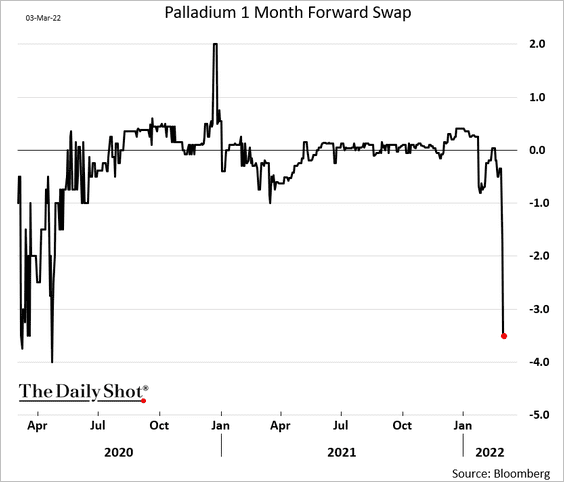
Palladium is in deep backwardation amid concerns about Russian supplies.
 h/t @helloiamyvonne
——————–
7. Fitch expects a surplus in global sugar production.
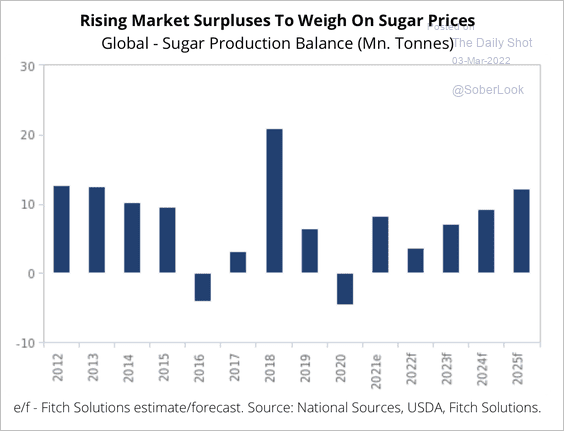 Source: Fitch Solutions Macro Research
Brazil is also expected to increase its sugar output, which could weigh on prices.
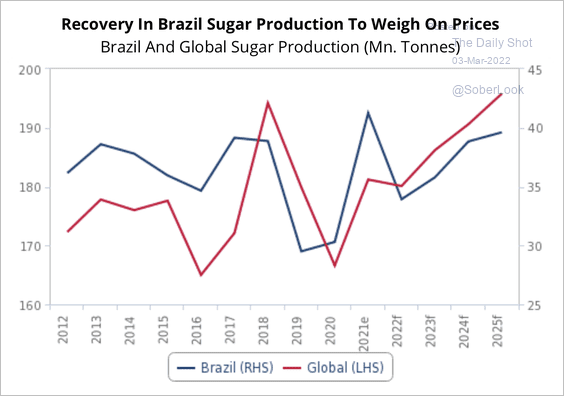 Source: Fitch Solutions Macro Research
Back to Index
Energy
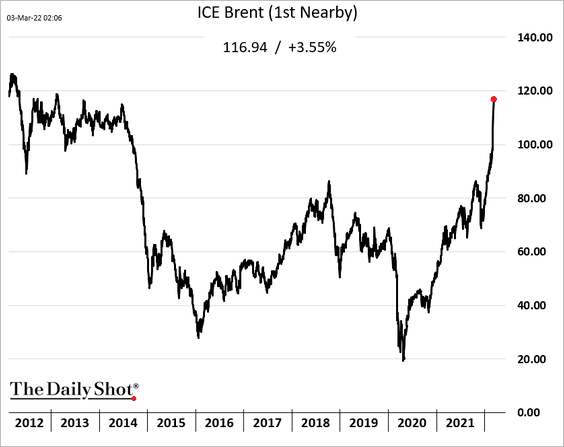
1. Brent crude is nearing $117/bbl, the highest level in a decade.
• How high can oil prices rise? These scenarios already look stale.
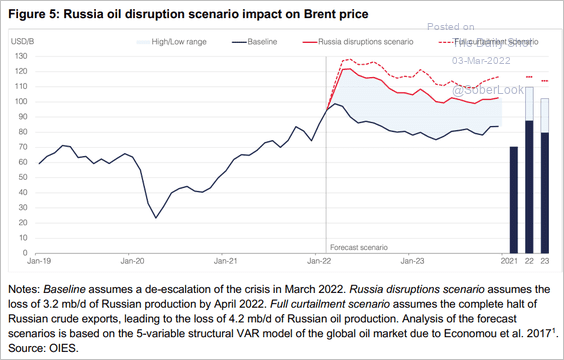 Source: Oxford Institute for Energy Studies
• The divergence between crude oil prices and the US rig count has reached multi-year highs. A substantial increase in O&G CapEx is on the way.
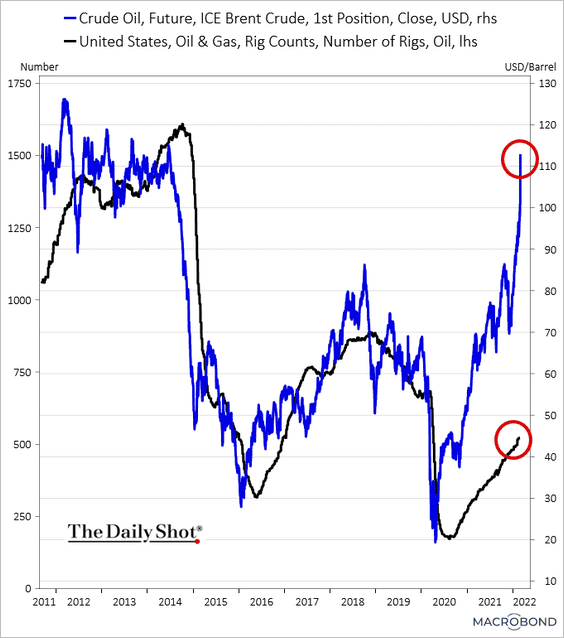 Source: Chart and data provided by Macrobond
——————–
2. Russia is having difficulties bringing crude oil to market (chart shows a massive discount for the Urals crude).
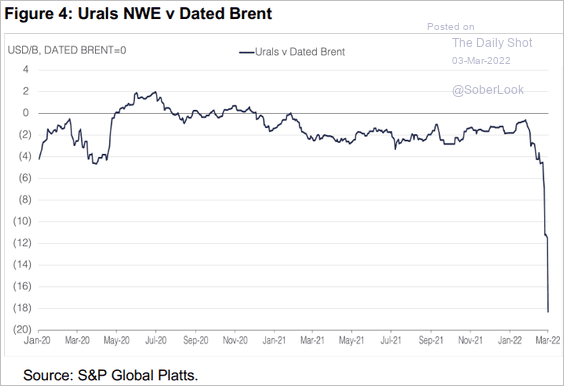 Source: Oxford Institute for Energy Studies
3. OPEC’s spare capacity is shrinking.
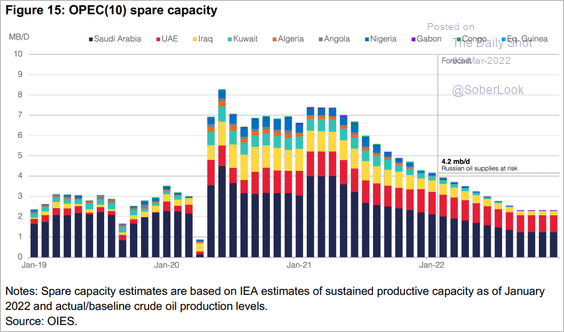 Source: Oxford Institute for Energy Studies
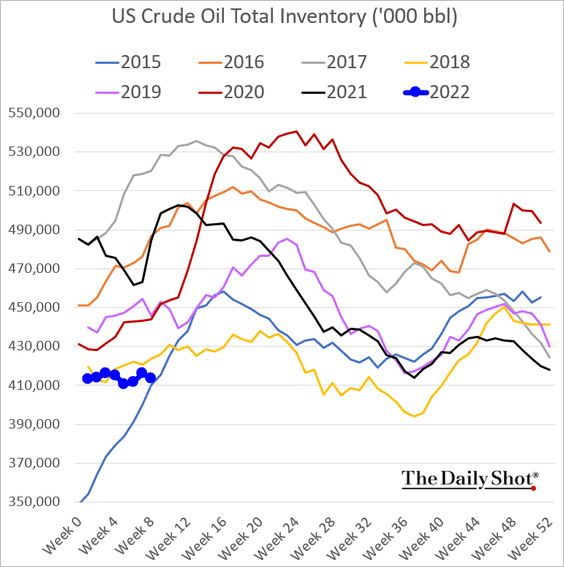
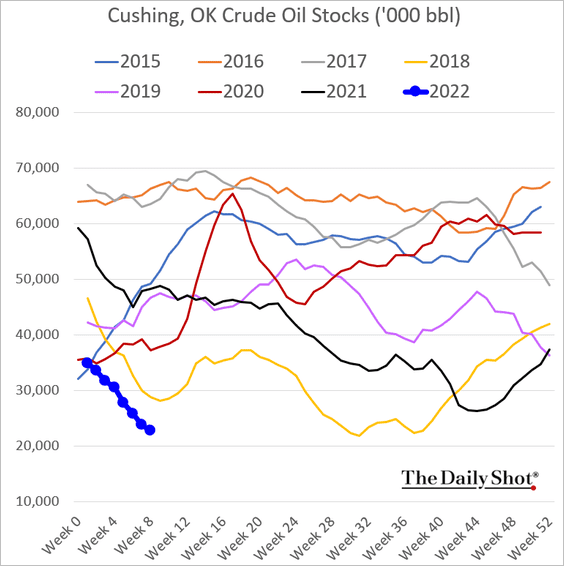
4. US crude oil inventories remain tight.
——————–
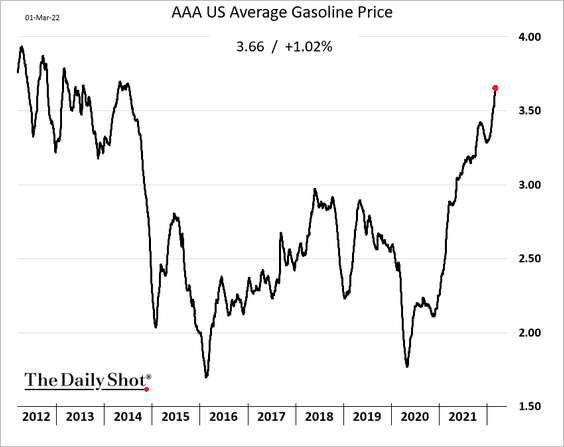
5. US gasoline futures hit the highest level since 2011.
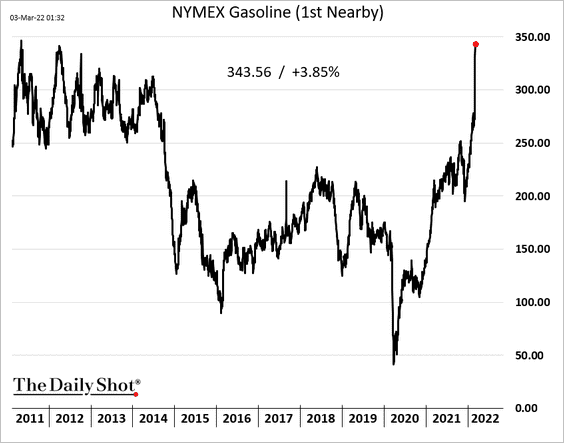
This price surge is coming to a pump near you.
——————–
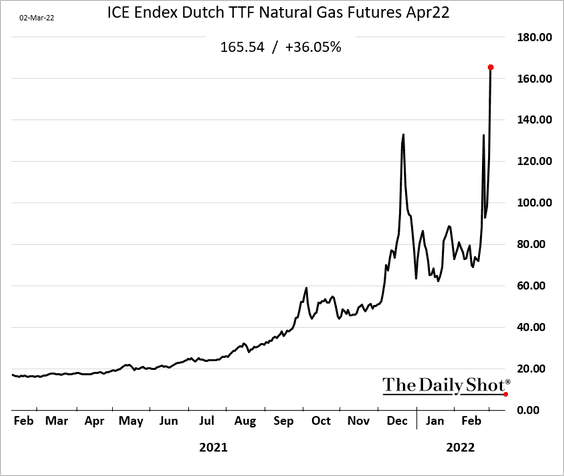
6. European natural gas prices continue to soar.
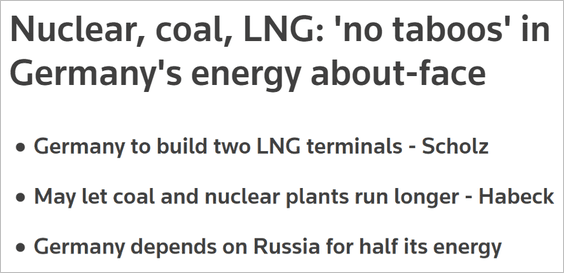
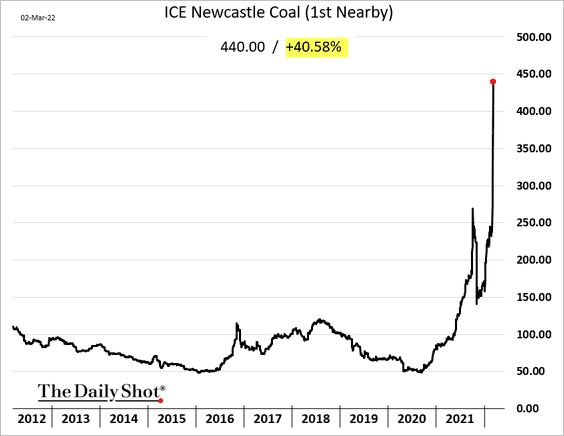
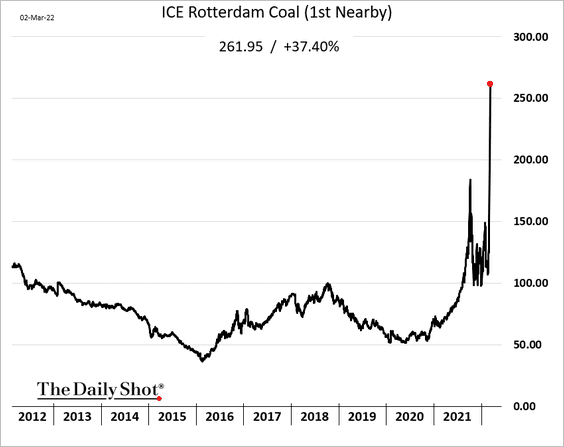
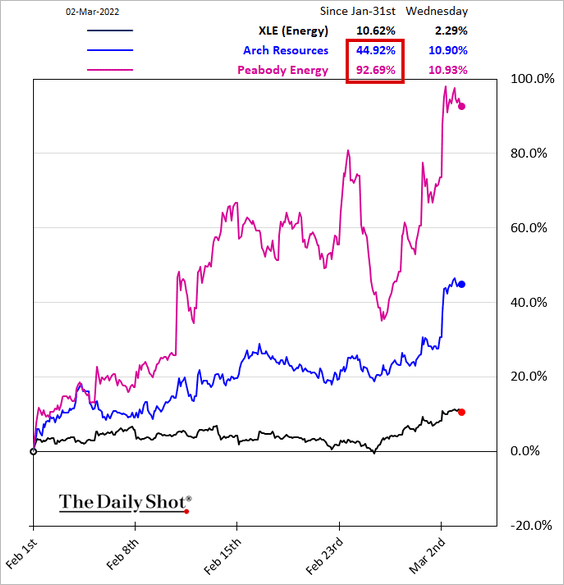
7. Coal prices have gone vertical as buyers look for alternatives to supplies from Russia.
 Source: Reuters; h/t Walter Read full article
 Source: Reuters Read full article
• Asia:
• Europe:
• Shares of US coal producers:
——————–
8. The SPDR Energy ETF’s (XLE) put/call ratio is declining from its highest level in two years.
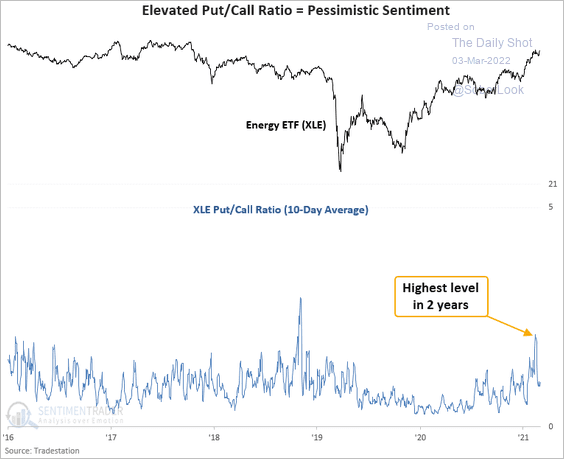 Source: SentimenTrader
Back to Index
Equities
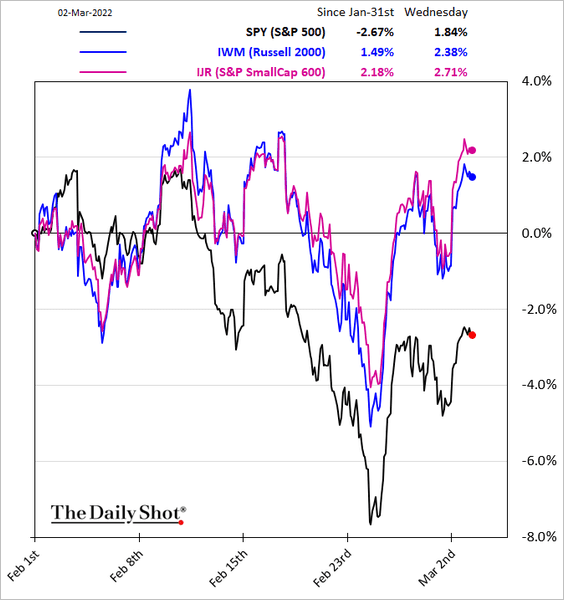
1. Small caps are widening their outperformance.
EPS revisions for small-cap growth companies have been outpacing value and large caps.
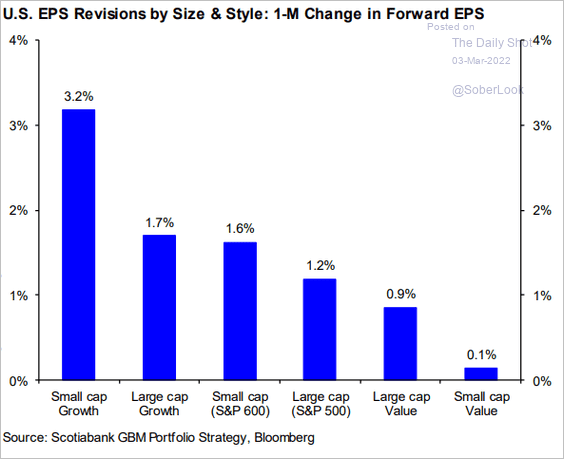 Source: Hugo Ste-Marie, Portfolio & Quantitative Strategy Global Equity Research, Scotia Capital
——————–
2. Despite the recent correction, growth stocks still appear overvalued relative to value stocks.
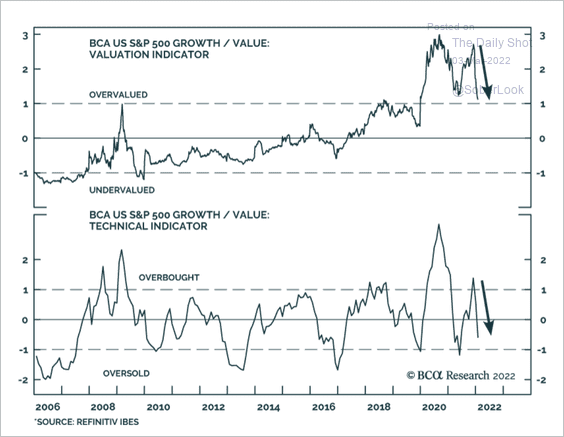 Source: BCA Research
3. Advisor sentiment has deteriorated further.
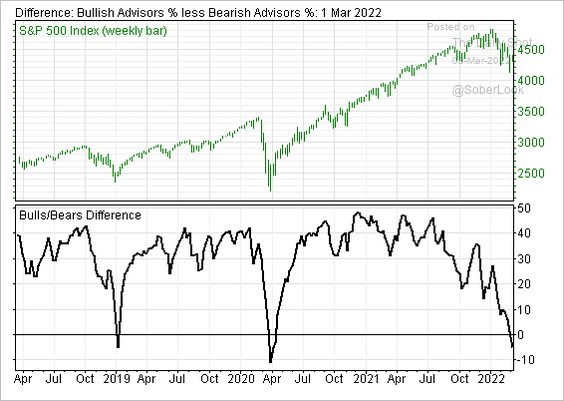 Source: @MikeWShell
4. The S&P 500’s aggregate sales beat remains elevated.
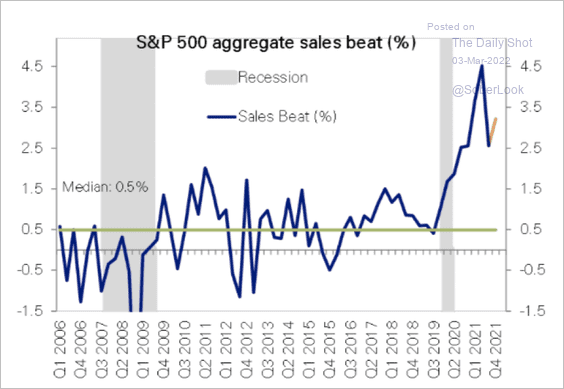 Source: Deutsche Bank Research
5. This chart shows short interest by sector.
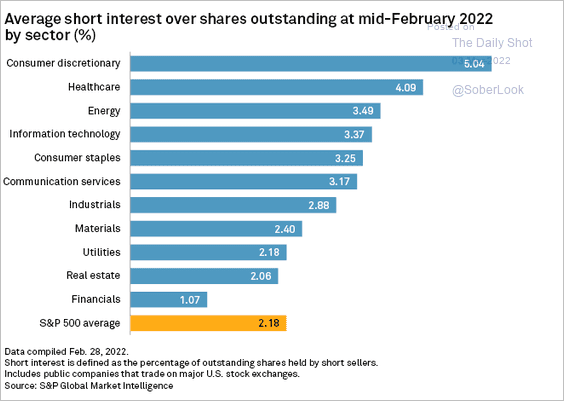 Source: S&P Global Market Intelligence
6. Stocks are oversold, but remain vulnerable to rising rates.
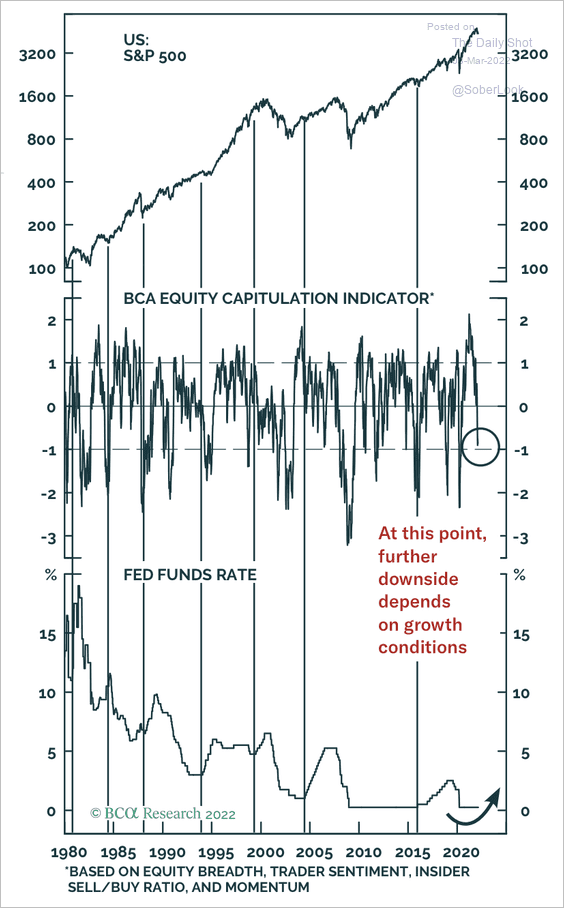 Source: BCA Research
7. Stifel expects slower economic activity (lower manufacturing PMI) and tighter financial conditions to weigh on the S&P 500’s performance (2 charts).
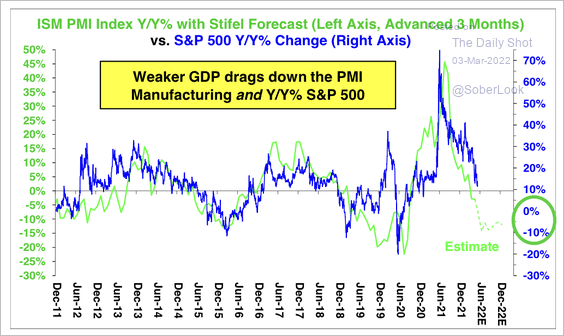 Source: Stifel
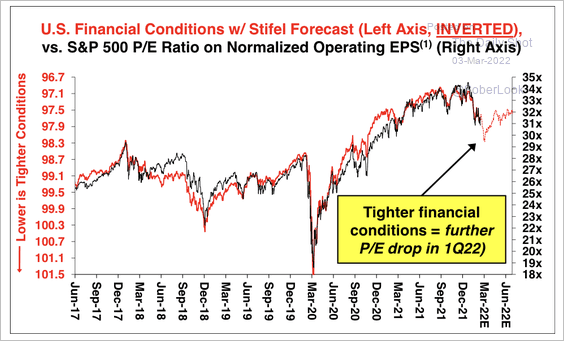 Source: Stifel
Back to Index
Credit
1. The corporate high-yield upgrades/downgrades ratio is at a record high.
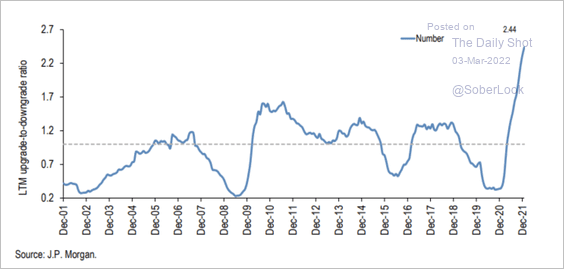 Source: JP Morgan Research
2. Here is the investment-grade risk/reward profile by sector.
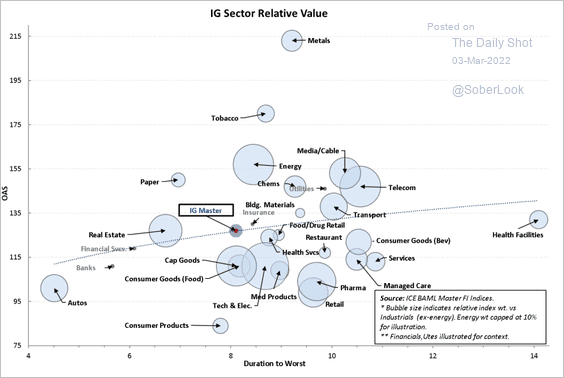 Source: Mizuho Securities USA
Back to Index
Rates
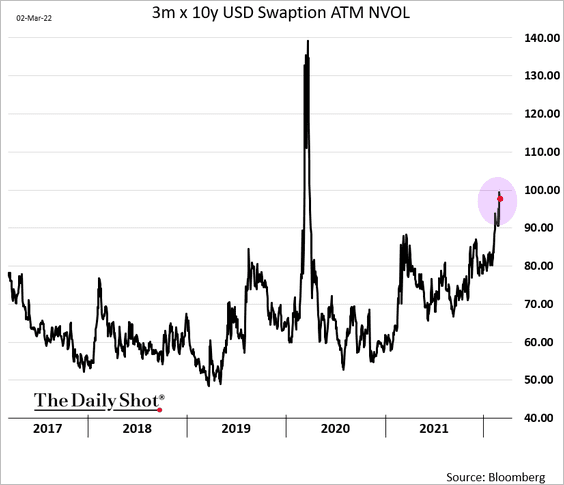
1. Rate markets implied volatility has been surging.
2. Treasury market liquidity has deteriorated.
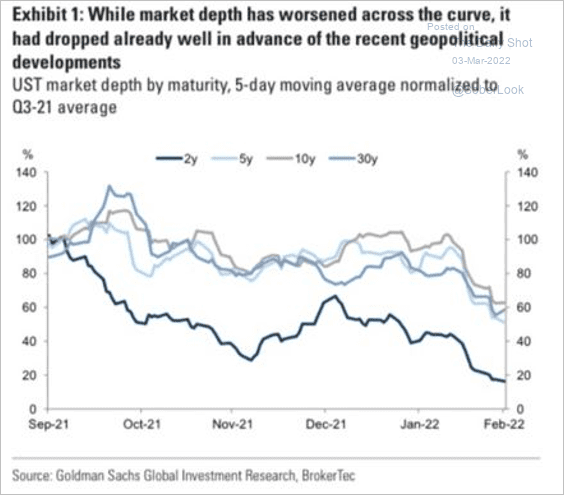 Source: Goldman Sachs
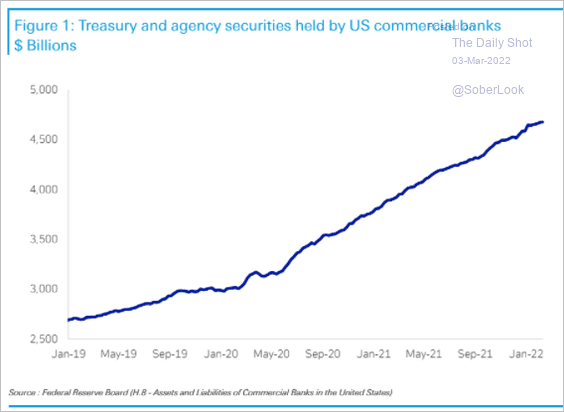
3. This chart shows Treasury and agency securities held by US banks.
 Source: Deutsche Bank Research
Back to Index
Cryptocurrency
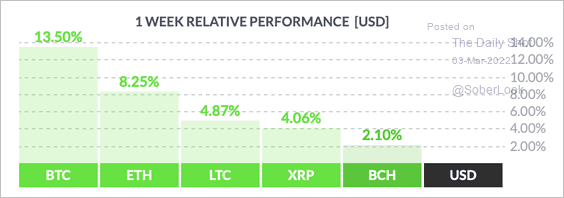
1. So far, bitcoin has outperformed other large cryptocurrencies over the past week.
 Source: FinViz
2. This chart shows the supply of stablecoins relative to the total supply of bitcoin. Theoretically, extreme lows in the ratio suggest greater buying power among crypto traders, which could lead to an uptick in BTC’s price.
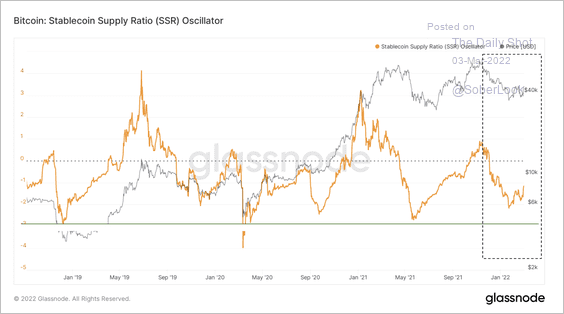 Source: Glassnode Read full article
Back to Index
Emerging Markets
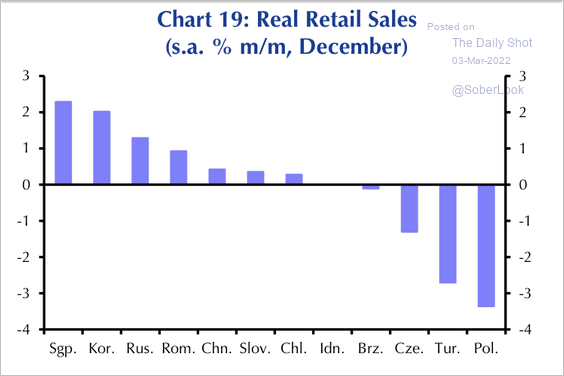
1. Industrial output and retail sales have been particularly strong in parts of EM Asia.
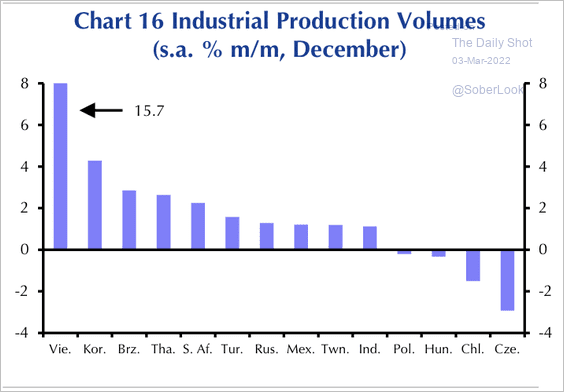 Source: Capital Economics
 Source: Capital Economics
Overall, EM retail sales edged up slightly in December.
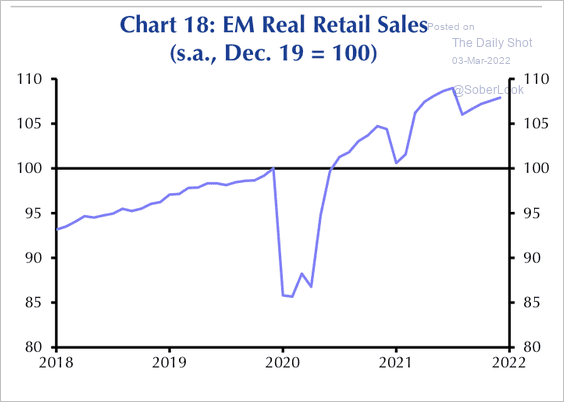 Source: Capital Economics
——————–
2. Rising metals prices should support South African and LatAm stocks.
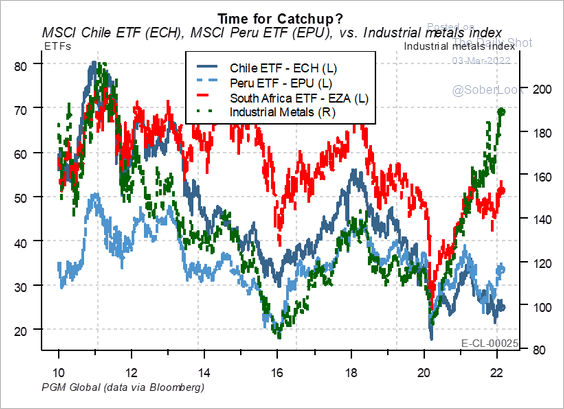 Source: PGM Global
3. How much further will Brazil’s central bank hike rates?
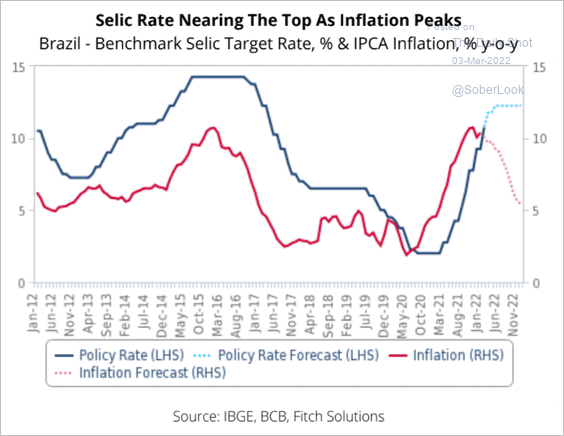 Source: Fitch Solutions Macro Research
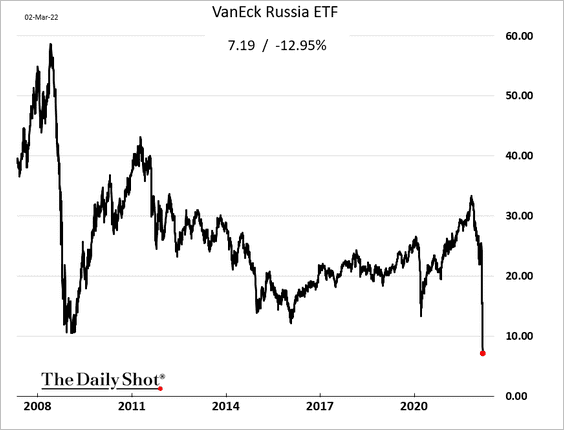
4. Next, we have some updates on Russia.
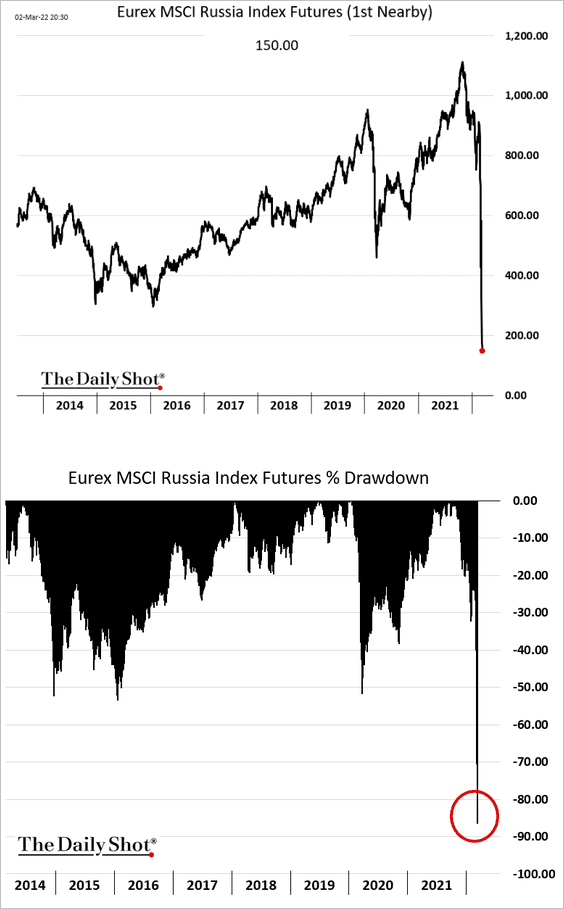
• Russian capital markets have become uninvestable. Equity instruments trading outside of Russia show a collapse in prices.
– US-based Russia ETF (now well below 2008 levels).
• Equity futures (nearly a 90% drawdown):
——————–
• Consumer confidence is deteriorating.
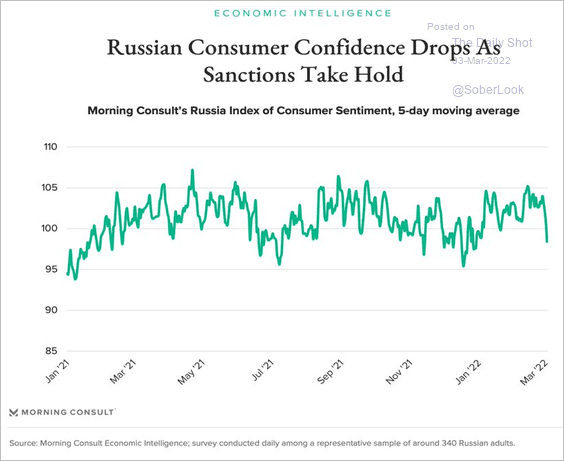 Source: Morning Consult
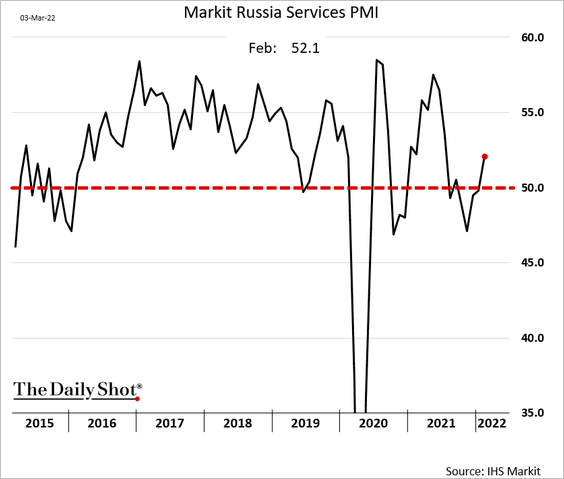
• Service-sector activity was rebounding before the start of the invasion.
• This chart shows Russia’s sovereign wealth funds.
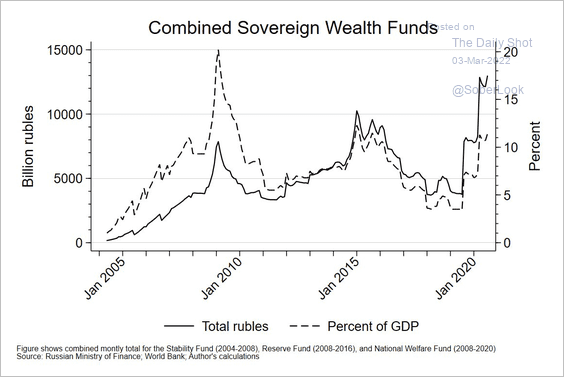 Source: @RTPerson3
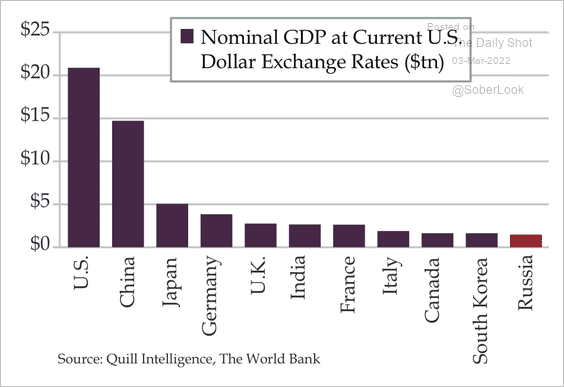
• Russia is the world’s richest country in terms of natural resource reserves.
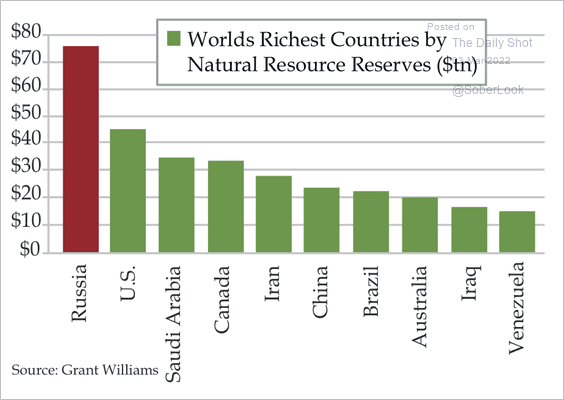 Source: Quill Intelligence
In nominal terms, Russia’s GDP is lower than other large countries.
 Source: Quill Intelligence
Back to Index
China
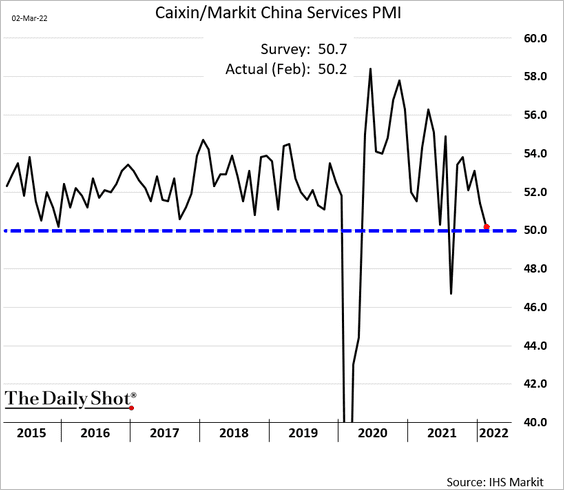
1. Growth in service sectors stalled last month (in contrast to manufacturing).
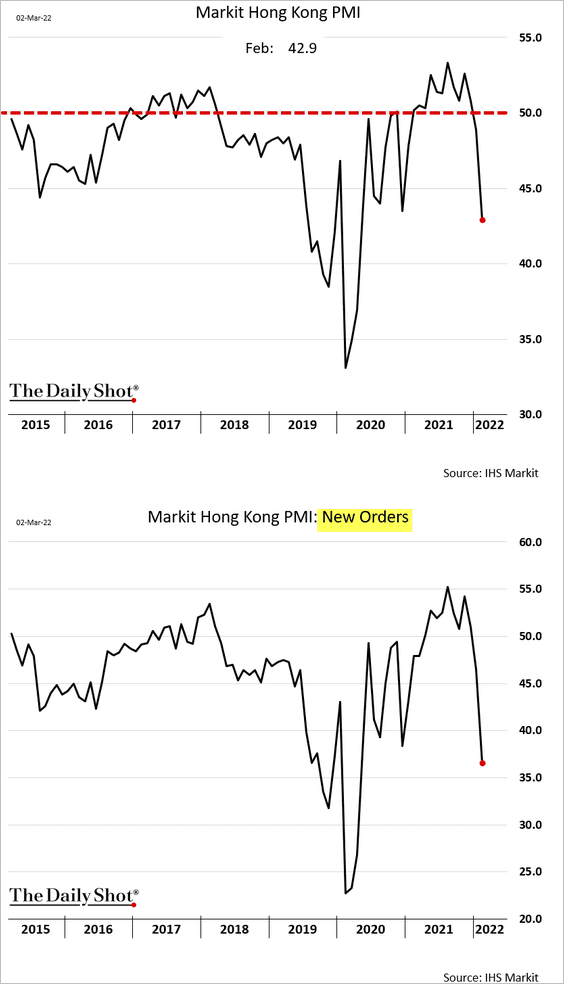
2. Hong Kong’s business activity tumbled last month as the zero-COVID strategy takes a toll.
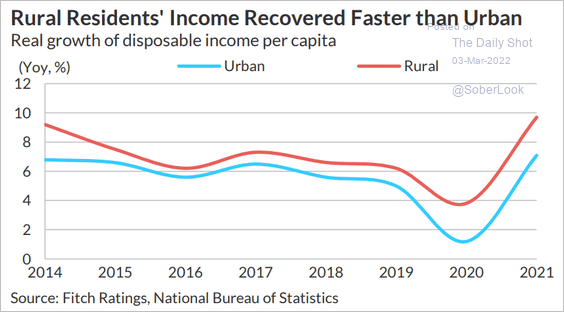
3. The recovery in rural incomes has been faster than in urban areas.
 Source: Fitch Ratings
4. Households plan to save more.
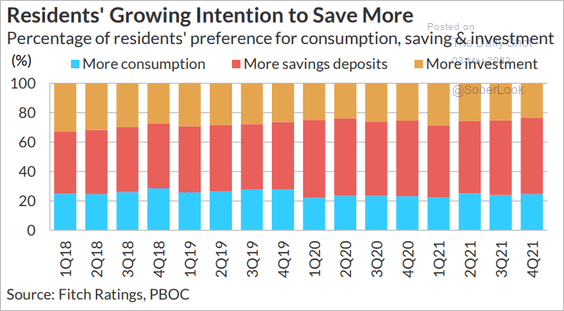 Source: Fitch Ratings
Back to Index
Asia – Pacific
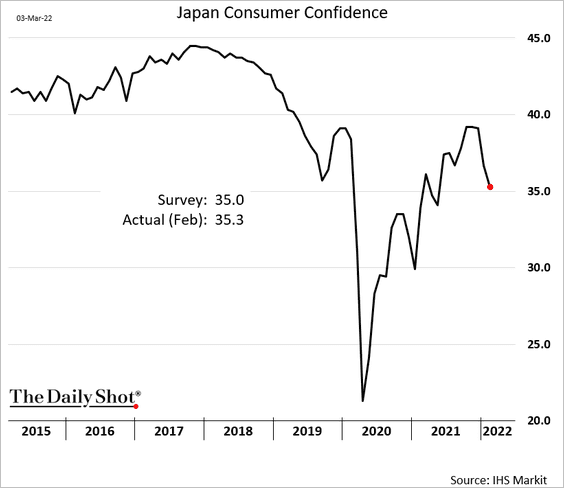
1. Japan’s consumer confidence continues to ease.
Separately, the nation’s financial conditions are still accommodative.
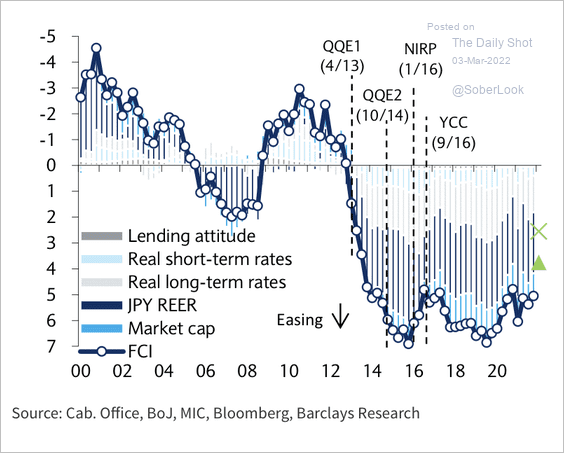 Source: Barclays Research
——————–
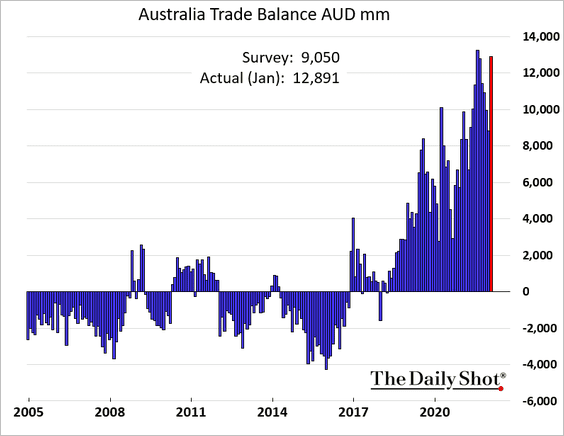
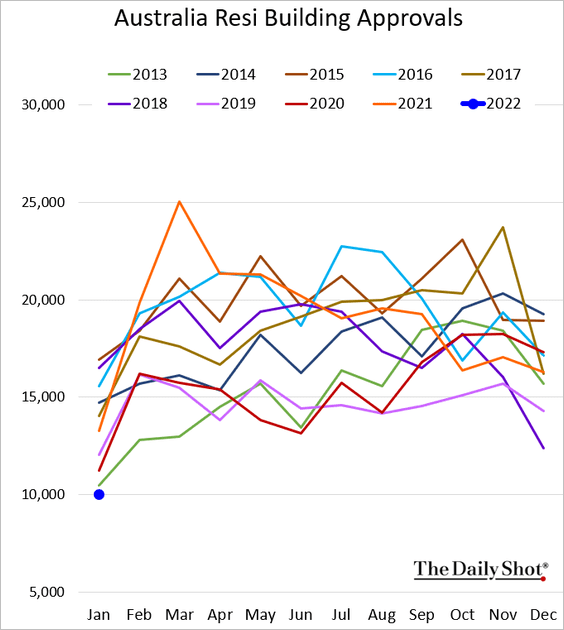
2. Australia’s trade surplus unexpectedly surged in January to near-record levels.
Australia’s building approvals were awful in January.
 Source: ABS Read full article
Back to Index
The Eurozone
1. February brought another eye-popping inflation report.
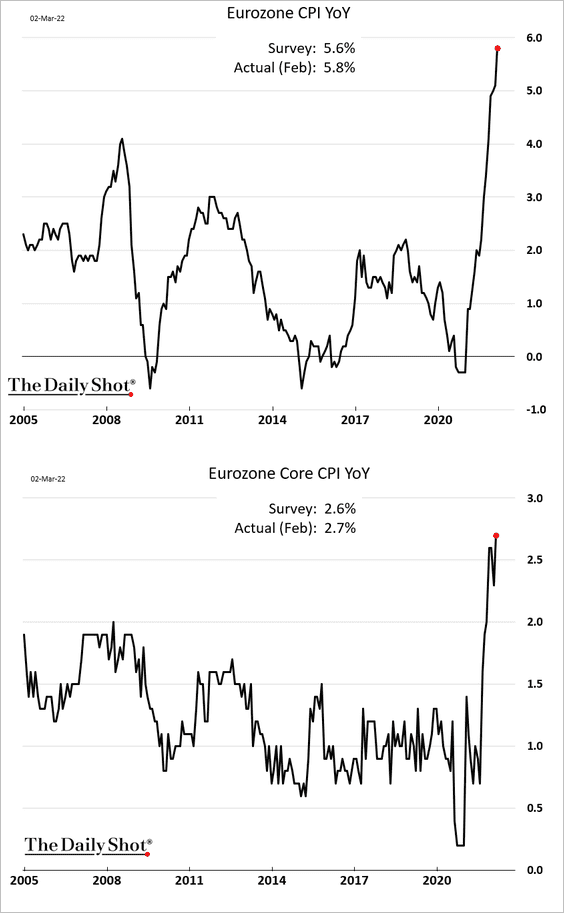
Short-term inflation expectations have been surging with oil.
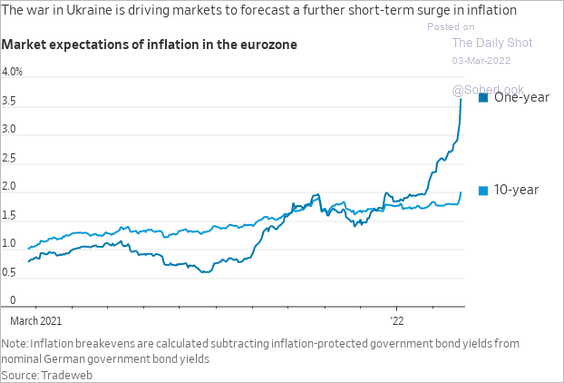 Source: @WSJ Read full article
——————–
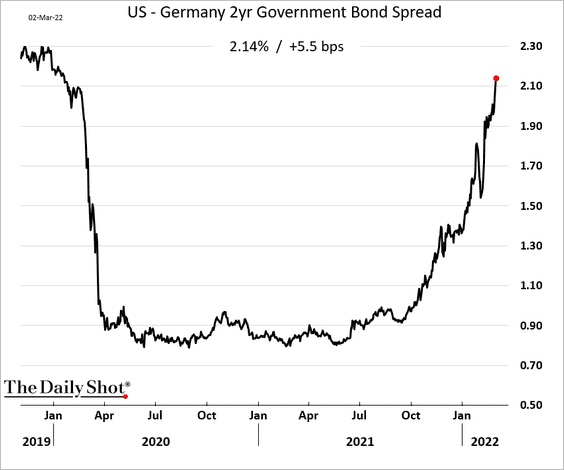
2. The 2-year yield differential with the US is back at pre-COVID levels.
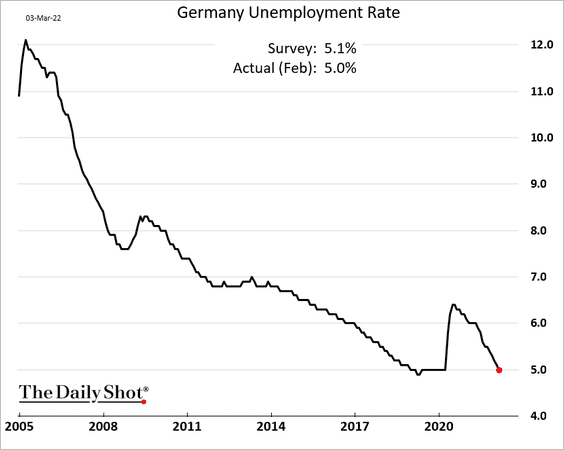
3. Germany’s unemployment rate is back at 5%.
4. Morst German companies have faced supply shortages.
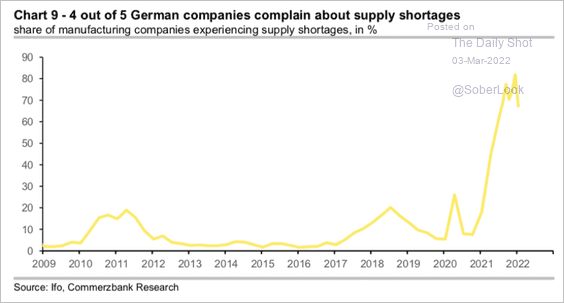 Source: Commerzbank Research
5. How much could Russia’s invasion impact the GDP next year?
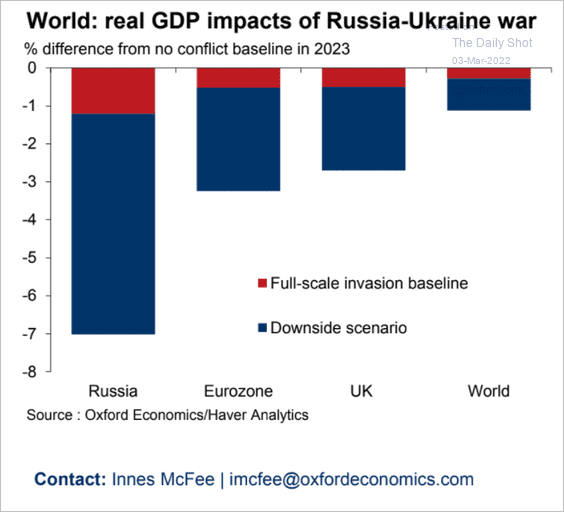 Source: Oxford Economics
Which sectors could be hit the hardest?
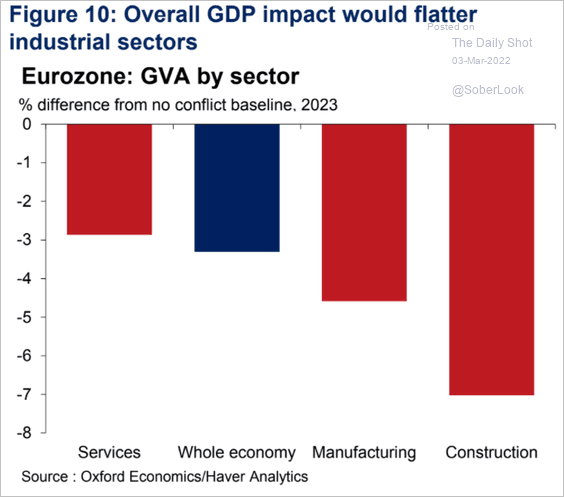 Source: Oxford Economics
6. European companies most exposed to Russia lost a quarter of their value this week.
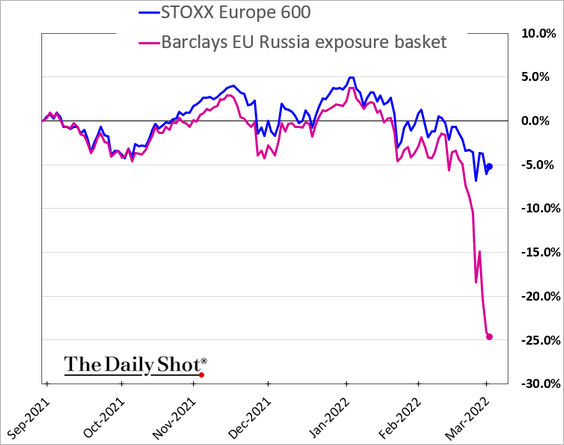 h/t @mikamsika
Back to Index
The United Kingdom
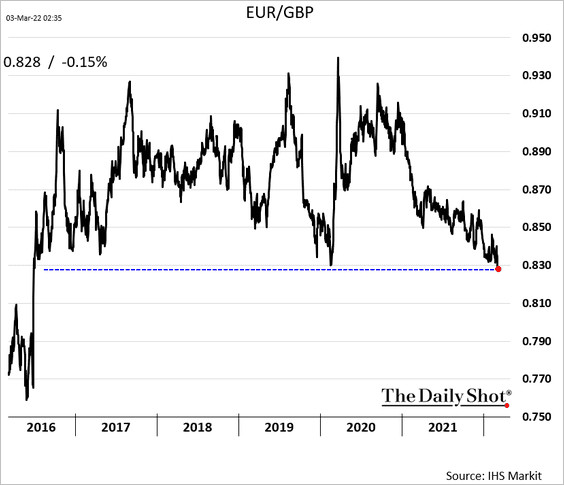
1. EUR/GBP hit the lowest level since the EU Referendum.
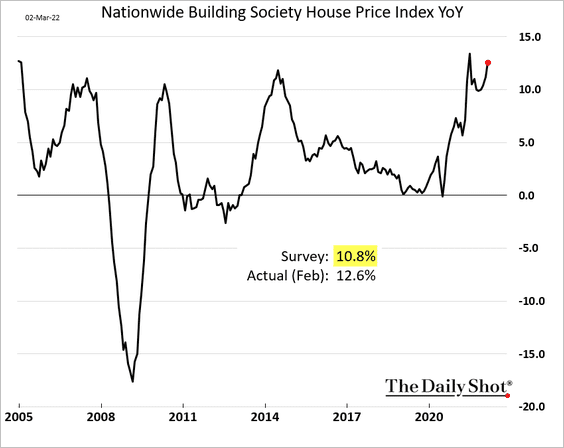
2. Home price gains accelerated last month.
But weak consumer confidence could be a drag on housing.
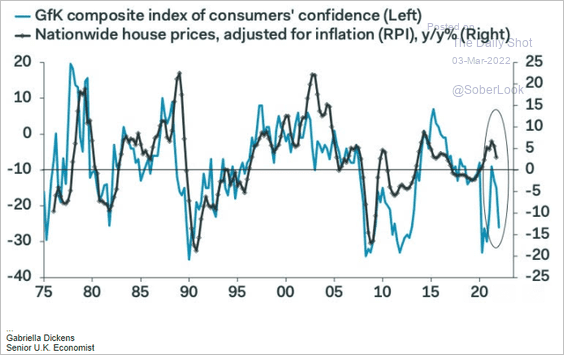 Source: Pantheon Macroeconomics
——————–
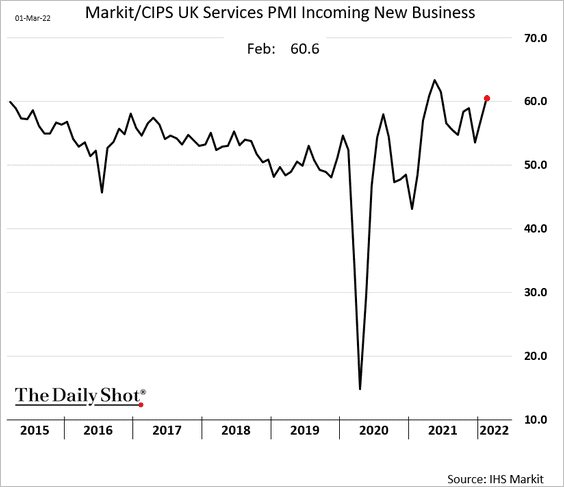
3. Service firms have been seeing strong incoming business.
Back to Index
Canada
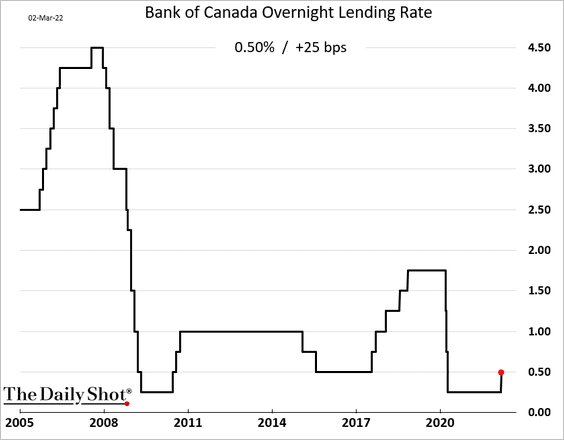
The BoC hiked rates (as expected).
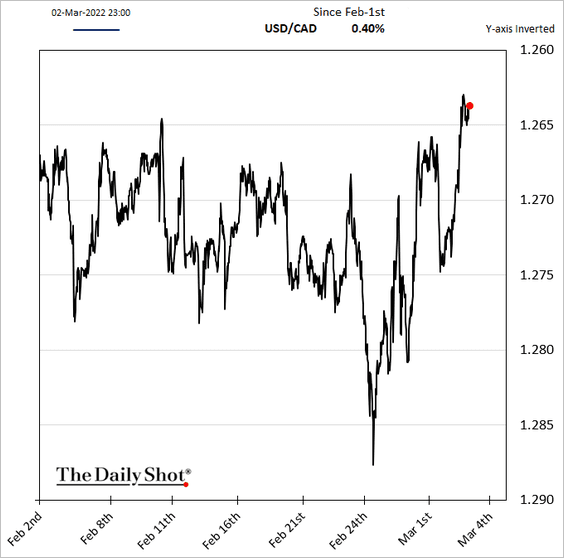
The loonie has been strenghening.
Back to Index
The United States
1. Jerome Powell’s testimony showed that while the March rate hike is coming, the Fed may be more cautious going forward.
The implications for the U.S. economy are highly uncertain, and we will be monitoring the situation closely.
…
The near-term effects on the US economy of the invasion of Ukraine, the ongoing war, the sanctions, and of events to come, remain highly uncertain. Making appropriate monetary policy in this environment requires a recognition that the economy evolves in unexpected ways. We will need to be nimble in responding to incoming data and the evolving outlook.
Stocks surged.

——————–
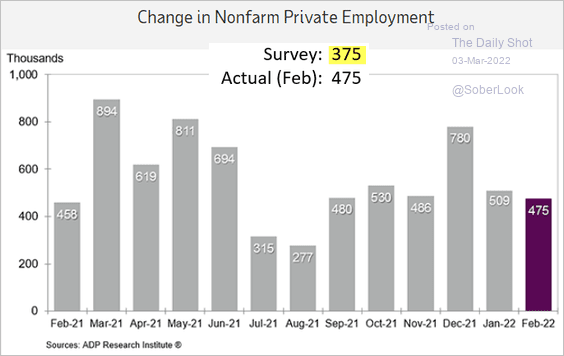
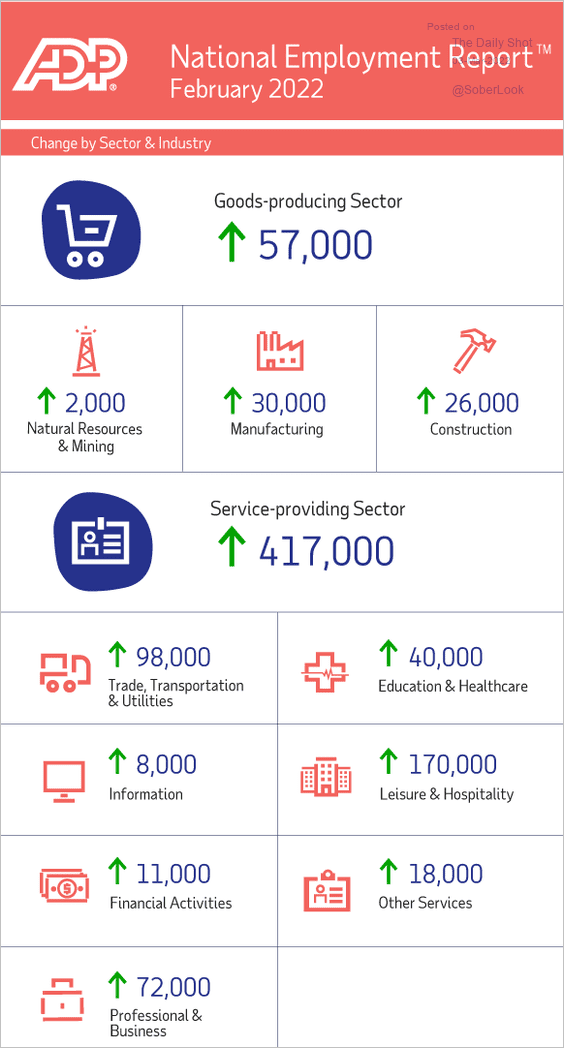
2. The ADP employment report was stronger than expected, and the January figure was revised from a 301k loss to a gain of 509k.
 Source: ADP Research Institute
Payroll gains were broad.
 Source: ADP Research Institute
——————–
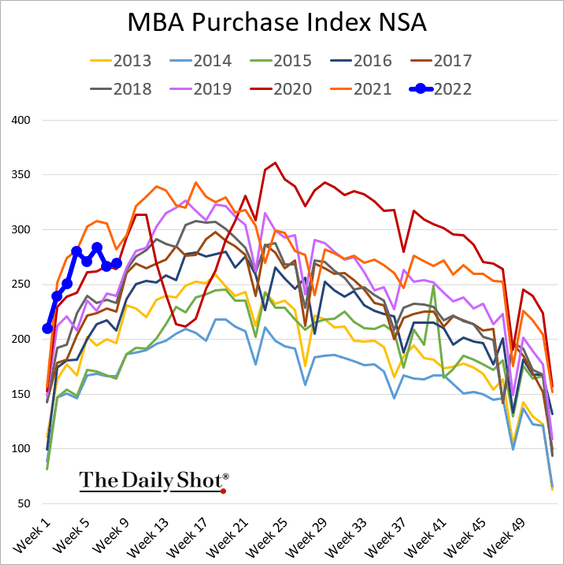
3. Morgage applications are tracking 2020 levels (pre-COVID).
• Will housing demand soften further?
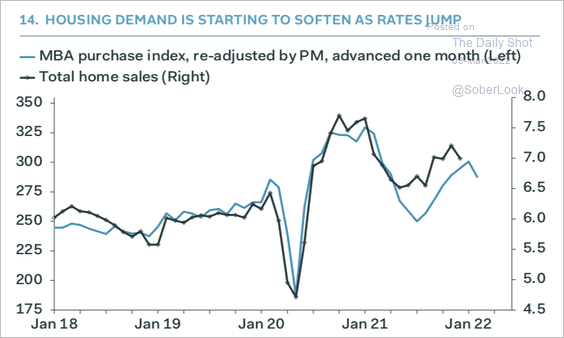 Source: Pantheon Macroeconomics
• This chart shows the divergence between pending and existing home sales.
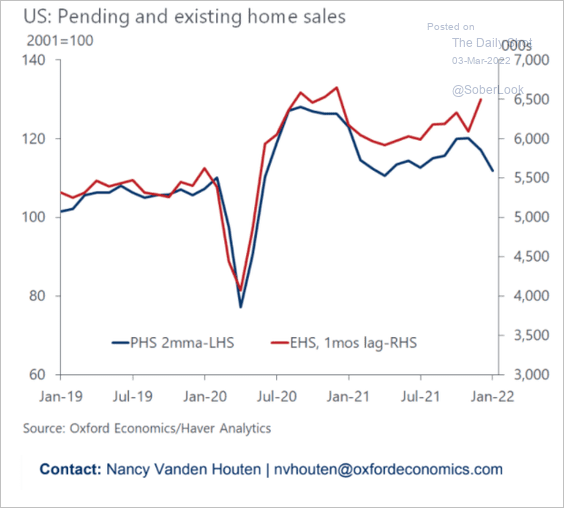 Source: Oxford Economics
• Here are the trends in residential construction spending.
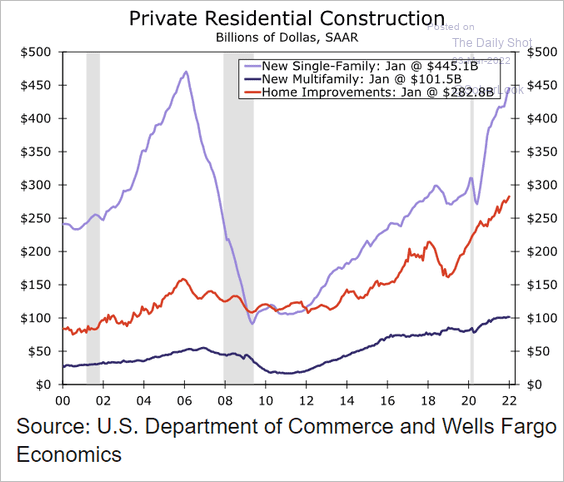 Source: Wells Fargo Securities
——————–
4. The Atlanta Fed’s GDPNow model points to very slow GDP growth in Q1.
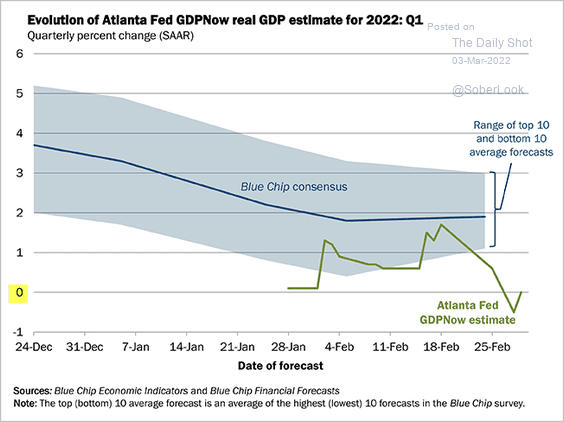 Source: @AtlantaFed Read full article
5. The Fed’s Beige Book showed a surging focus on inflation. Concerns about childcare and school closures have eased.
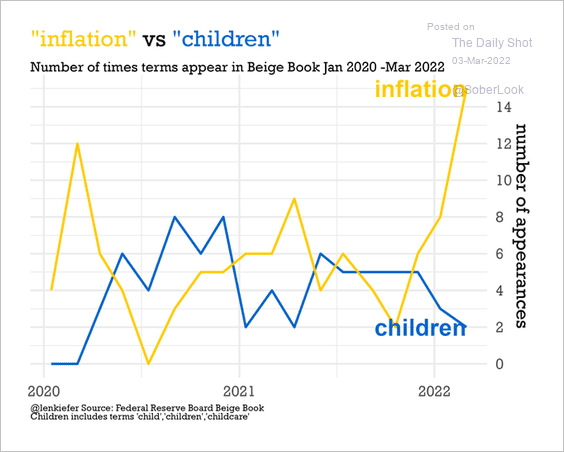 Source: @lenkieferFollows, @AndyWGettysburg, @BetMGMCasinoFollowCasino, @odetakushiFollowDeputy, @firstam, @TheSamKhaterFollowChief, @FreddieMac, @GeorgetownCCT
6. Air travel is starting to pick up, albeit still below 2019-2020 average levels.
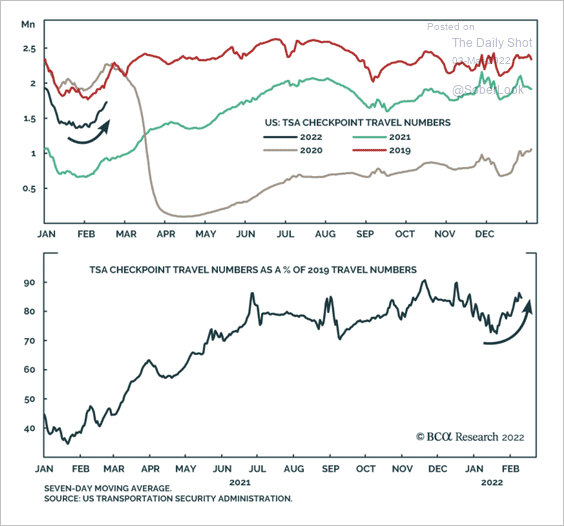 Source: BCA Research
Here is the Evercore ISI airline survey.
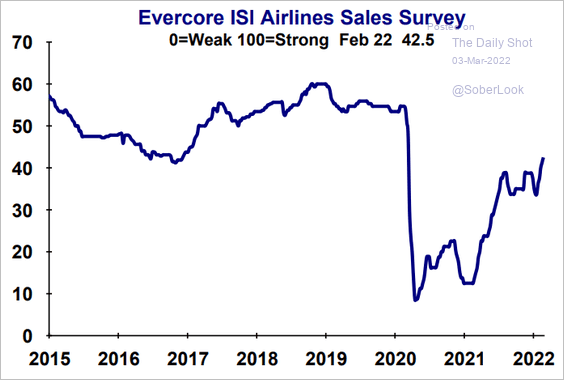 Source: Evercore ISI Research
——————–
Food for Thought
1. The time from microbe identification to widespread vaccination:
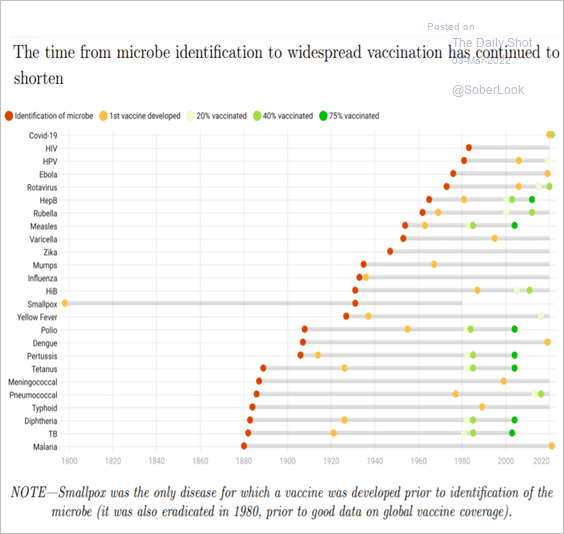 Source: Center for Global Development Read full article
2. Vaccine coverage:
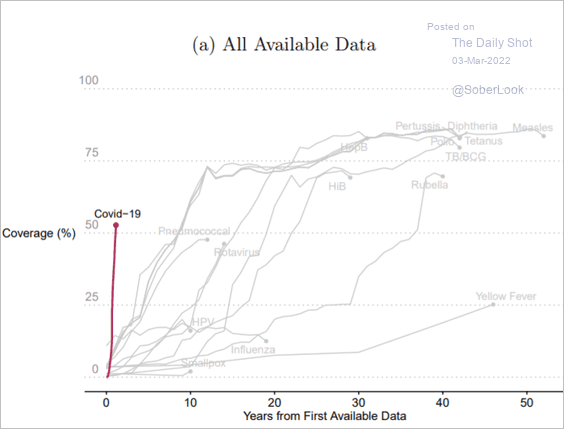 Source: Center for Global Development Read full article
3. Sustainability in packaging:
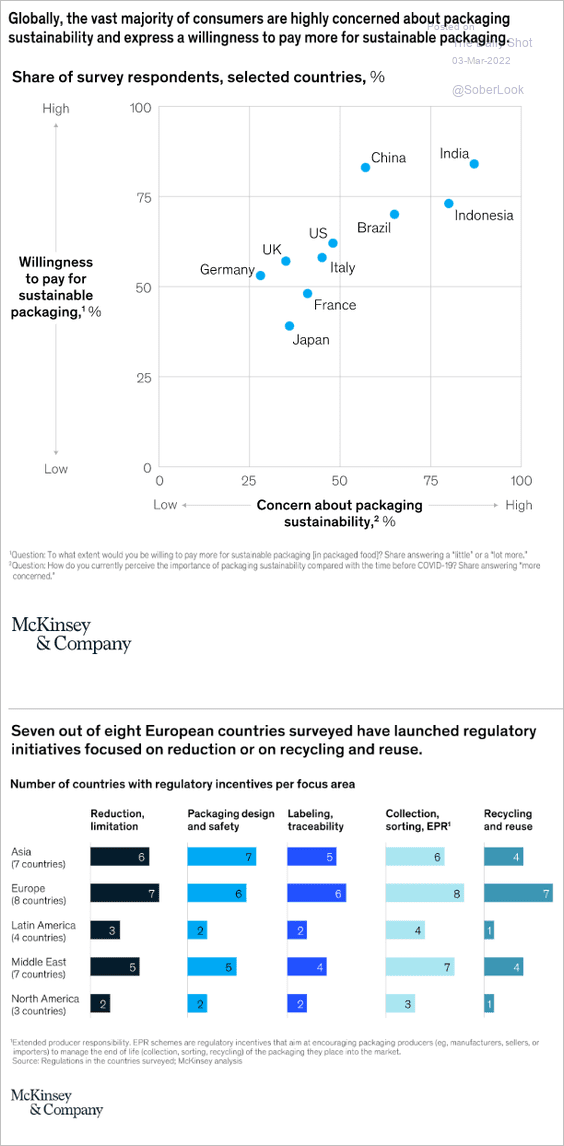 Source: McKinsey & Company Read full article
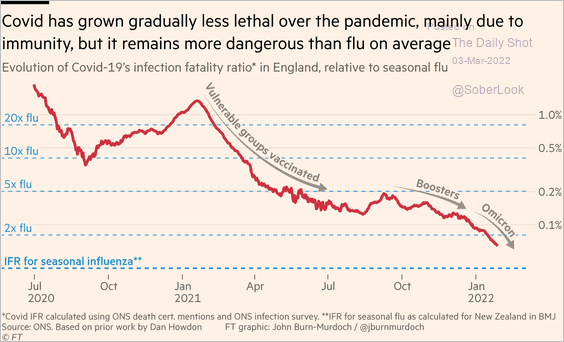
4. The COVID fatality ratio:
 Source: @financialtimes Read full article
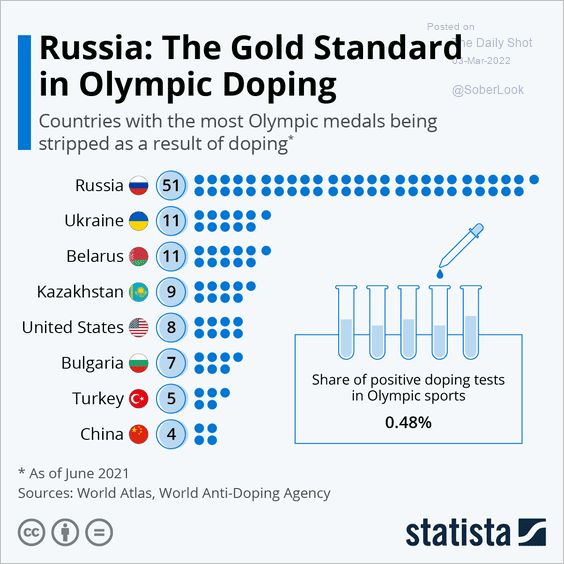
5. Olympic doping:
 Source: Statista
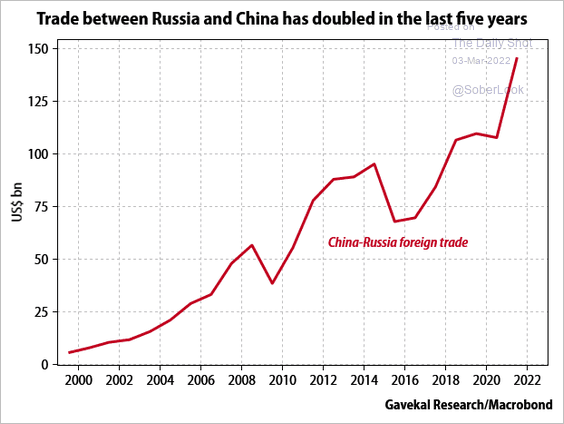
6. China-Russia foreign trade:
 Source: Gavekal Research
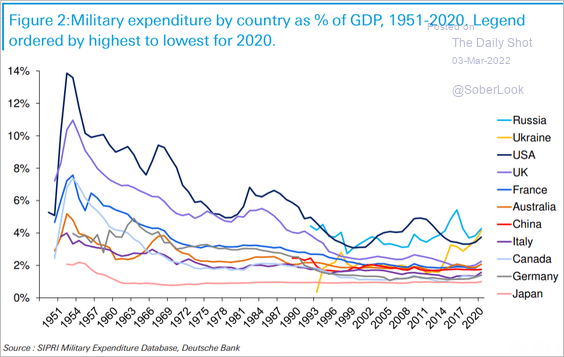
7. Military expenditure as a share of GDP:
 Source: Deutsche Bank Research
8. Americans’ views of Russia:
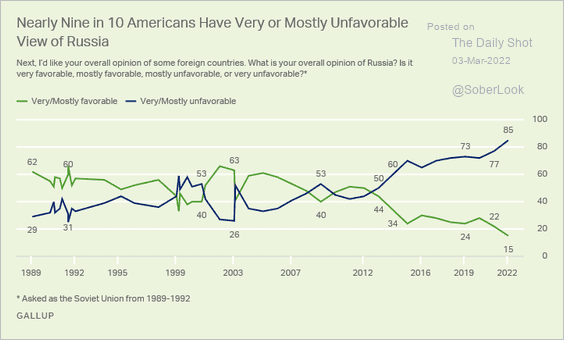 Source: Gallup Read full article
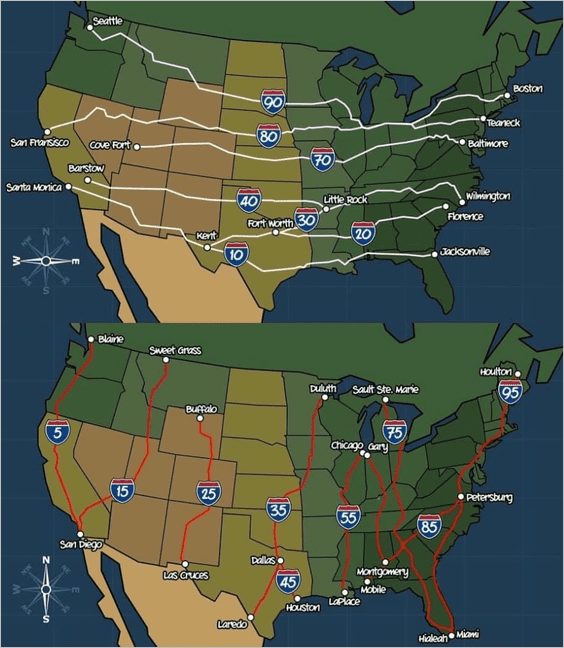
9. The numbering of east-west and south-north US interstate highways:
 Further reading
——————–
Back to Index