
The Daily Shot: 04-Mar-22
• The United States
• The United Kingdom
• The Eurozone
• Europe
• Asia – Pacific
• China
• Emerging Markets
• Cryptocurrency
• Commodities
• Energy
• Equities
• Credit
• Rates
• Global Developments
• Food for Thought
Apologies for the delay. We had some technical difficulties.
The United States
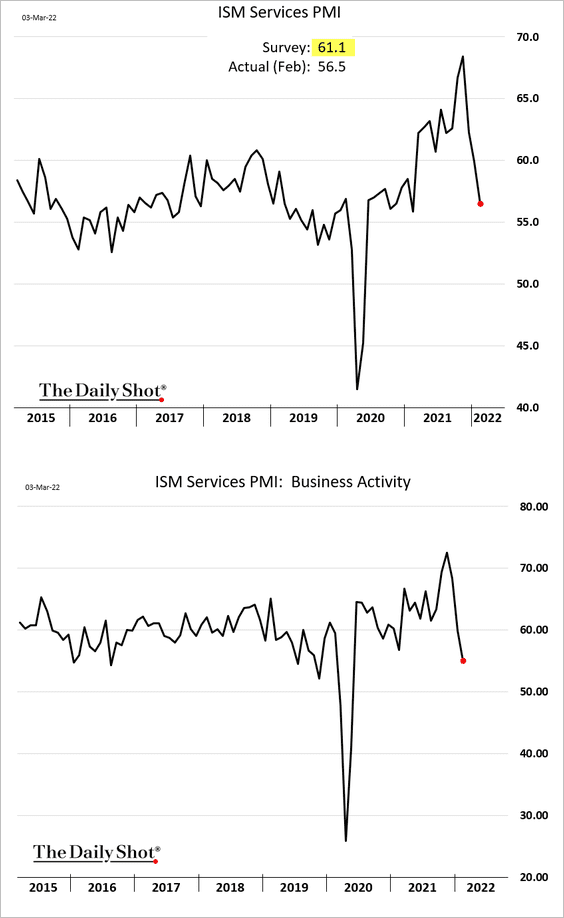
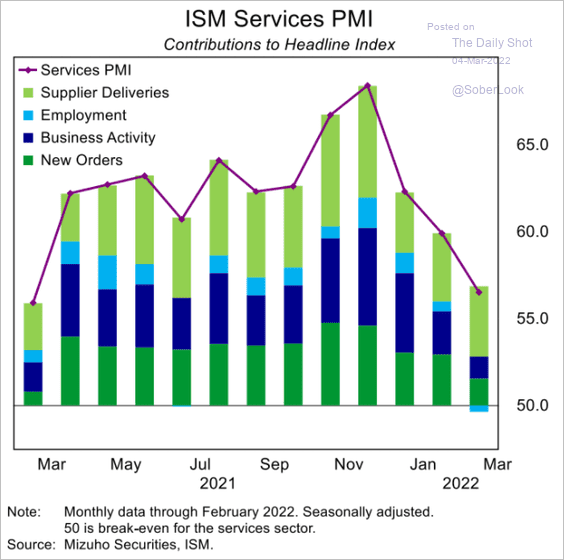
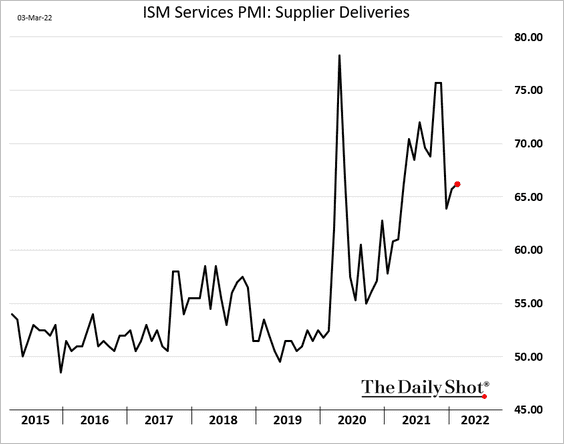
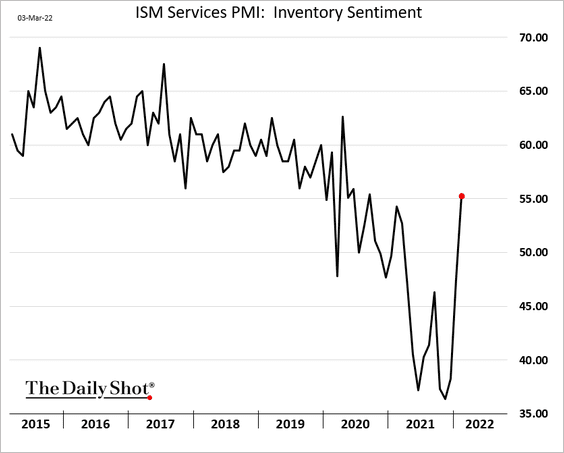
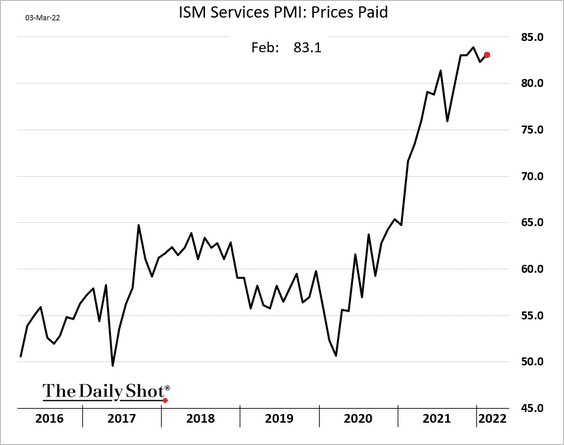
1. Unlike the manufacturing sector, services registered slower business activity in February.
 Source: Reuters Read full article
 Source: Mizuho Securities USA
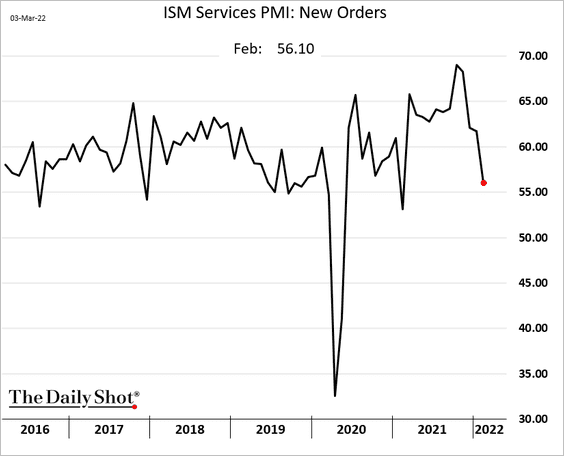
• Demand growth waned.
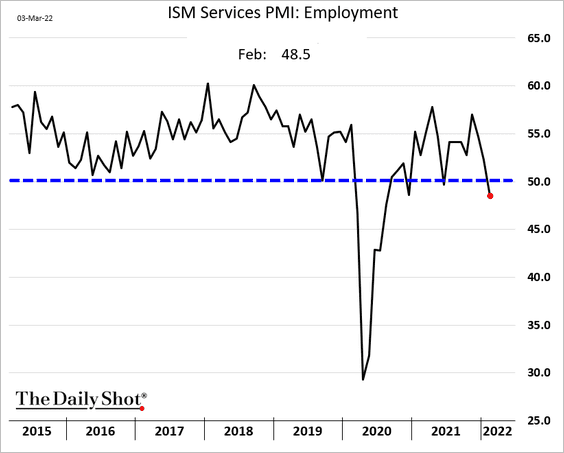
• Hiring stalled.
• Supplier deliveries remained slow.
• But low inventories are no longer a problem
• Costs continue to surge.
——————–
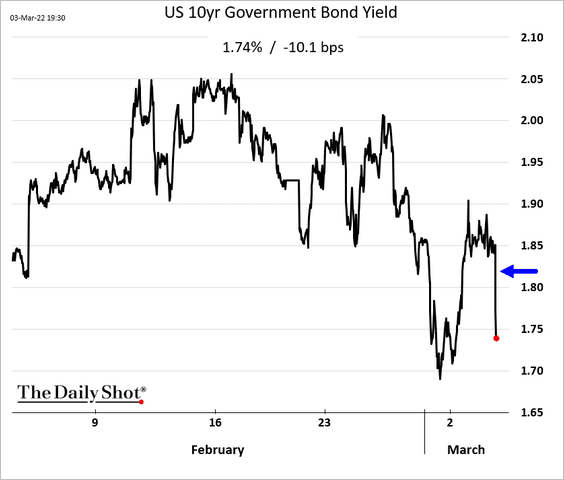
2. Forget 50 bps. The market is no longer sure about a 25 bps rate hike this month.
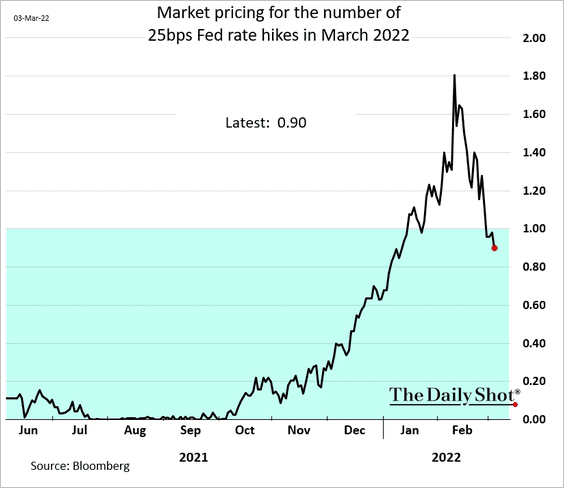
Concerns about the consequences of Russia’s invasion keep markets on edge. Russia’s attack on the nuclear power plant sent Treasury yields sharply lower.
 Source: Reuters Read full article
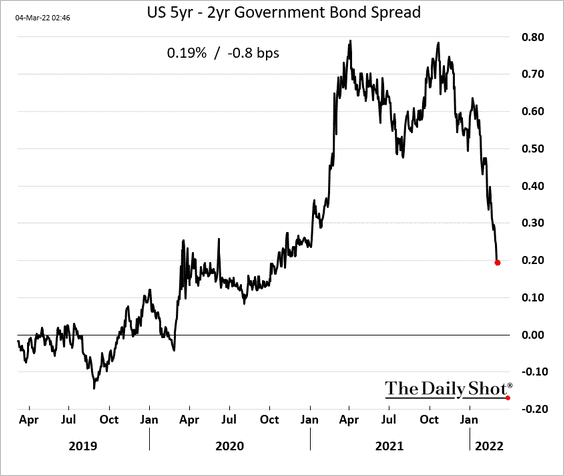
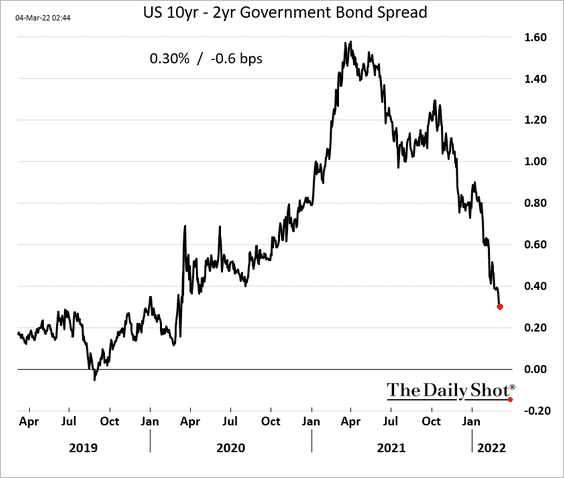
The yield curve is rapidly moving toward inversion.
——————–
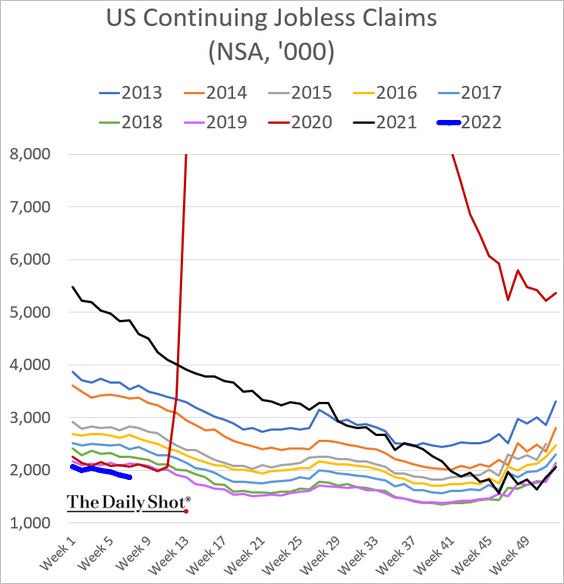
3. Initial unemployment claims hit a multi-year low for this time of the year.
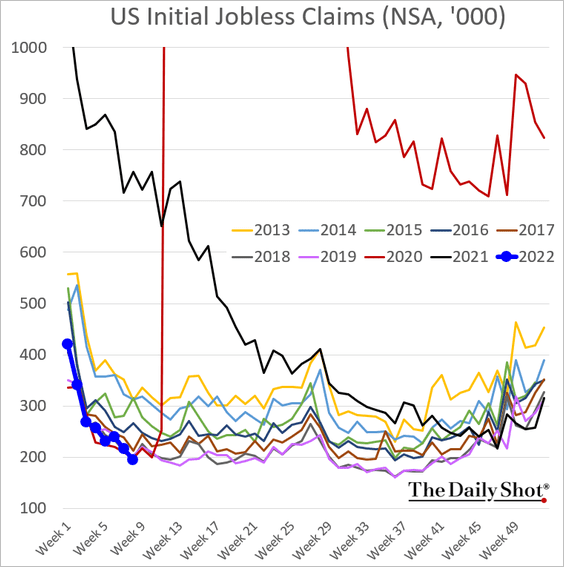
Continuing claims are also falling to levels not seen in recent years.
What should we expect from the unemployment report today? Morgan Stanley sees 730k jobs created in February, …
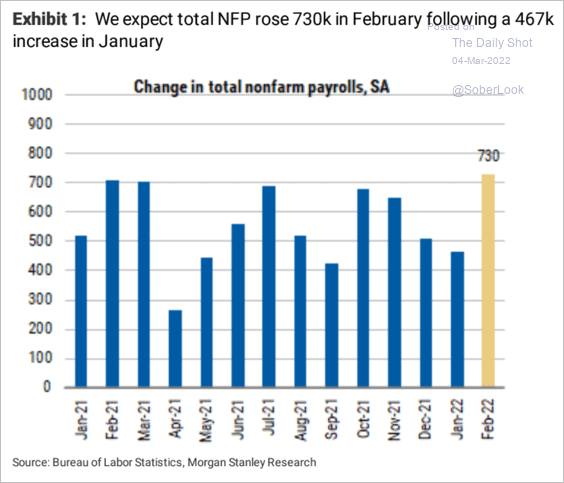 Source: Morgan Stanley Research
… with the unemployment rate dropping to 3.7%.
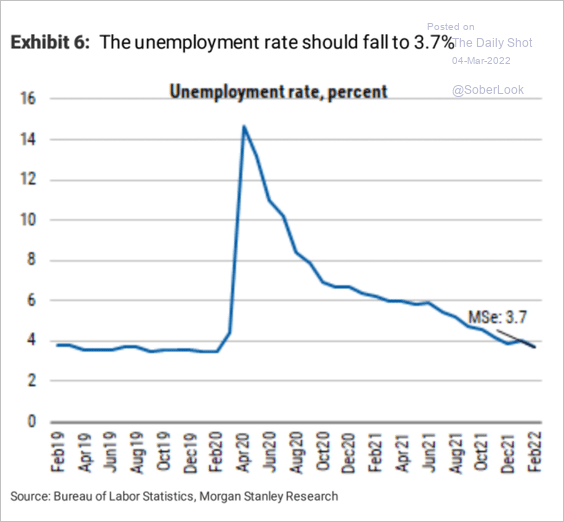 Source: Morgan Stanley Research
——————–
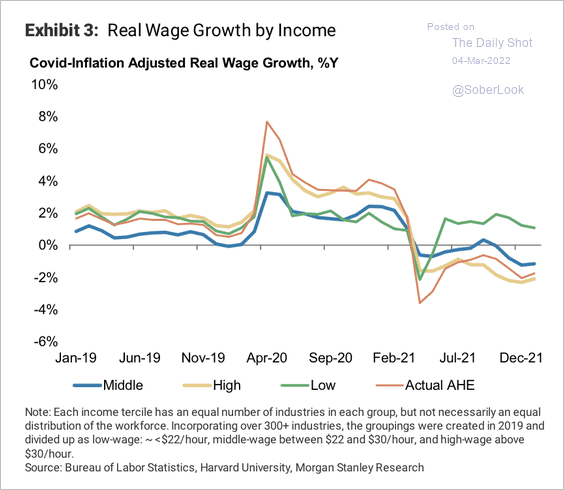
4. Wage growth for job switchers hit 8% last year.
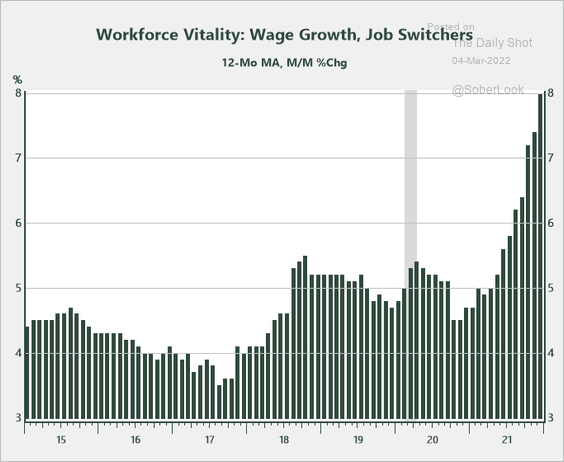 Source: Peter Essele, Commonwealth Financial Network
Real wage growth (adjusted for consumption baskets across income cohorts during the pandemic) is trending down, although less so for the low-income group.
 Source: Morgan Stanley Research
——————–
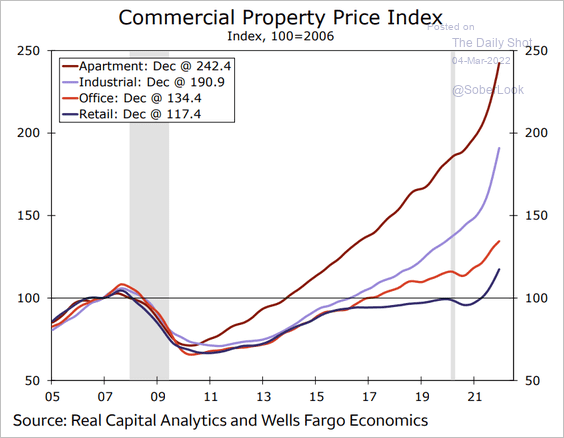
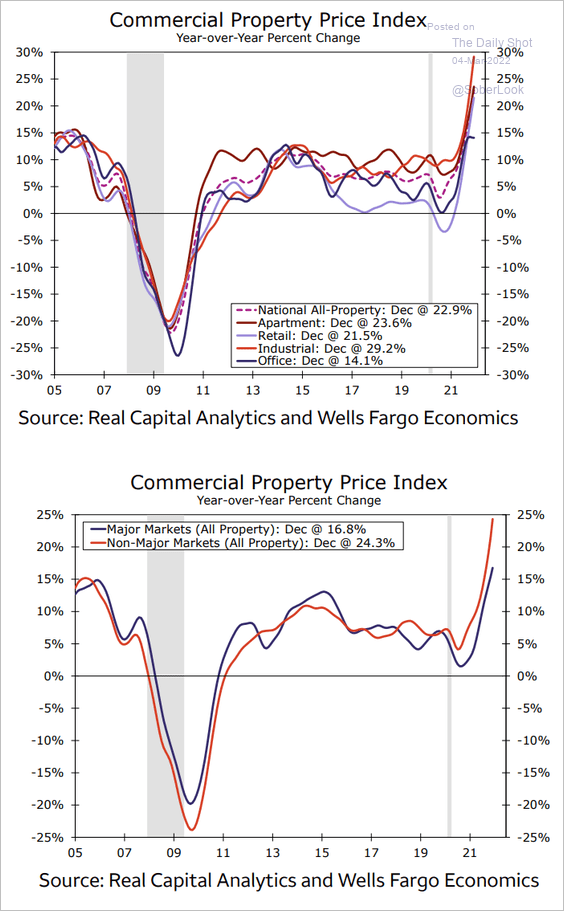
5. Commercial real estate prices have been surging.
 Source: Wells Fargo Securities
 Source: Wells Fargo Securities
——————–
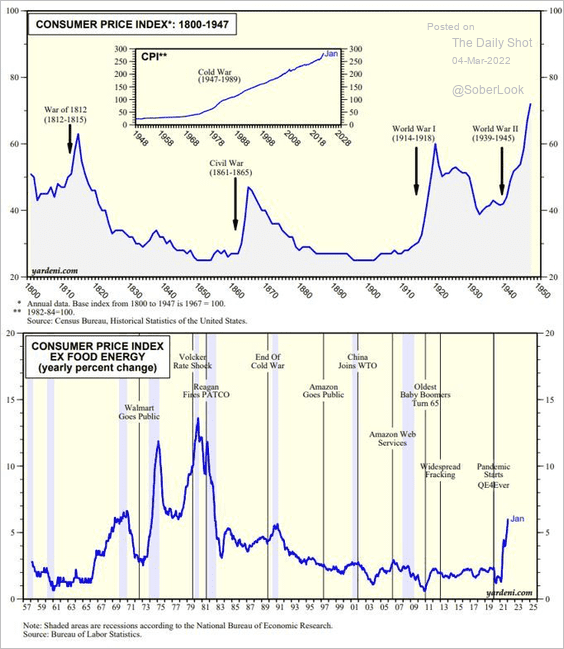
6. Wars have a long history of being inflationary.
 Source: Yardeni Research
Back to Index
The United Kingdom
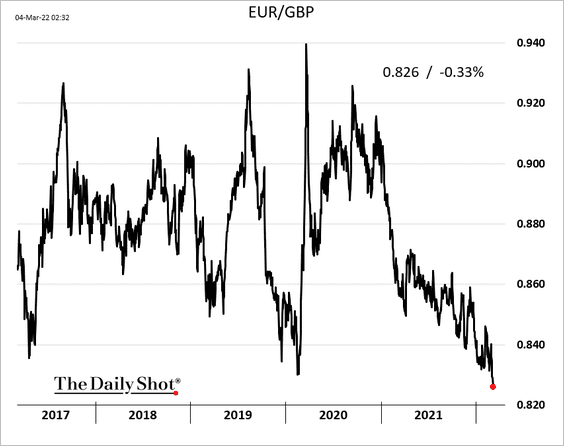
1. The pound continues to hit multi-year highs against the euro.
2. Pay settlements survey data suggest solid pay growth this year.
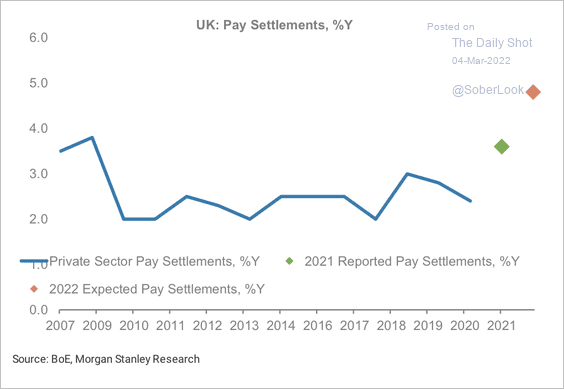 Source: Morgan Stanley Research
But workers expect real wages to decline.
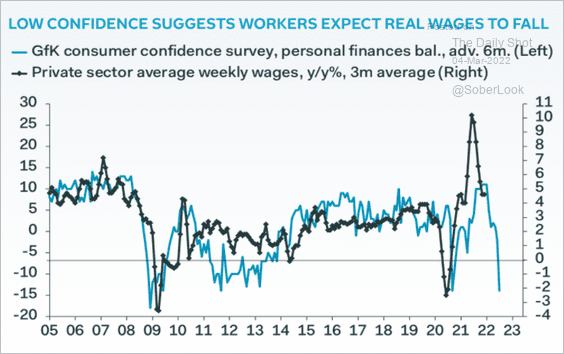 Source: Pantheon Macroeconomics
——————–
3. Consumers were in excess savings mode up until last December.
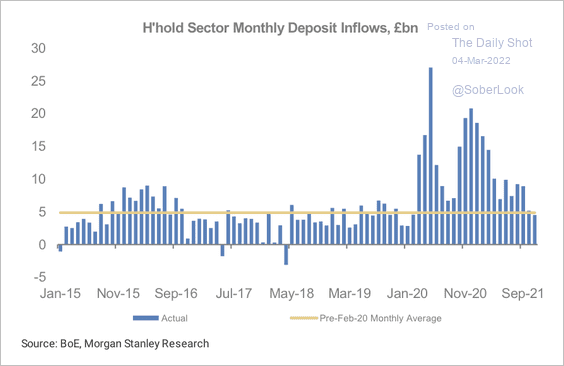 Source: Morgan Stanley Research
Back to Index
The Eurozone
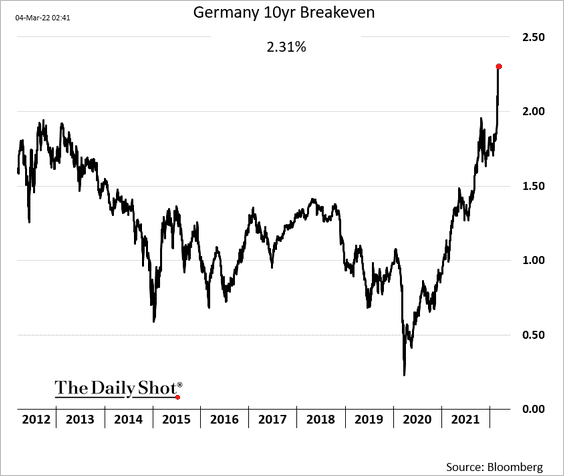
1. Market-based inflation expectations are soaring.
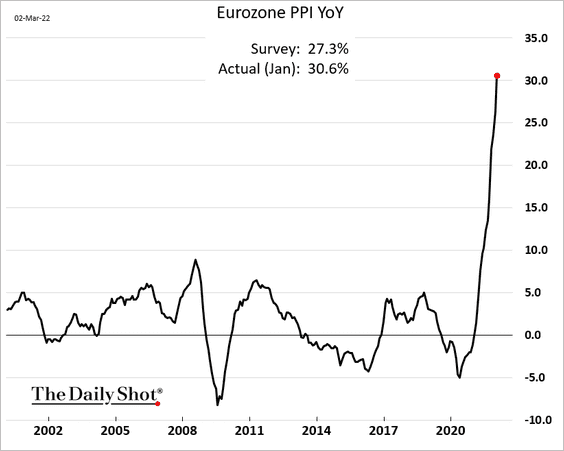
Producer prices are up over 30% year-over-year.
——————–
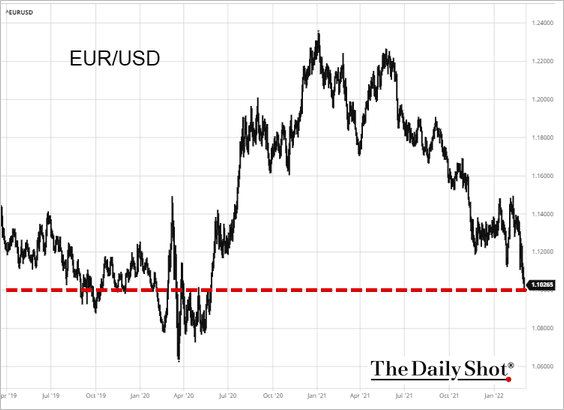
2. The euro is at support at 1.10 vs. the dollar.
 Source: barchart.com
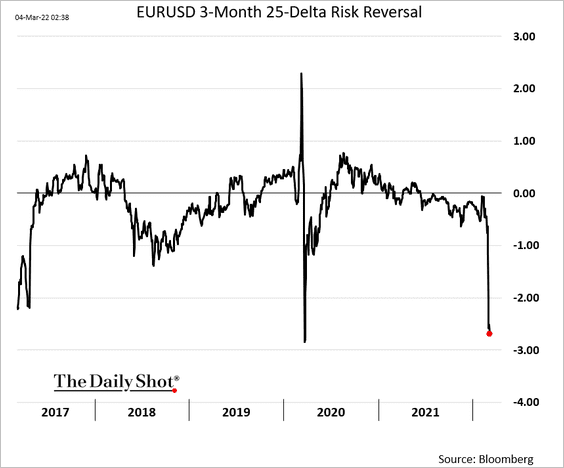
The options market sees growing downside risks for the euro.
——————–
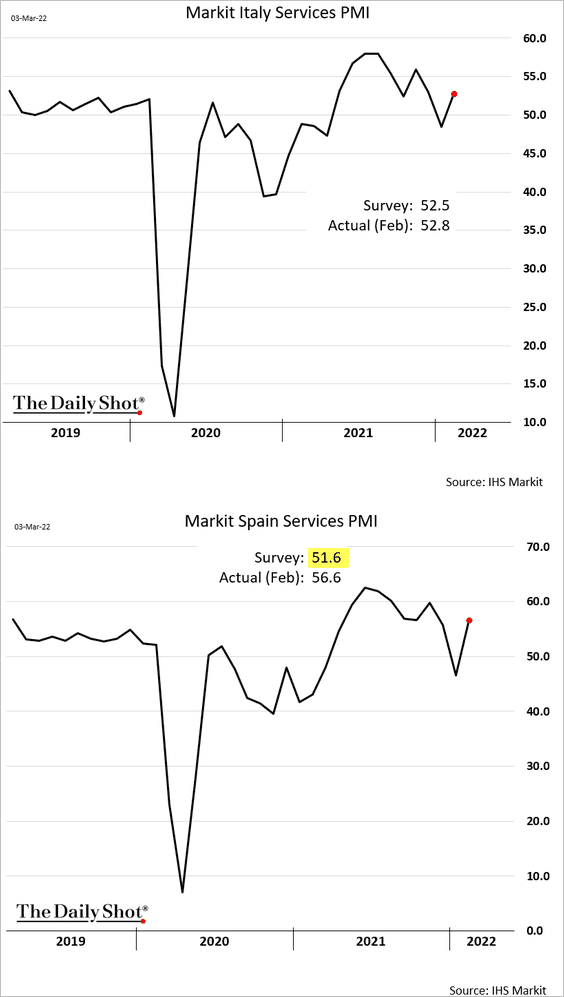
3. Italian and Spanish service sector activity improved last month as omicron receded.
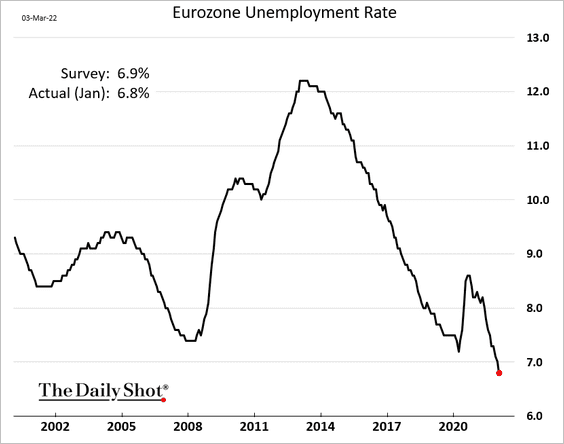
4. The unemployment rate dipped below 7% for the first time.
 Source: ING Read full article
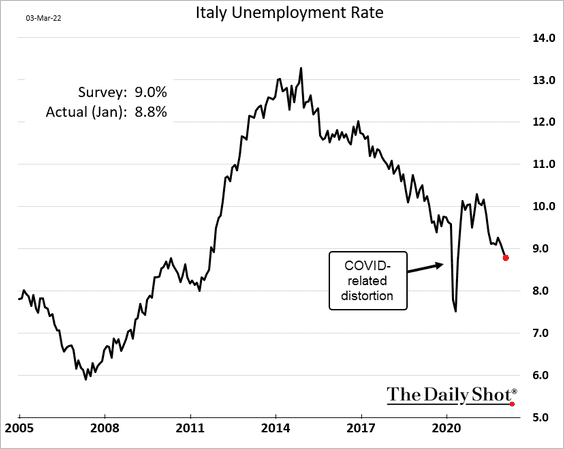
Italy’s unemployment rate is below 9%.
Back to Index
Europe
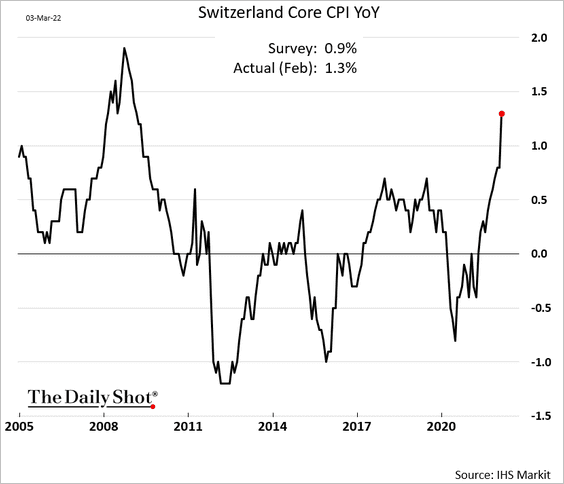
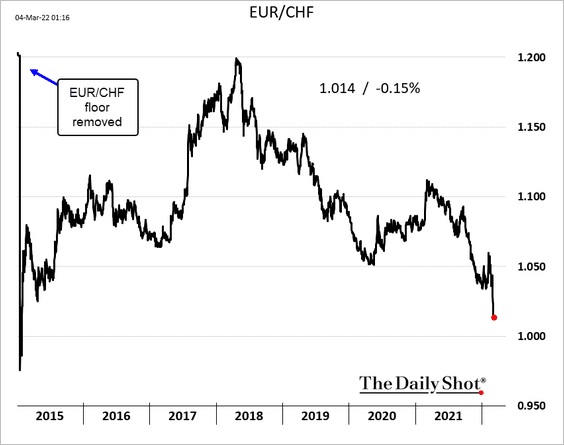
1. Switzerland is getting some inflation as the core CPI tops expectations.
The Swiss franc continues to hit multi-year lows vs. the euro amid demand for safe-haven assets.
Germany has not gained a significant yield advantage over Switzerland, which could point to further downside in EUR/CHF.
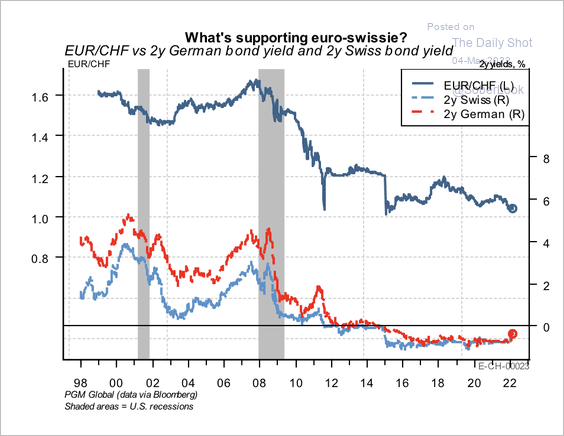 Source: PGM Global
——————–
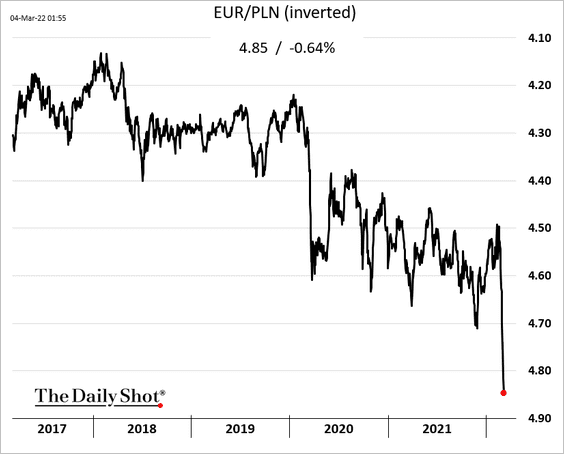
2. Central and Eastern European currencies remain under pressure. Here is the Polish zloty vs. the euro.
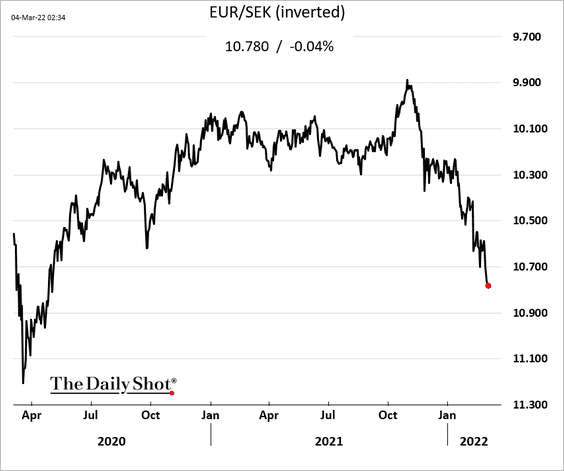
3. Sweden’s service sector activity was once again very strong last month.
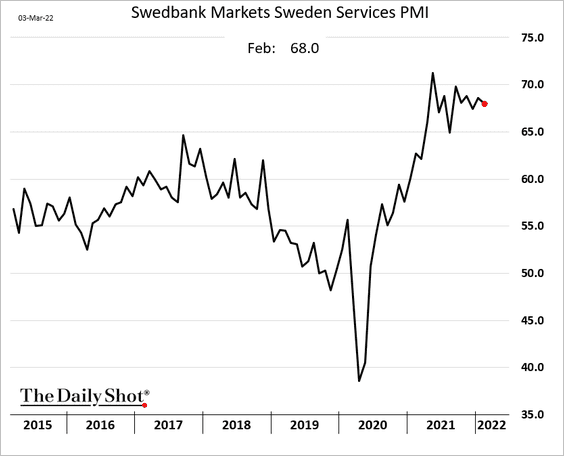
The Swedish krona remains under pressure.
——————–
4. This map shows vaccination rates across the EU.
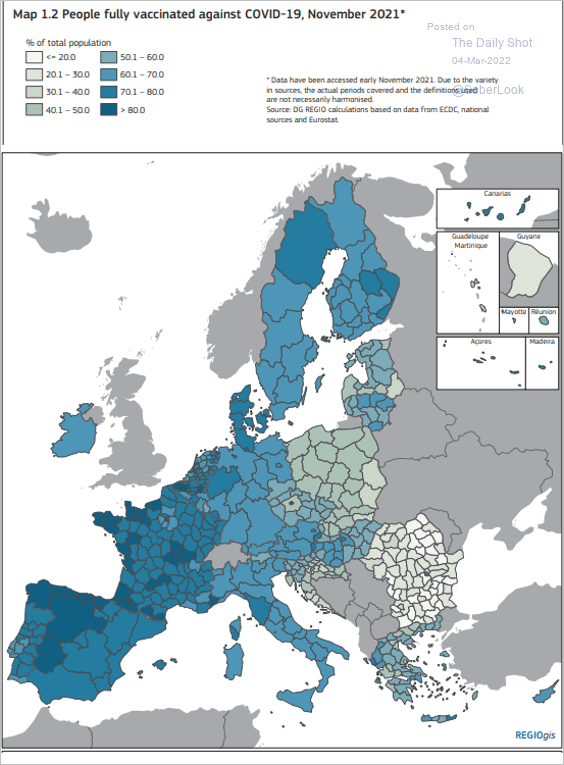 Source: EC Read full article
Back to Index
Asia – Pacific
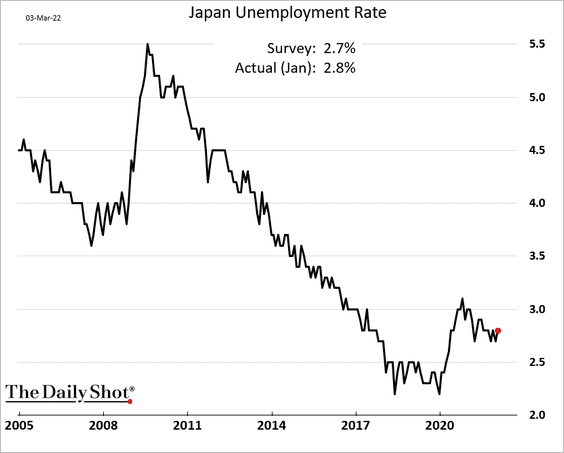
1. Japan’s unemployment rate ticked higher in January.
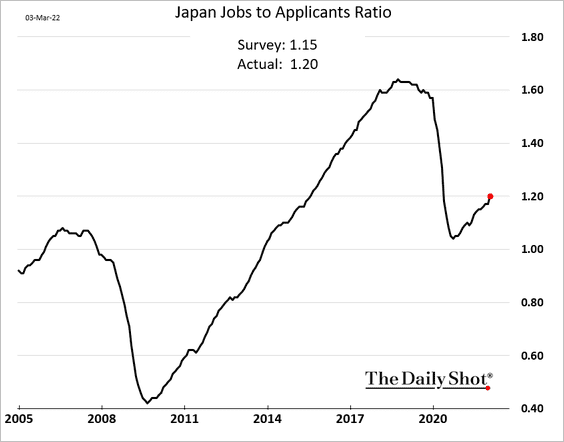
But the jobs-to-applicants ratio climbed.
——————–
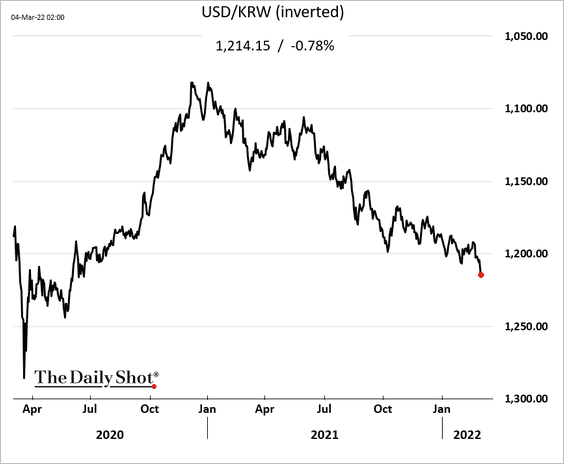
2. The South Korean won continues to move lower.
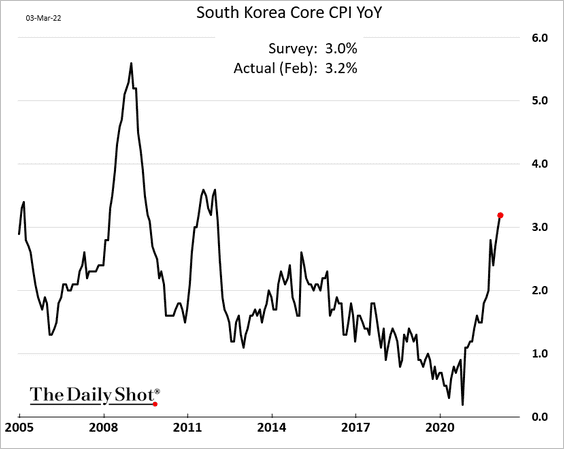
South Korea’s core CPI is above 3% for the first time in a decade.
——————–
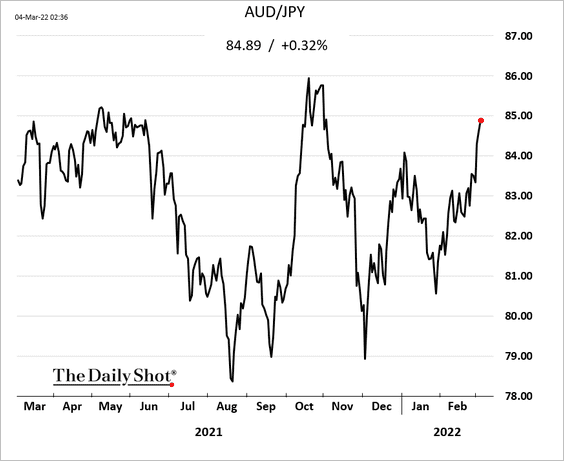
3. The Aussie-yen cross has been strengthening despite increased global risk aversion.
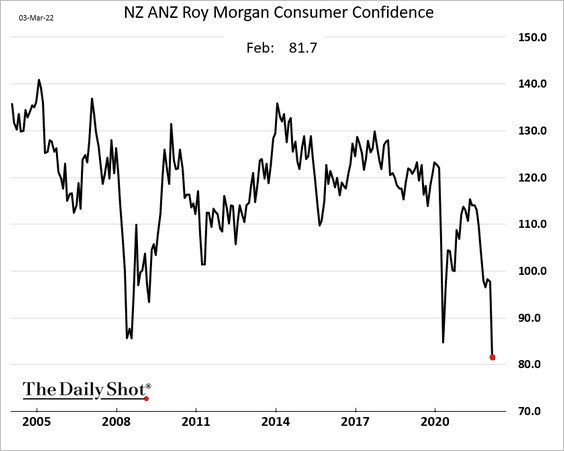
4. New Zealand’s consumer confidence has collapsed.
 Source: ForexLive Read full article
Back to Index
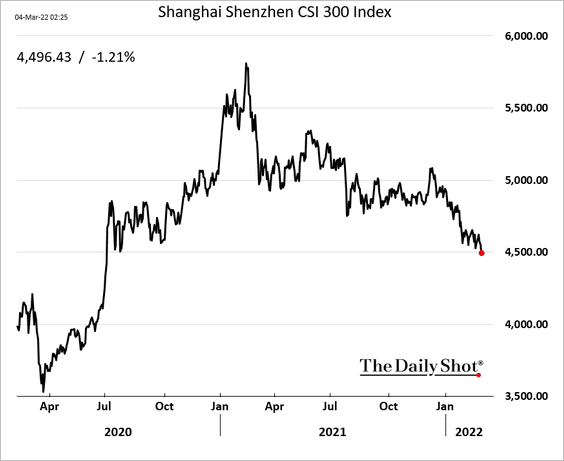
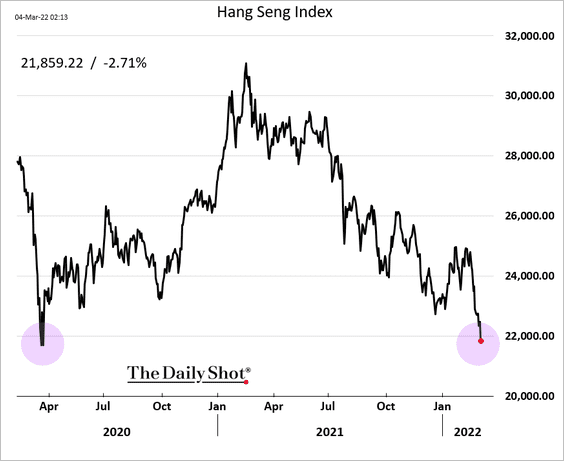
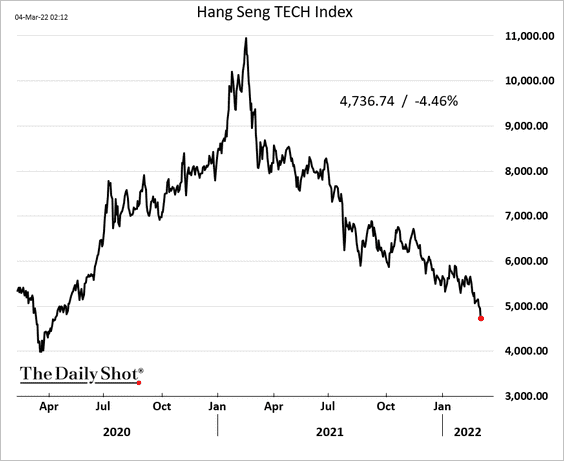
China
1. Both mainland and Hong Kong-listed stocks are struggling (3 charts).
——————–
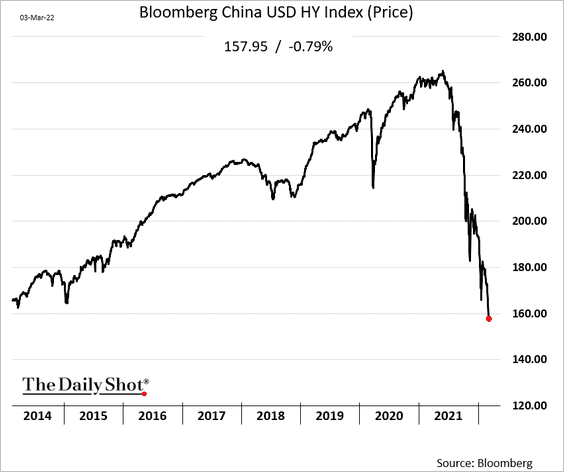
2. Pressure continues to mount on leveraged property developers.
![]() Source: Fitch Ratings Read full article
Source: Fitch Ratings Read full article
![]()
The USD-denominated high-yield bond index is at multi-year lows.
——————–
3. This chart shows China’s EV market over time.
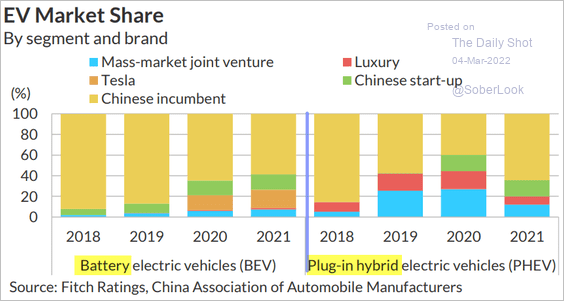 Source: Fitch Ratings
Back to Index
Emerging Markets
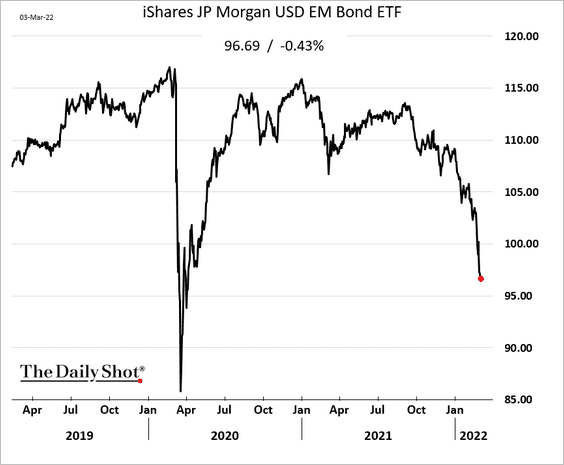
1. Dollar-denominated EM bonds continue to sink.
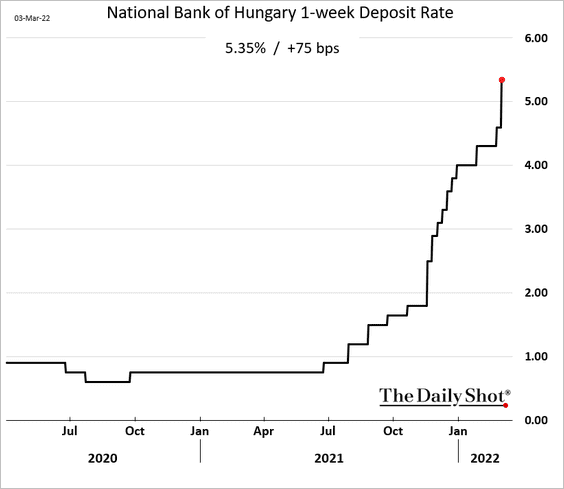
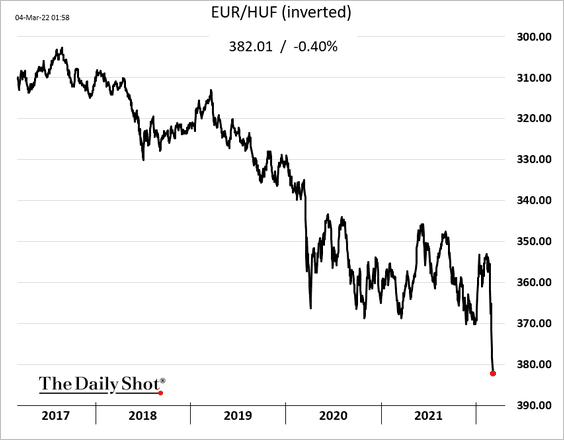
2. The Hungarian central bank increased rates sharply to defend the forint (2nd chart).
——————–
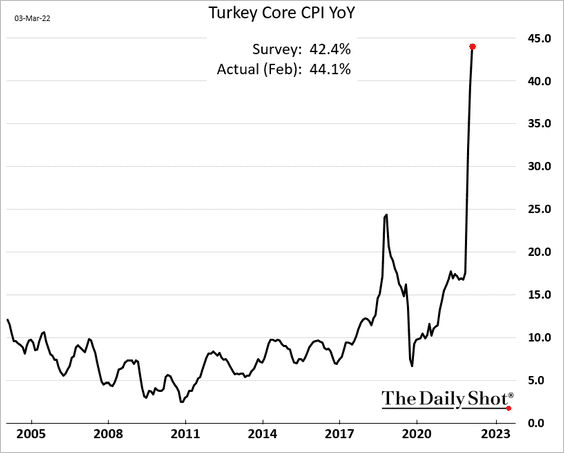
3. Turkish core inflation hit 44%. Welcome to hyperinflation.
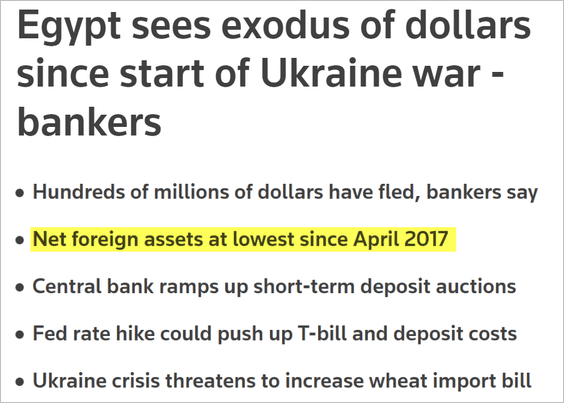
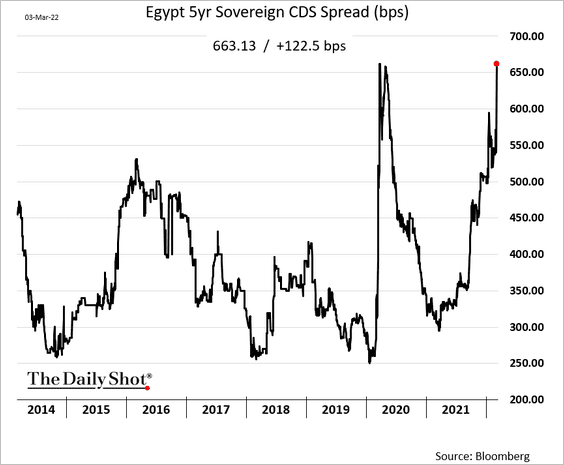
4. Egypt’s sovereign credit default swap spread has blown out as forex reserves shrink.
 Source: Reuters Read full article
——————–
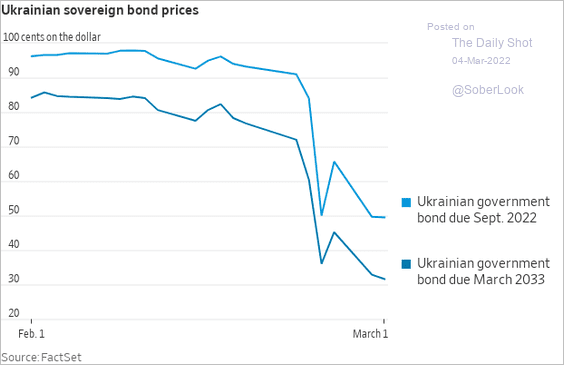
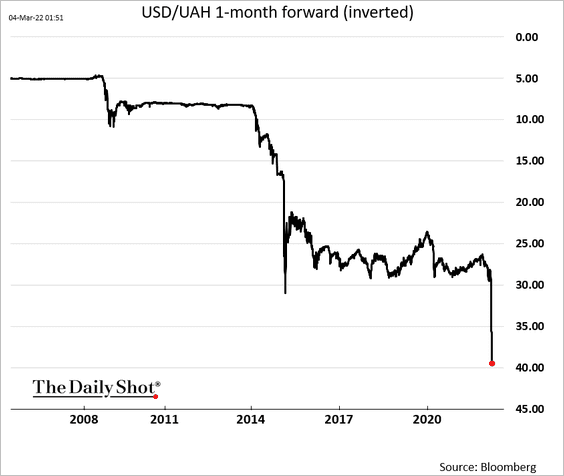
5. Ukrainian bonds and the hryvnia have plummeted since the invasion.
 Source: @WSJ Read full article
6. S&P cut Russia’s sovereign rating again.
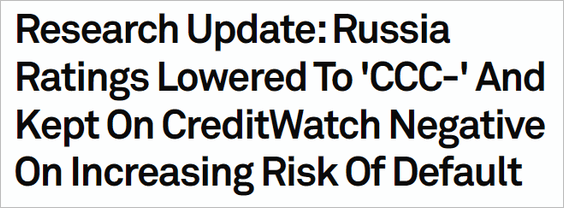 Source: S&P Global Market Intelligence Read full article
Back to Index
Cryptocurrency
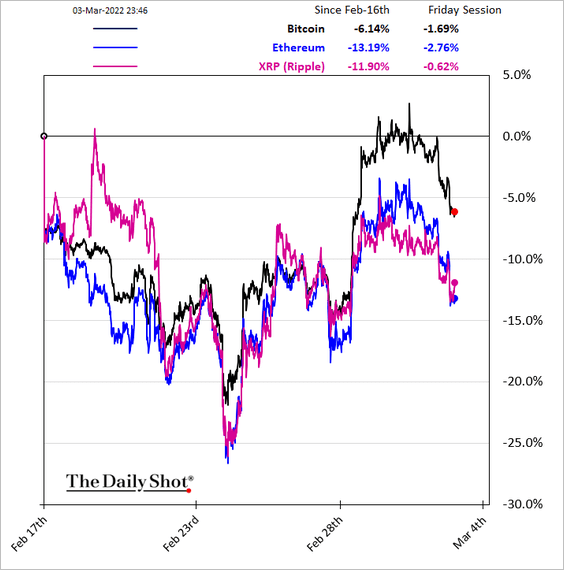
1. Bitcoin has been outperforming in recent days.
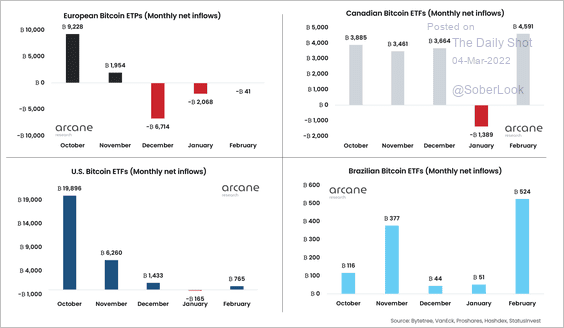
2. Here is a look at bitcoin ETP flows in February. Canada, the US, and Brazil led the way, while European products continued to see outflows.
 Source: @ArcaneResearch
3. Crypto donations to Ukraine have risen over the past week.
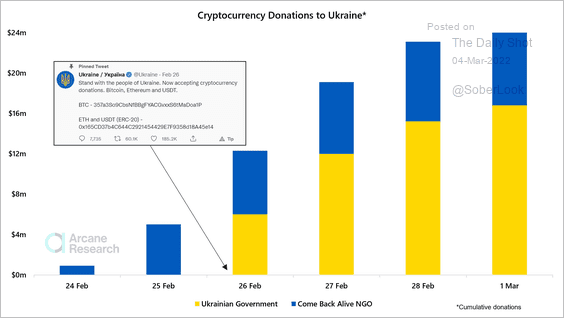 Source: @ArcaneResearch
4. The ETH/BTC price ratio continues to struggle at long-term resistance.
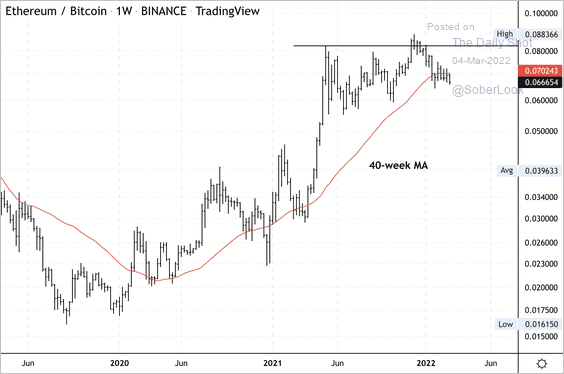 Source: CoinDesk Read full article
Back to Index
Commodities
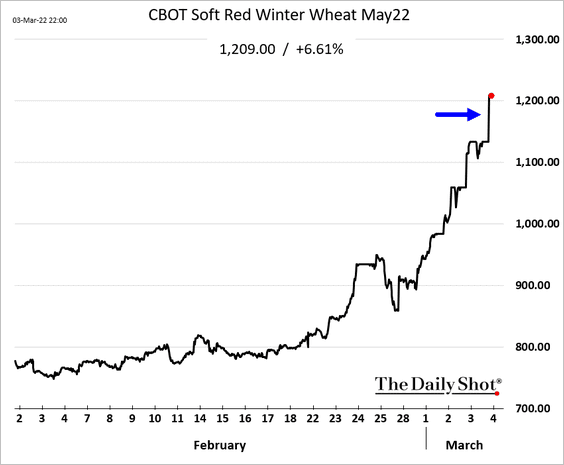
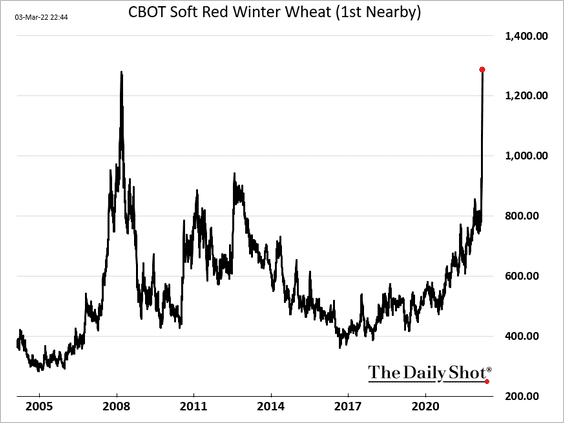
1. Wheat surged past $12/bushel on the nuclear reactor story.
——————–
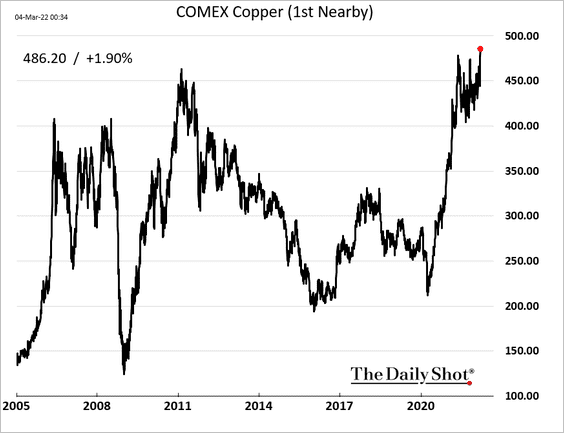
2. US copper futures hit a record high.
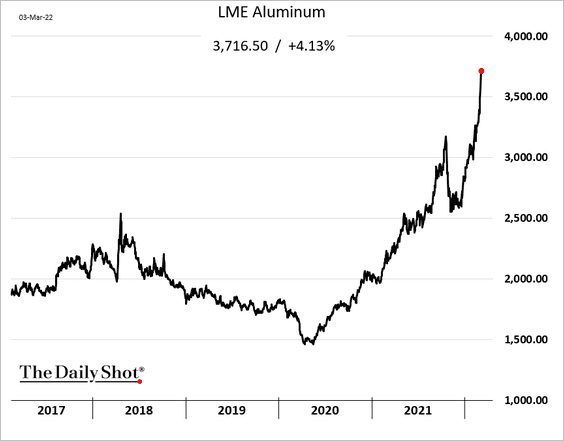
And aluminum continues to surge.
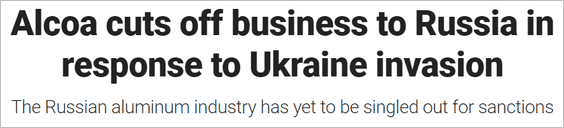 Source: FOX Business Read full article
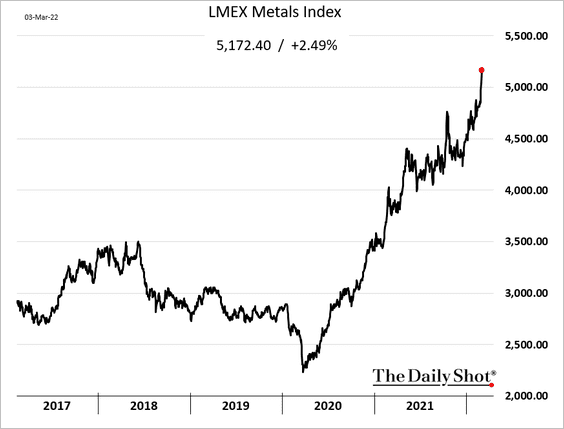
Here is the LME’s industrial metals index.
——————–
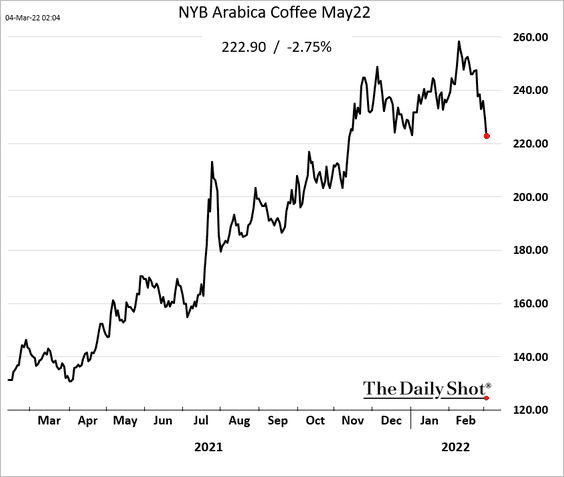
3. Coffee futures are tumbling as funds reallocate to more “lucrative” commodities (above).
Back to Index
Energy
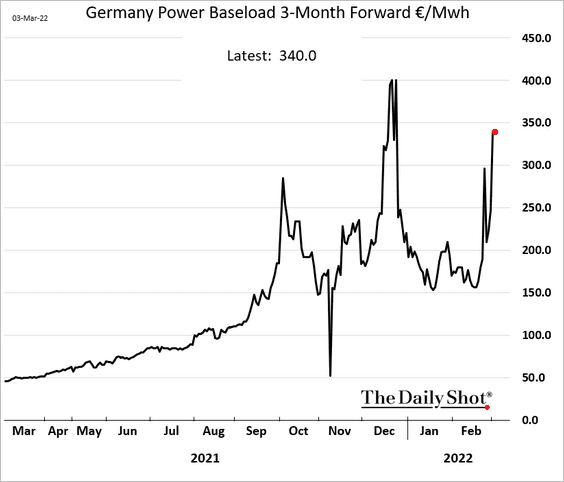
1. German power prices are surging again.
2. US net crude oil imports hit a multi-year low last week.
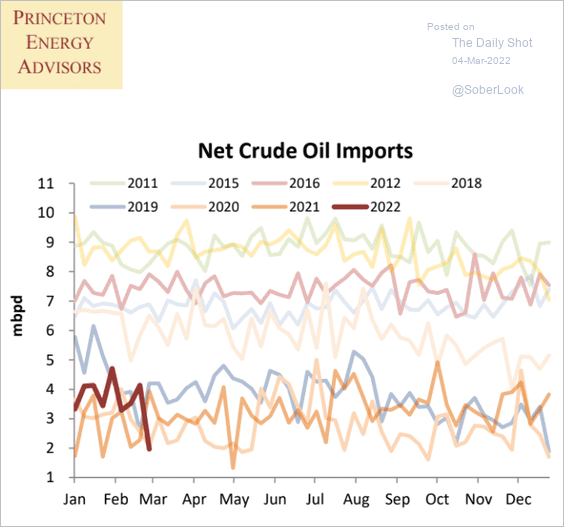 Source: Princeton Energy Advisors
3. Big oil has been buying back shares.
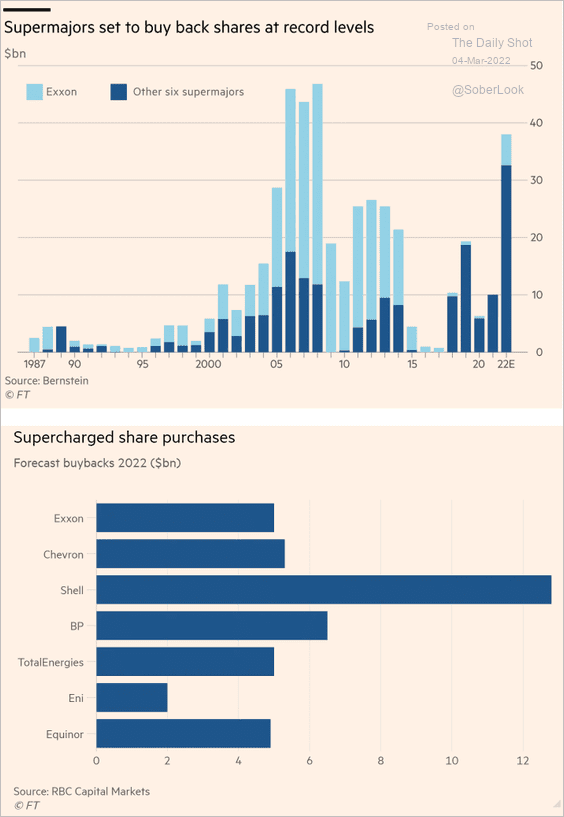 Source: @financialtimes Read full article
Back to Index
Equities
1. Speculative bets on the S&P 500 futures have been surging. However, many of these trades are hedges against short positions in individual stocks or sectors. The overall equity positioning has been fairly cautious (see chart).
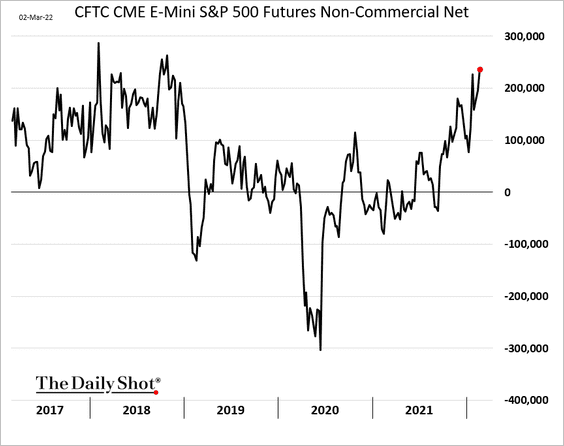
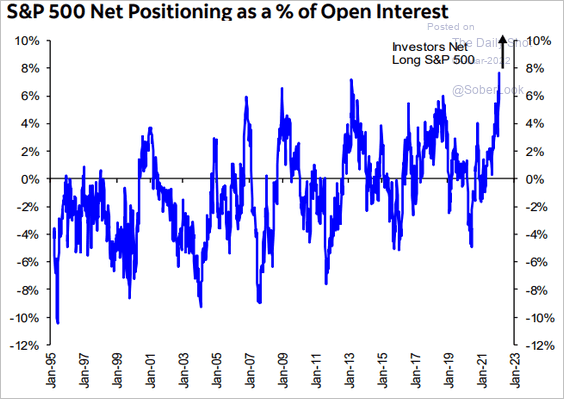 Source: Hugo Ste-Marie, Portfolio & Quantitative Strategy Global Equity Research, Scotia Capital
——————–
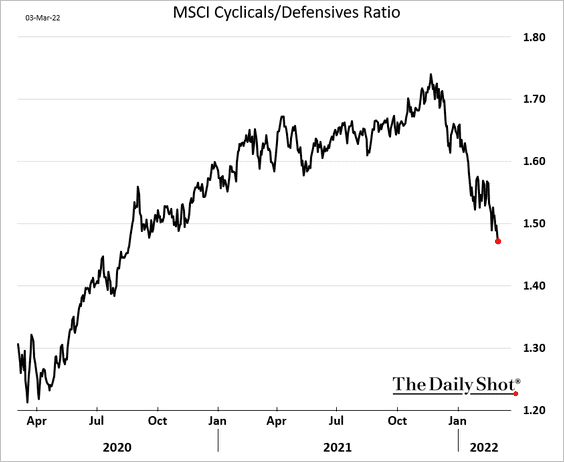
2. Cyclicals continue to tank relative to defensive sectors.
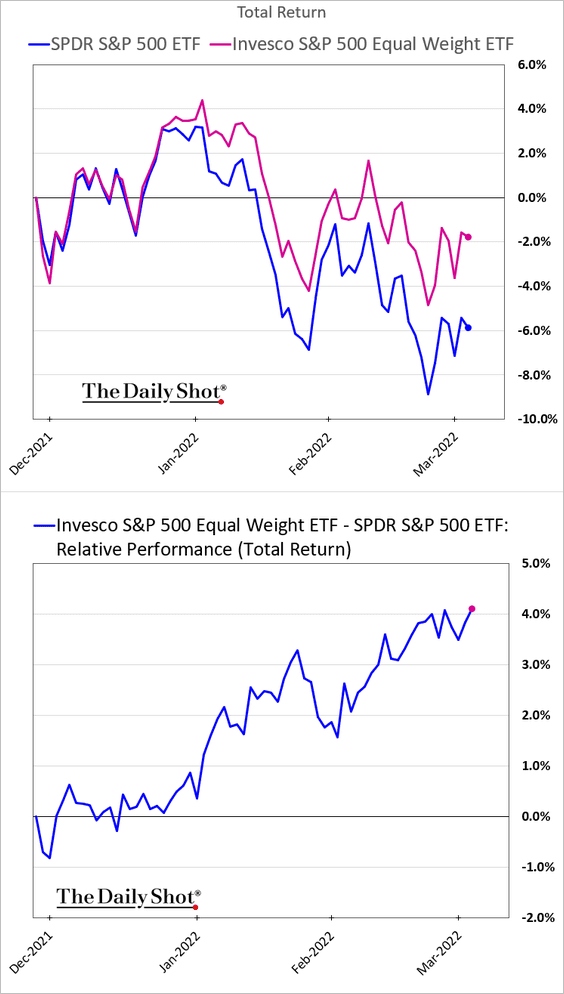
3. Equal-weight S&P 500 has been outperforming this year as the mega-caps lag.
4. The recent S&P 500 forward P/E ratio drop has been unusually rapid.
 Source: Truist Advisory Services
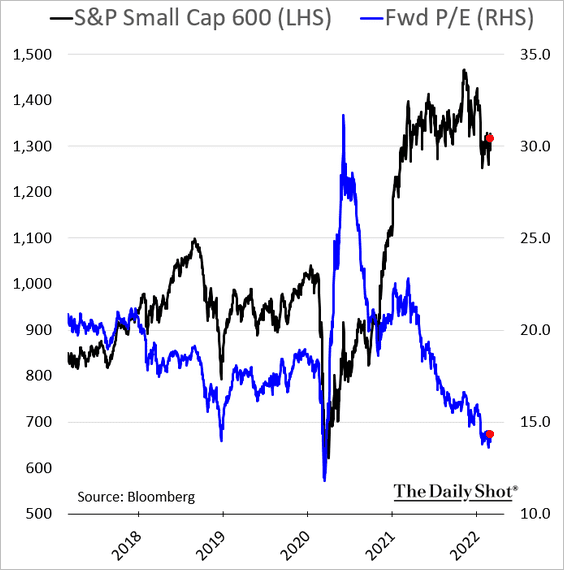
5. Small-cap valuations remain well below pre-COVID levels.
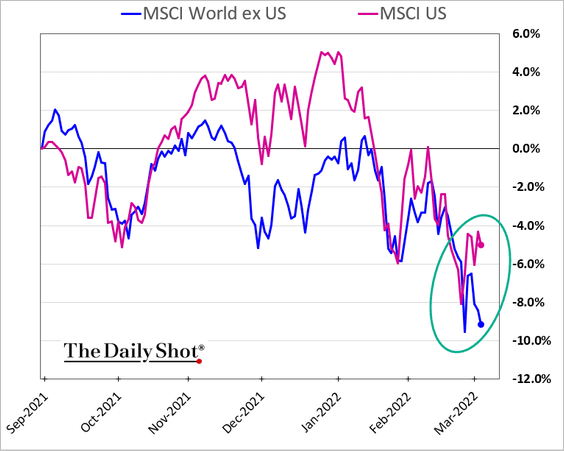
6. US shares are outperforming the rest of the world again.
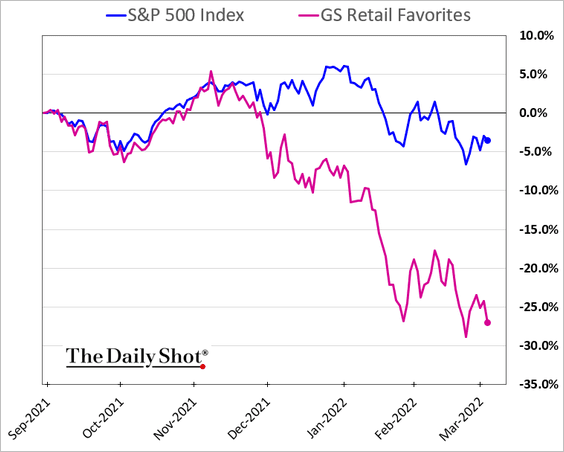
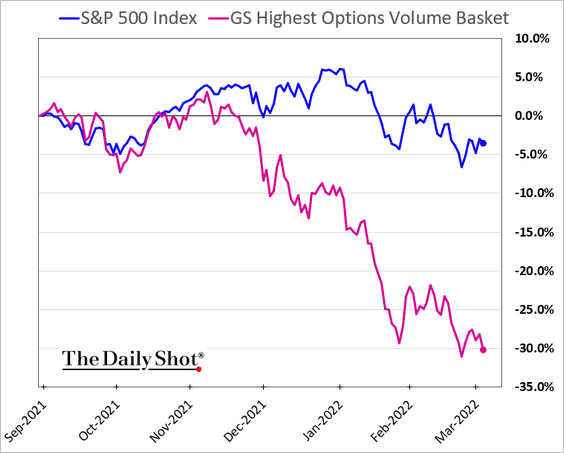
7. Stocks favored by retail investors continue to widen their underperformance (2 charts).
——————–
8. This scatterplot from Trahan Macro shows longer-term risk/reward dynamics for different tech subsectors (beta vs. P/E).
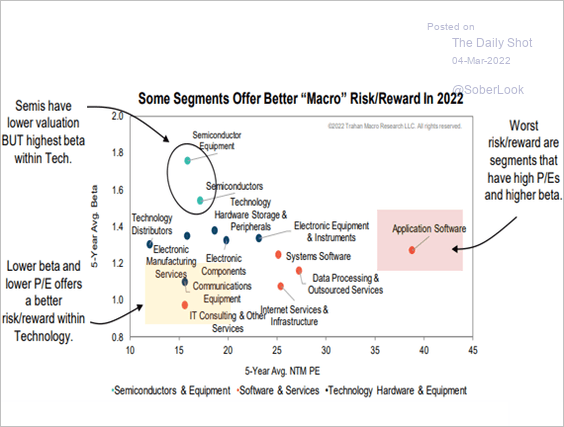 Source: Trahan Macro Research
Back to Index
Credit
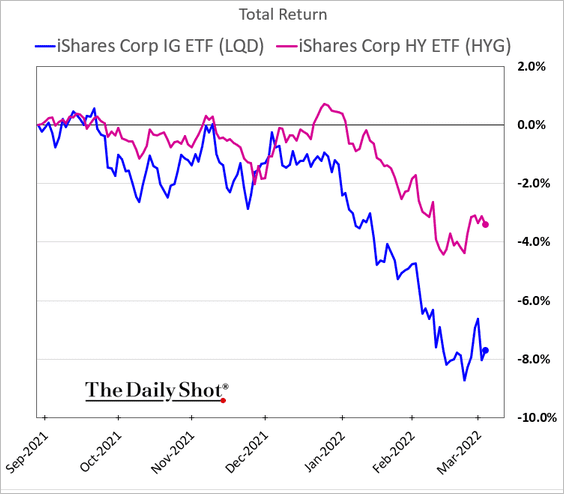
1. Helped by energy names, high-yield debt continues to outperform investment-grade bonds.
Here are the relative trajectories for energy HY spreads vs. the overall market.
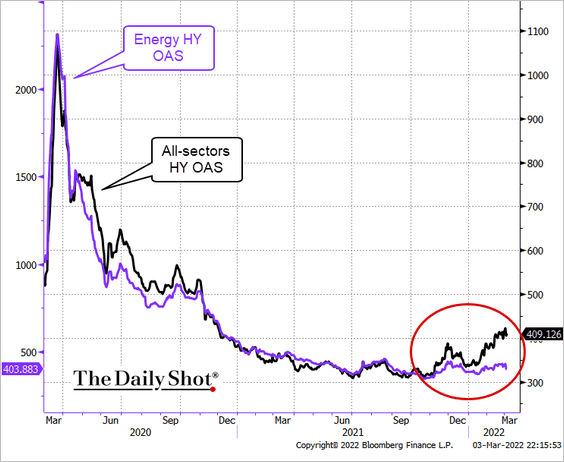 Source: @TheTerminal, Bloomberg Finance L.P.
——————–
2. This chart shows current yields across different credit categories vs. the 10-year average.
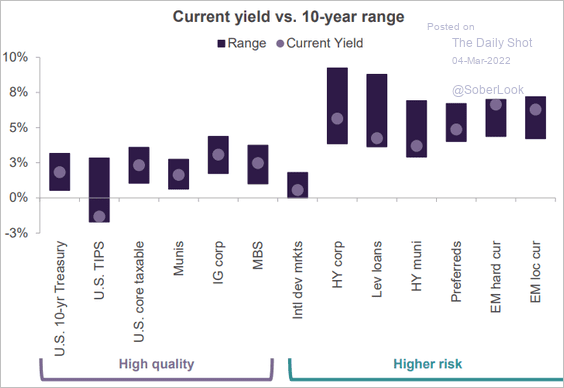 Source: Truist Advisory Services
Back to Index
Rates
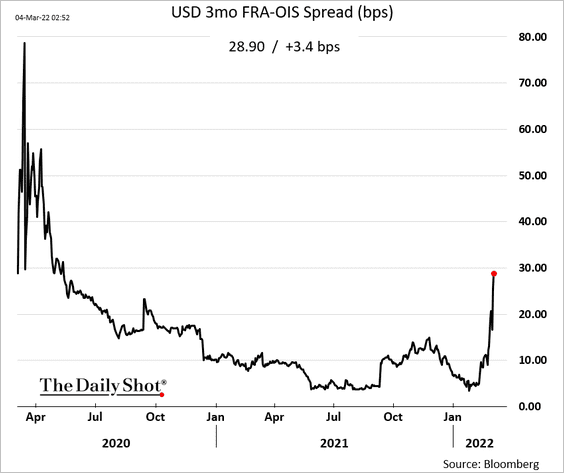
1. The FRA-OIS spreads continue to signal tightness in short-term US dollar funding markets. This is an important indicator to watch.
2. Treasury funds saw substantial inflows recently.
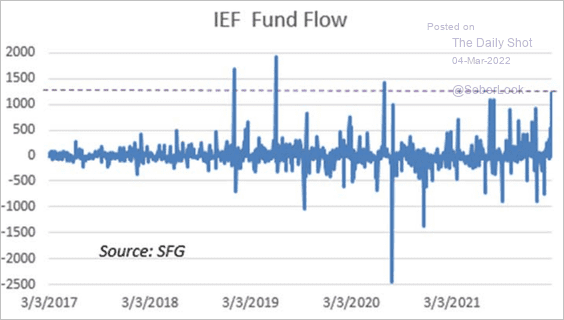 Source: Chris Murphy, Susquehanna International Group
Back to Index
Global Developments
1. Outside of emerging markets, companies have had a better than average performance at beating earnings estimates.
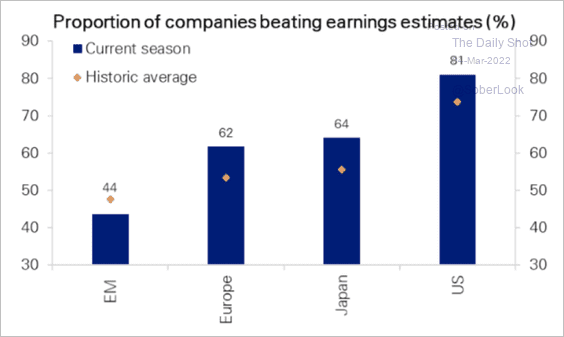 Source: Deutsche Bank Research
And here is a look at the aggregate size of earnings beats relative to historical averages.
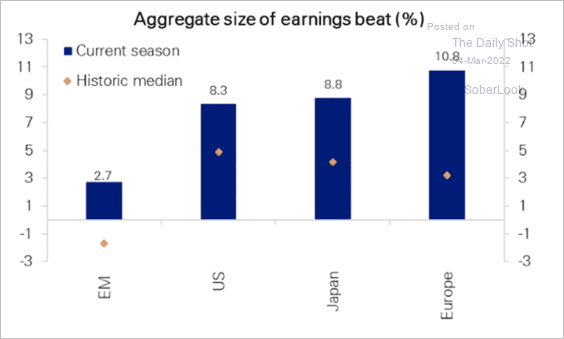 Source: Deutsche Bank Research
——————–
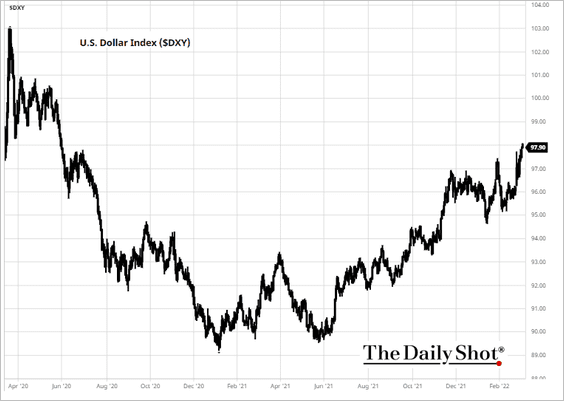
2. The US dollar continues to climb amid increased risk aversion.
 Source: barchart.com
Is the dollar overvalued?
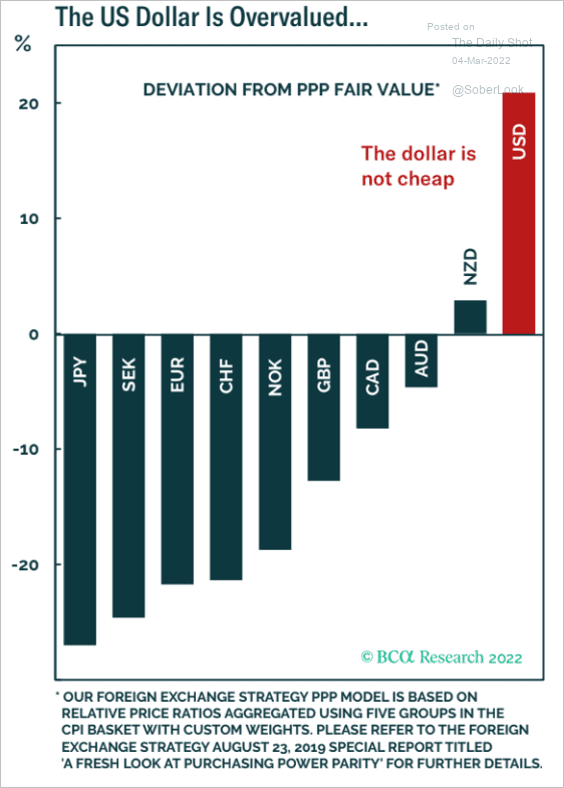 Source: BCA Research
——————–
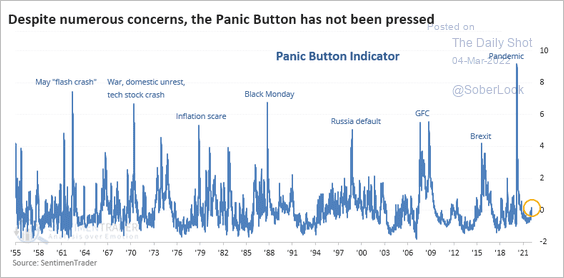
3. SentimenTrader’s “market panic” indicator is nowhere near prior extremes. The indicator incorporates volatility, interest rates, liquidity, bond spreads, and default protection costs.
 Source: SentimenTrader
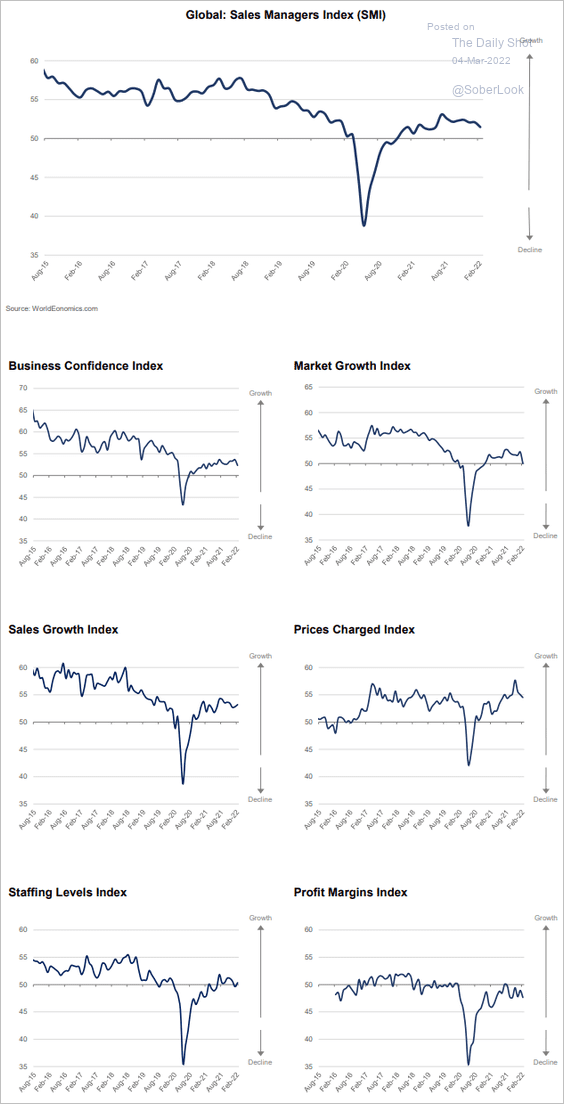
4. Global business activity growth slowed last month, according to the World Economics SMI report.
 Source: World Economics
5. What are the drivers of inflation in advanced economies?
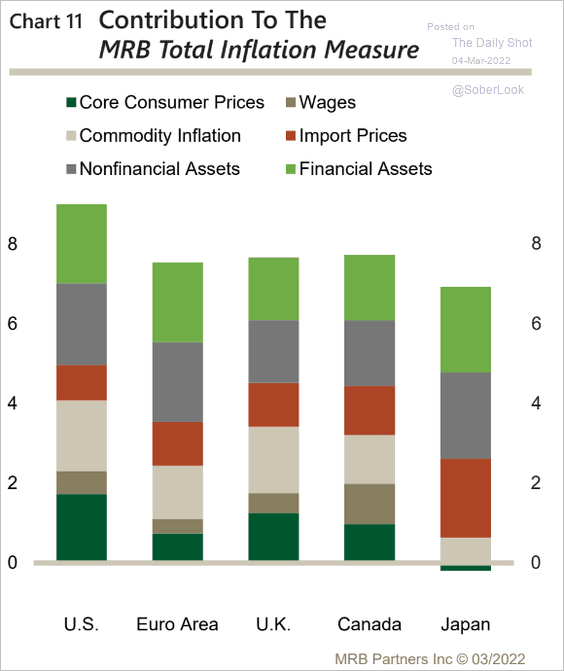 Source: MRB Partners
——————–
Food for Thought
1. Used car prices, by model year:
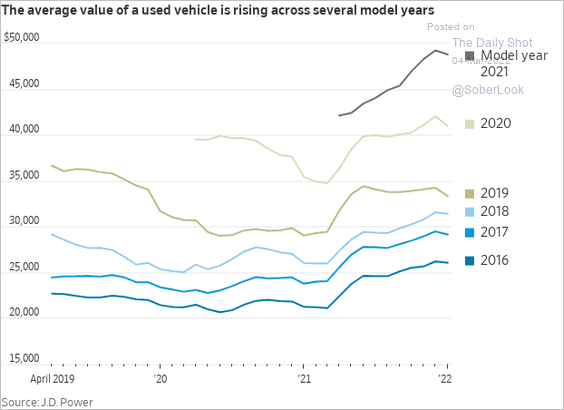 Source: @WSJ Read full article
2. GDP per capita vs. life expectancy:
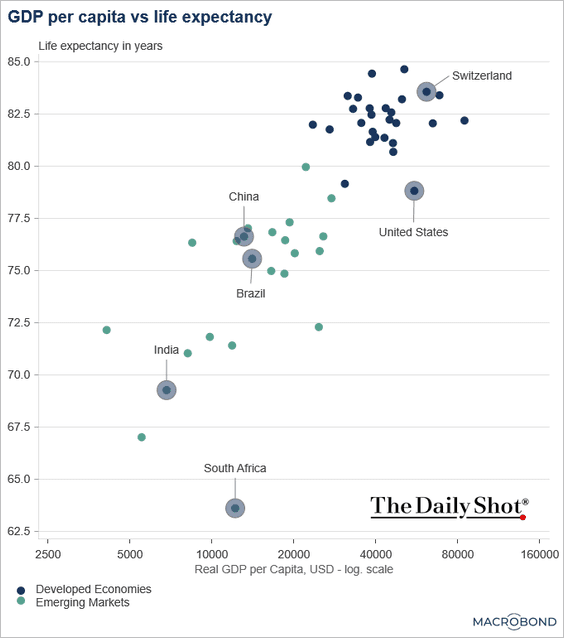 Source: Chart and data provided by Macrobond
3. US private pensions are well funded.
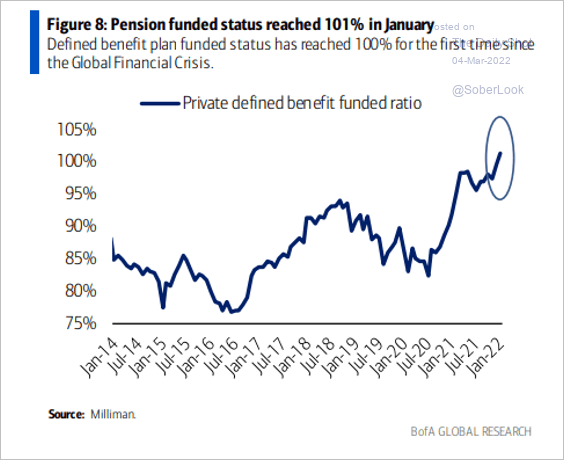 Source: BofA Global Research; @MikeZaccardi
4. When US mothers have their children:
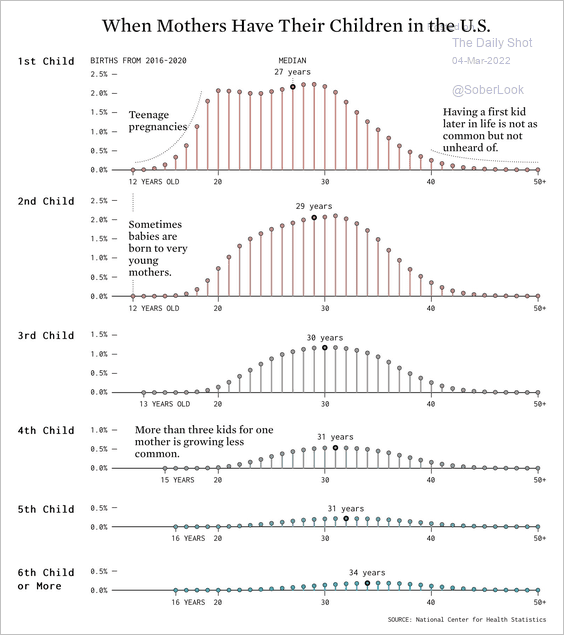 Source: @flowingdataThe Read full article
5. Summer vs. Winter Olympics gap in social engagement:
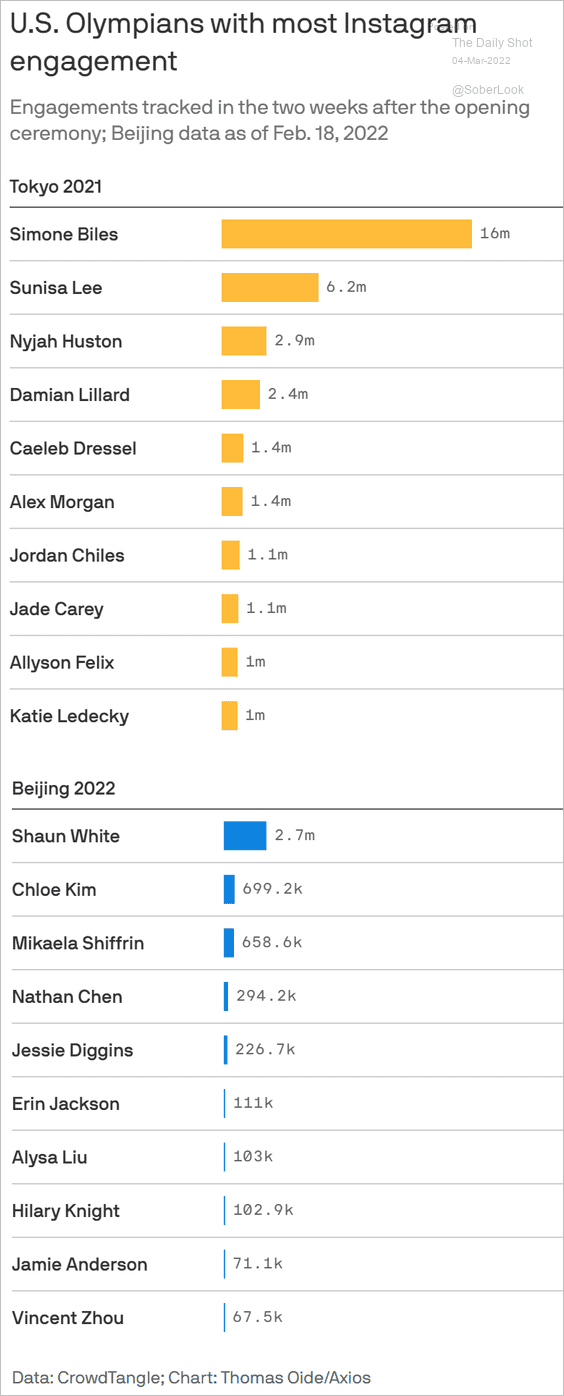 Source: @axios Read full article
6. COVID variants:
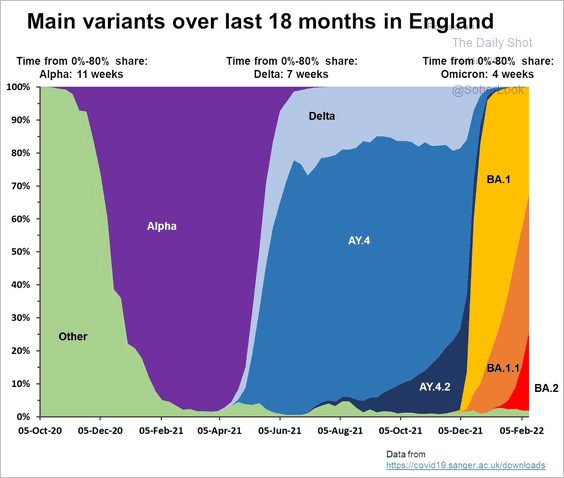 Source: @chrischirpTHREAD
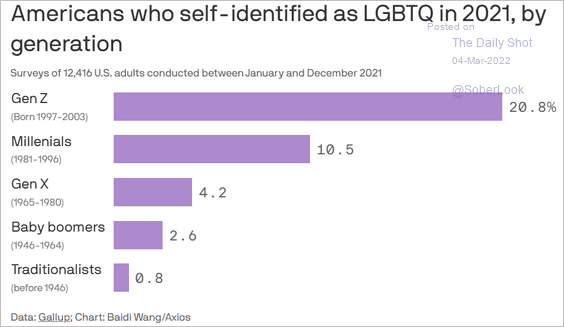
7. Americans identifying as LGBTQ (2 charts):
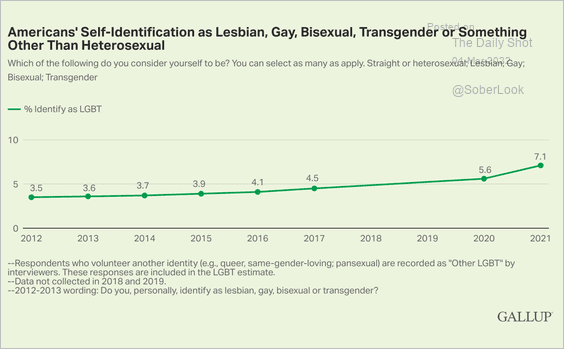 Source: Gallup Read full article
 Source: @axios Read full article
——————–
8. Capital allocation among major firms:
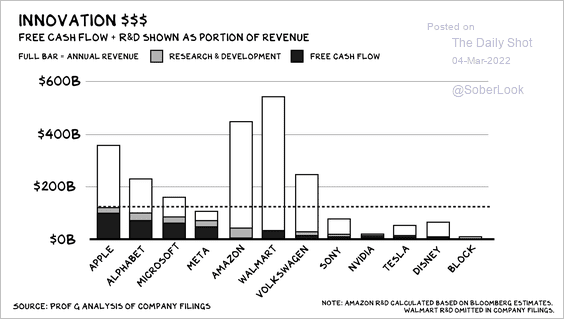 Source: Scott Galloway Read full article
9. Popular food delivery services:
 Source: Statista
10. Eating breakfast:
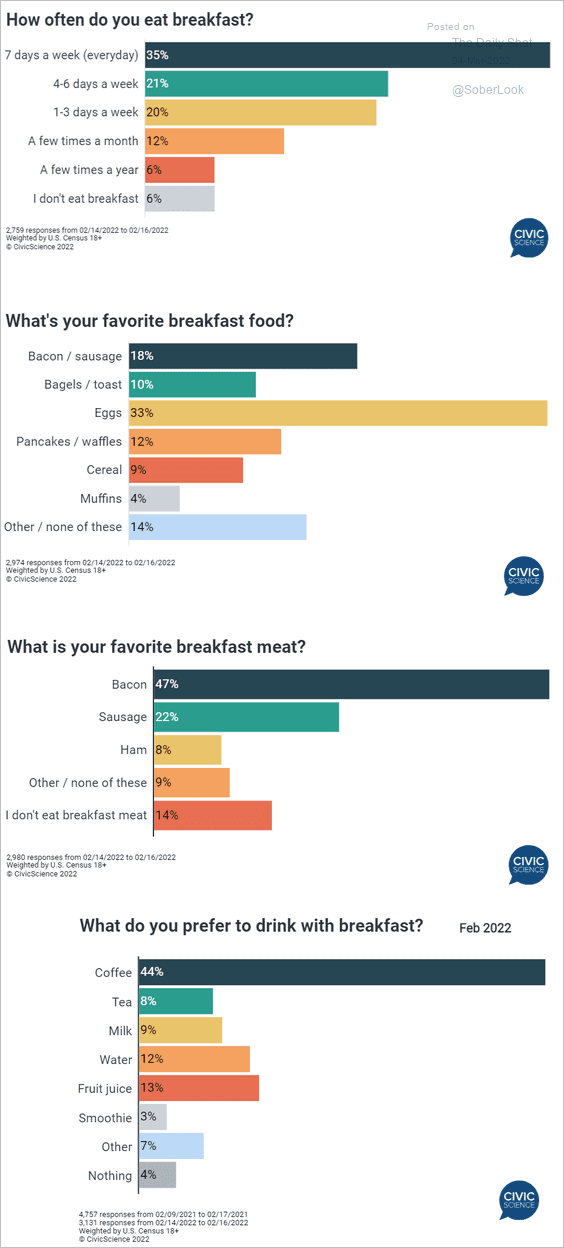 Source: @CivicScience Read full article
——————–
Have a great weekend!
Back to Index