
The Daily Shot: 07-Mar-22
• Energy
• Commodities
• Equities
• Credit
• Rates
• Cryptocurrency
• Emerging Markets
• China
• Asia – Pacific
• The Eurozone
• Europe
• The United Kingdom
• Canada
• The United States
• Global Developments
• Food for Thought
Energy
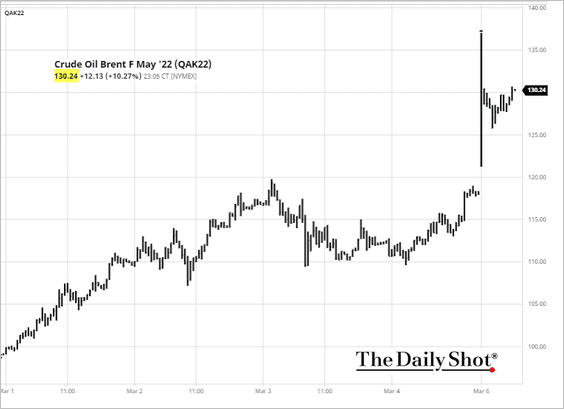
1. Discussions of a Russian oil embargo and a setback in the Iran deal sent crude oil to multi-year highs. At this point, however, it’s not clear if Europe will agree to halt Russian oil purchases.
 Source: Reuters Read full article
 Source: Politico Read full article
 Source: barchart.com
——————–
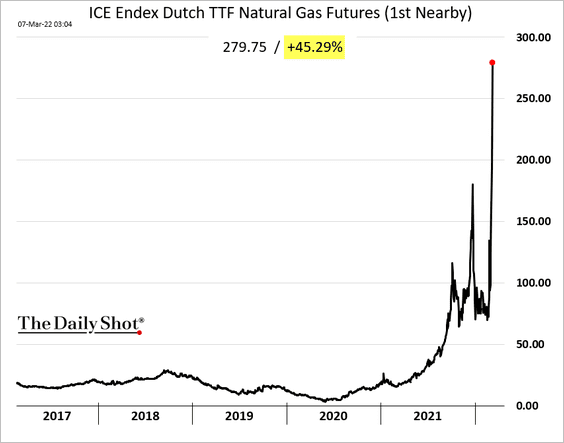
2. European natural gas is up 45% today on Russian supply concerns.
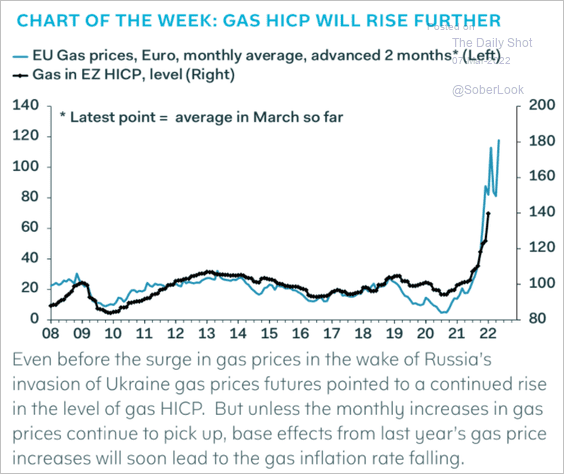
• We are going to see this trend feed into inflation measures in the months ahead.
 Source: Pantheon Macroeconomics
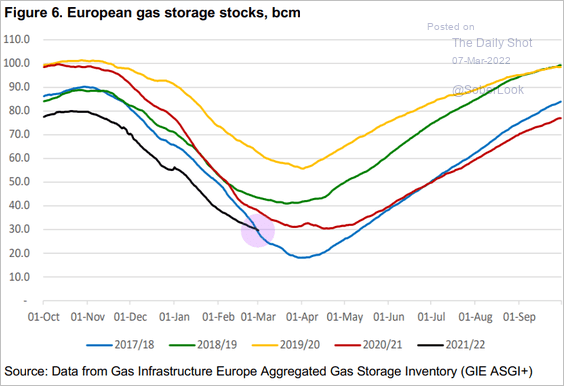
• Natural gas inventories are low but not extreme for now.
 Source: Oxford Institute for Energy Studies
• EU LNG imports continue to grow.
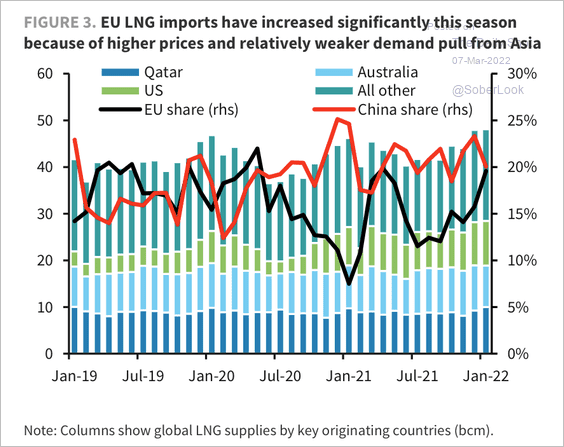 Source: Barclays Research
• Russian gas flows to Europe have fallen so far this year – well below the five-year average.
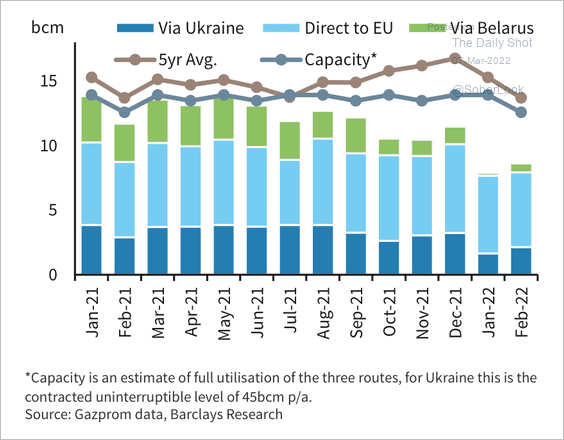 Source: Barclays Research
• Here is an overview of Europe’s reliance on Russian natural gas.
 Source: @ntsafos
——————–
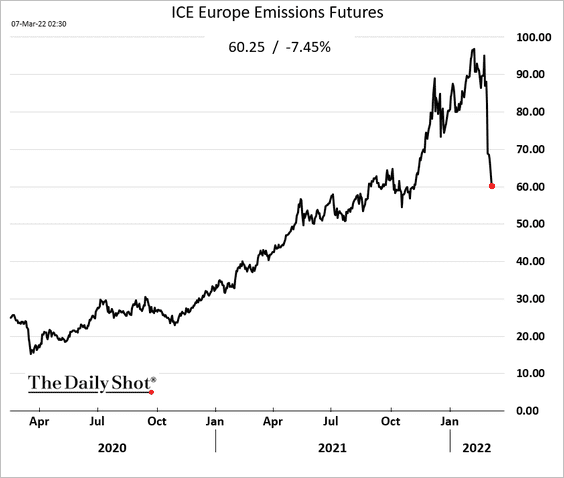
3. European emissions futures are tumbling as the war spooks investors.
Back to Index
Commodities
1. COMEX copper futures hit a record high.
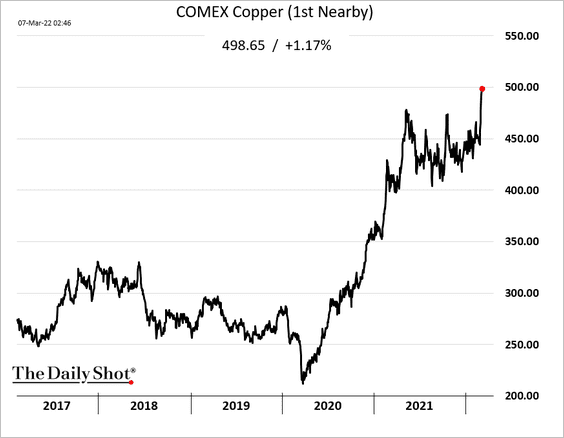
Copper inventories could be depleted by the end of this year.
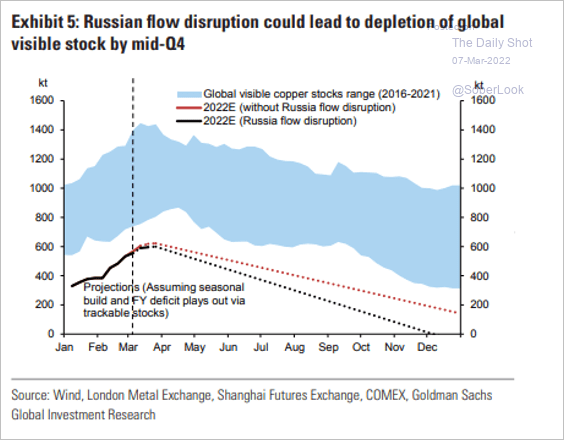 Source: Goldman Sachs; @chigrl
——————–
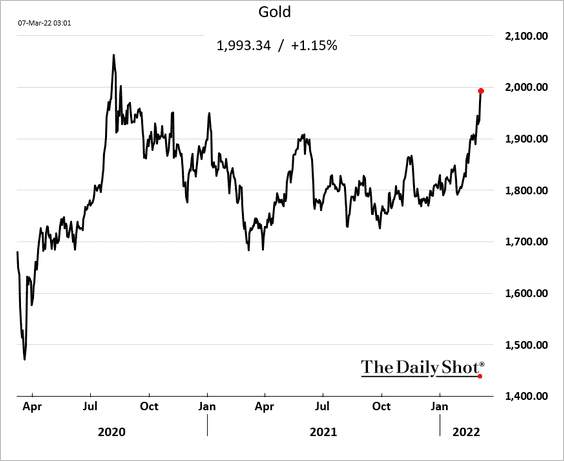
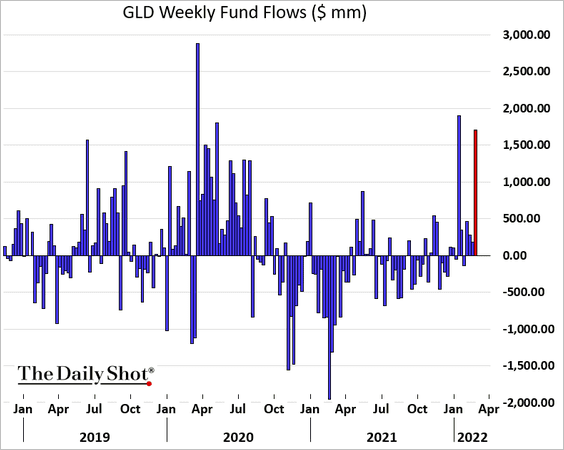
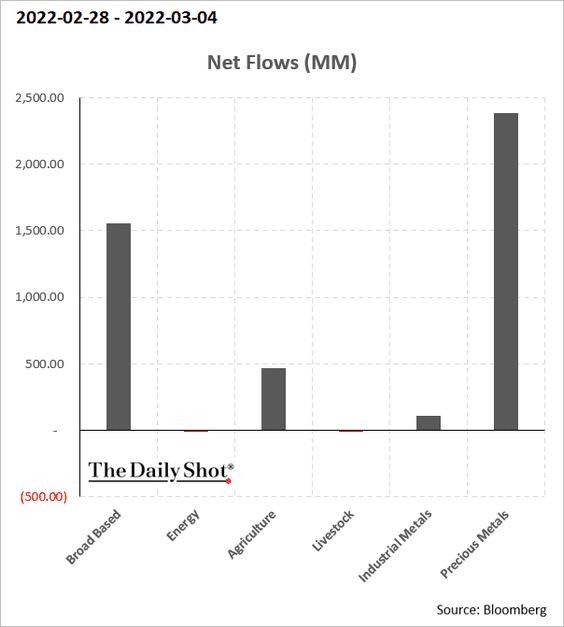
2. Gold is nearing $2,000/oz amid strong fund flows (3 charts).
——————–
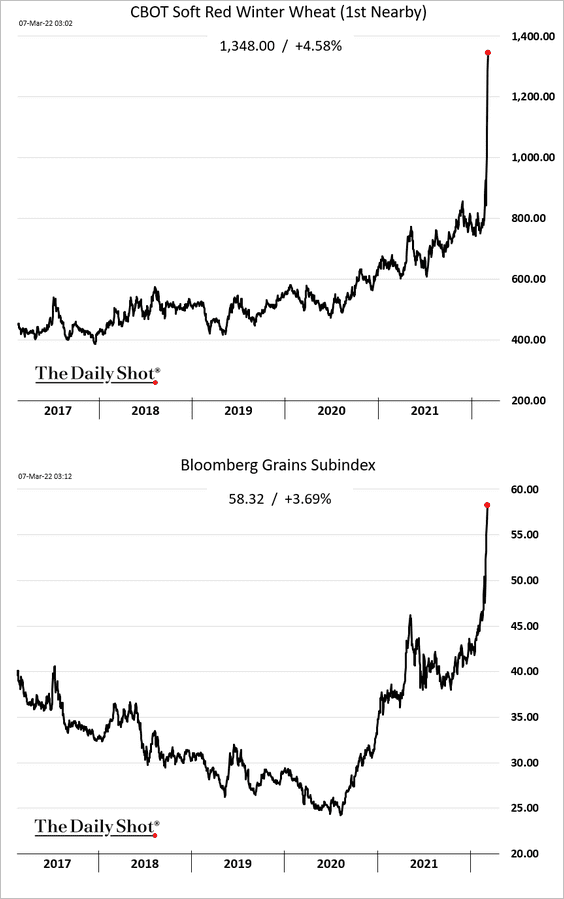
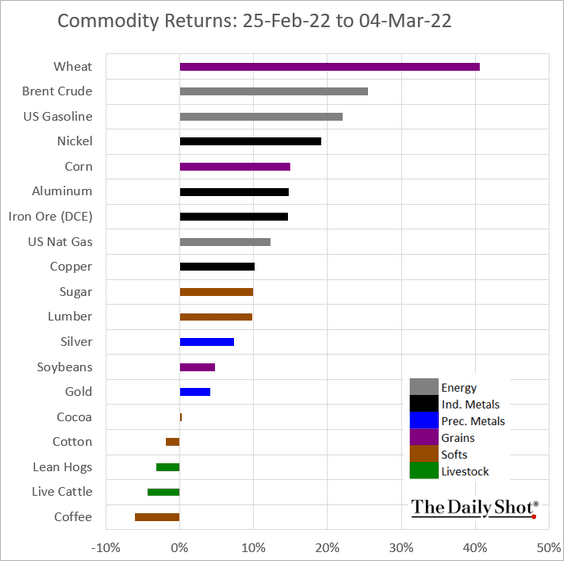
3. Wheat keeps hitting new highs.
Here are last week’s returns by commodity.
——————–
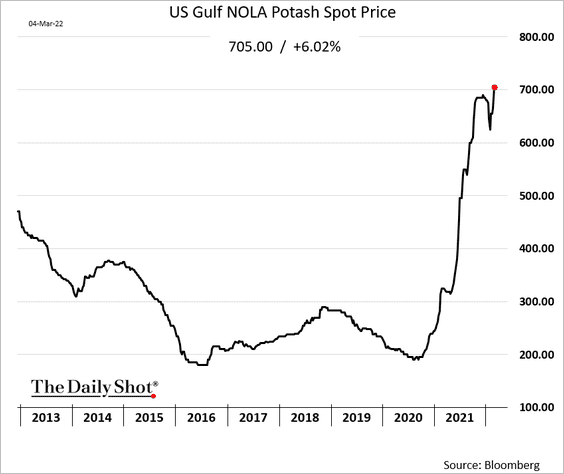
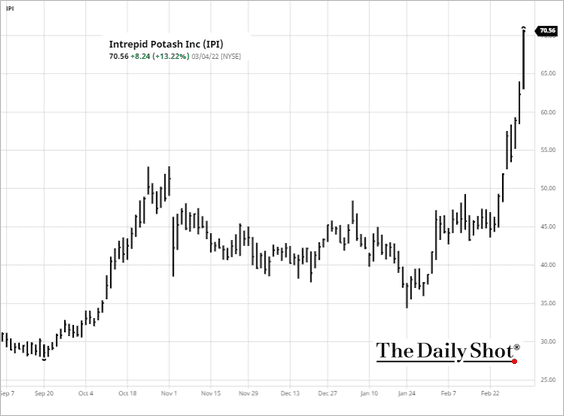
4. Fertilizer prices continue to climb, boosting shares of companies in the sector.
 Source: barchart.com, h/t Walter
——————–
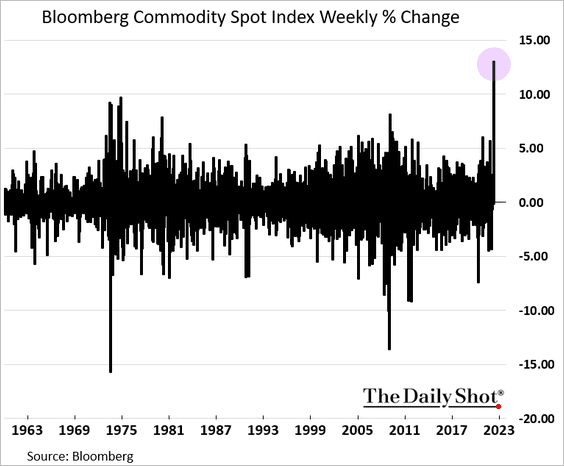
5. Bloomberg’s spot commodity index had the best week since the early 1960s.
Back to Index
Equities
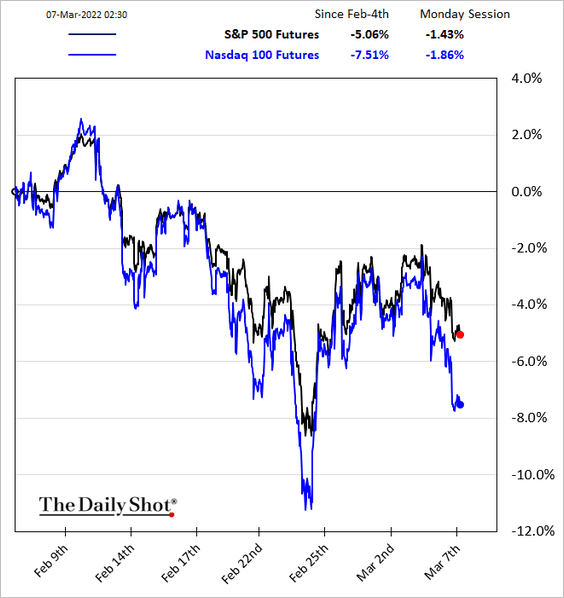
1. Global stocks, US futures are heavy as oil surges to new highs.
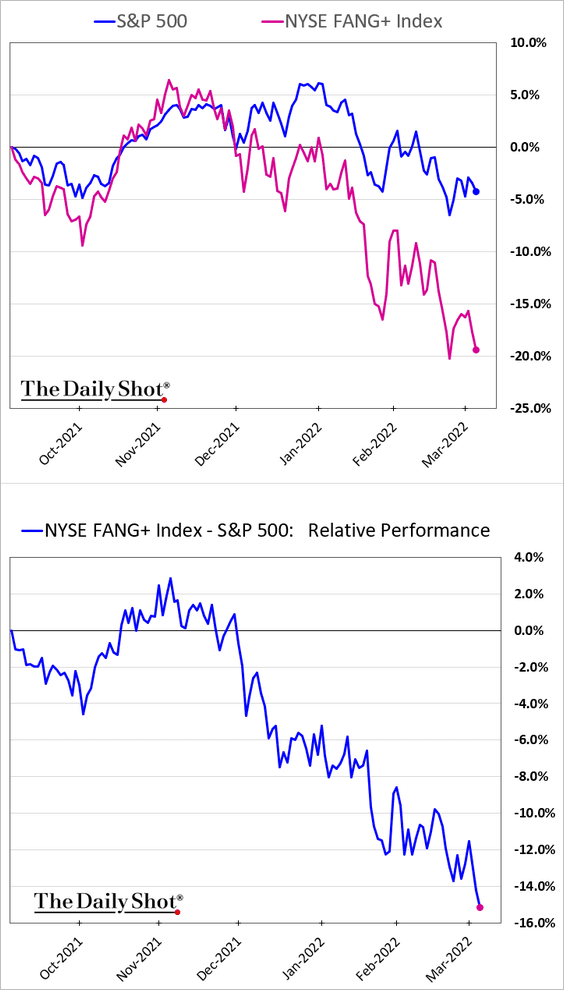
2. US mega-caps continue to widen their underperformance.
Mega-cap relative valuations are yet to hit pre-COVID levels.
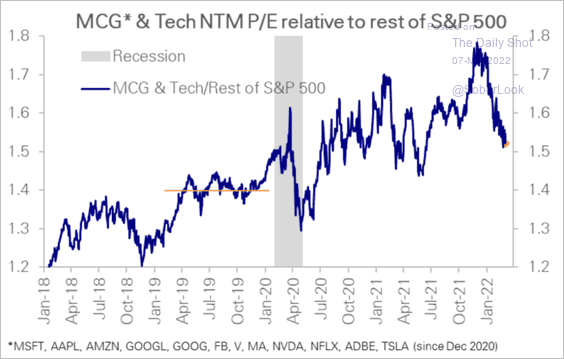 Source: Deutsche Bank Research
——————–
3. According to FactSet, 64 companies issued negative guidance for Q1.
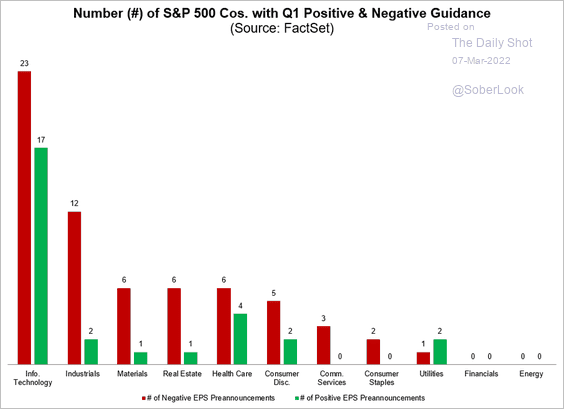 Source: @FactSet Read full article
4. Sentiment has deteriorated further.
• CNN’s fear/greed index:
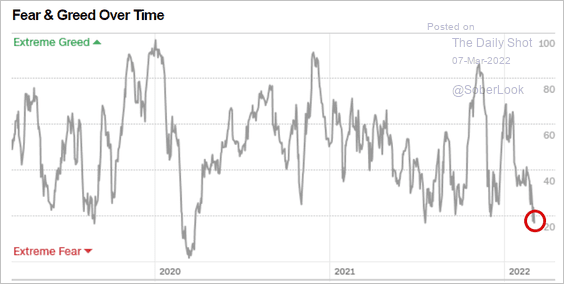 Source: CNN Business
• Investment Managers’ sentiment:
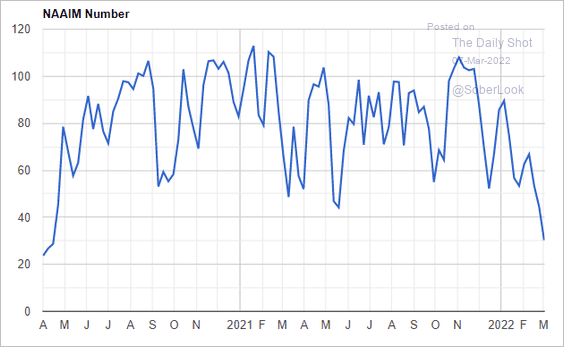 Source: NAAIM
But the S&P 500 ETF (SPY) put/call ratio declined toward neutral levels, indicating less pessimism among market participants.
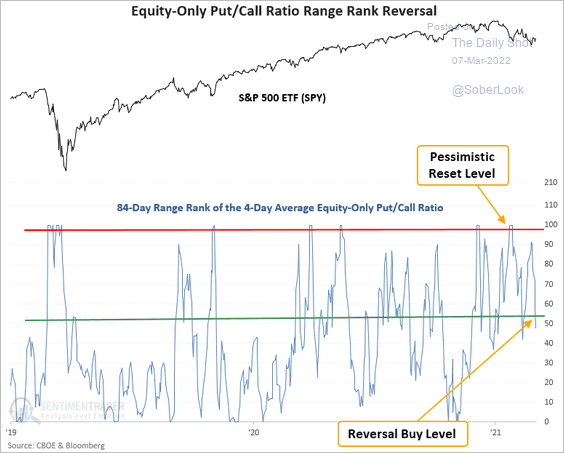 Source: SentimenTrader
——————–
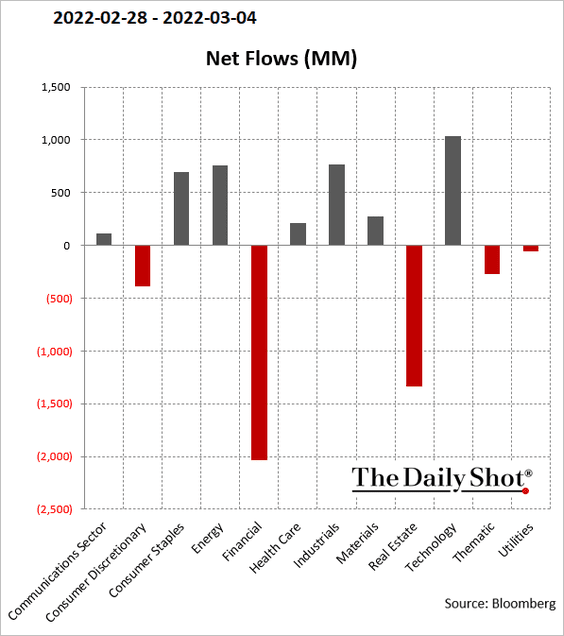
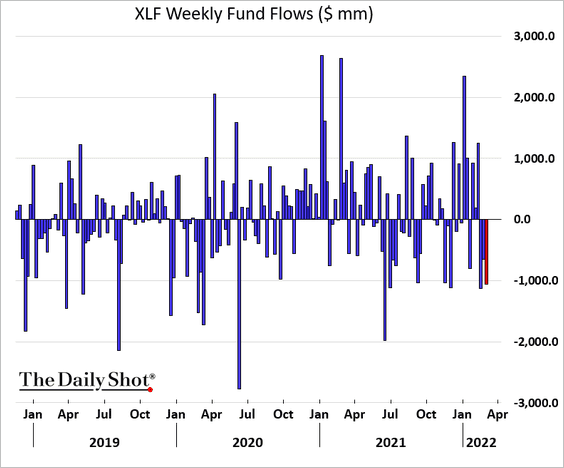
5. Financials have been experiencing outflows in recent weeks as Treasury yields decline.
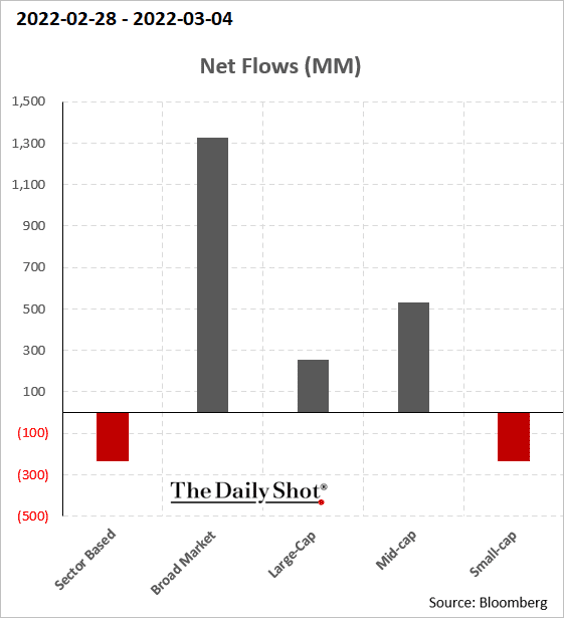
But broad equity market funds saw modest inflows last week.
——————–
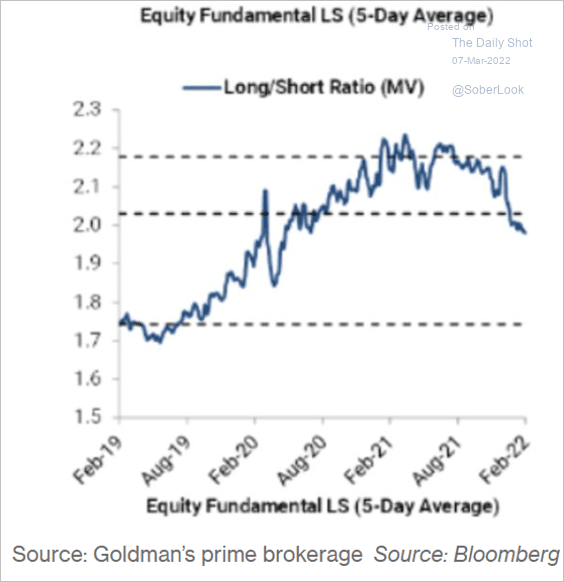
7. Long/short hedge funds continue to cut back their net exposure.
 Source: Bloomberg Read full article
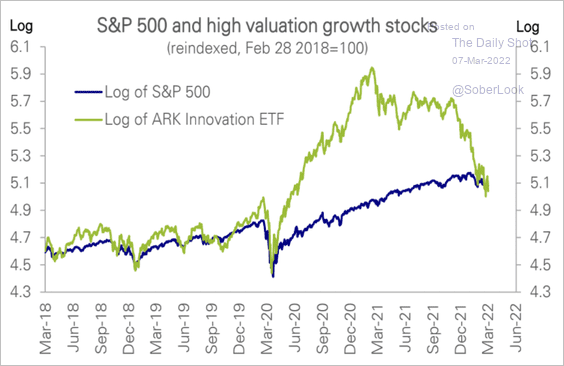
8. The massive pandemic-era thematic investment flows are getting unwound.
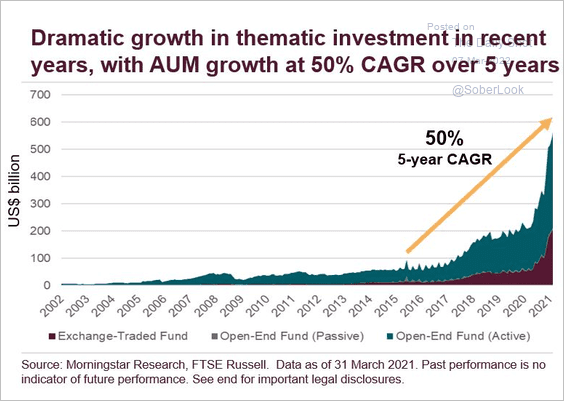 Source: FTSE Russell Read full article
ARK Innovation once again underperformed other thematic funds last week.
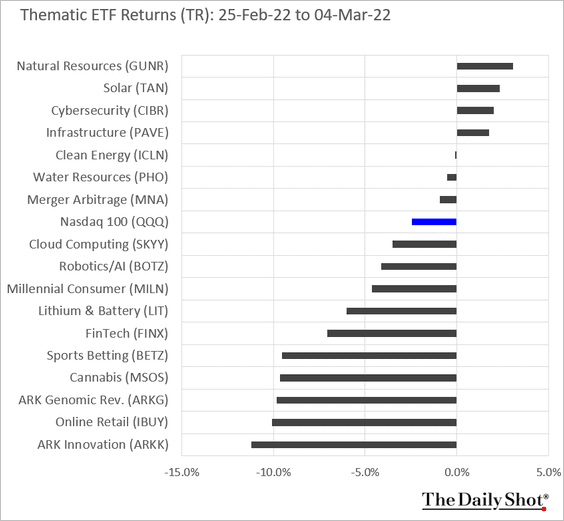
 Source: Deutsche Bank Research
——————–
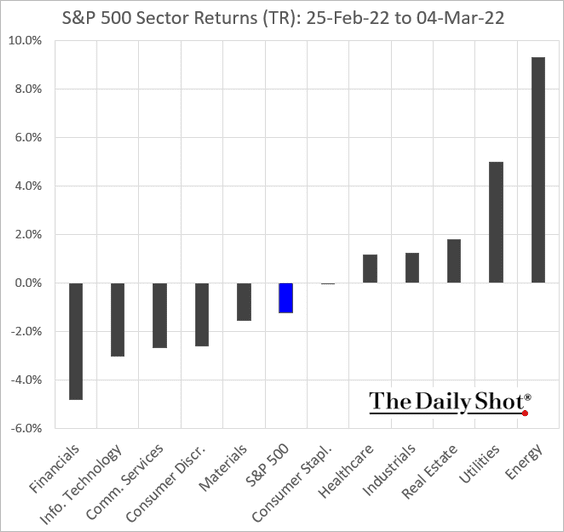
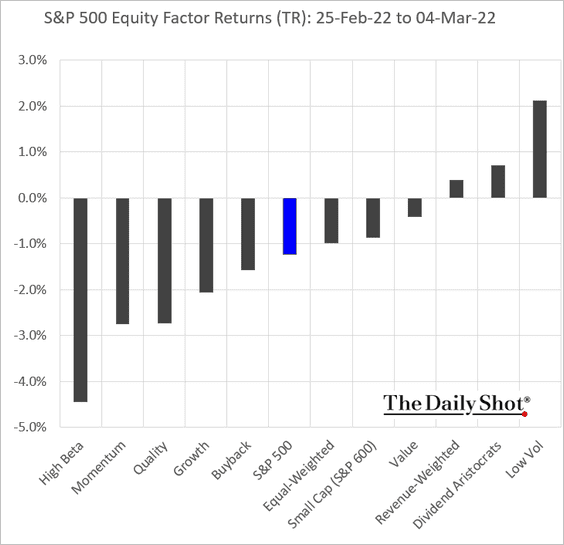
9. Next, we have last week’s performance by sector, …
… and by equity factor.
——————–
10. Vanguard’s ETF AUM is narrowing the gap with BlackRock.
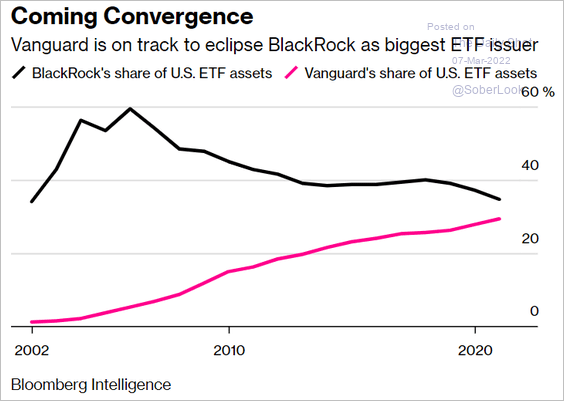 Source: @markets Read full article
Back to Index
Credit
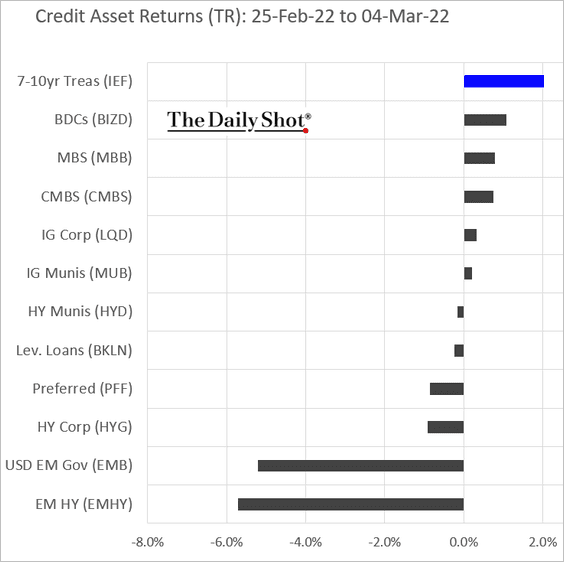
1. Let’s begin with last week’s performance by asset class.
2. Leveraged loan volatility has been climbing.
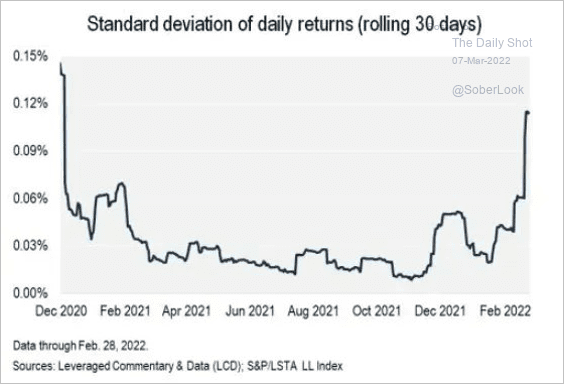 Source: @lcdnews
3. There has been a deterioration in liquidity conditions in the US high-yield sector.
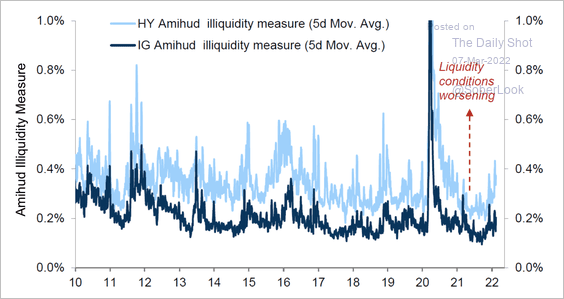 Source: Goldman Sachs
4. Here is the Credit Suisse Risk Appetite index for US credit.
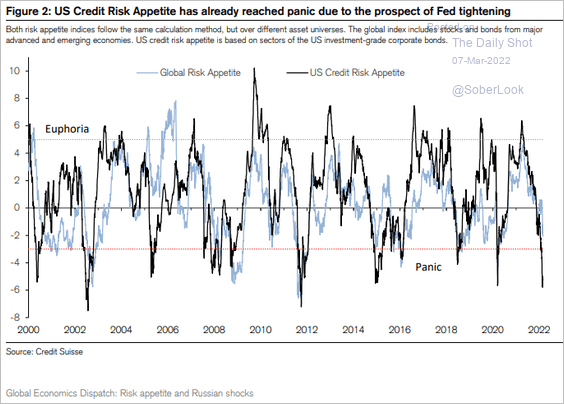 Source: Credit Suisse
Back to Index
Rates
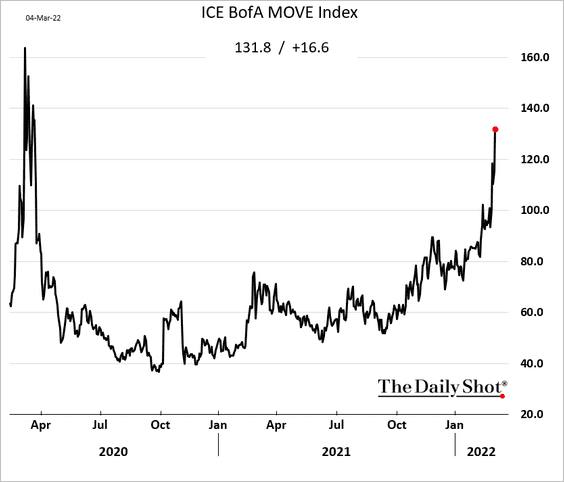
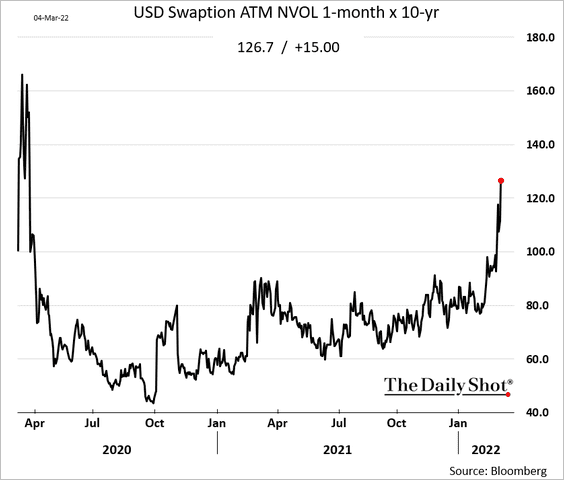
1. Rate markets’ implied volatility continues to climb.
——————–
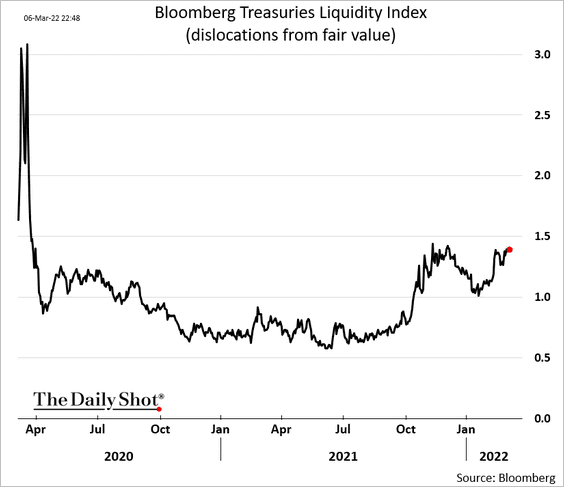
2. Treasury liquidity has worsened in recent months.
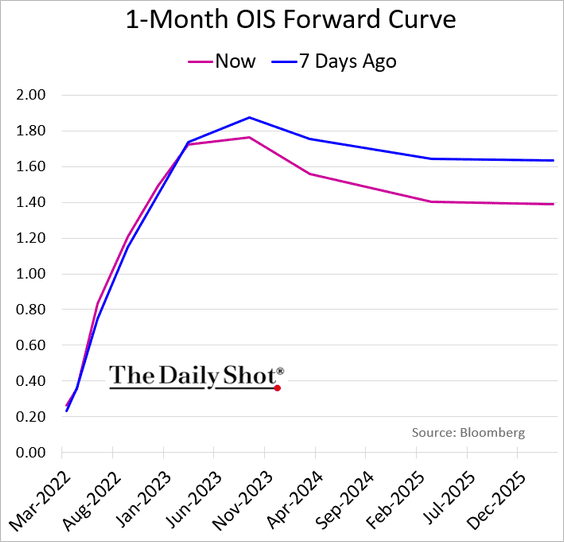
3. The market is increasingly pricing in Fed rate cuts starting in early 2024.
4. For now, there is a limited demand for US dollars in the Eurozone (few are tapping the ECB’s liquidity swap with the Fed), suggesting that US dollar funding issues are not yet severe.
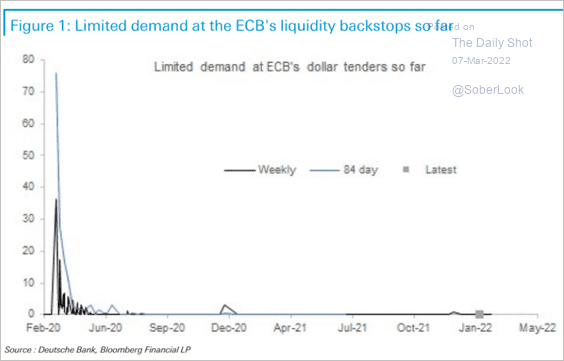 Source: Deutsche Bank Research
Back to Index
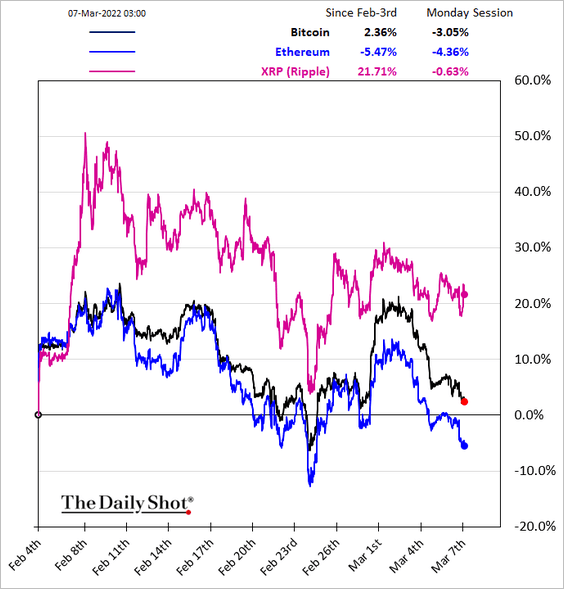
Cryptocurrency
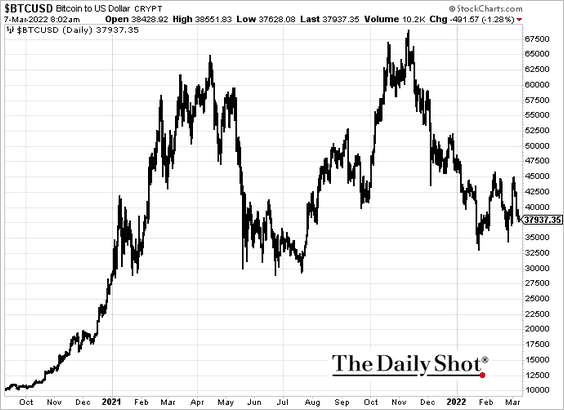
1. Bitcoin is back below 30k.
2. XRP has been outperforming.
3. Volume spikes during BTC sell-offs have been less severe compared to the mid-2021 price low.
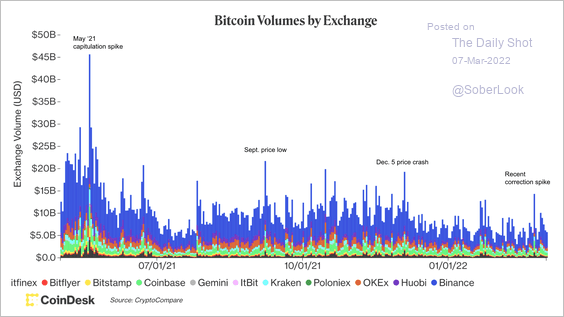 Source: CoinDesk
4. The chart below shows a persistent decline in BTC futures basis over the past year. Is the market underestimating the potential for a vol spike?
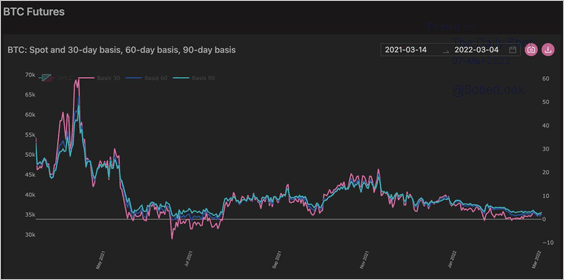 Source: Genesis Volatility Read full article
5. This chart shows the estimated mix of energy sources used on the Bitcoin network.
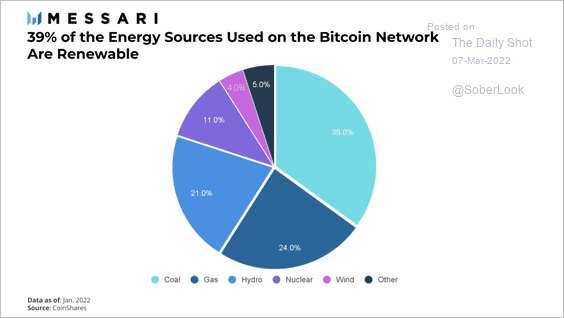 Source: @MessariCrypto
6. Another developer exit caused some DeFi tokens to tumble by as much as 75%.
 Source: CoinDesk Read full article
Back to Index
Emerging Markets
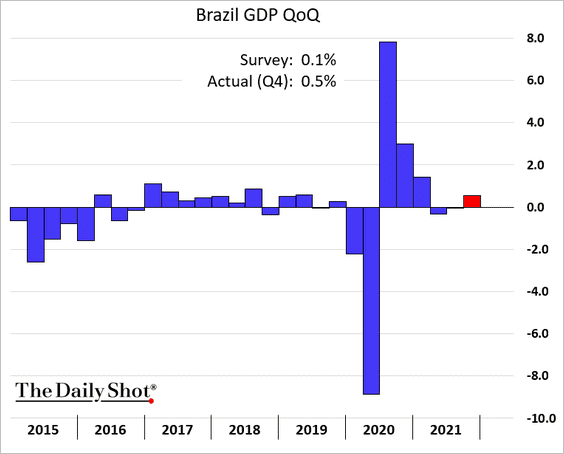
1. Let’s begin with Brazil.
• Q4 GDP growth (better than expected):
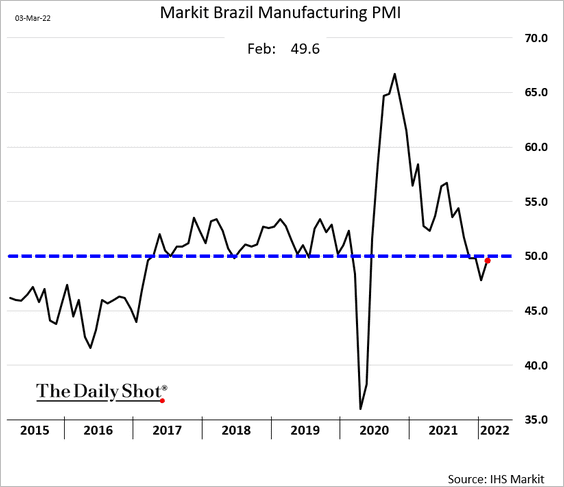
• Manufacturing sector PMI (stabilizing):
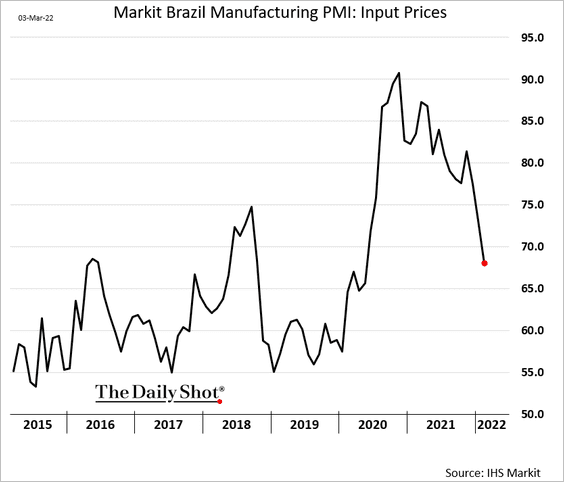
• Manufacturing PMI input prices:
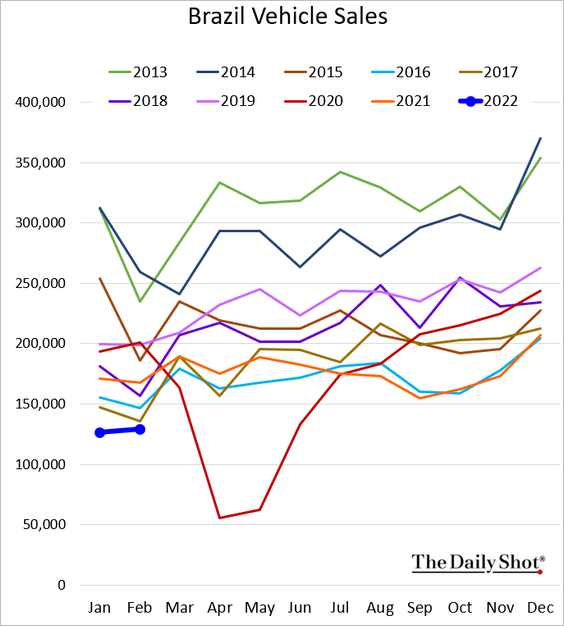
• Vehicle sales:
——————–
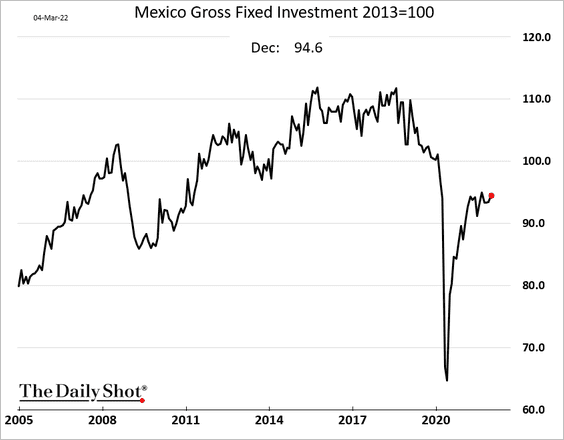
2. Mexican business investment picked up in December.
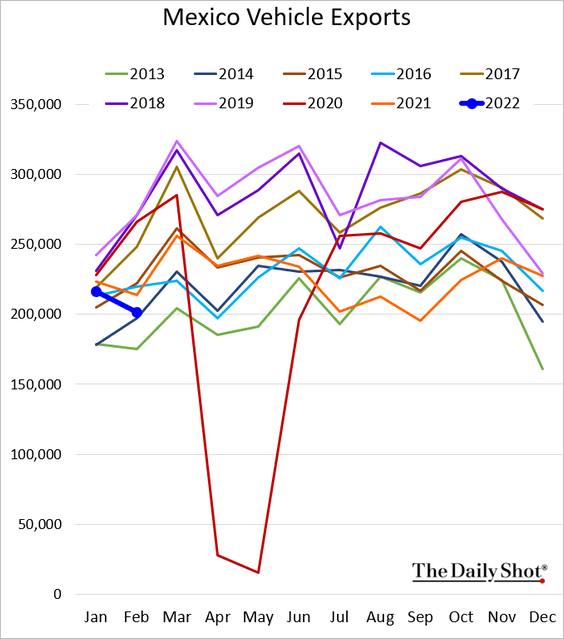
Vehicle exports declined last month.
——————–
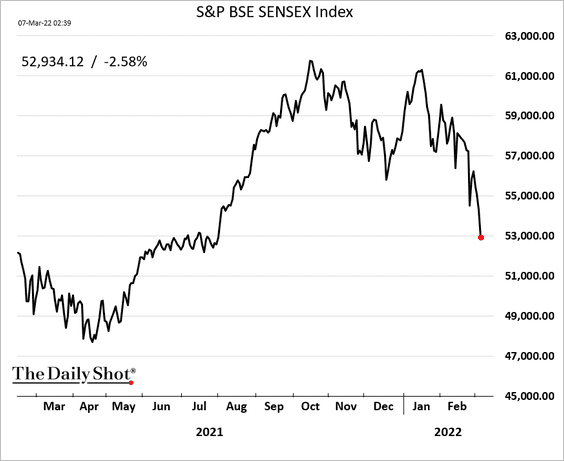
3. Indian stocks have been rolling over.
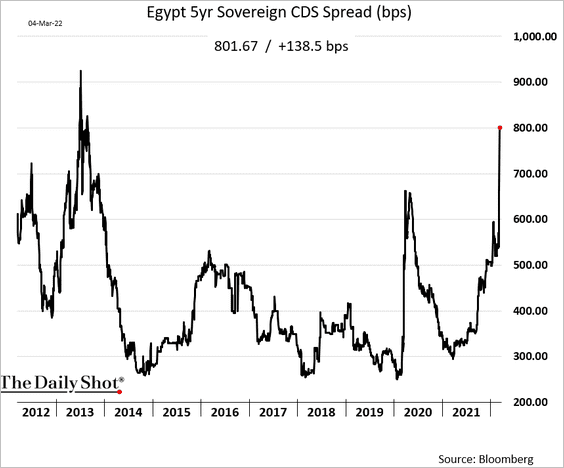
4. Egypt’s CDS spread continues to widen as FX reserves dwindle.
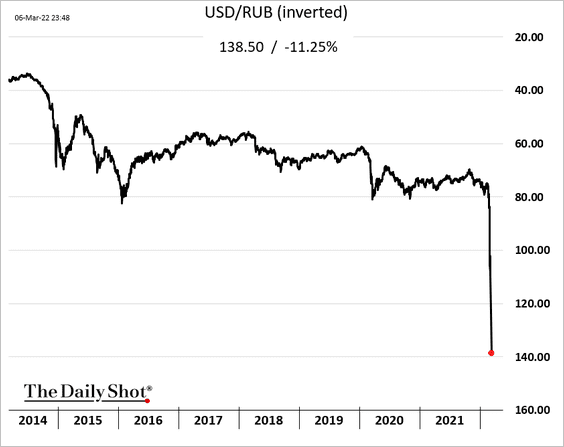
5. Next, we have some updates on Russia.
• The central bank’s net lending to the banking system (lending less reserves):
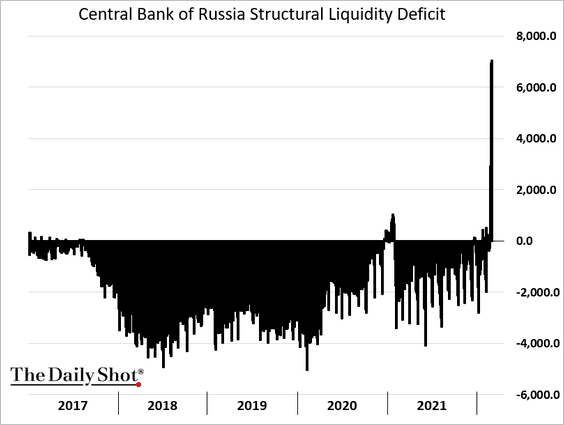 Read full article
• The ruble:
——————–
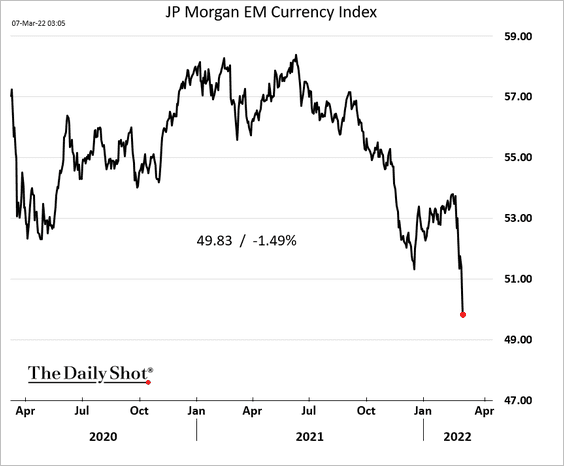
6. Here is JP Morgan’s EM currency index:
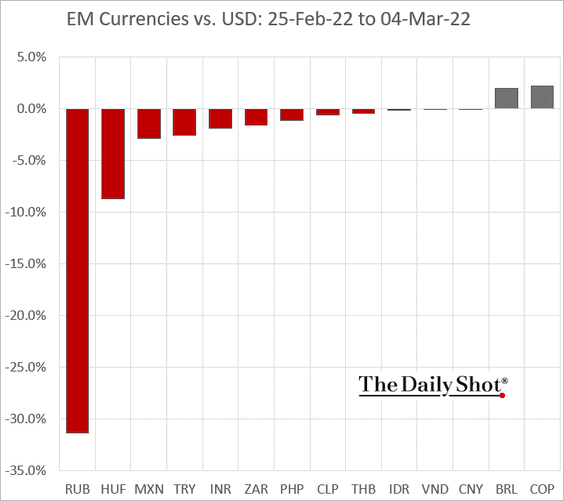
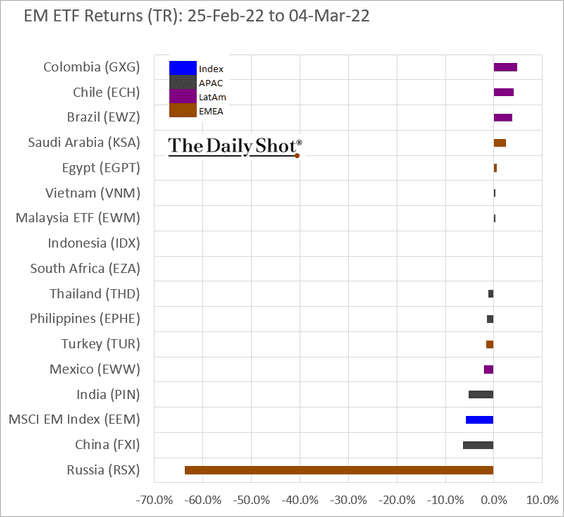
7. Lat Am commodity producers see capital inflows as investors exit other emerging economies.
• Currencies (performance last week):
• EM ETFs:
Back to Index
China
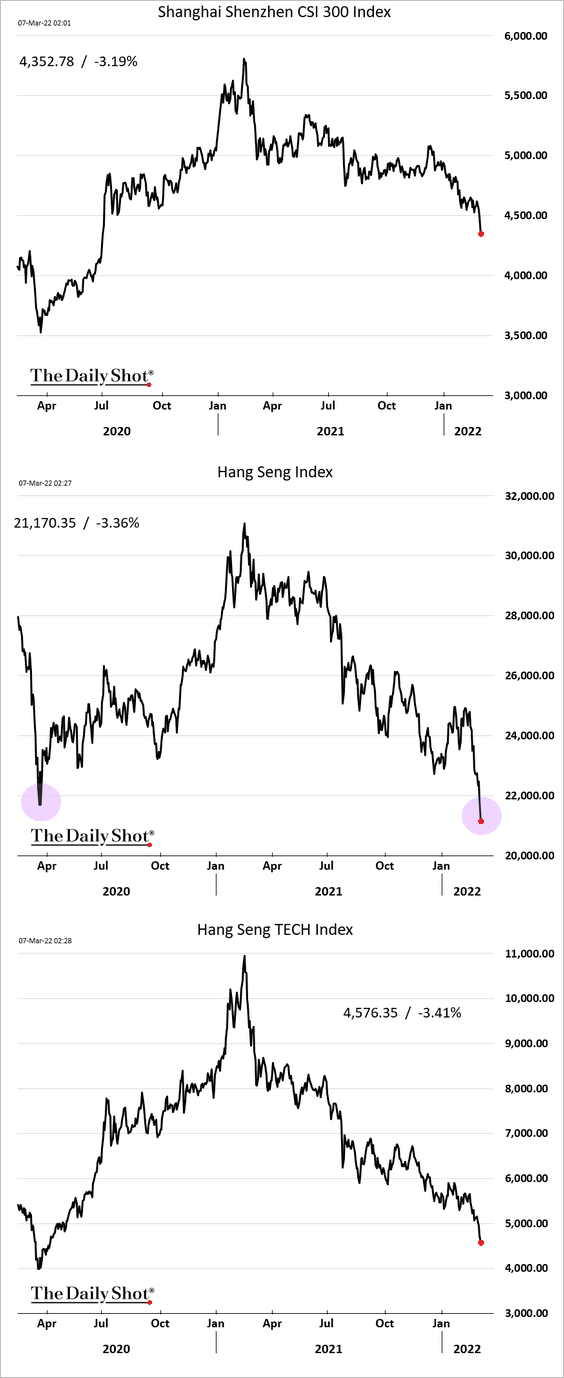
1. Stocks continue to tumble amid increasing risk aversion.
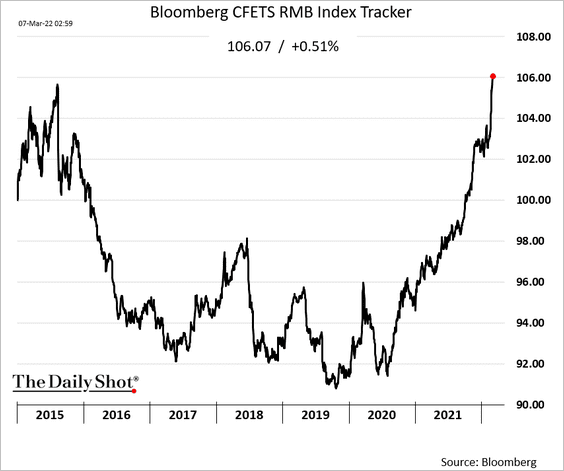
2. The renminbi is hitting record highs against a basket of currencies (boosted by a stronger US dollar).
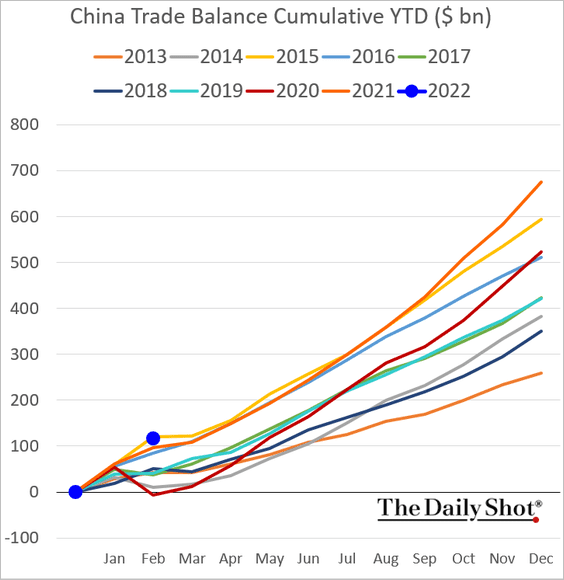
3. Exports were robust last month.
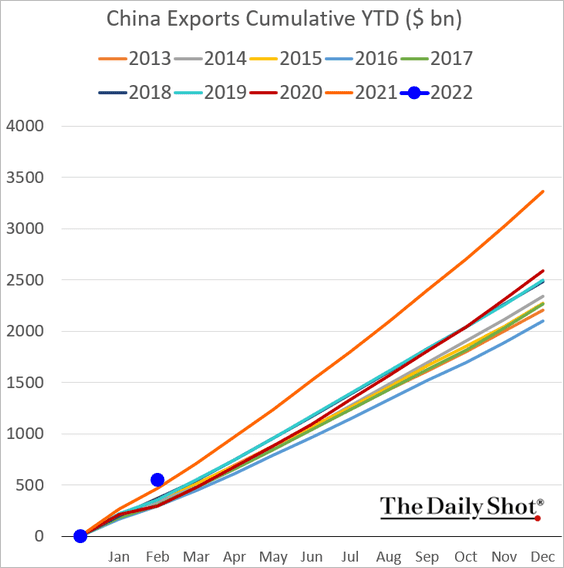
The trade surplus is following last year’s path.
Back to Index
Asia – Pacific
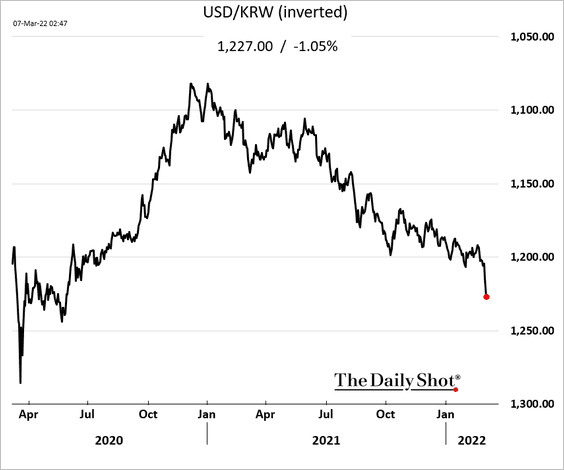
1. The South Korean won continues to tumble.
Separately, polls show a close presidential election.
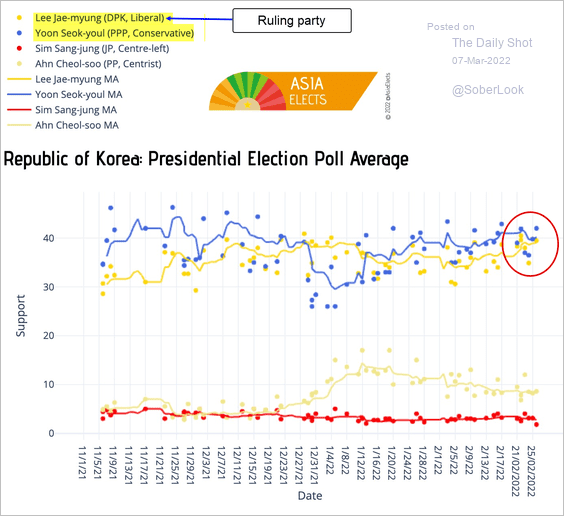 Source: @AsiaElectsROK Read full article Further reading
——————–
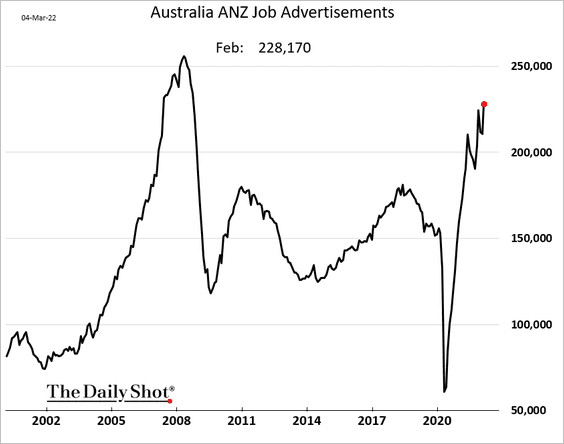
2. Australia’s job ads continue to hit multi-year highs.
3. This chart shows Japan’s energy imports by source.
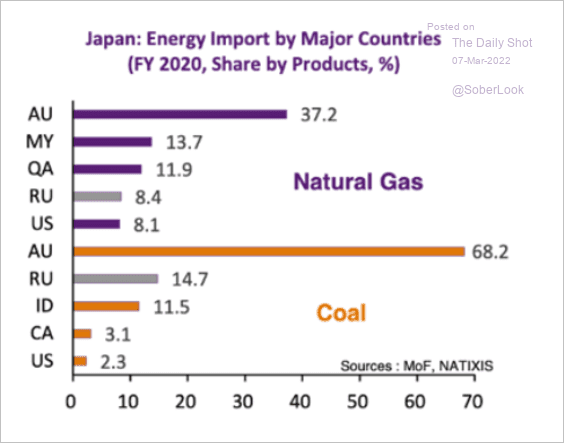 Source: Alicia Garcia-Herrero, Natixis Read full article
Back to Index
The Eurozone
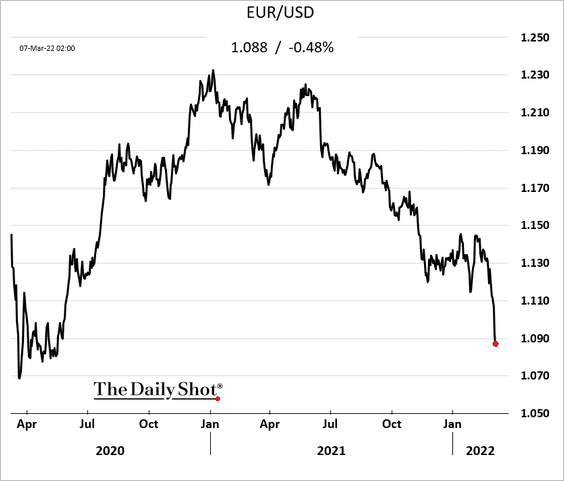
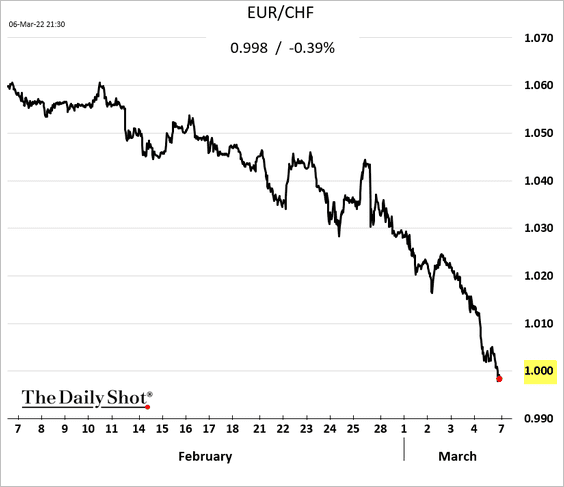
1. The euro’s decline has accelerated.
The euro hit par vs. the Swiss franc.
——————–
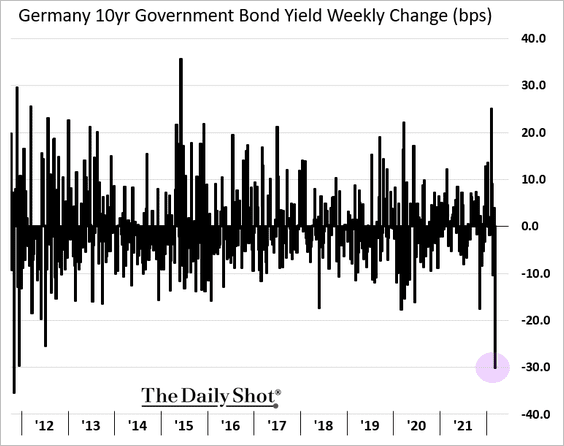
2. Bunds had the best week in over a decade.
Widening asset swap spreads point to tight supplies of safe assets (typically used as collateral).
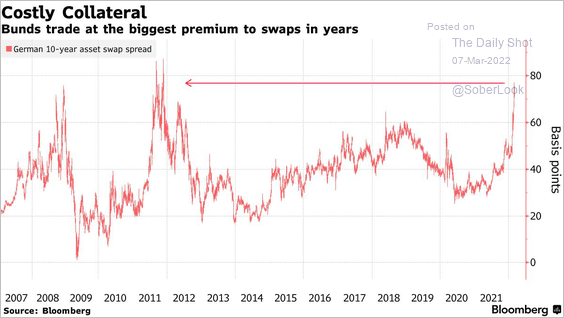 Source: Bloomberg Read full article
——————–
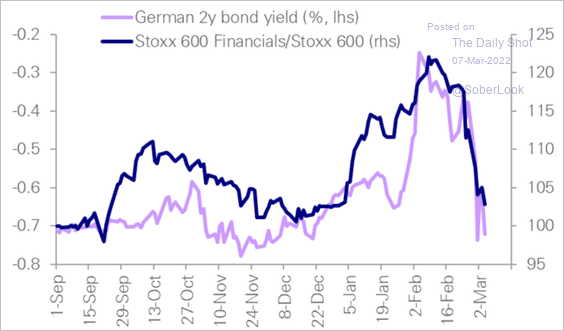
3. Financials are underperforming as yields fall.
 Source: Deutsche Bank Research
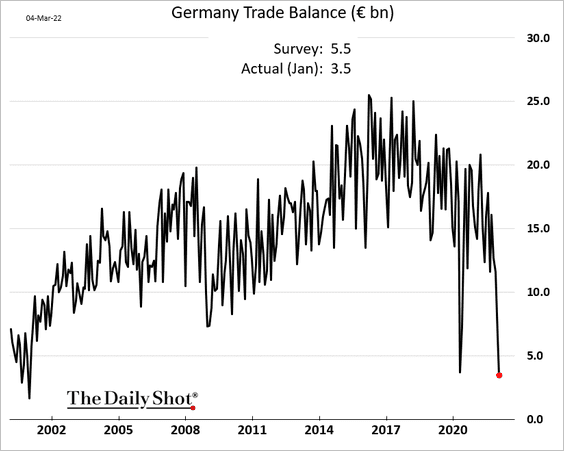
4. Germany’s trade surplus hit the lowest level in over a decade (headed for deficit).
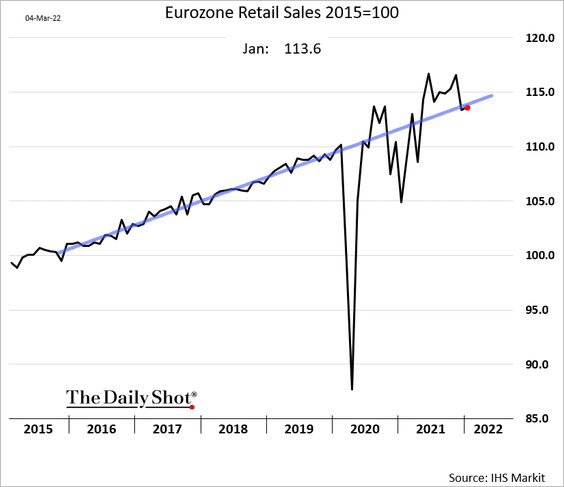
5. Eurozone retail sales ticked higher in January and remain on the pre-COVID trend.
Google’s mobility indicators point to an improvement in February.
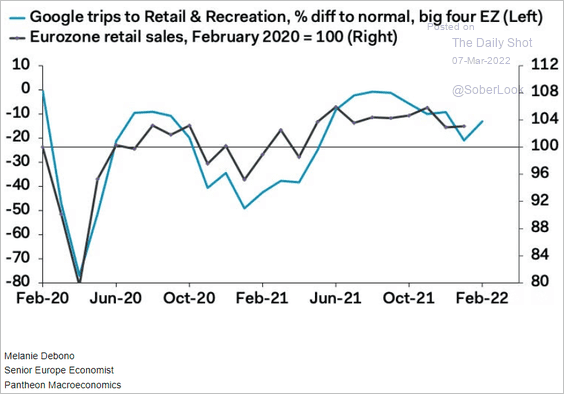 Source: Pantheon Macroeconomics
Back to Index
Europe
1. Risk appetite is crashing, …
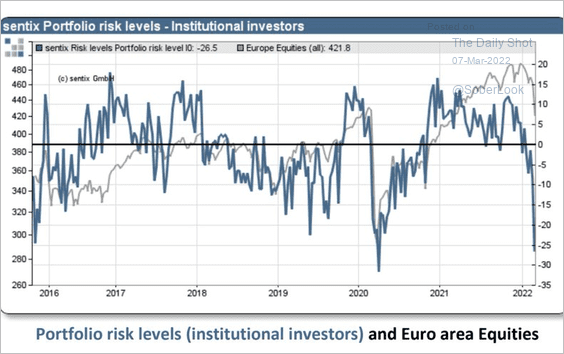 Source: @Callum_Thomas
… which is reflected in equity flows.
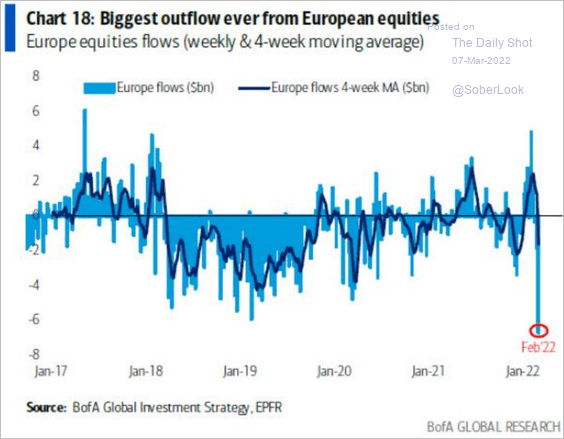 Source: BofA Global Research
——————–
2. European equity valuations are below pre-COVID levels.
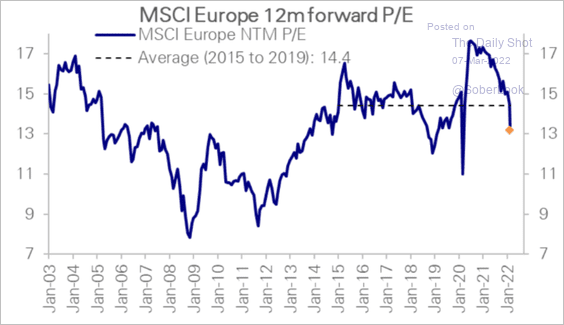 Source: Deutsche Bank Research
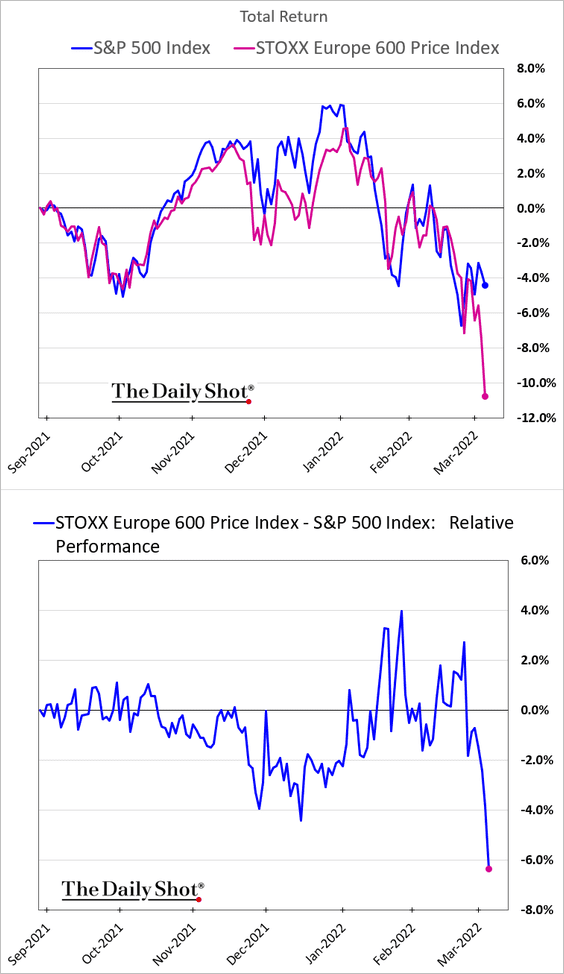
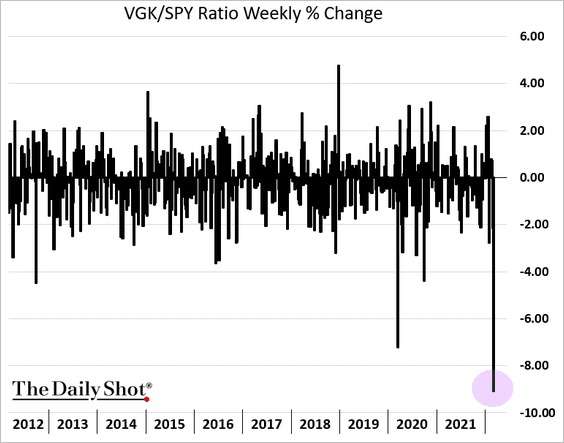
3. European stocks’ underperformance vs. the US was extreme last week.
——————–
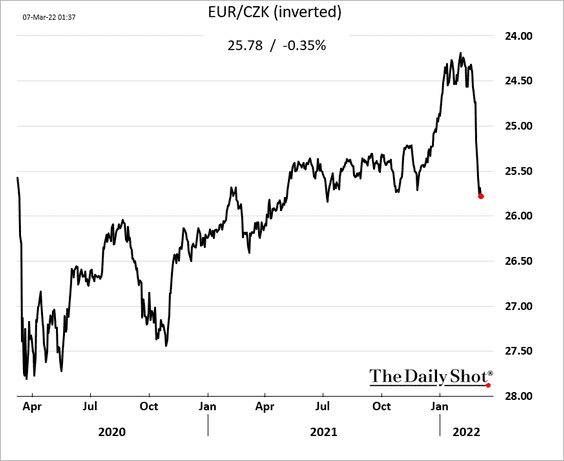
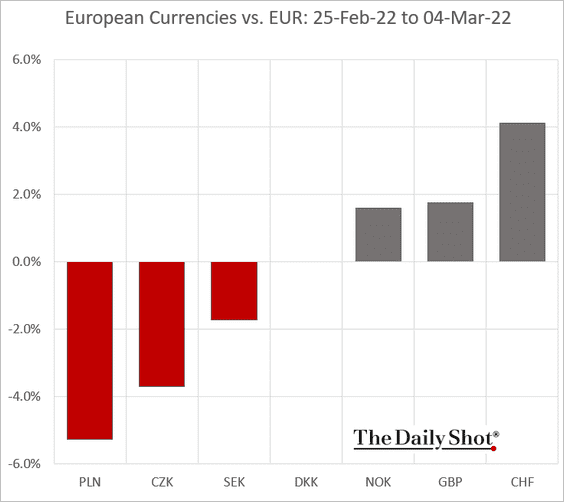
4. The Czech central bank has been intervening in the currency market to defend the koruna. For now, the currency continues to weaken.
——————–
5. The EU unemployment rate is approaching 6%.
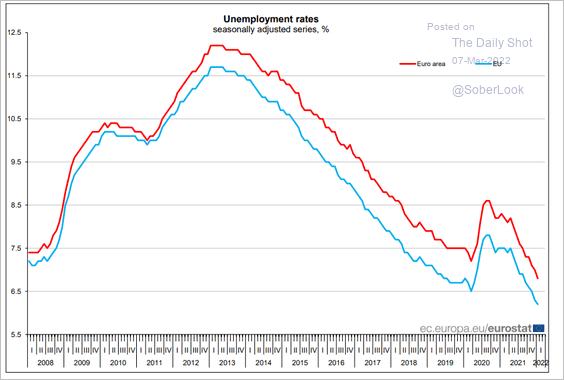 Source: Eurostat Read full article
Back to Index
The United Kingdom
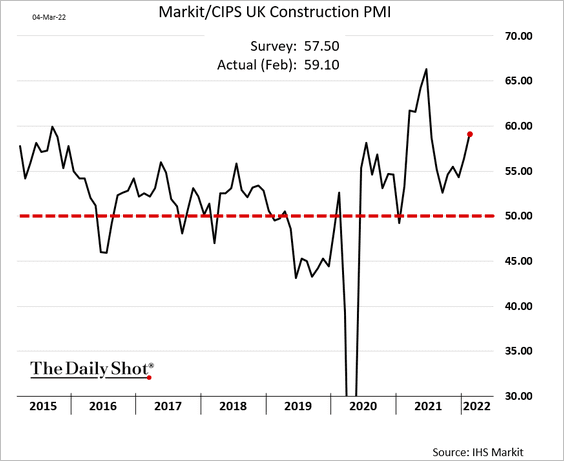
1. February construction activity surprised to the upside.
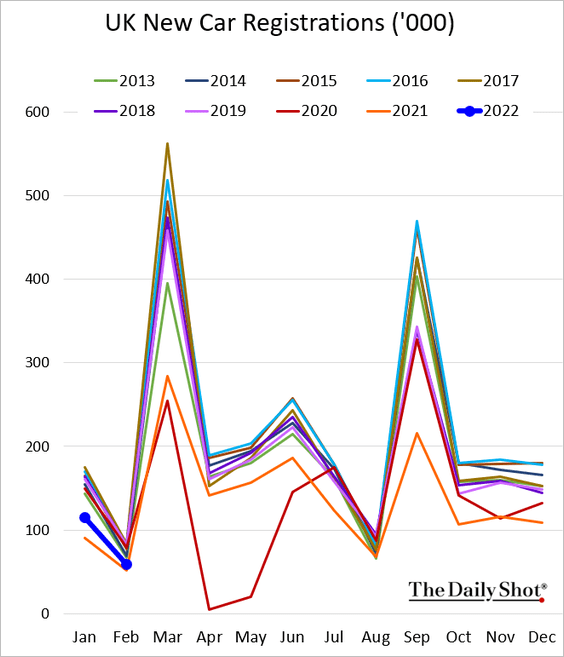
2. New car registrations remain soft.
3. Household Inflation expectations surging.
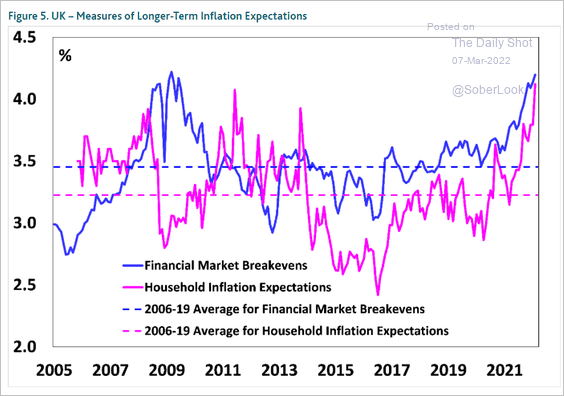 Source: BoE Read full article
4. Next, we have some labor market trends.
• Employment and the labor force:
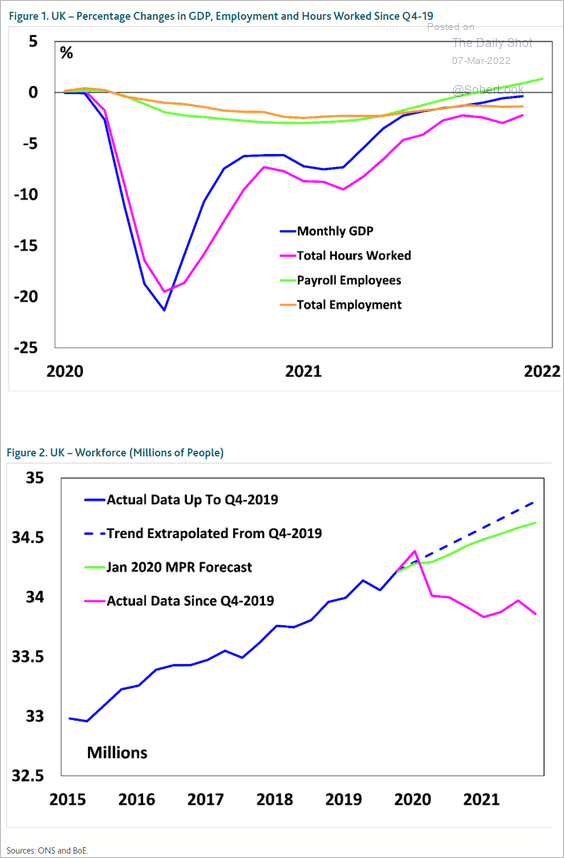 Source: BoE Read full article
• Staying out of the labor force:
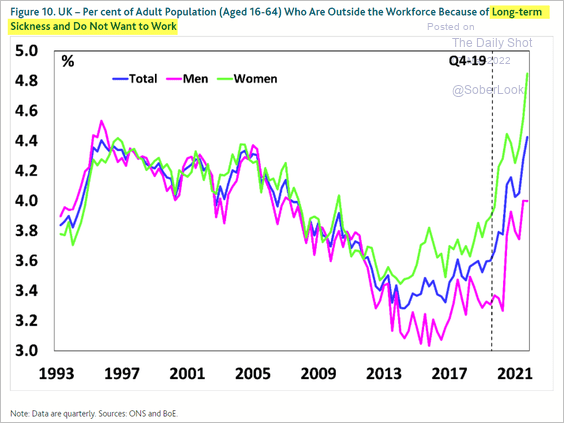 Source: BoE Read full article
Back to Index
Canada
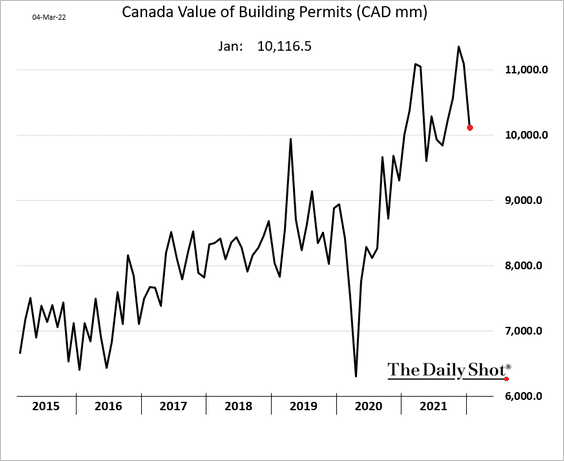
1. Building permits are off the highs.
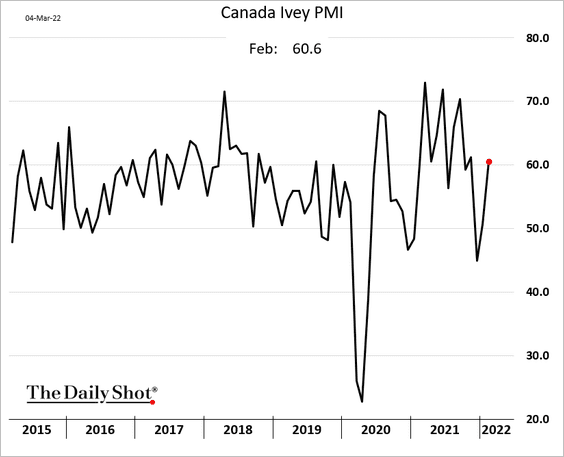
2. The Ivey PMI rebounded in February as omicron receded.
3. Equity fund flows have been strong as commodity prices advanced.
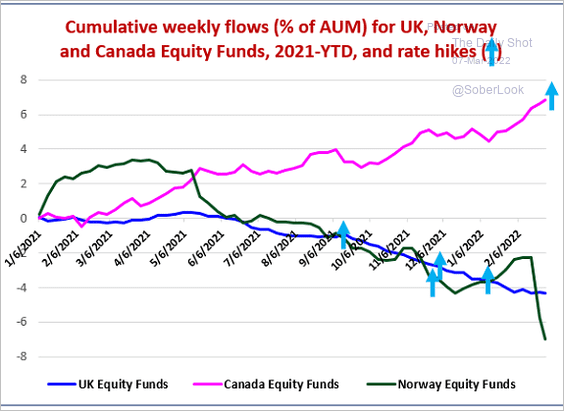 Source: EPFR
Back to Index
The United States
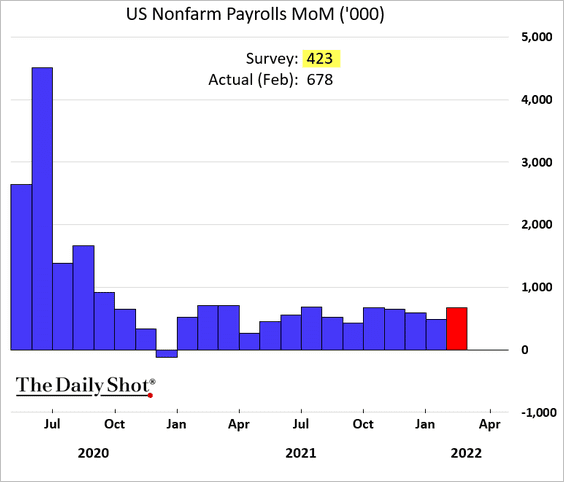
1. The February employment report topped expectations.
• The two charts below show the employment gains attribution.
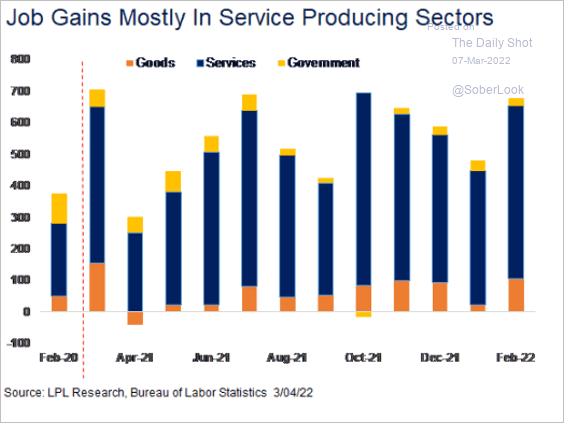 Source: LPL Research
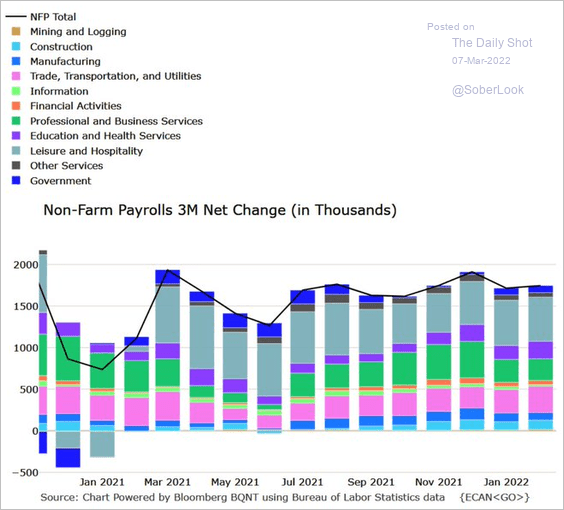 Source: @M_McDonough
• Total employment still hasn’t recovered from the pandemic losses.
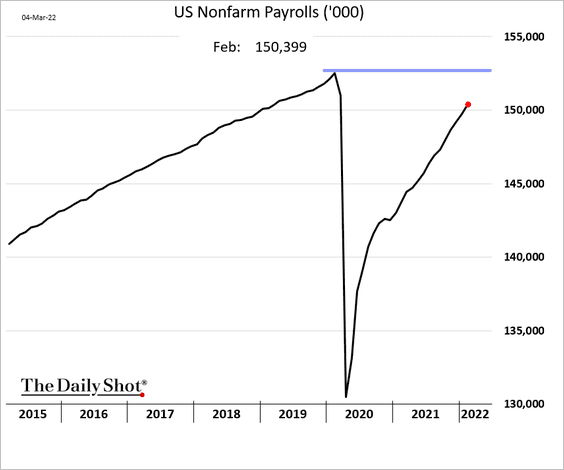
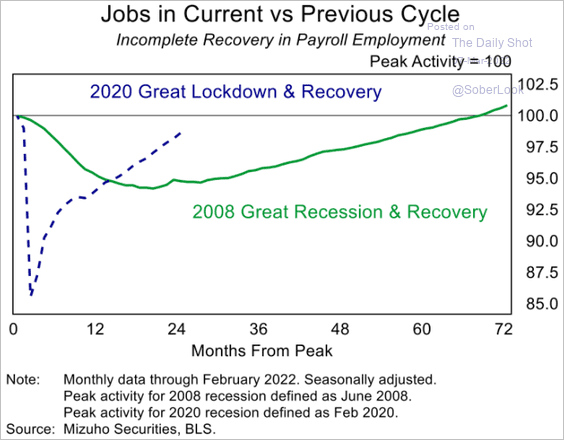 Source: Mizuho Securities USA
Here is the recovery by earnings tier.
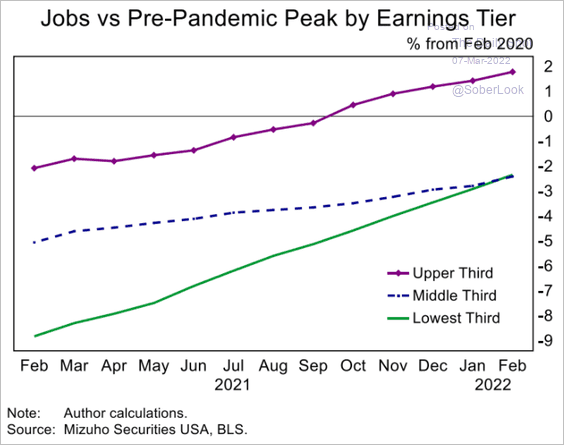 Source: Mizuho Securities USA
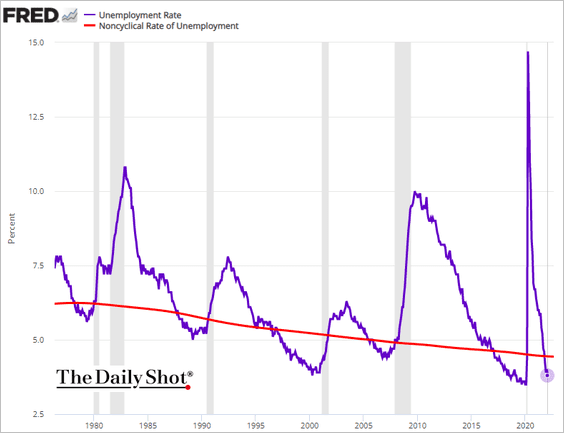
• The unemployment rate is approaching pre-COVID levels …
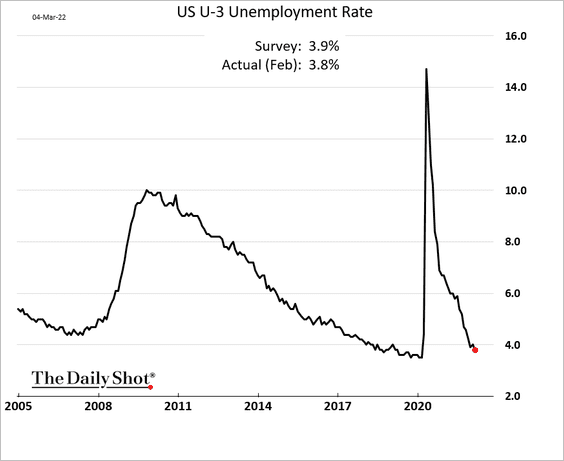
… and is now well below NAIRU.
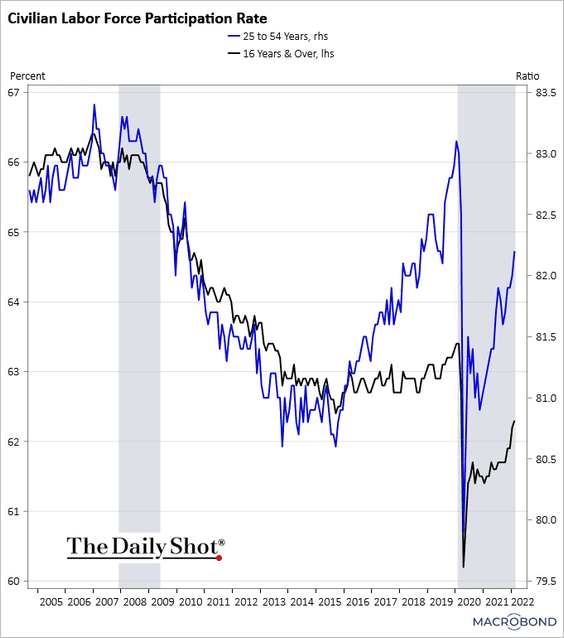
• Labor force participation is improving.
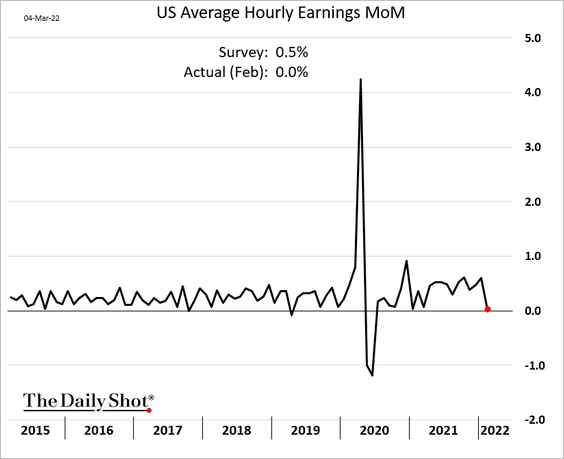
• Wage gains unexpectedly stalled last month, …
… but the number of weekly hours worked improved.
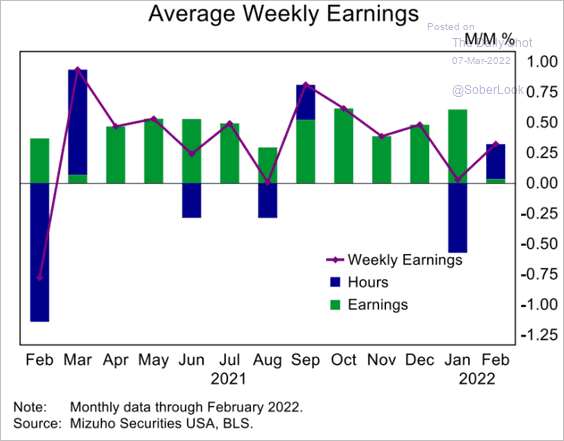 Source: Mizuho Securities USA
• The overall labor market picture looks excellent.
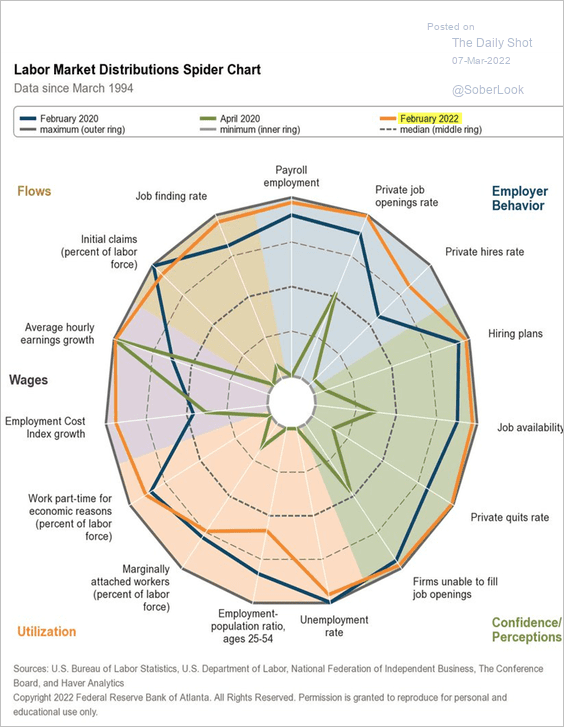 Source: @AtlantaFed, @BLS_gov Read full article
——————–
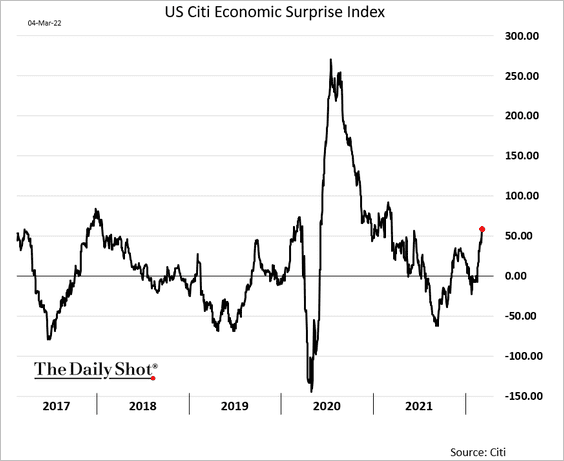
2. The Citi Economic Surprise Index is rising, boosted by the employment report.
3. Next, we have some updates on inflation.
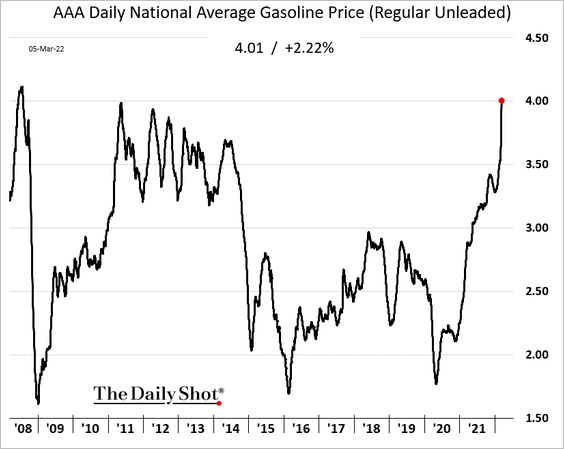
• Surging oil prices continue to push inflation up, …
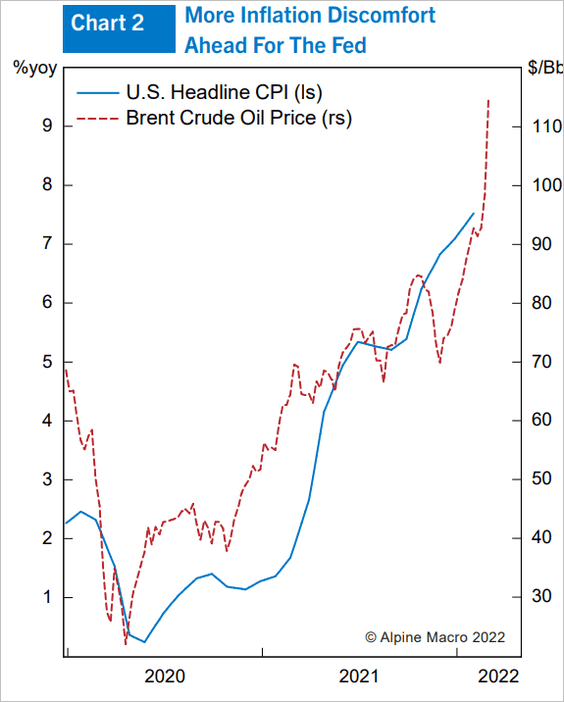
… with retail gasoline prices hitting the highest levels since 2008 (and going much higher in the days ahead).
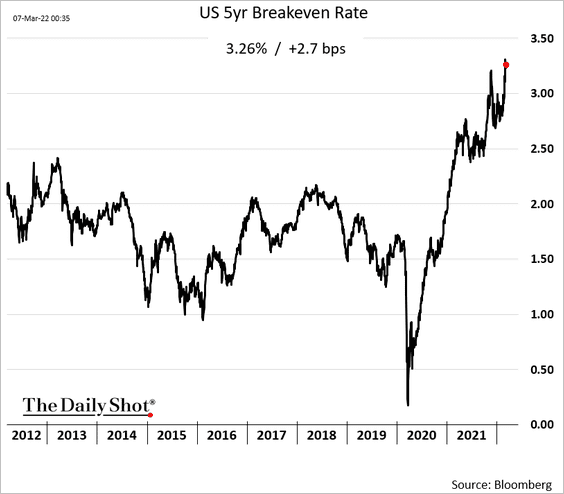
• Short-term market-based inflation expectations have been surging with crude oil.
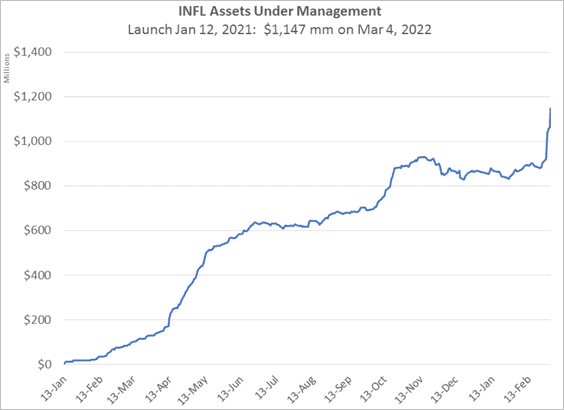
• This chart shows the assets under management of the Horizon Kinetics Inflation Beneficiaries ETF, a recently launched equity fund focused on companies benefitting from rising prices.
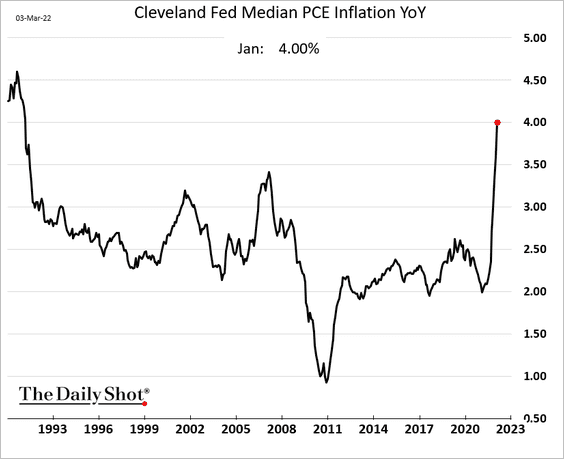
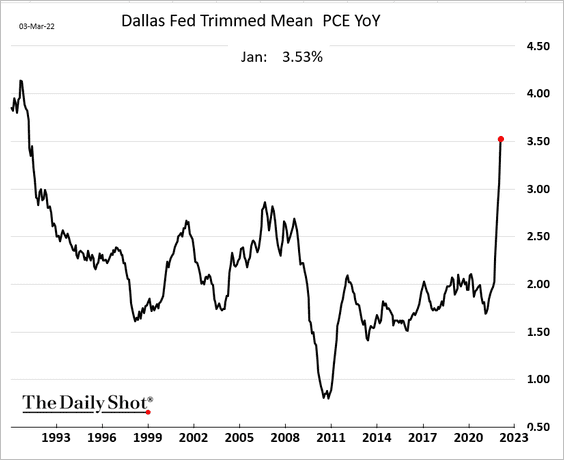
• Here are two alternative measures for the core PCE inflation.
– Median inflation:
– Trimmed mean PCE:
——————–
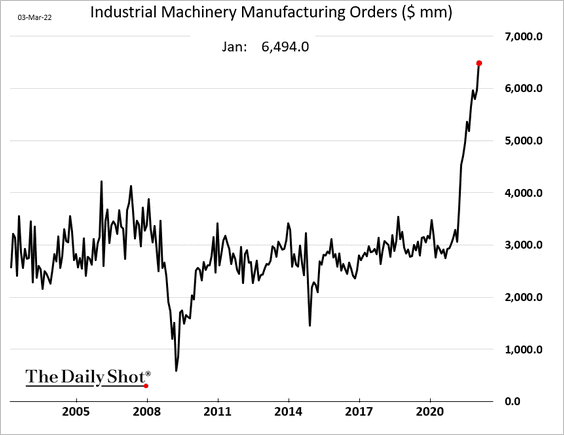
4. Manufacturing orders for machinery have been very strong, pointing to robust CapEx.
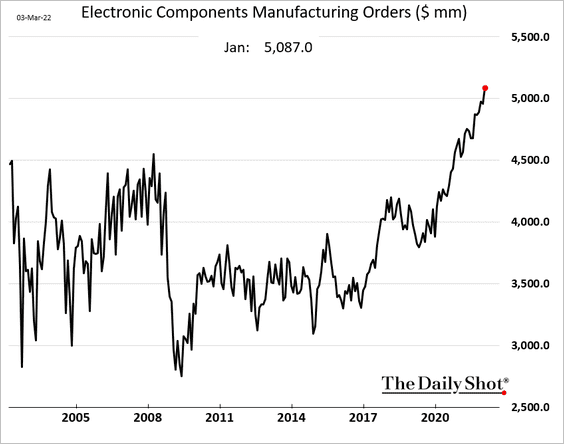
Electronic components see surging demand.
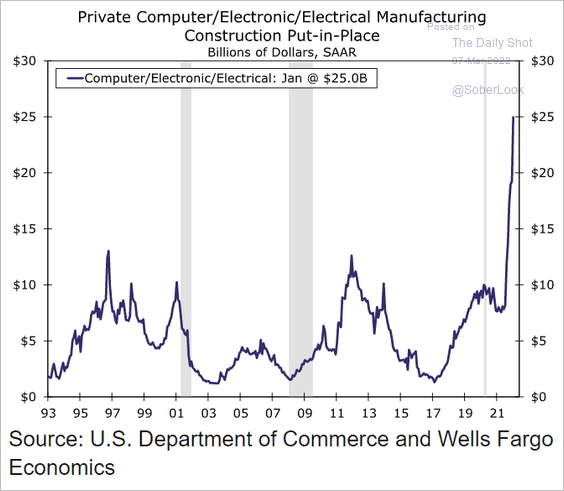
Construction spending on electronics manufacturing facilities has accelerated. Here is a comment from Wells Fargo.
In addition to the vehicle electrification shift spurring a growing pipeline of electric-vehicle battery factories, the global semiconductor shortage has led to a marked step-up in domestic microchip plant construction.
 Source: Wells Fargo Securities
——————–
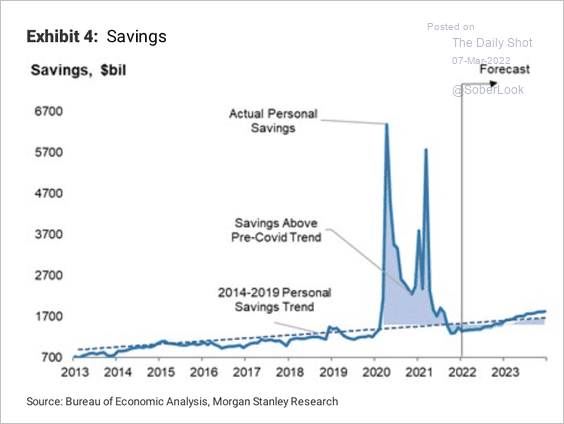
5. Morgan Stanley expects the savings rate to return to trend.
 Source: Morgan Stanley Research
6. Financial conditions continue to tighten.
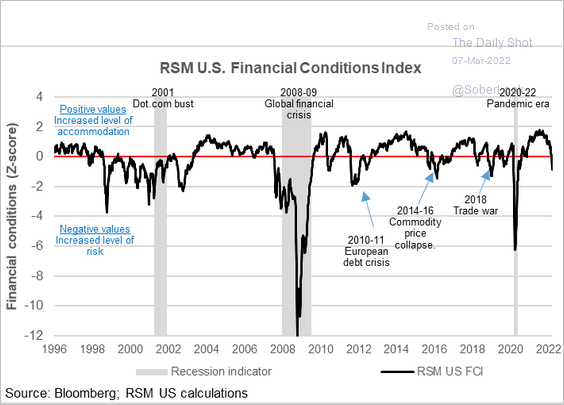 Source: @joebrusuelas, @rsmusllp
Back to Index
Global Developments
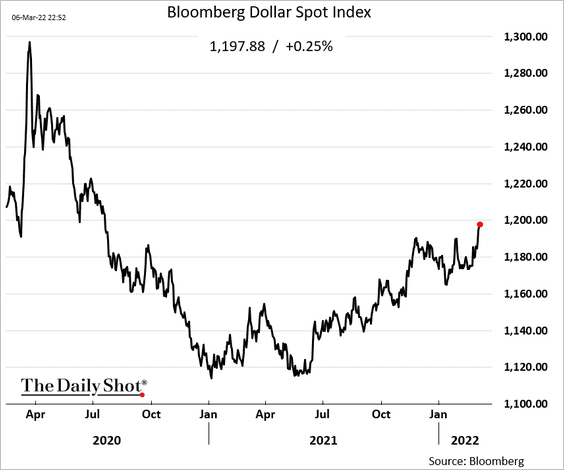
1. The US dollar continues to grind higher.
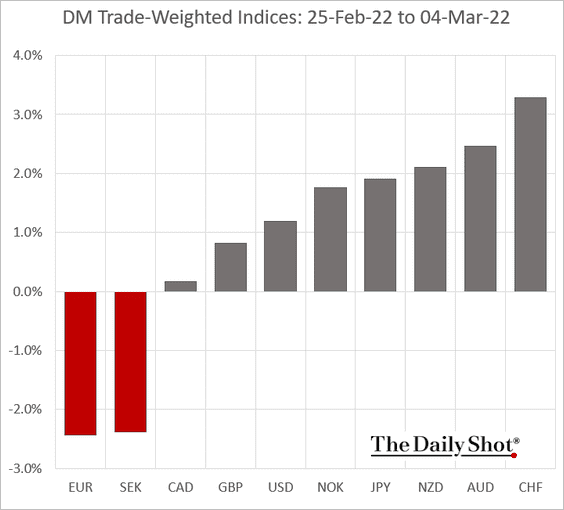
Here is last week’s performance of trade-weighted DM (developed markets) currency indices.
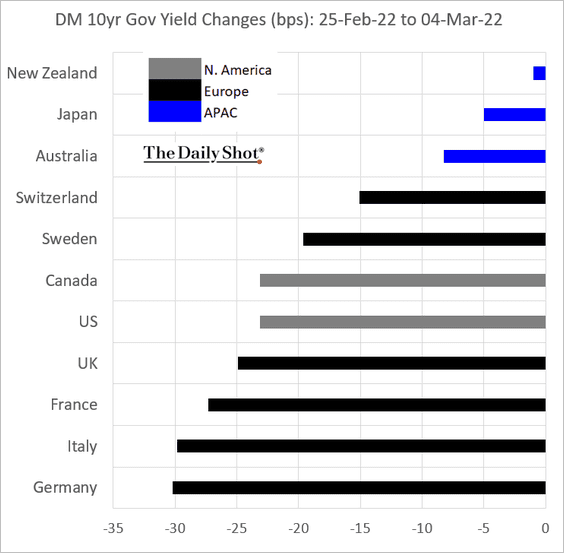
2. Next, we have last week’s DM government bond yield moves.
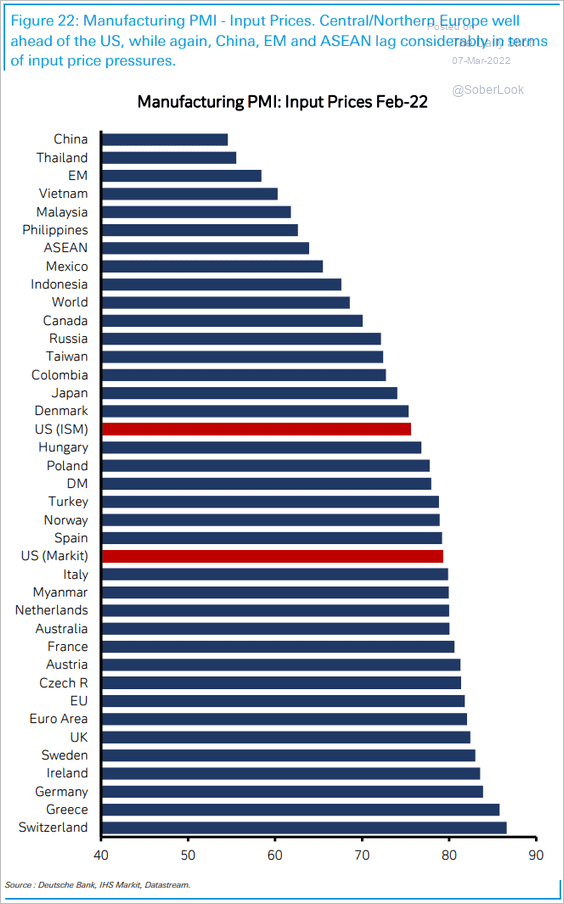
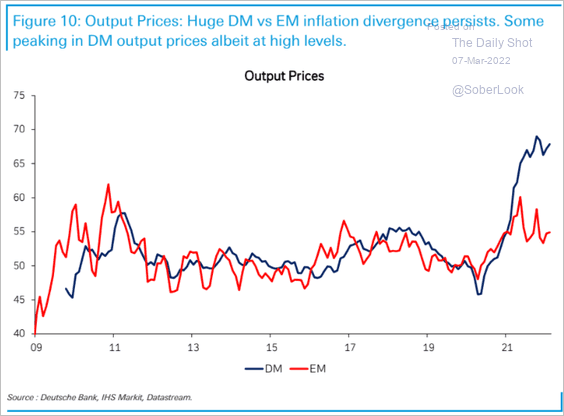
3. DM manufacturing price pressures have been more acute than what we see in emerging markets (3 charts).
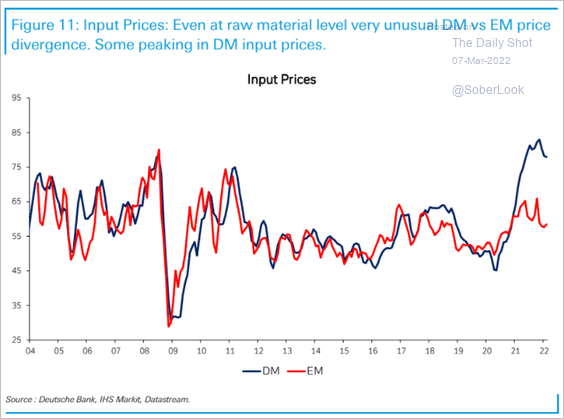 Source: Deutsche Bank Research
 Source: Deutsche Bank Research
 Source: Deutsche Bank Research
——————–
4. G20 trade has been booming.
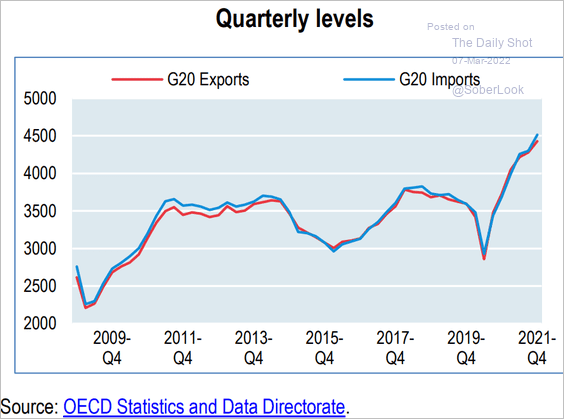 Source: OECD Read full article
5. How much does energy impact headline inflation measures in different countries?
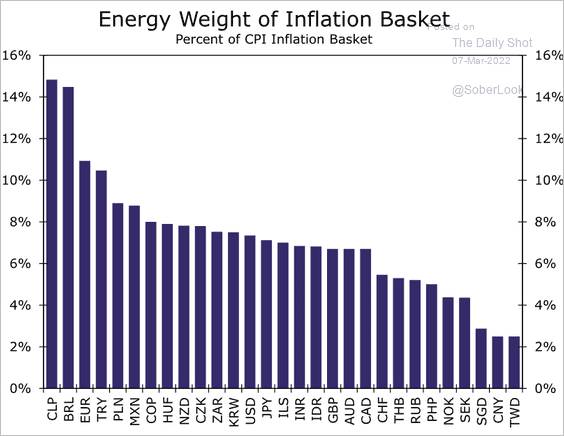 Source: Wells Fargo Securities
——————–
Food for Thought
1. Average salary of US job postings:
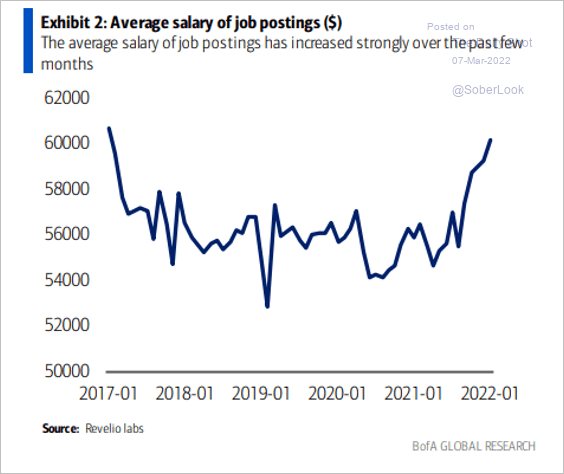 Source: BofA Global Research; @MikeZaccardi
2. Religiously unaffiliated Americans:
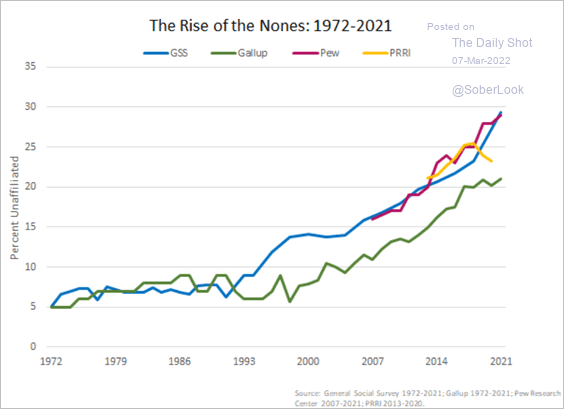 Source: American Storylines Read full article
3. Support for recent Supreme Court picks:
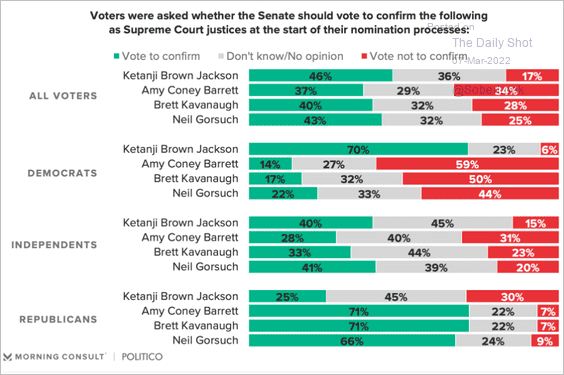 Source: Morning Consult Read full article
4. US weather and climate disasters:
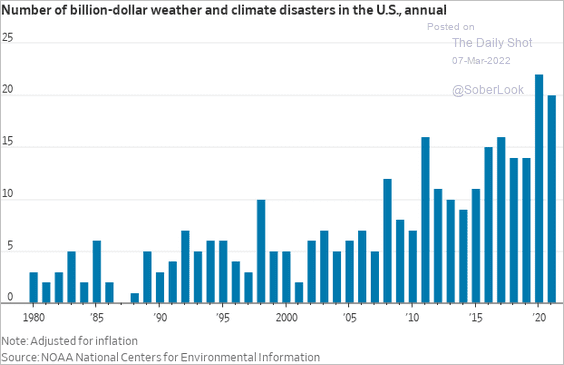 Source: @WSJ Read full article
5. Maternal mortality rates:
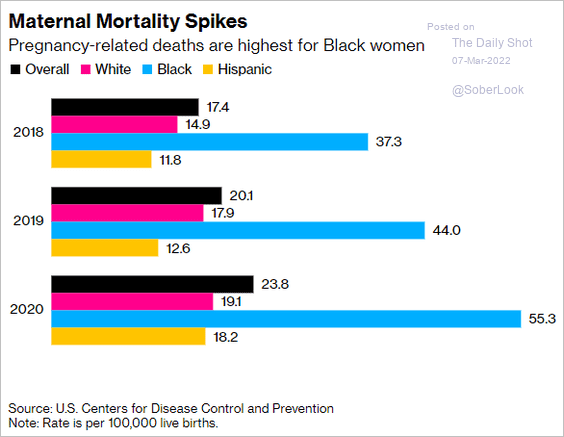 Source: Bloomberg Read full article
6. War refugees:
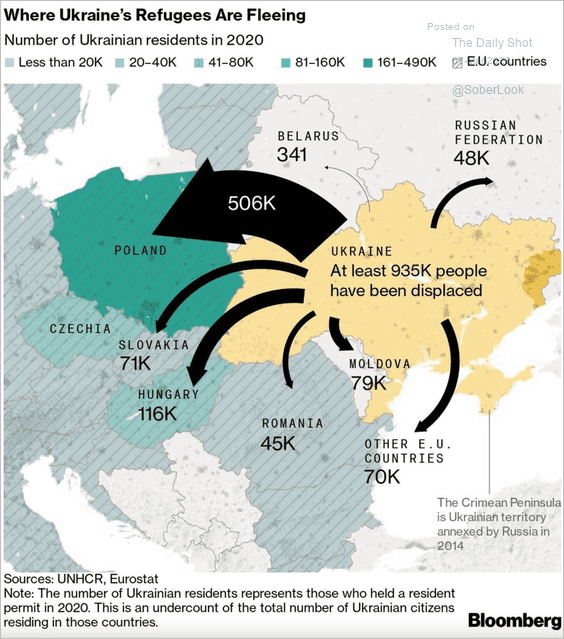 Source: @bpolitics Read full article
7. Sanctioning Russian entities:
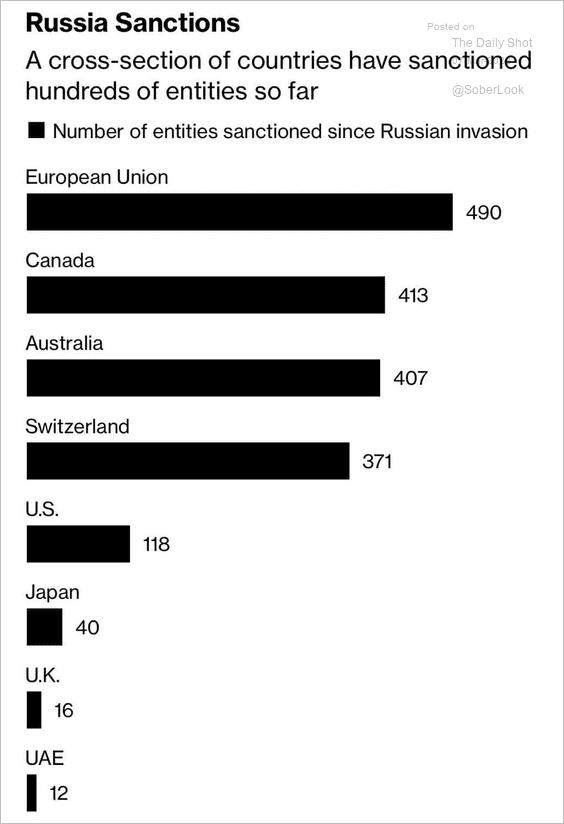 Source: @DaveKeating
8. Retail space rent growth in select markets:
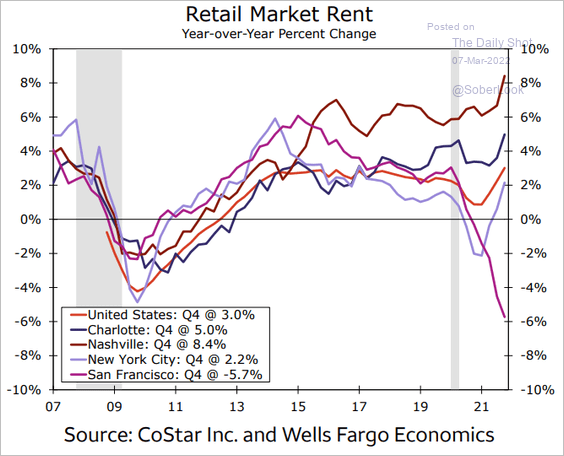 Source: Wells Fargo Securities
9. Proposed NFL stadium locations in Washington DC:
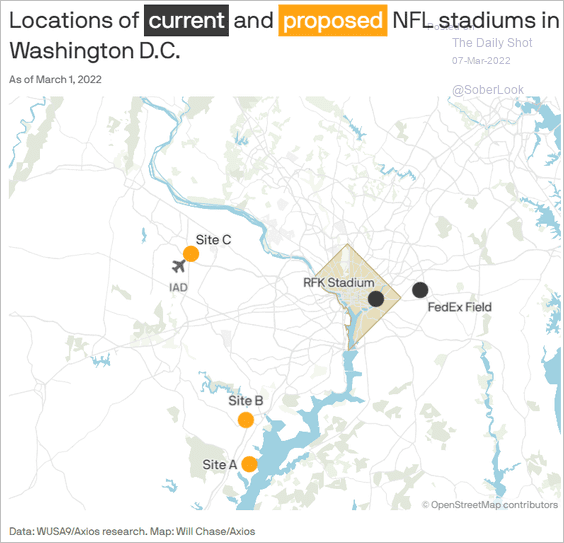 Source: @axios Read full article
——————–
Back to Index