
The Daily Shot: 08-Mar-22
• Equities
• Credit
• Commodities
• Energy
• Emerging Markets
• China
• Asia – Pacific
• The Eurozone
• Europe
• The United Kingdom
• Canada
• The United States
• Global Developments
• Food for Thought
Equities
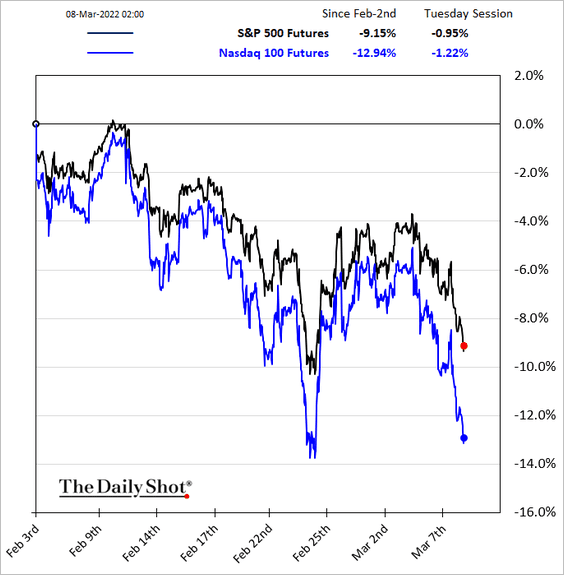
1. The selloff accelerated on Monday amid concerns about stagflation. Some analysts have noted that the latest drop felt like a capitulation.
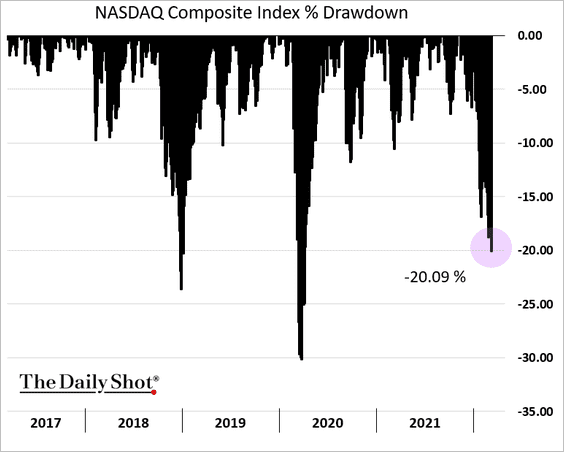
2. The Nasdaq Composite is in bear-market territory.
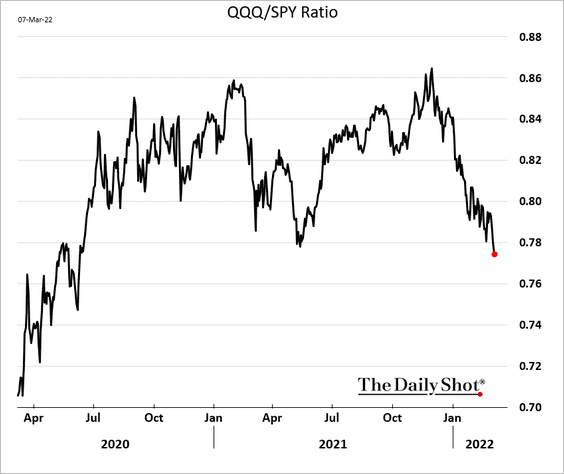
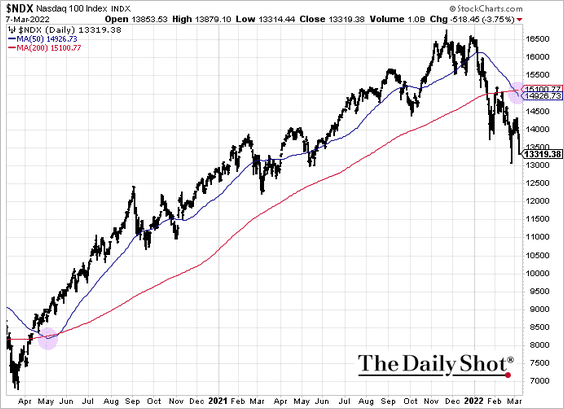
The Nasdaq 100 continues to widen its underperformance.
The index is in a death cross. Of course, the last time this happened, the Nasdaq 100 rallied massively.
——————–
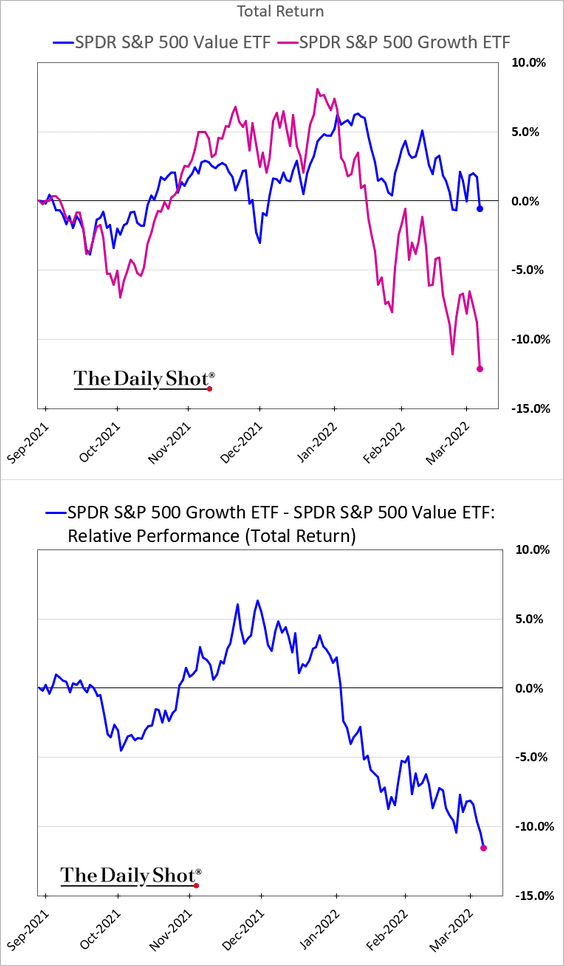
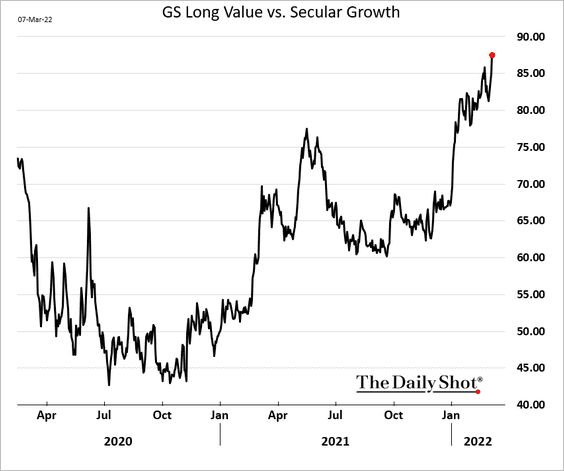
3. Growth stocks’ underperformance is getting worse (2 charts).
——————–
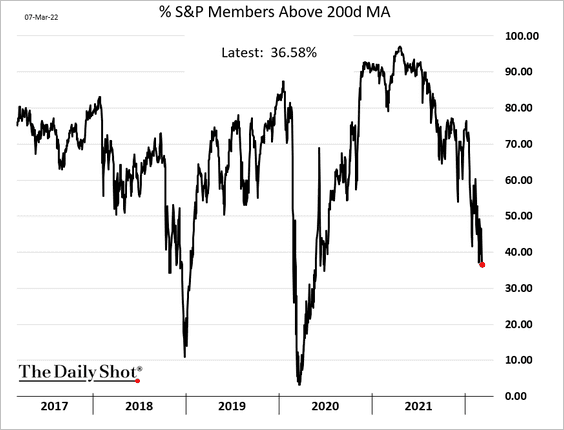
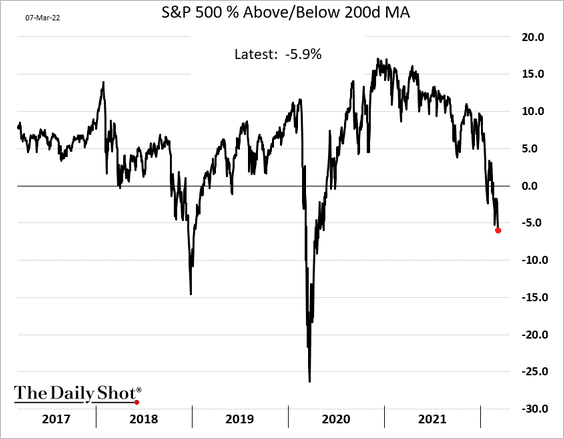
4. The share of S&P 500 members below the 200-day moving average is now under 40%.
And the index is 6% below its 200-day moving average.
——————–
5. What happens to the S&P 500 around 10% market corrections?
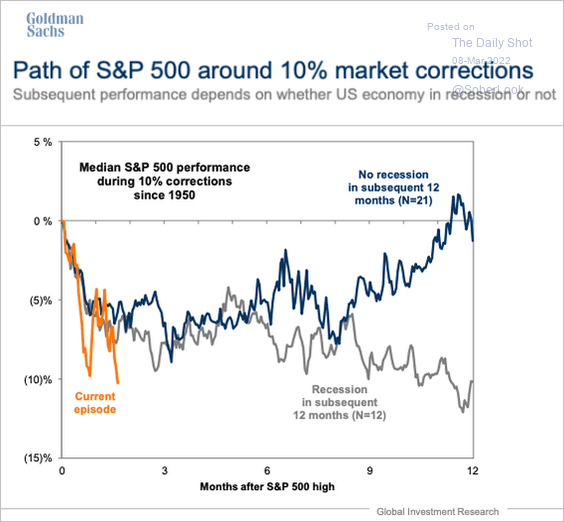 Source: Goldman Sachs; @SamRo
6. Here is how the S&P 500 responded to geopolitical events in the past, including the number of days to recover.
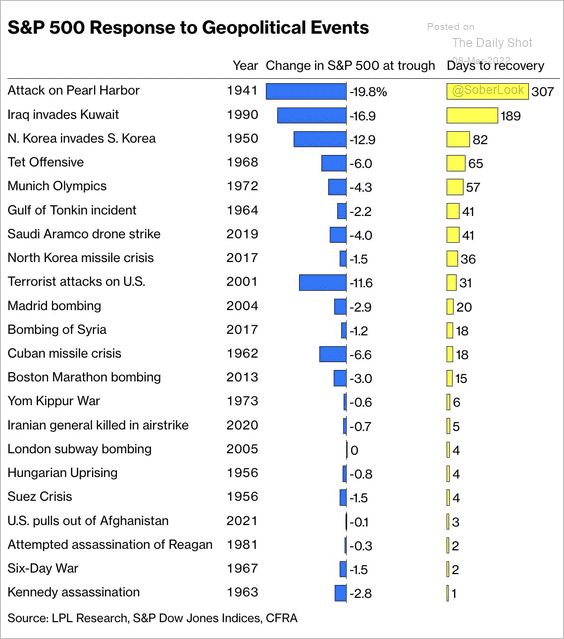 Source: Bloomberg Read full article
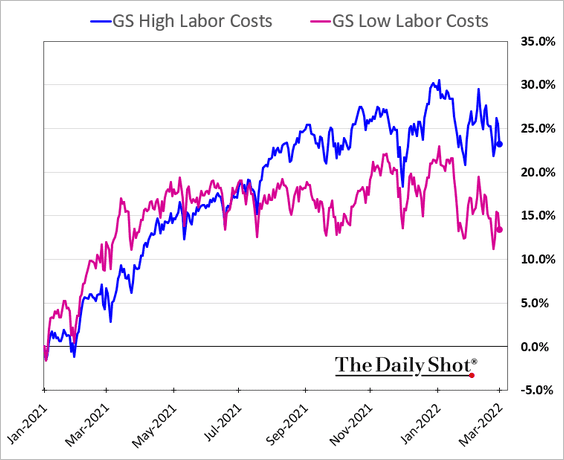
7. While concerns about rising labor costs impacting margins have been on the rise, stocks of companies with high labor costs have been outperforming those with low labor costs.
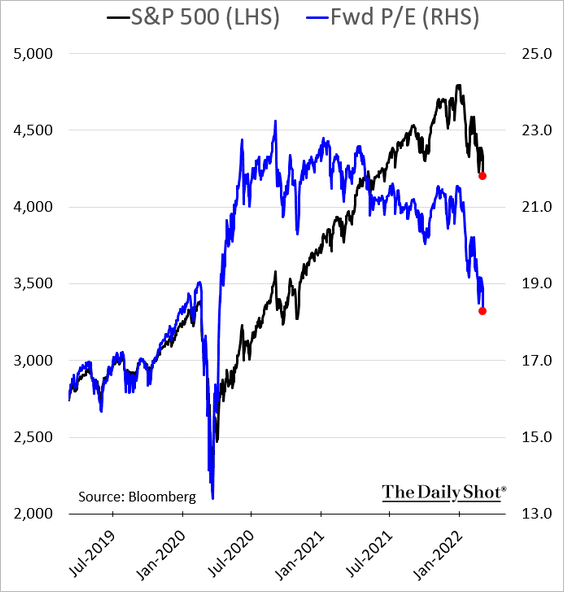
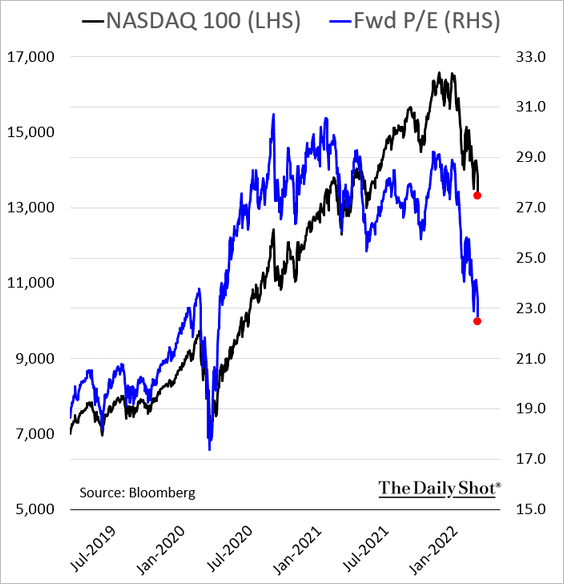
8. Valuations are now below pre-COVID levels.
• The S&P 500 forward P/E ratio:
• The Nasdaq 100 forward P/E ratio:
——————–
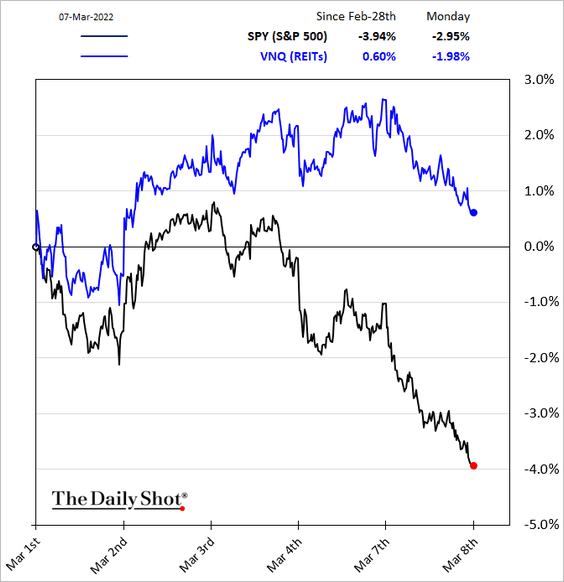
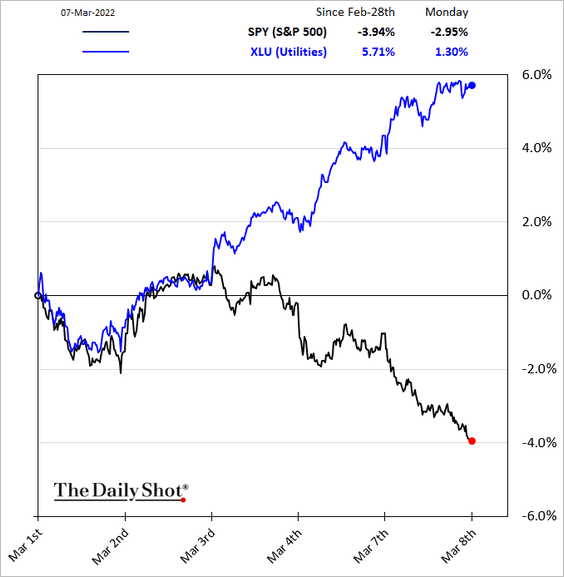
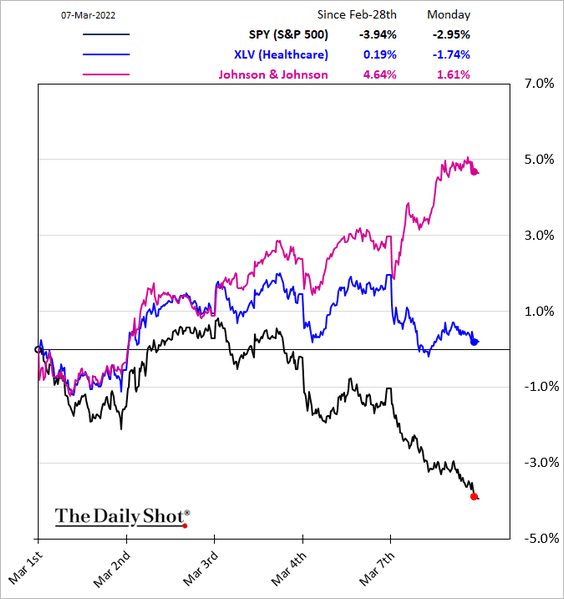
9. Next, we have several sector performance charts (some spectacular moves):
• Defensive industries:
– REITs:
– Utilities:
– Healthcare:
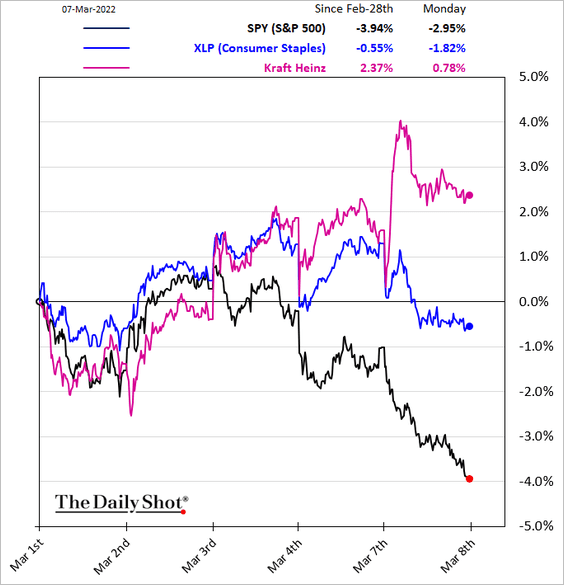
– Consumer staples:
——————–
• Other sectors:
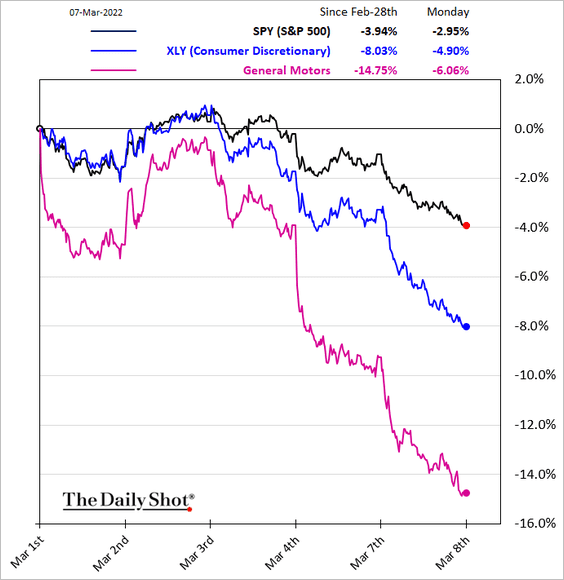
– Consumer Discretionary:
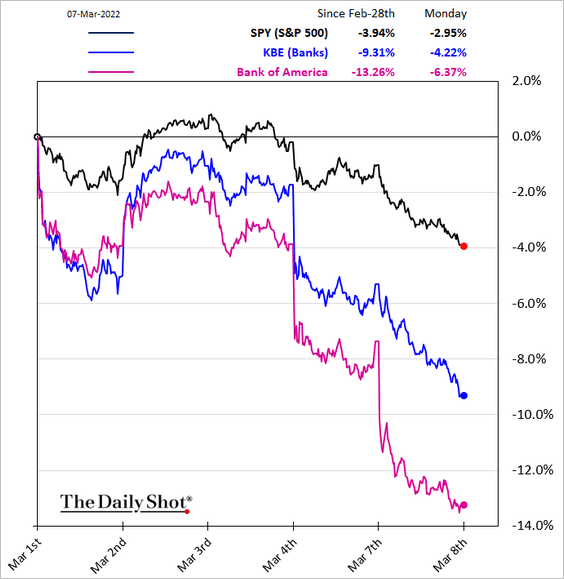
– Banks:
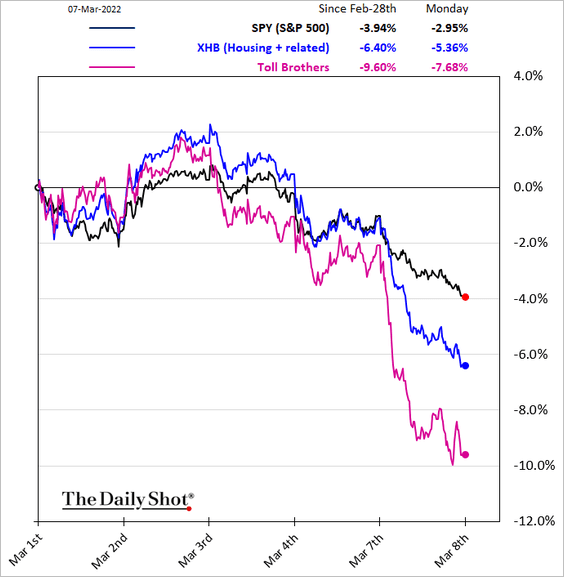
– Housing:
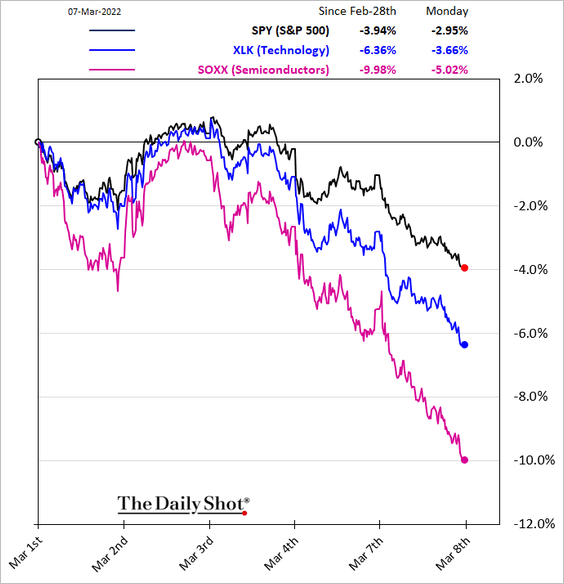
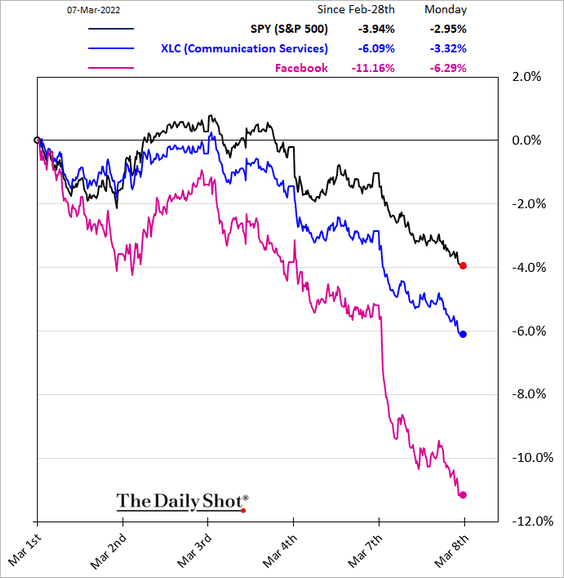
– Tech, Semiconductors, and Communication Services:
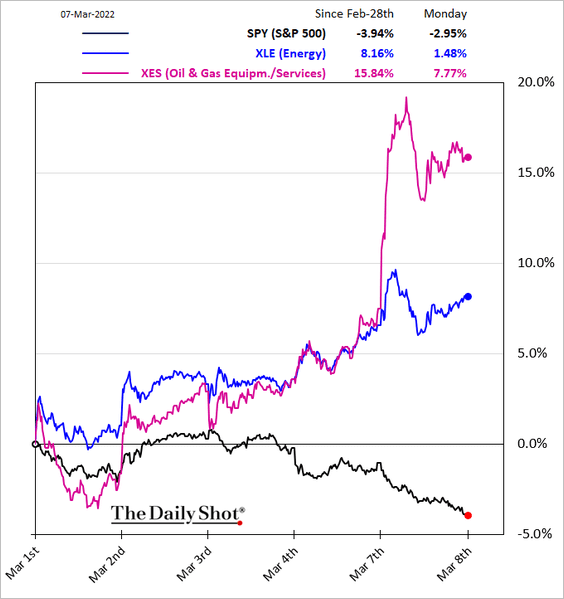
– Energy:
– Airlines …
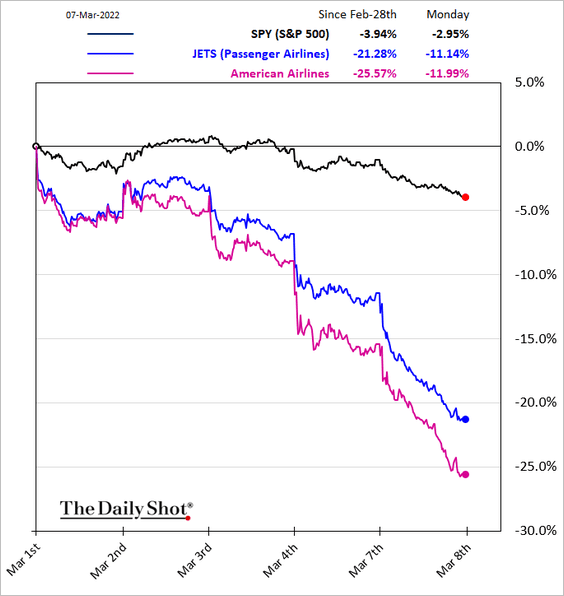
… driven by surging jet fuel costs.
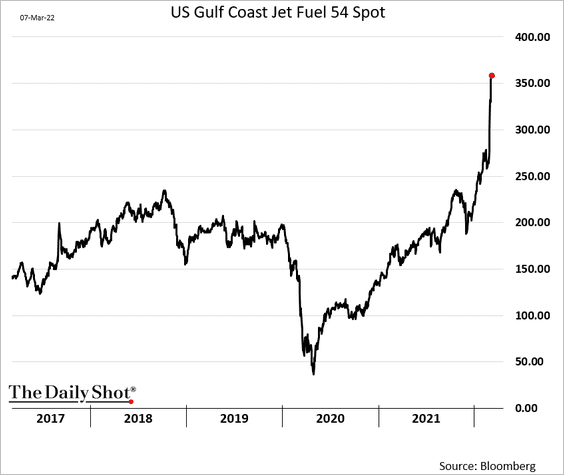
Will the airline sector recovery stall?
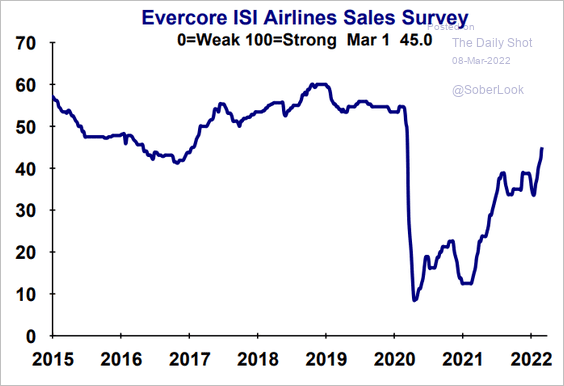 Source: Evercore ISI Research
Back to Index
Credit
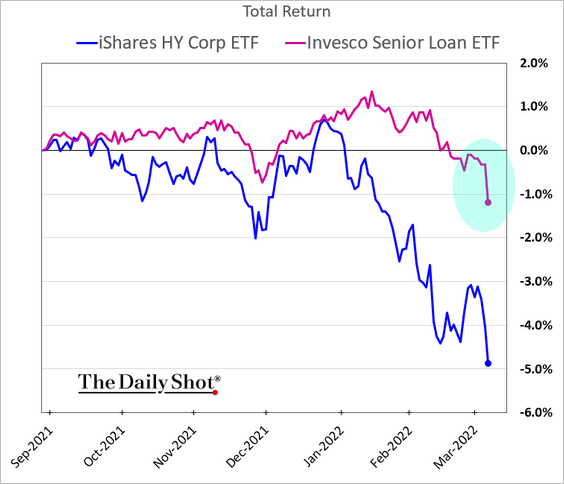
1. Leveraged loans have finally cracked amid heightened risk aversion and moderating rate expectations.
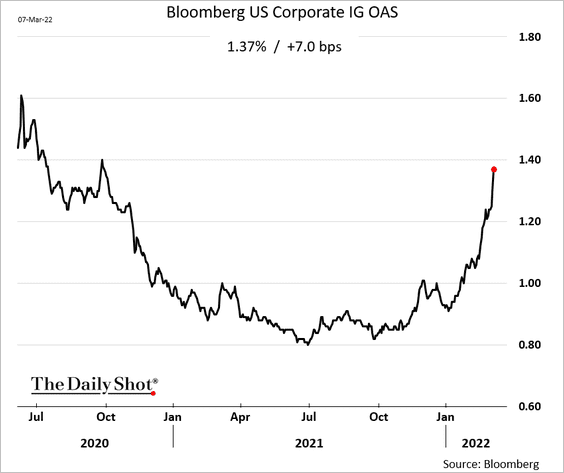
2. Investment-grade bond spreads keep widening.
3. US investment-grade leverage has been falling.
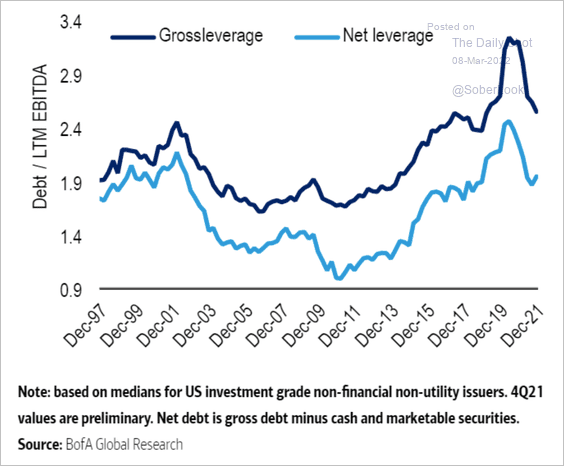 Source: BofA Global Research
4. European investment-grade fund outflows have coincided with wider spreads.
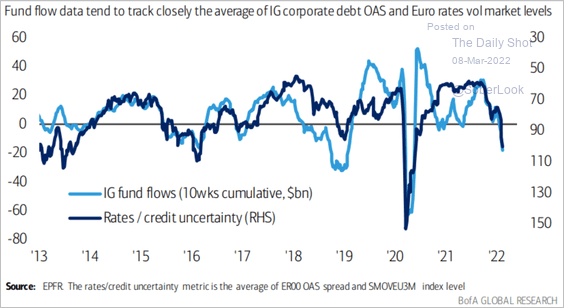 Source: BofA Global Research
Back to Index
Commodities
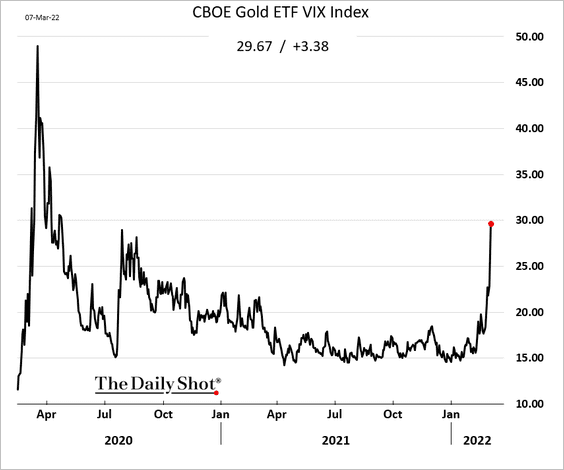
1. Gold broke through $2,000, …
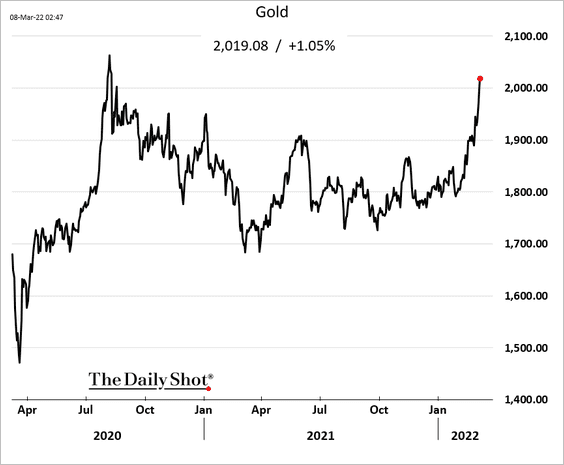
… as implied volatility jumps.
——————–
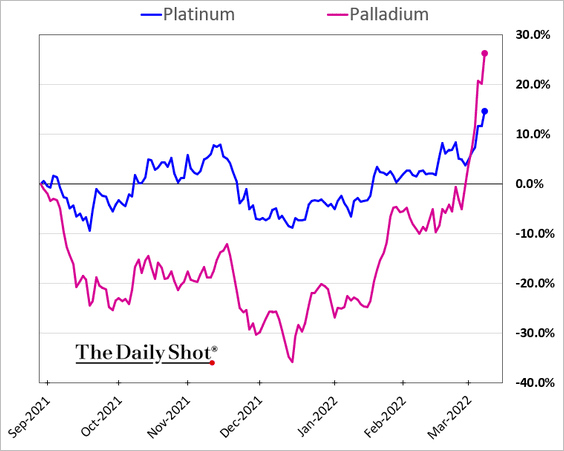
2. Palladium is surging on supply concerns.
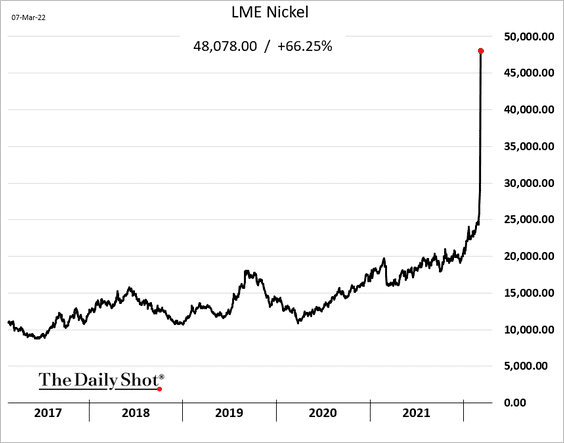
3. Nickel exploded to the upside as market participants got caught in a short squeeze (hedges have blown up amid massive margin calls).
 Source: Yahoo Finance Read full article
——————–
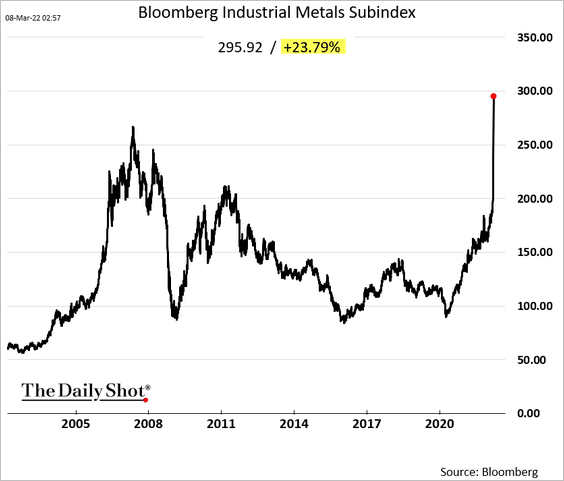
4. Bloomberg’s industrial metals index hit a record high.
Back to Index
Energy
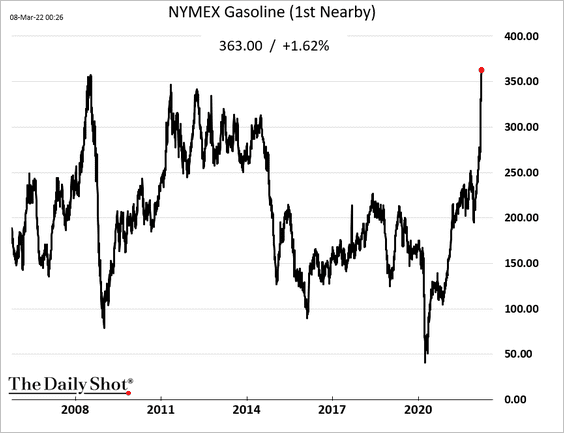
1. US gasoline futures hit a record high.
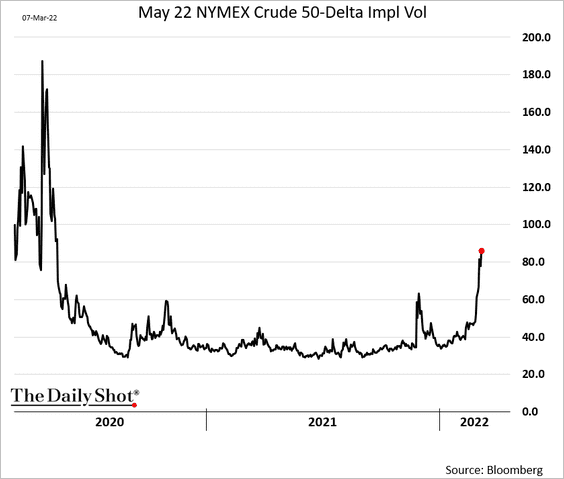
2. Oil implied vol is climbing.
3. Cushing, OK (WTI futures settlement hub) oil inventories continue to move lower.
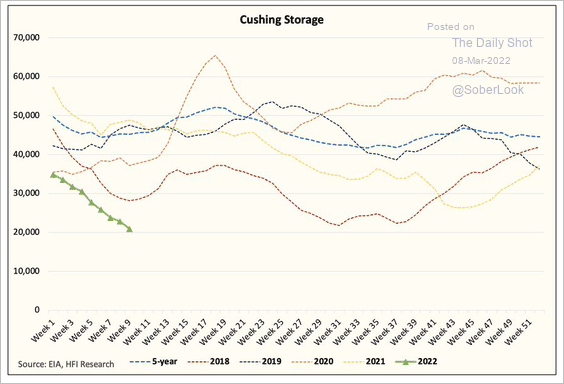 Source: @HFI_Research
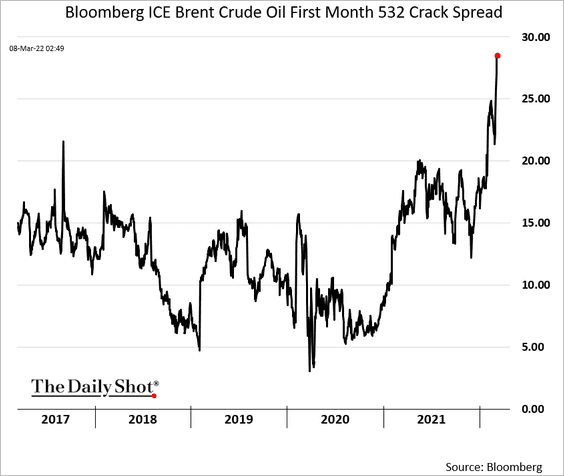
4. Crack spreads are elevated – a boon for refinery businesses.
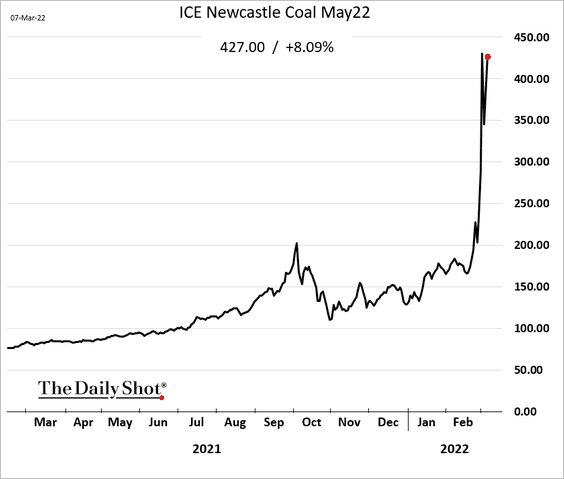
5. Coal futures are trading near record highs.
6. This chart shows Russia’s oil export partners.
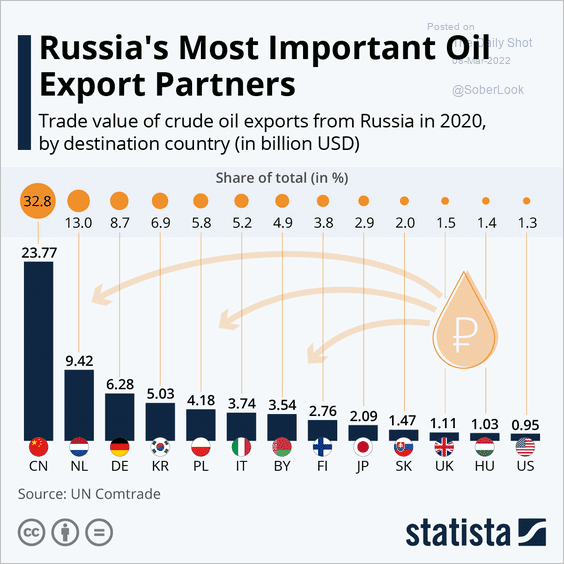 Source: Statista
Back to Index
Emerging Markets
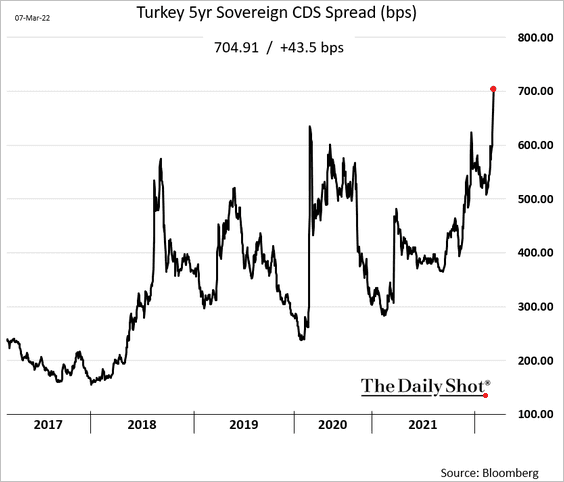
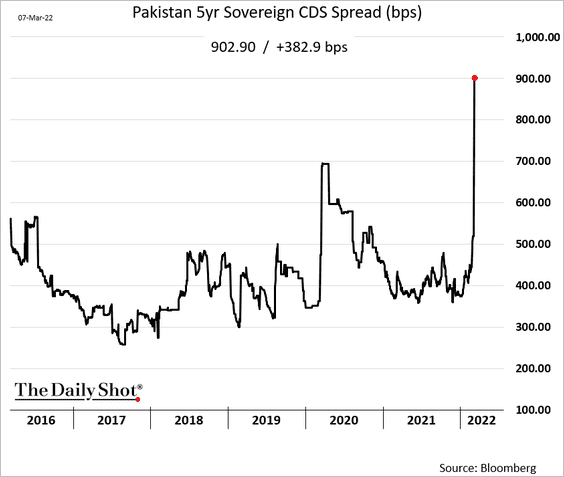
1. Sovereign CDS spreads of vulnerable economies have widened sharply.
• Turkey:
• Pakistan:
——————–
2. EUREX futures on the Russian stock index are no more …
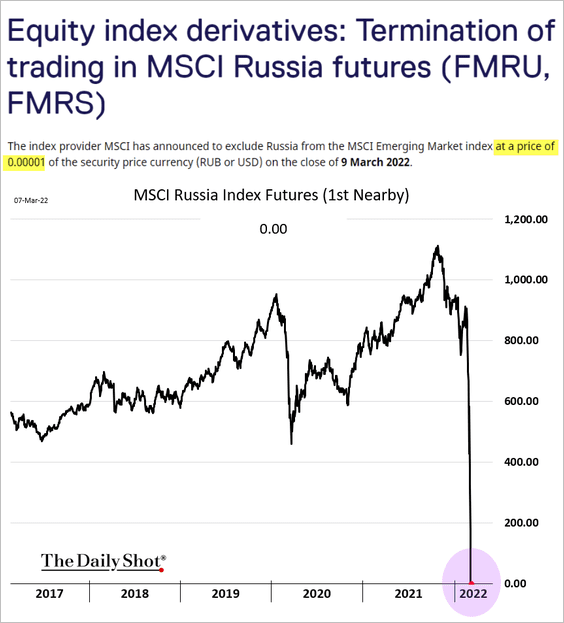 Source: EUREX Read full article
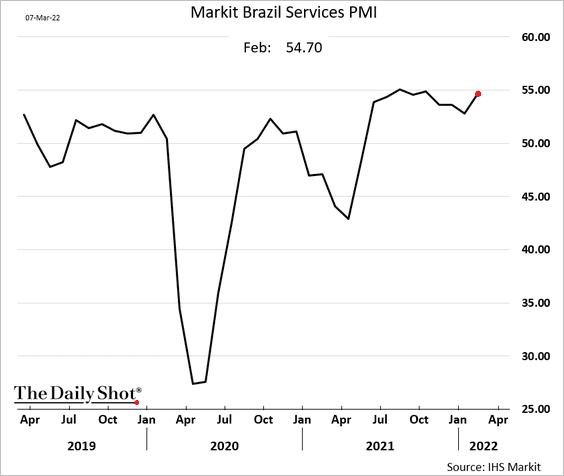
3. Brazil’s service sector rebounded last month.
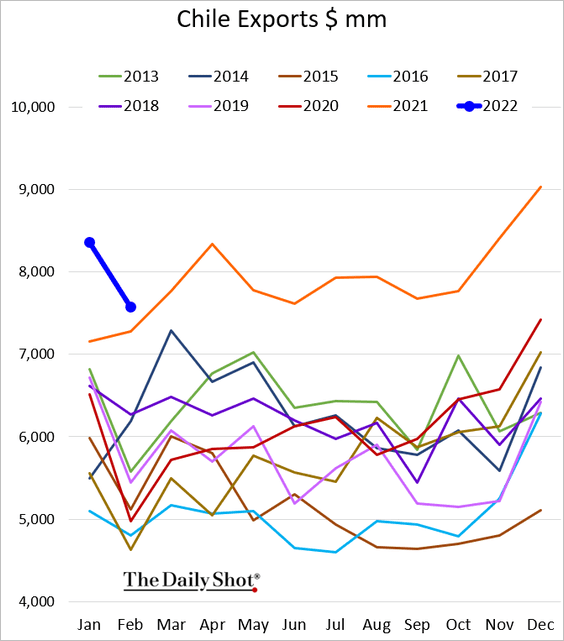
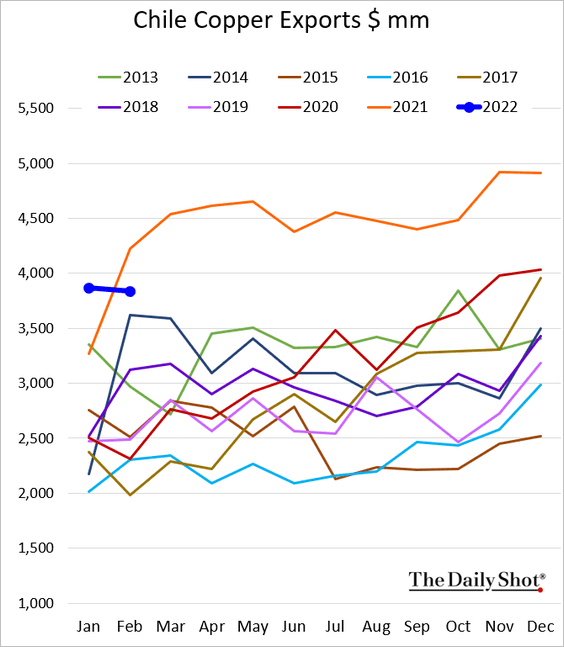
4. Chile’s exports eased in February but remain strong for this time of the year.
——————–
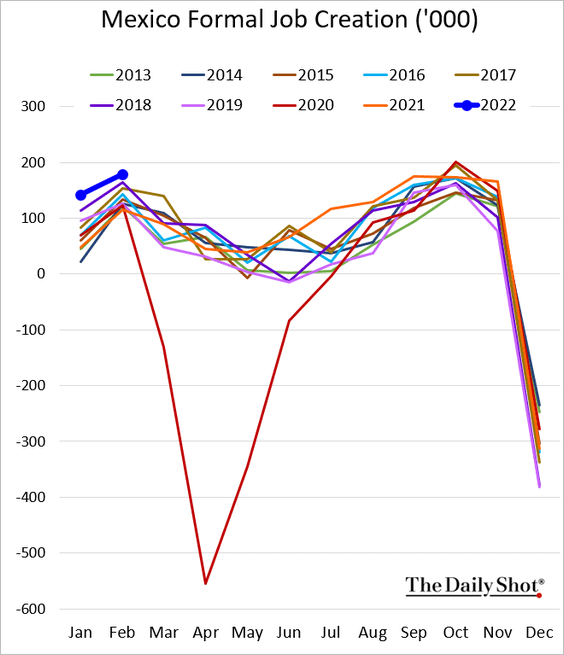
5. Mexican job creation remains robust.
6. Ukrainian bonds have collapsed.
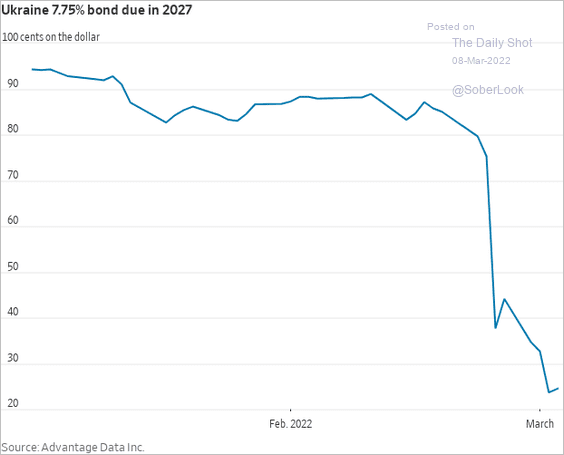 Source: @WSJ Read full article
Back to Index
China
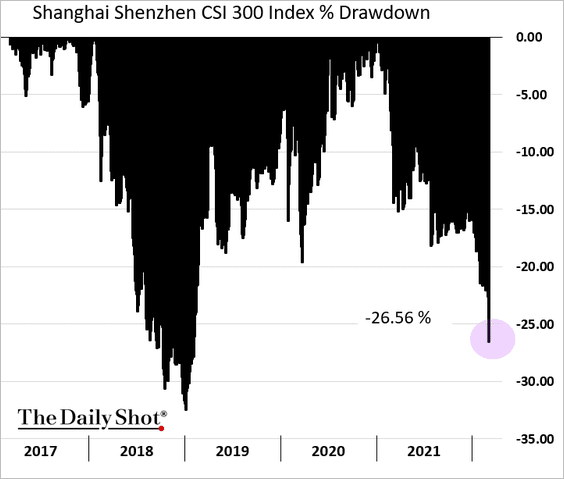
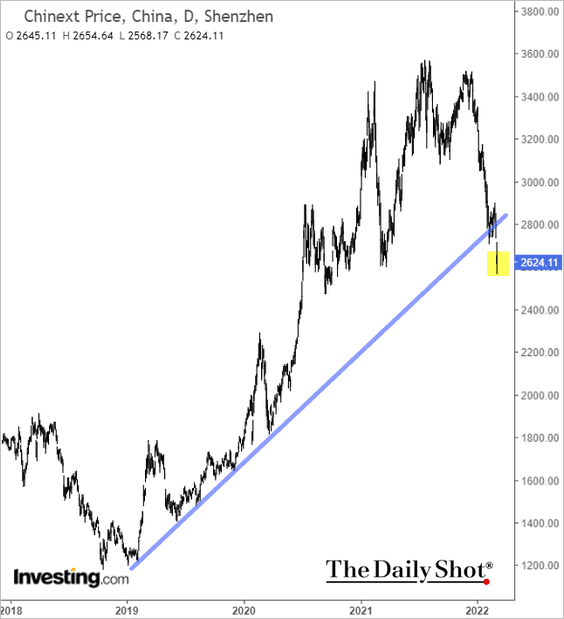
1. Stocks are deep in bear-market territory.
• Chinext, China’s growth index, broke through support.
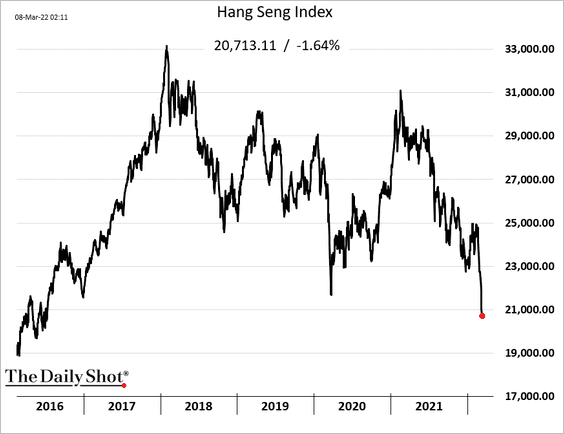
• The Hang Seng Index is at the lowest level since 2016.
——————–
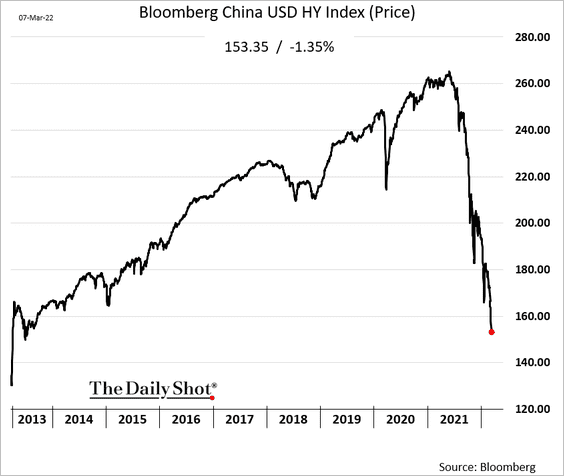
2. The USD-denominated high-yield index hit the lowest level since 2013.
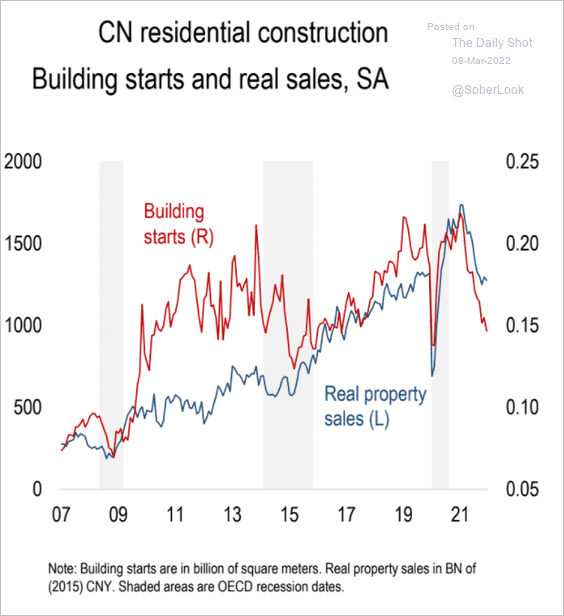
3. Beijing is trying to support the flagging real estate sector.
 Source: Numera Analytics
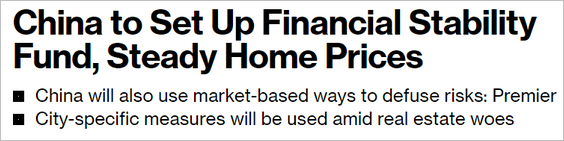 Source: Bloomberg Read full article
——————–
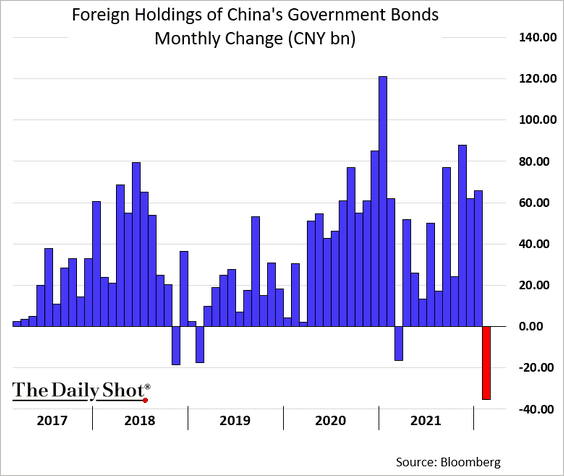
4. Foreigners sold China’s government bonds.
Back to Index
Asia – Pacific
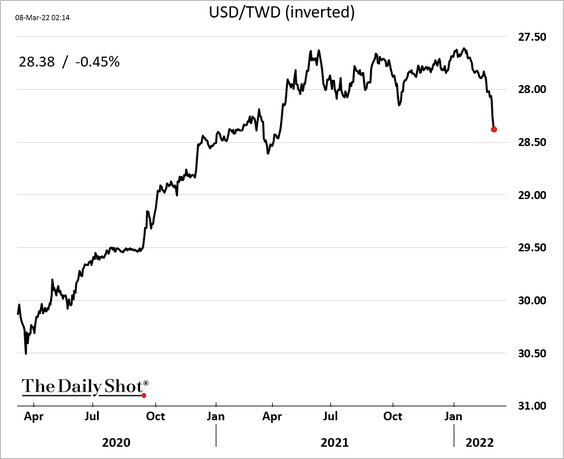
1. The Taiwan dollar is rolling over.
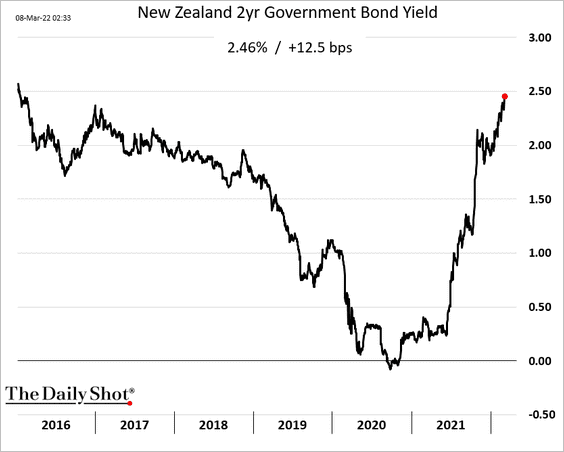
2. New Zealand’s 2yr government bond yield is nearing 2.5% for the first time since early 2016.
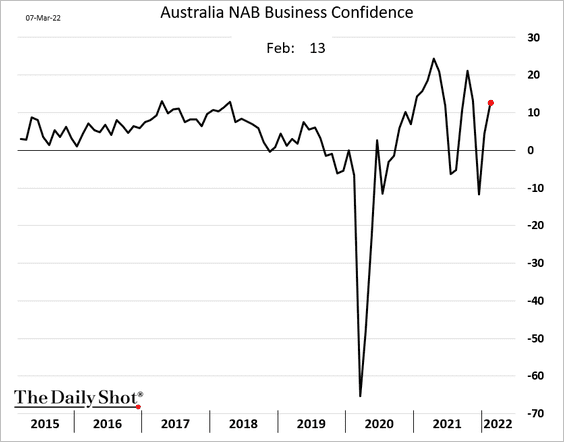
3. Australia’s business confidence improved further last month.
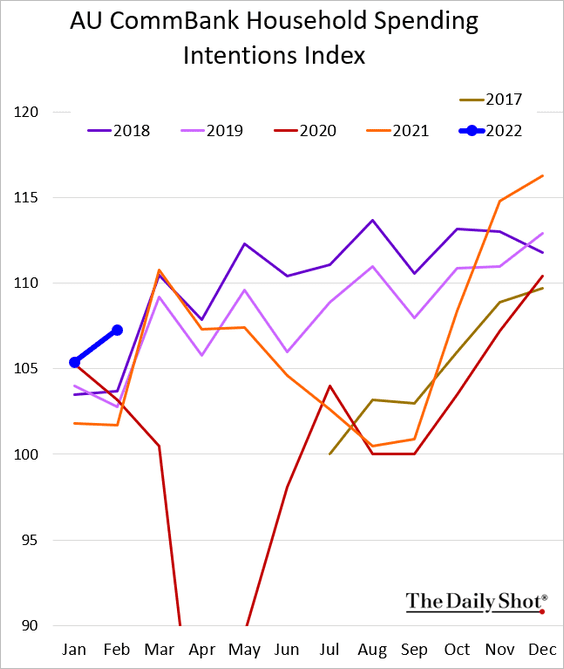
Households’ spending intentions remain vibrant for this time of the year.
——————–
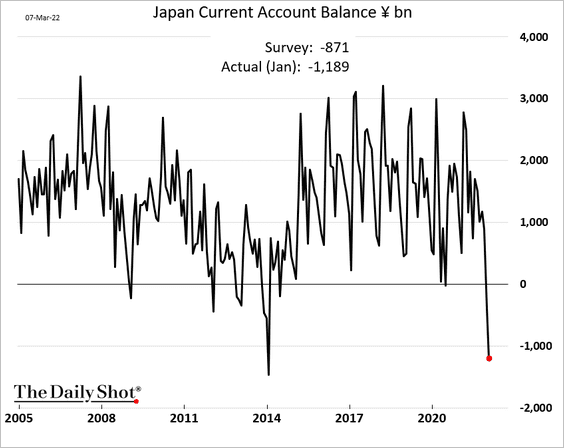
4. Japan’s current account rolled into deficit as energy prices surge.
Back to Index
The Eurozone
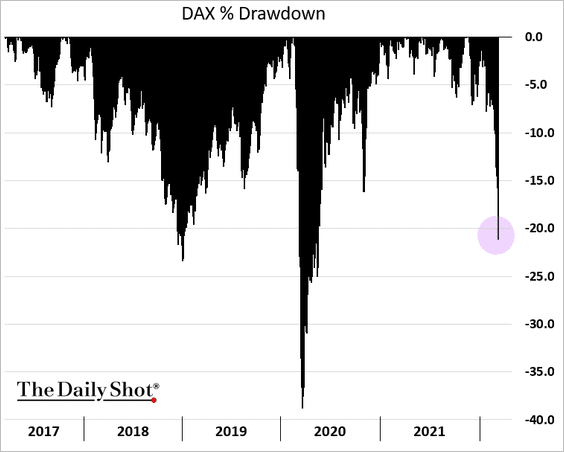
1. Several European equity indices are in bear-market territory.
2. The euro is testing long-term support.
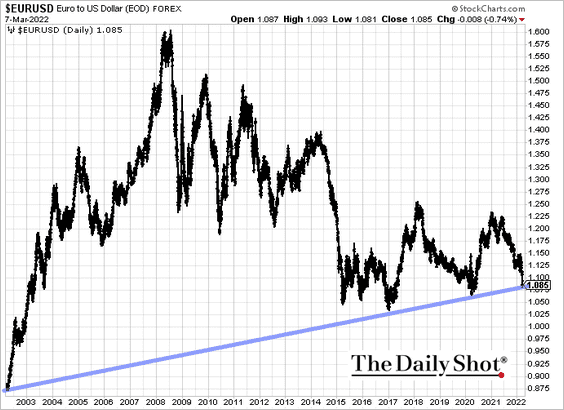 h/t @AkshayChinchal4
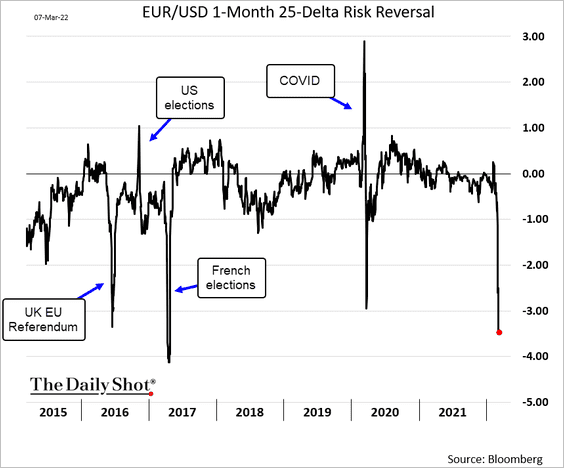
EUR/USD risk reversals continue to show increasing worries about downside risks.
——————–
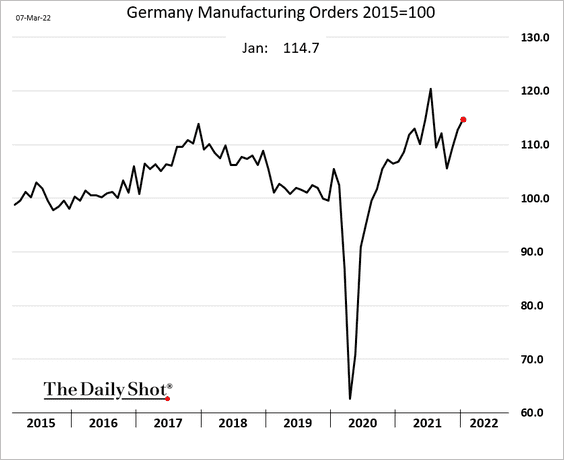
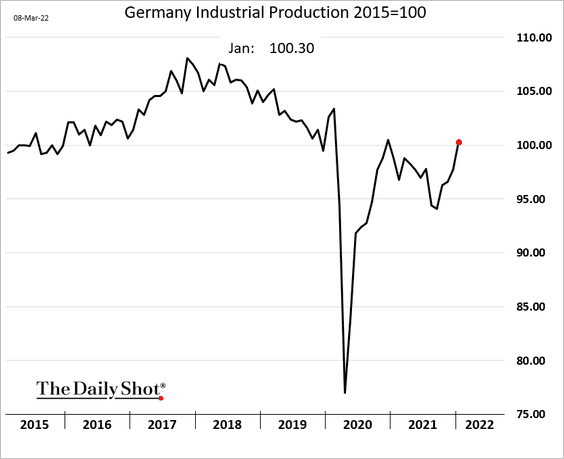
3. Germany’s factory orders and industrial production climbed in January.
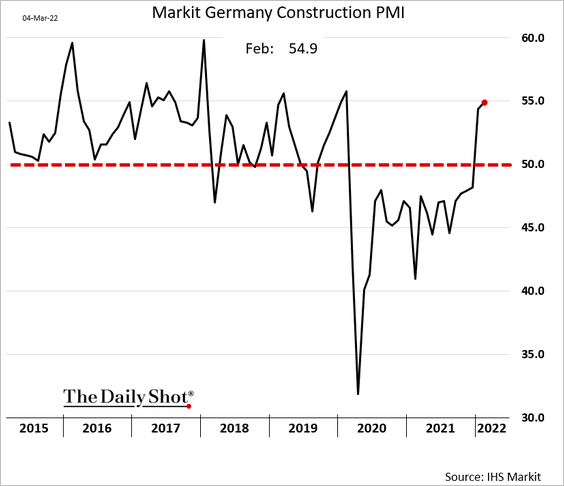
Construction activity improved further last month.
——————–
4. Market-based inflation expectations a surging, …
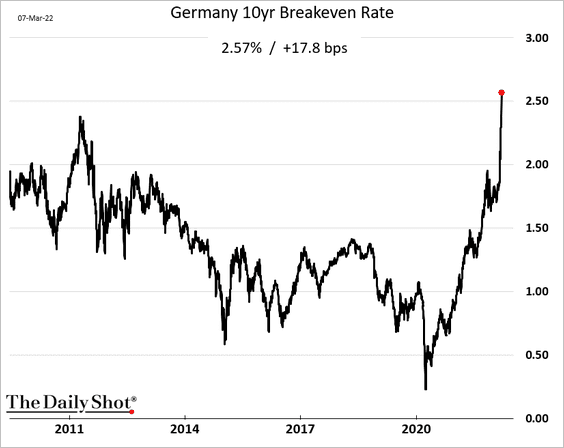
… as energy prices hit new highs.

——————–
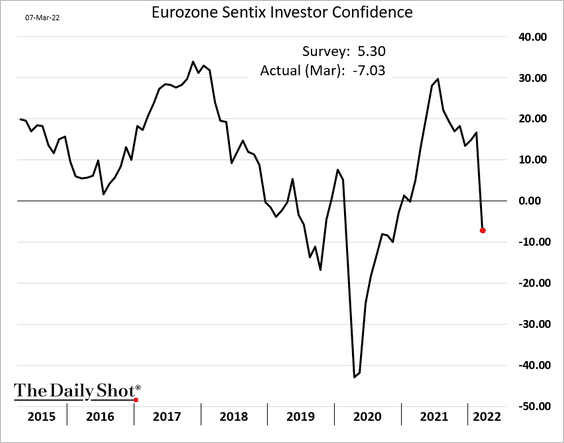
5. Investor sentiment has deteriorated this month.
Back to Index
Europe
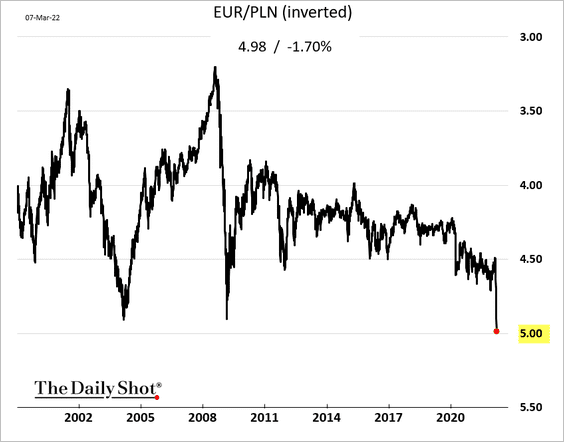
1. The Polish zloty hit the lowest level vs. the euro since the euro’s launch.
2. Implied volatility on European shares is now well above US vol index (VIX).
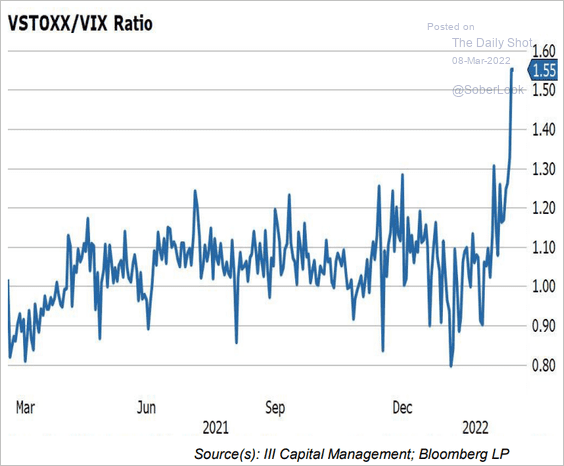 Source: III Capital Management
3. Which countries experienced the highest increases in energy prices?
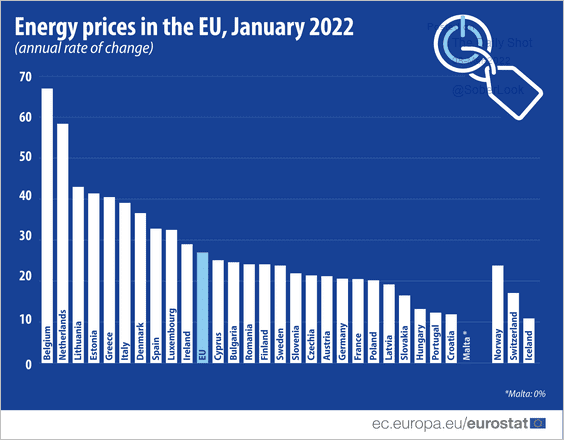 Source: @EU_Eurostat Read full article
Back to Index
The United Kingdom
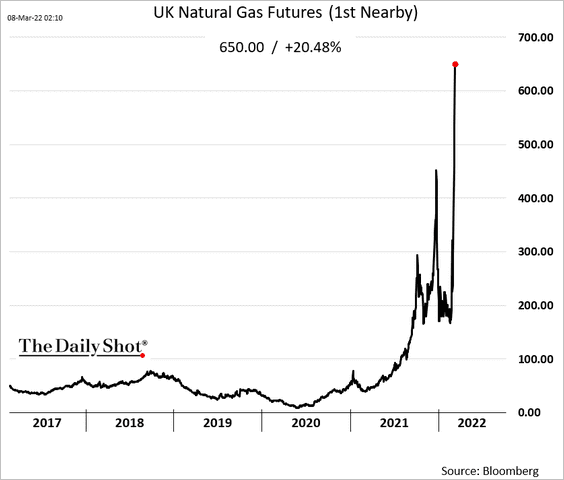
UK market-based inflation expectations are hitting record highs, …
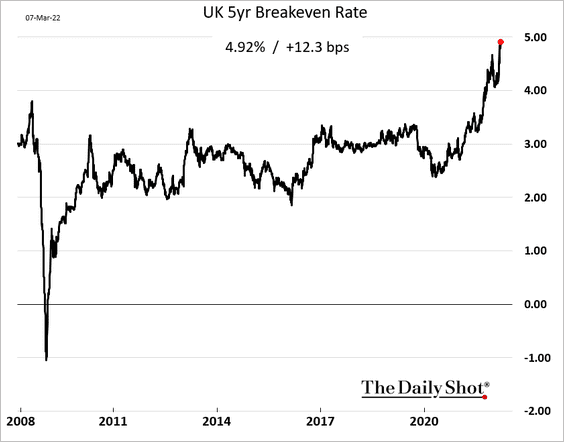
… as energy prices soar.
Back to Index
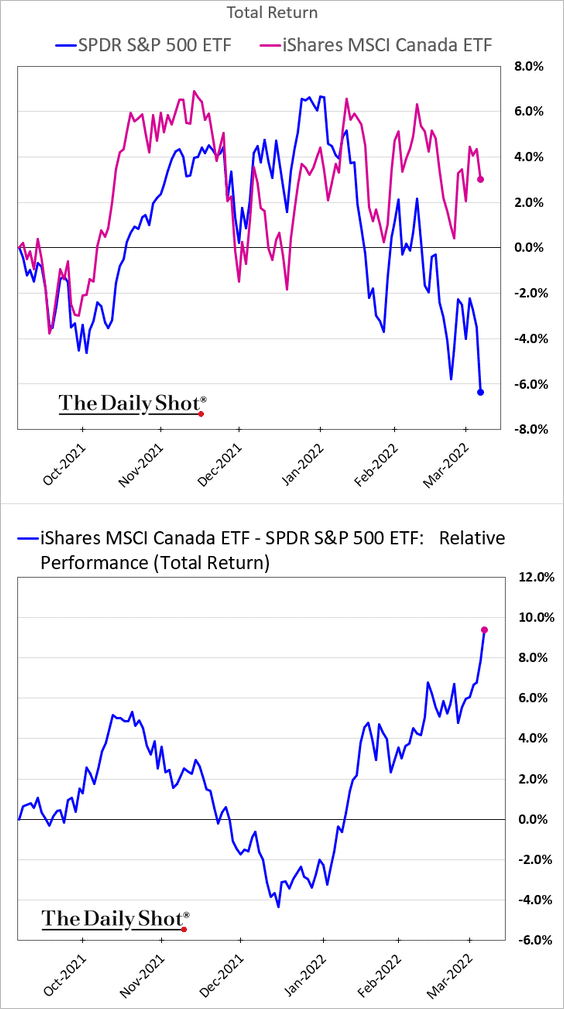
Canada
Canadian shares are outperforming as commodity prices rally.
Back to Index
The United States
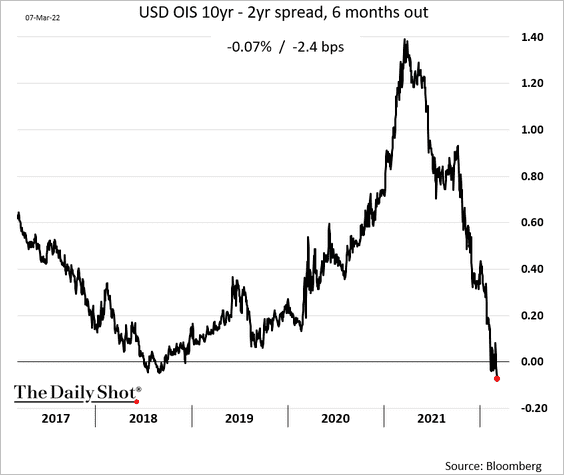
1. The yield curve keeps flattening as the market prices in slower growth ahead.
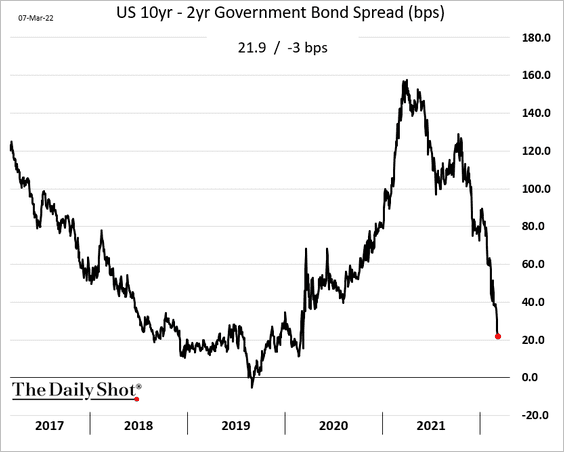
The market expects the curve to invert within months.
——————–
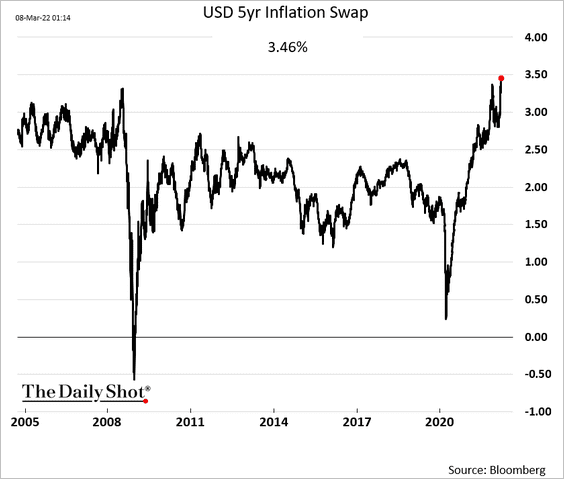
2. Market-based inflation expectations keep rising.
This chart shows inflation option premiums.
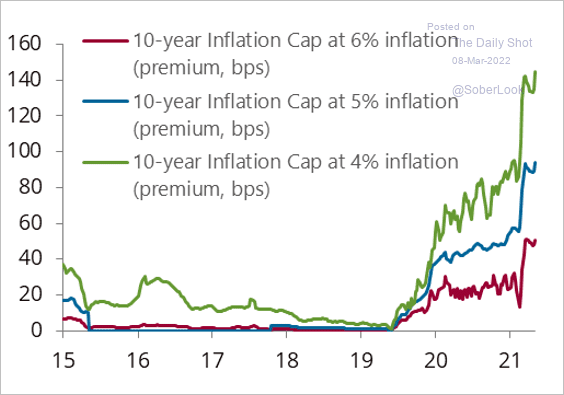 Source: @Marcomadness2
• Will the CPI peak at 8%?
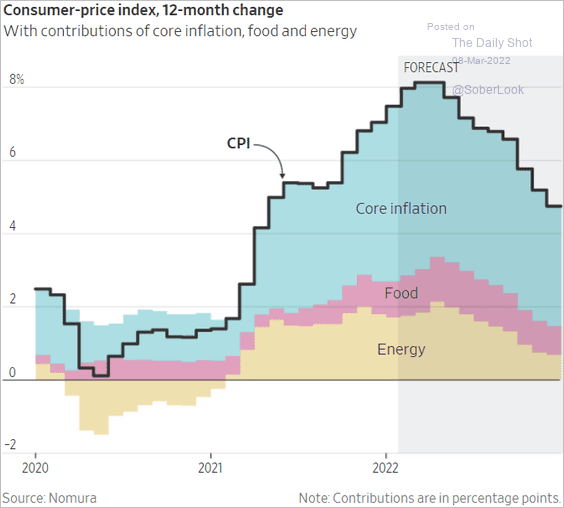 Source: @WSJ Read full article
——————–
3. US financial conditions continue to tighten (2 charts).
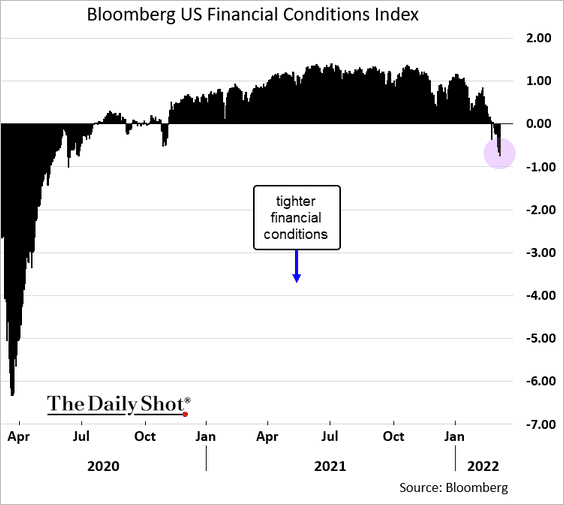
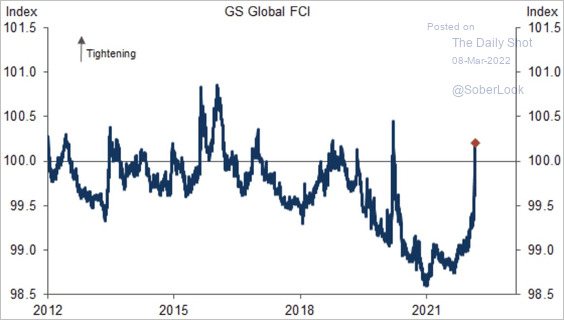 Source: Goldman Sachs; @SamRo
——————–
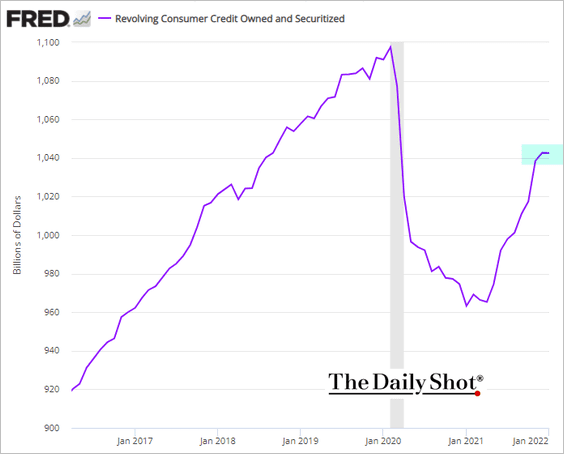
4. Credit card balances leveled off in January (on a seasonally-adjusted basis).
By the way, here is the US credit card charge-off rate.
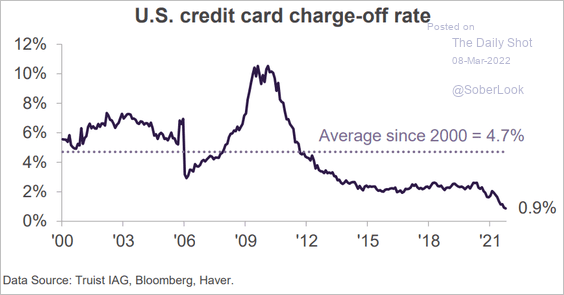 Source: Truist Advisory Services
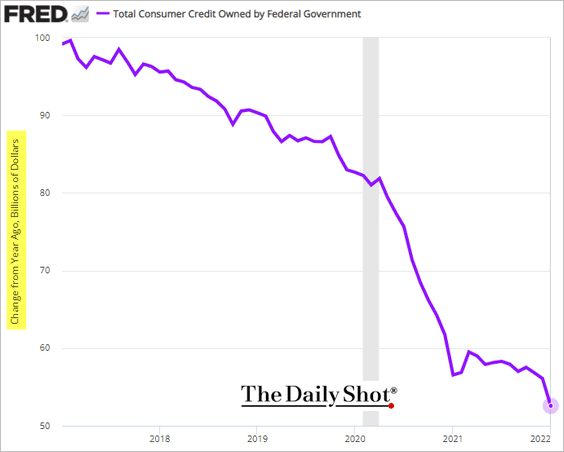
Student debt growth continues to slow.
——————–
5. Job openings appear to have peaked.
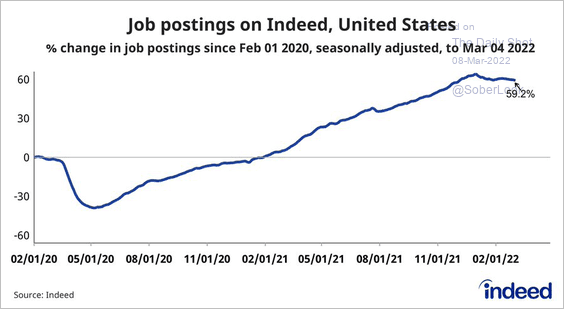 Source: @AE_Konkel, @indeed
Placement companies’ revenues keep climbing.
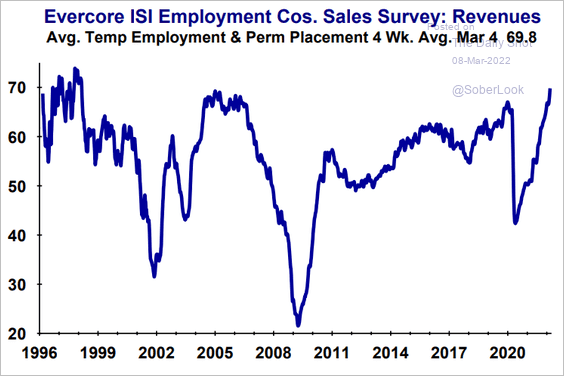 Source: Evercore ISI Research
——————–
6. Will surging gasoline prices reduce US mobility?
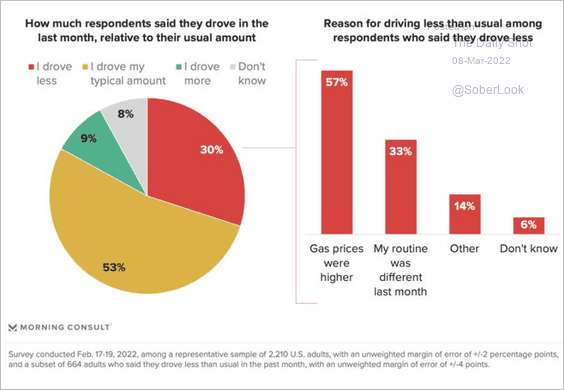 Source: @MorningConsult Read full article
Back to Index
Global Developments
1. Which countries saw the highest growth in manufacturing employment last month?
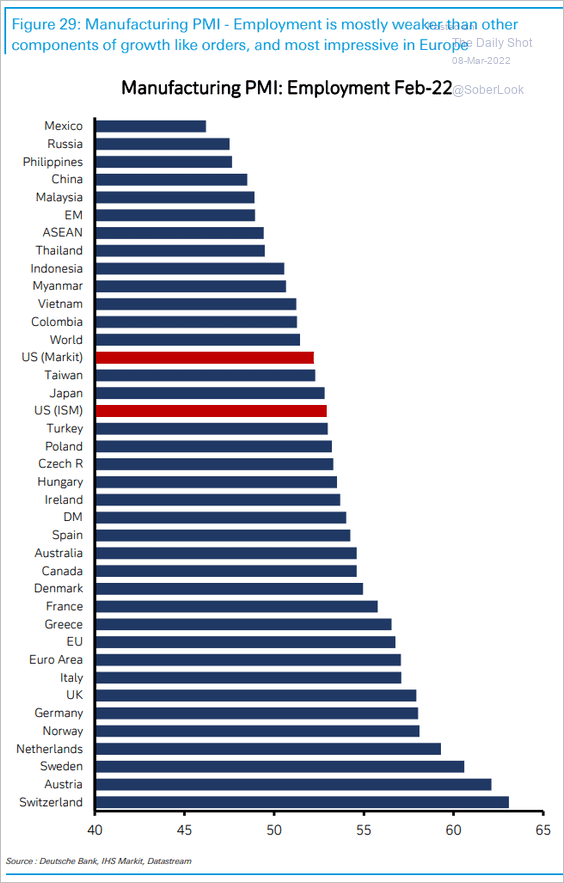 Source: Deutsche Bank Research
2. Next, we have some data on global M&A activity.
![]() Source: S&P Global Market Intelligence
Source: S&P Global Market Intelligence
3. This chart shows the trajectories in household debt (as % of GDP).
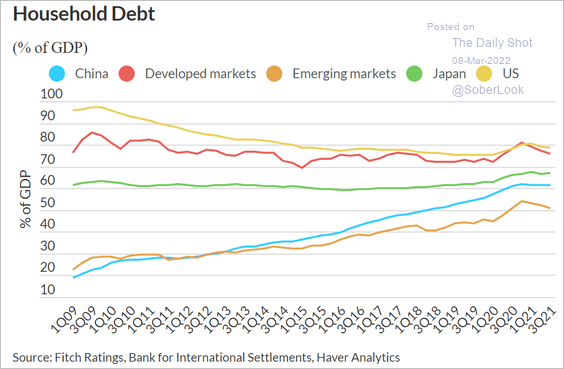 Source: Fitch Ratings
4. Economic uncertainty and geopolitical risks spiked in recent days.
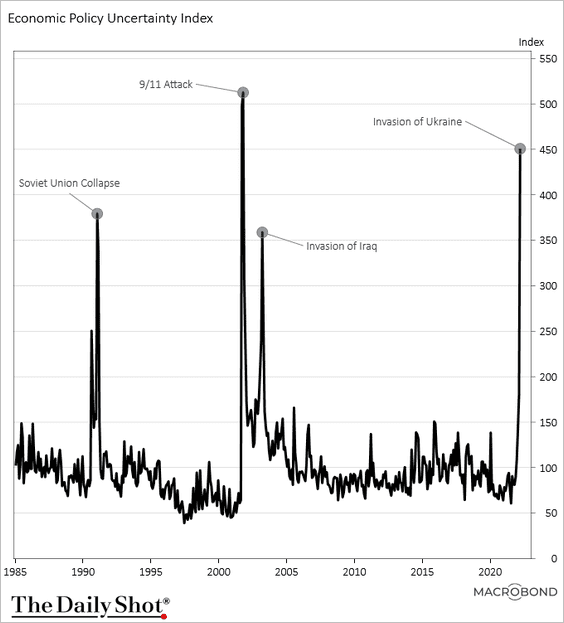 Source: Chart and data provided by Macrobond
——————–
Food for Thought
1. Most sanctioned countries:
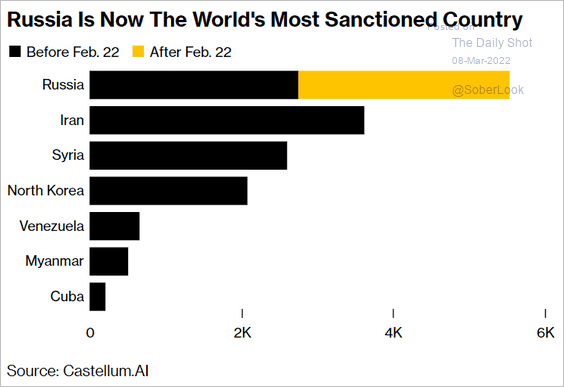 Source: Bloomberg Read full article
2. Russian public support for the war in Ukraine, by age (chart shows % not supporting):
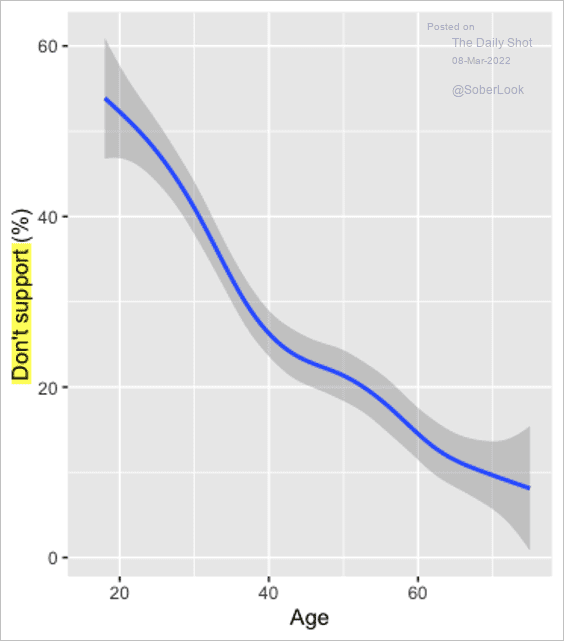 Source: @abessudnv
3. US assessment of the COVID situation:
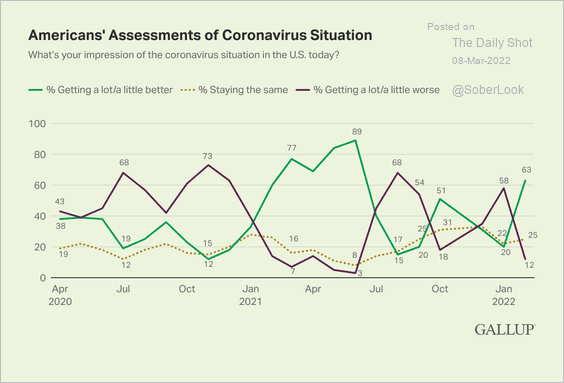 Source: Gallup Read full article
4. Keeping health care staff happy at work:
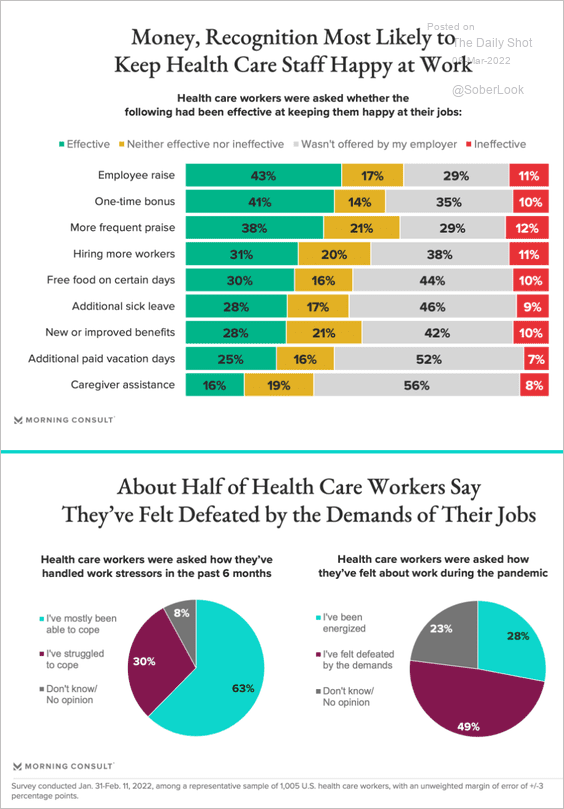 Source: Morning Consult Read full article
5. What is Web 3.0?
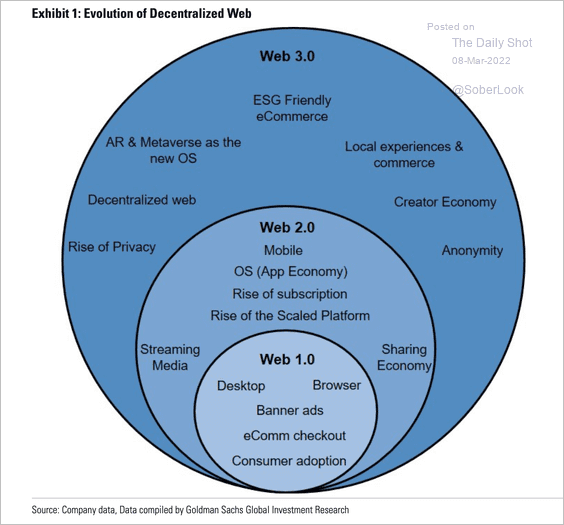 Source: Goldman Sachs
6. Views on the metaverse:
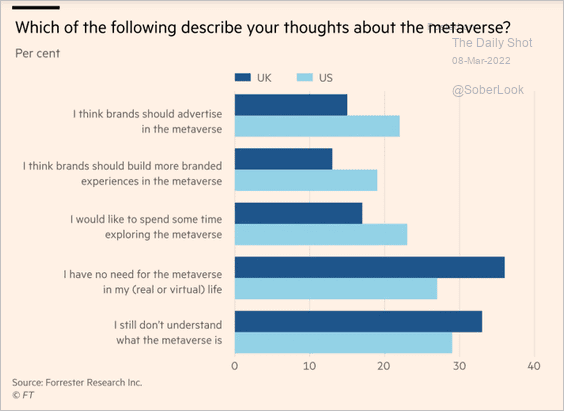 Source: @financialtimes Read full article
7. Mobile internet traffic:
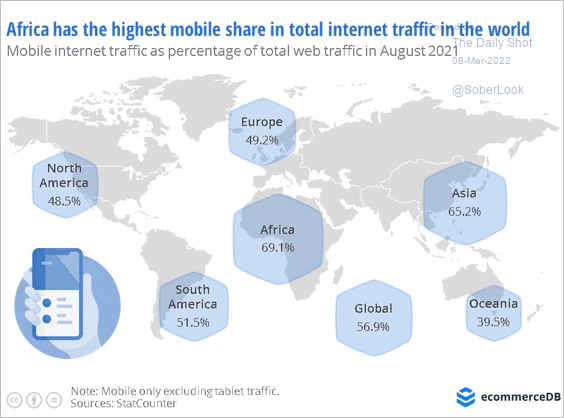 Source: EcommerceDB Read full article
8. Food delivery economics:
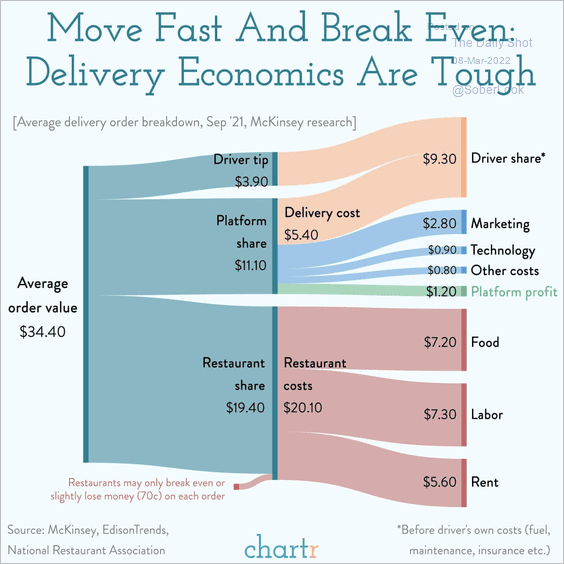 Source: @chartrdaily
9. Police departments for hire:
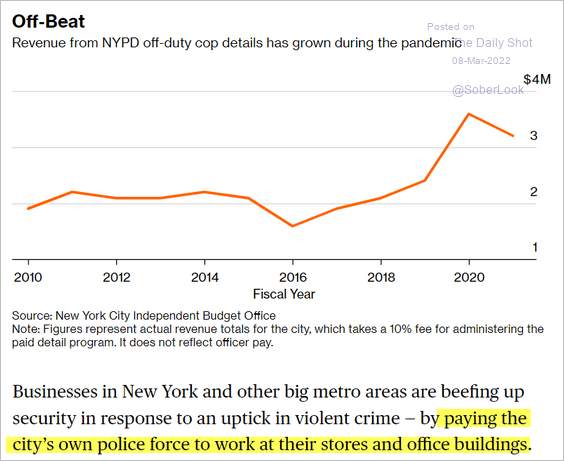 Source: Bloomberg CityLab Read full article
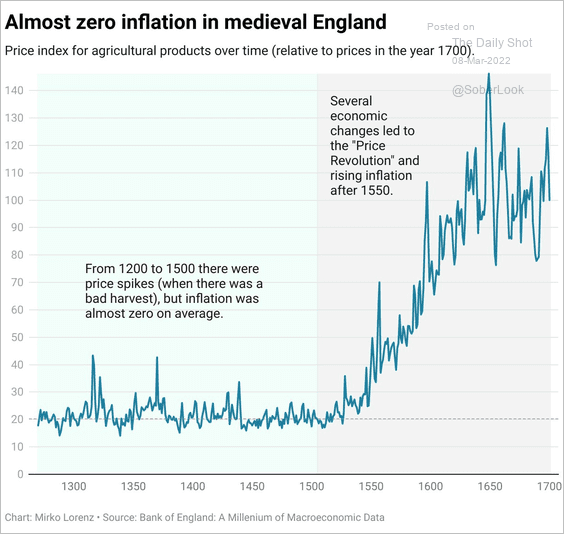
10. Inflation in England from 1300 to 1700:
 Source: Datawrapper Read full article
——————–
Back to Index