
The Daily Shot: 21-Mar-22
• The United States
• Canada
• The United Kingdom
• The Eurozone
• Europe
• Asia – Pacific
• China
• Emerging Markets
• Cryptocurrency
• Commodities
• Energy
• Equities
• Alternatives:
• Credit
• Rates
• Global Developments
• Food for Thought
The United States
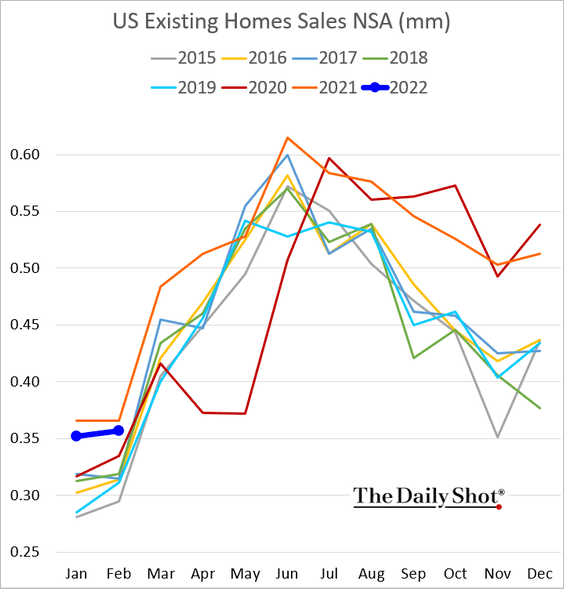
1. Let’s begin with the housing market.
• Existing home sales were softer than expected last month.
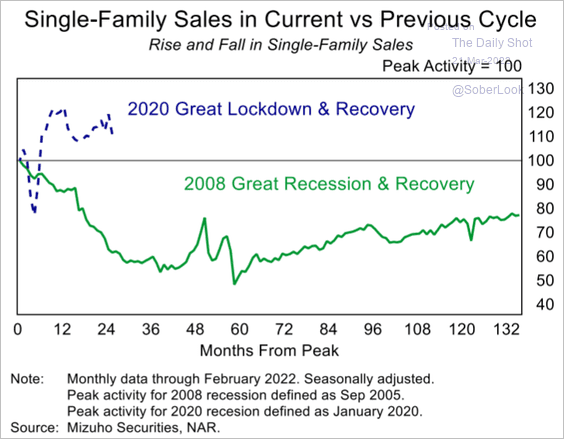
This chart shows single-family sales relative to the post-2008 recovery (seasonally adjusted).
 Source: Mizuho Securities USA
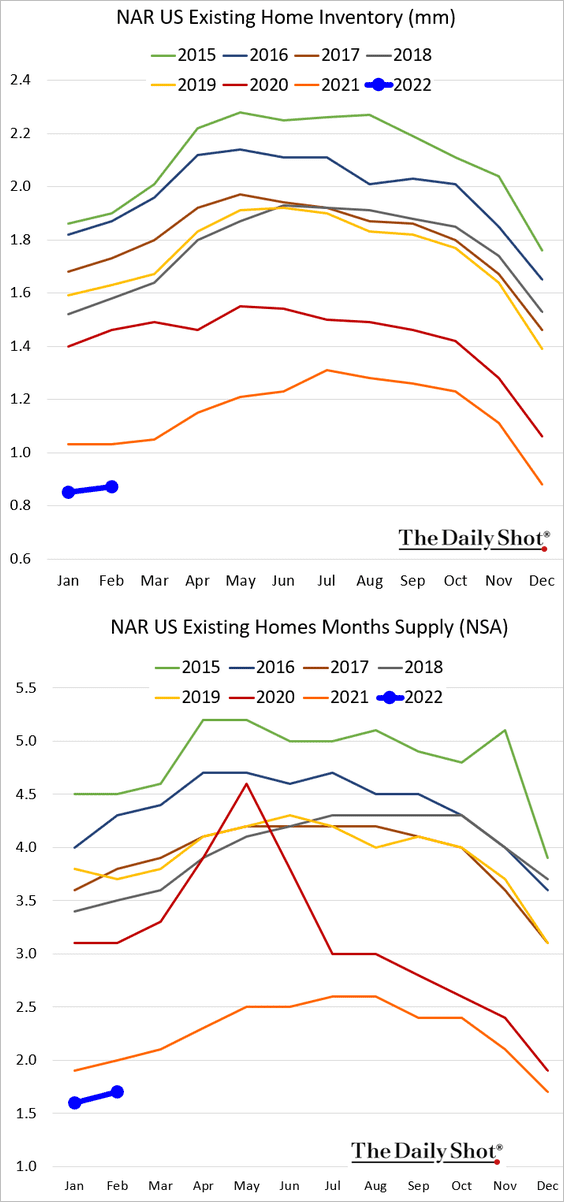
• Inventories remain extraordinarily tight.
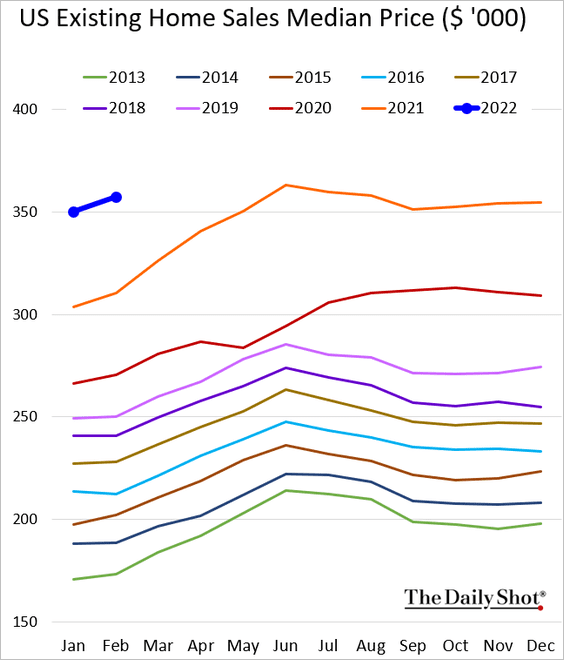
• Affordability keeps deteriorating.
– Median price:
– Mortgage payments:
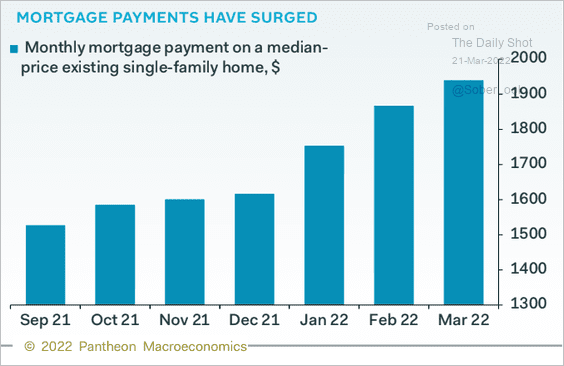 Source: Pantheon Macroeconomics
• Home price appreciation has been correlated with population growth.
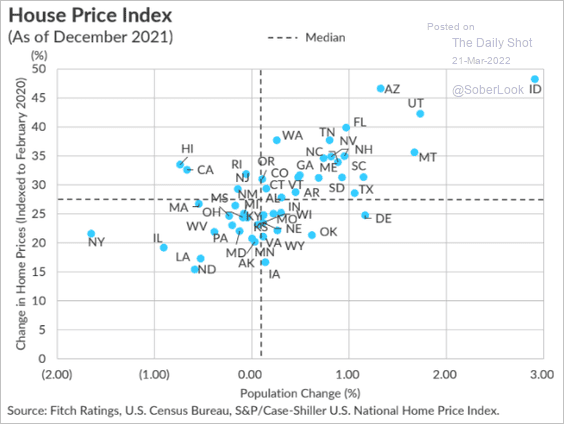 Source: Fitch Ratings
• Home equity withdrawals (via cash-out refi) have accelerated recently.
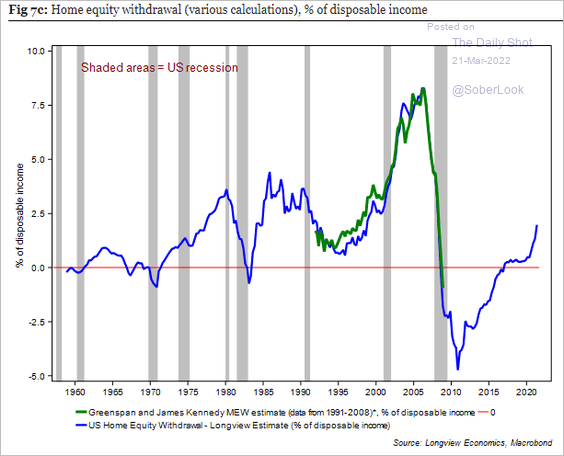 Source: Longview Economics
——————–
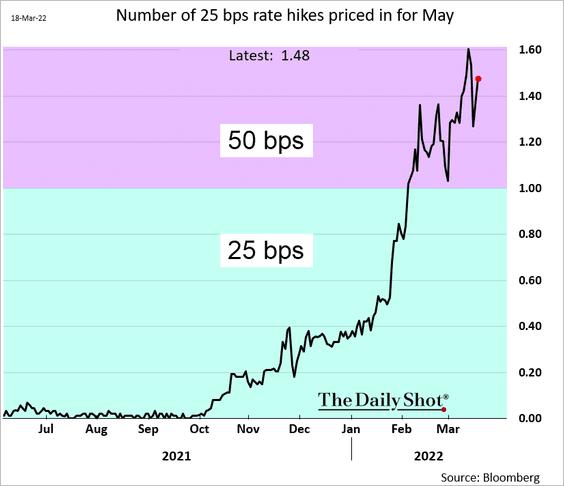
2. Here we go again. The markets are pricing in even odds of a 50 bps rate increase in May (rather than 25 bps).
• Goldman sees a steeper trajectory of rate hikes than the dot-plot (and well above market expectations).
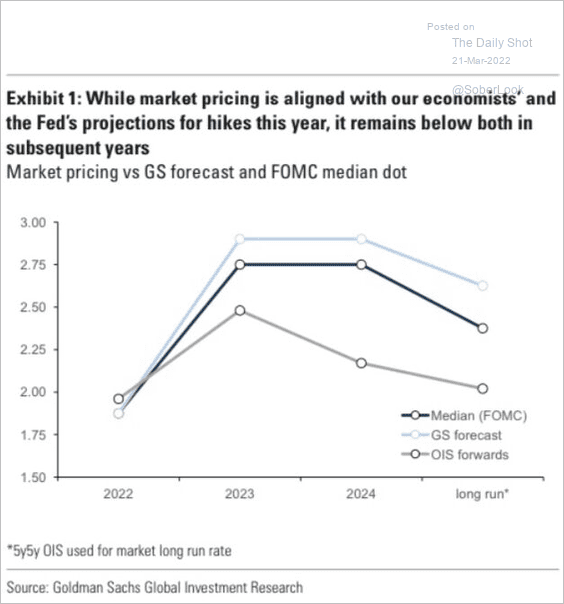 Source: Goldman Sachs
• As we mentioned before, economic indicators going into the first hike in this cycle have been unusual.
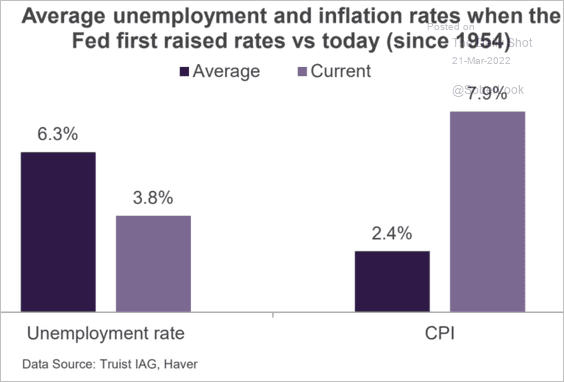 Source: Truist Advisory Services
3. The yield curve flattening has been relentless.
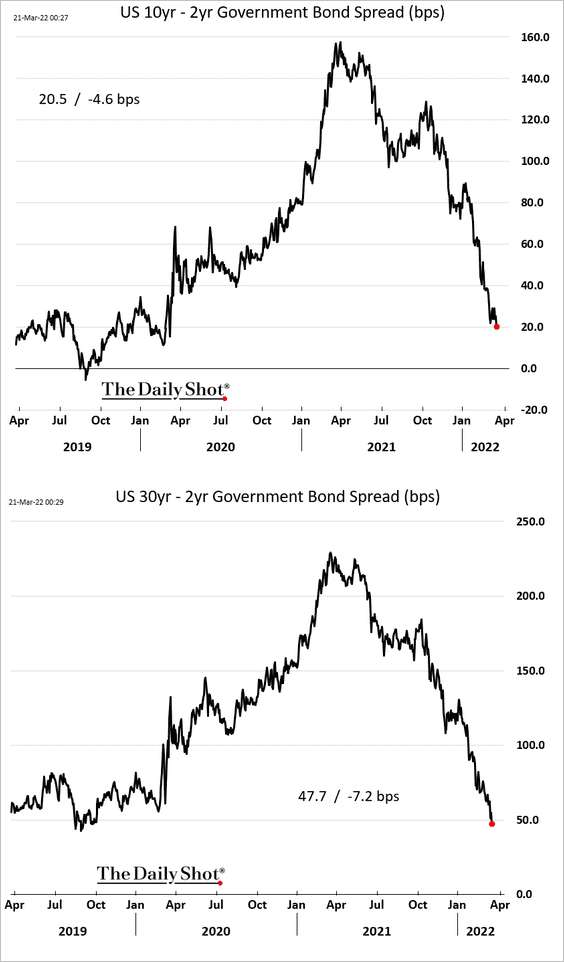
The market sees the yield curve inverting shortly.
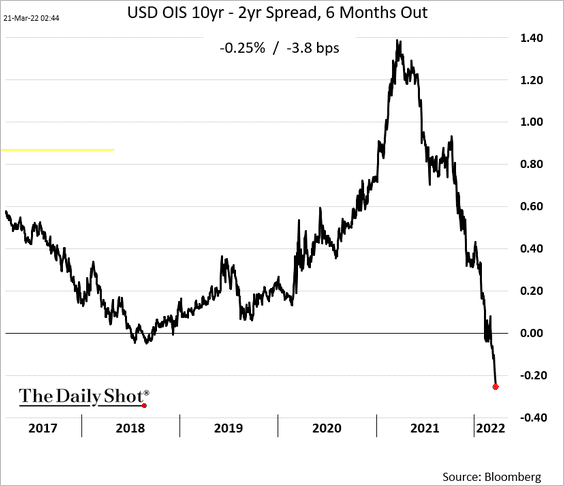
Does that mean we are looking at a recession?
• Not in the near term.
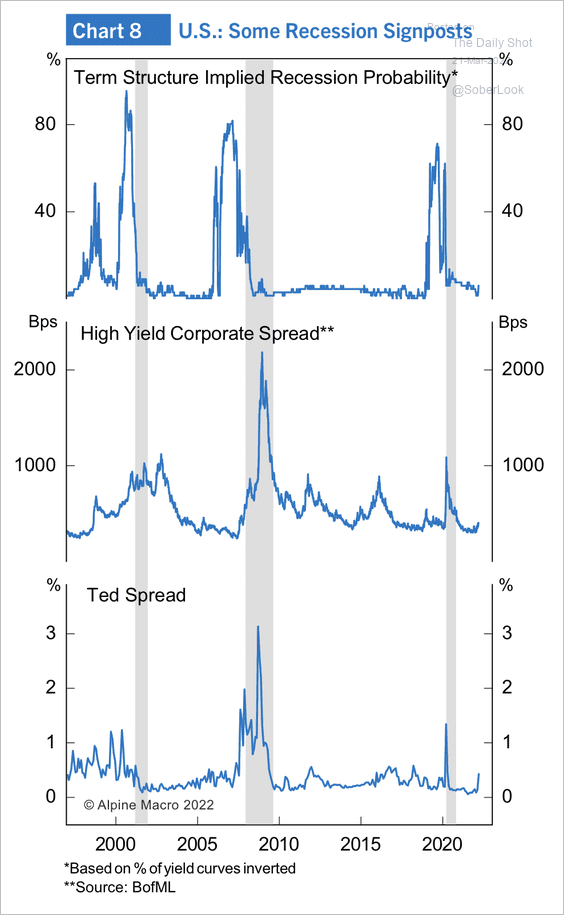 Source: Alpine Macro
• But perhaps within three years?
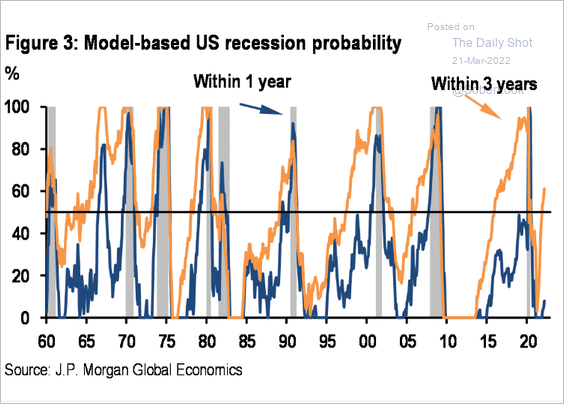 Source: JP Morgan Research; @dlacalle_IA
• The combination of a strong dollar, rising oil prices, and higher rates will weigh on economic growth.
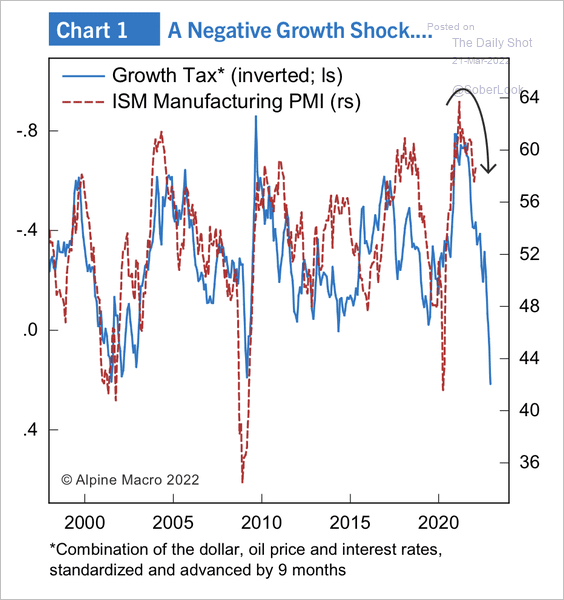 Source: Alpine Macro
——————–
4. Which sectors are facing the greatest supply-chain stress?
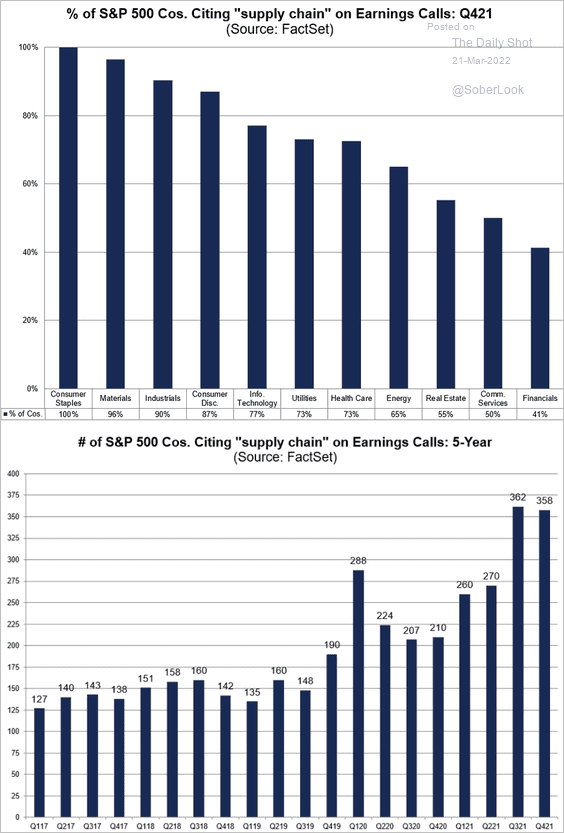 Source: @FactSet Read full article
5. US imports remained elevated last month.
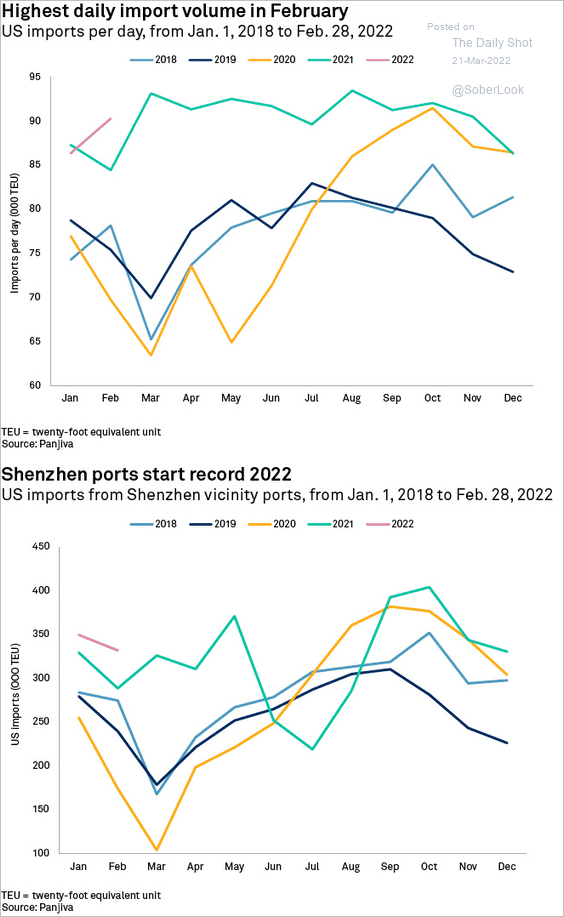 Source: S&P Global Market Intelligence
6. Consumer sentiment continues to deteriorate.
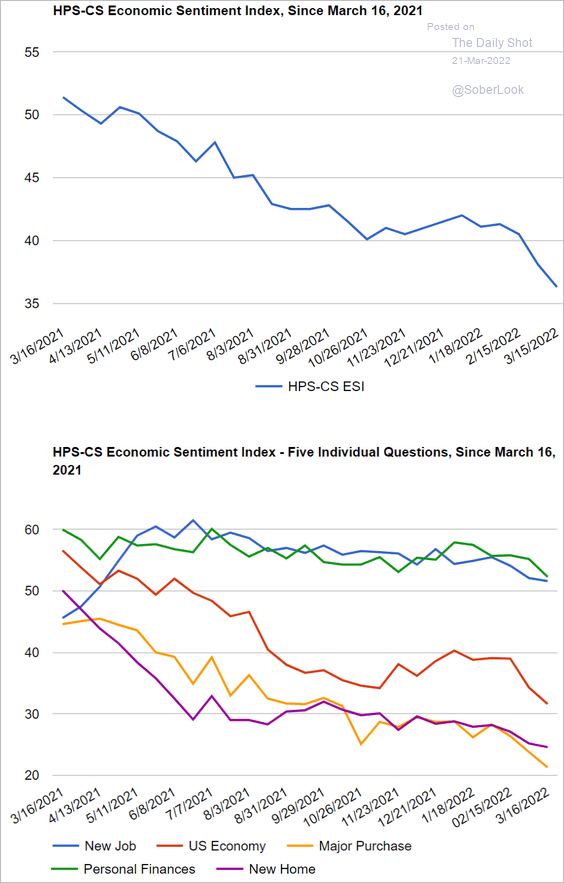 Source: @CivicScience
7. The rise in oil prices relative to disposable income is low compared with previous energy shocks.
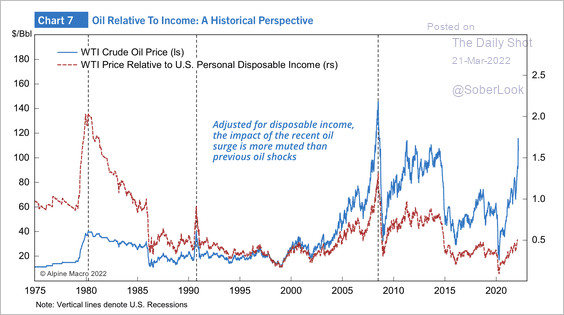 Source: Alpine Macro
Back to Index
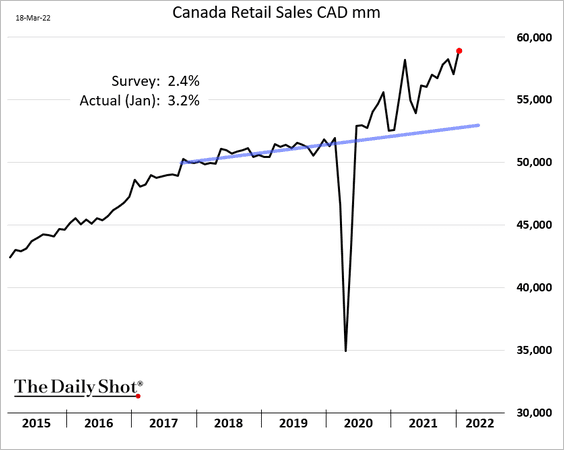
Canada
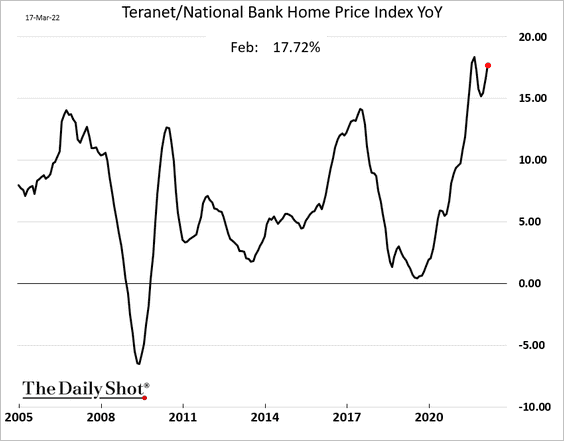
1. Home price appreciation accelerated again last month.
2. Retail sales surged in January, but we are likely to see a pullback in February.
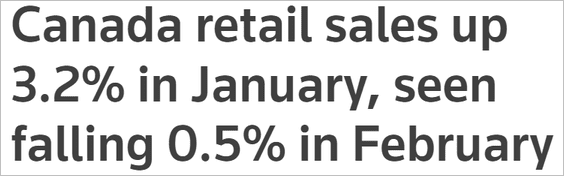 Source: Reuters Read full article
Back to Index
The United Kingdom
Home price appreciation increased further this month.
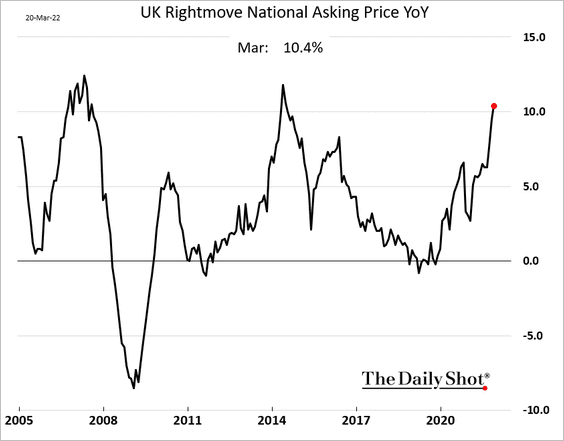
But demand appears to be slowing.
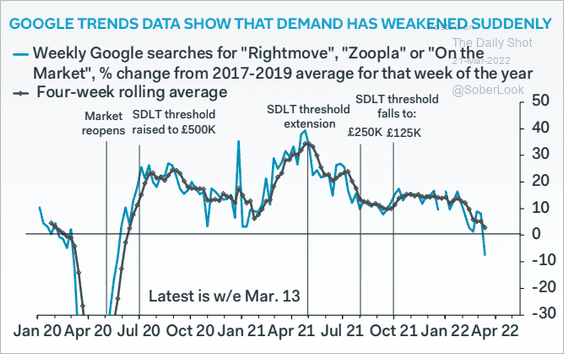 Source: Pantheon Macroeconomics
Back to Index
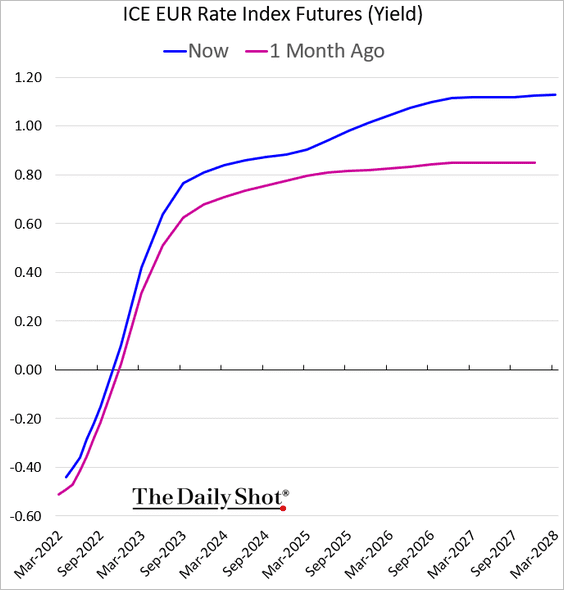
The Eurozone
1. The market is pricing in a steeper pace of ECB rate hikes.
2. Bond volatility surged this year.
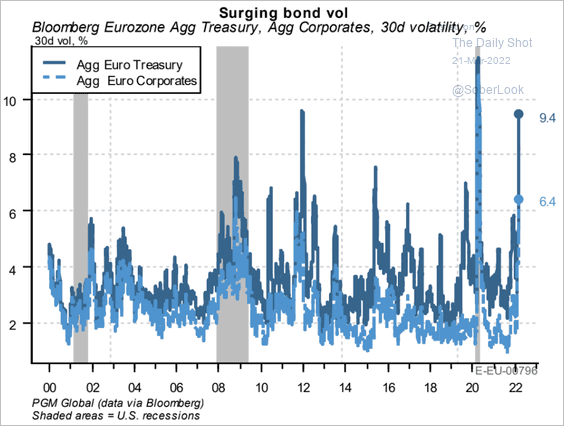 Source: PGM Global
3. Sentiment indicators point to weak business activity (PMI) readings ahead.
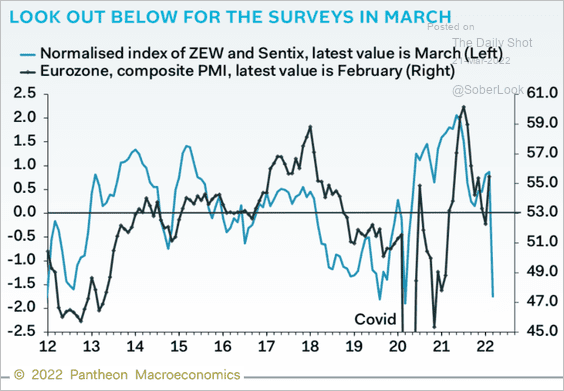 Source: Pantheon Macroeconomics
Back to Index
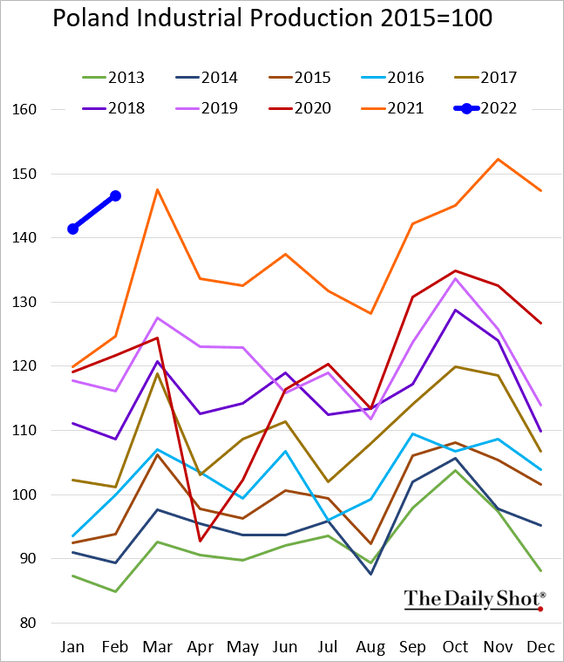
Europe
1. Poland’s industrial output was very strong in February.
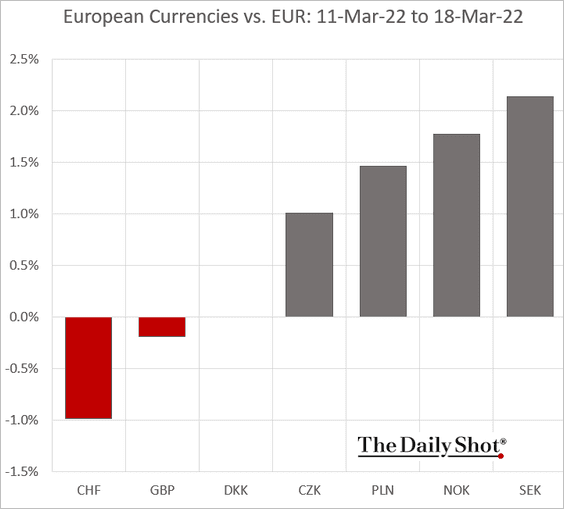
2. Risk appetite returned into the currency markets last week.
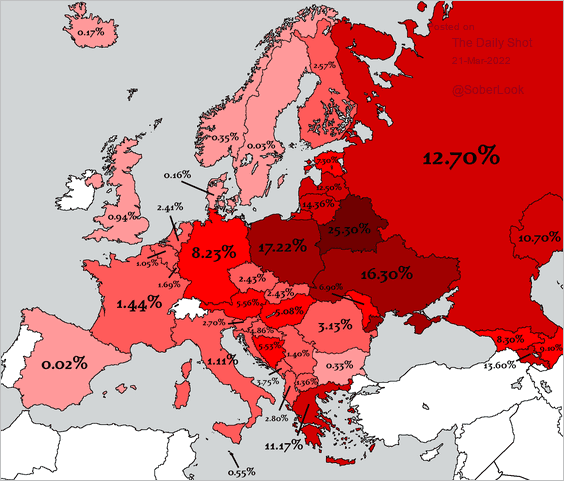
3. How much do EU countries spend on health?
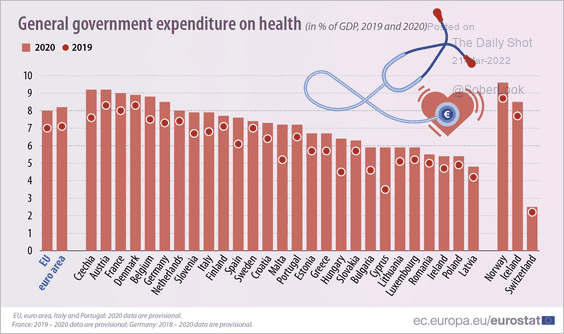 Source: Eurostat Read full article
Back to Index
Asia – Pacific
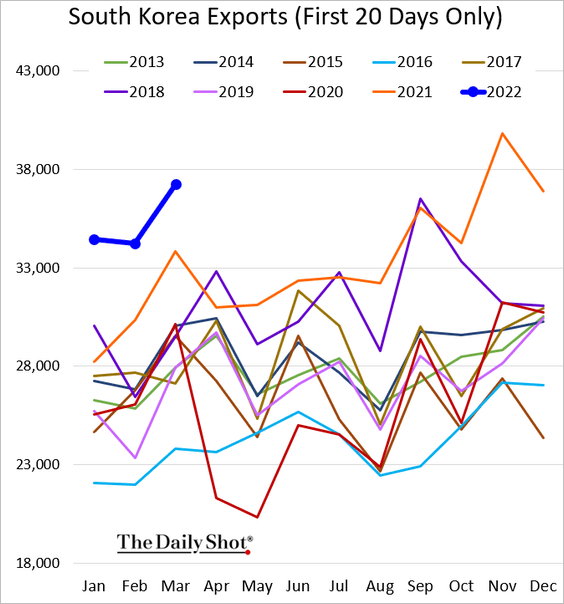
1. South Korean exports held up well this month.
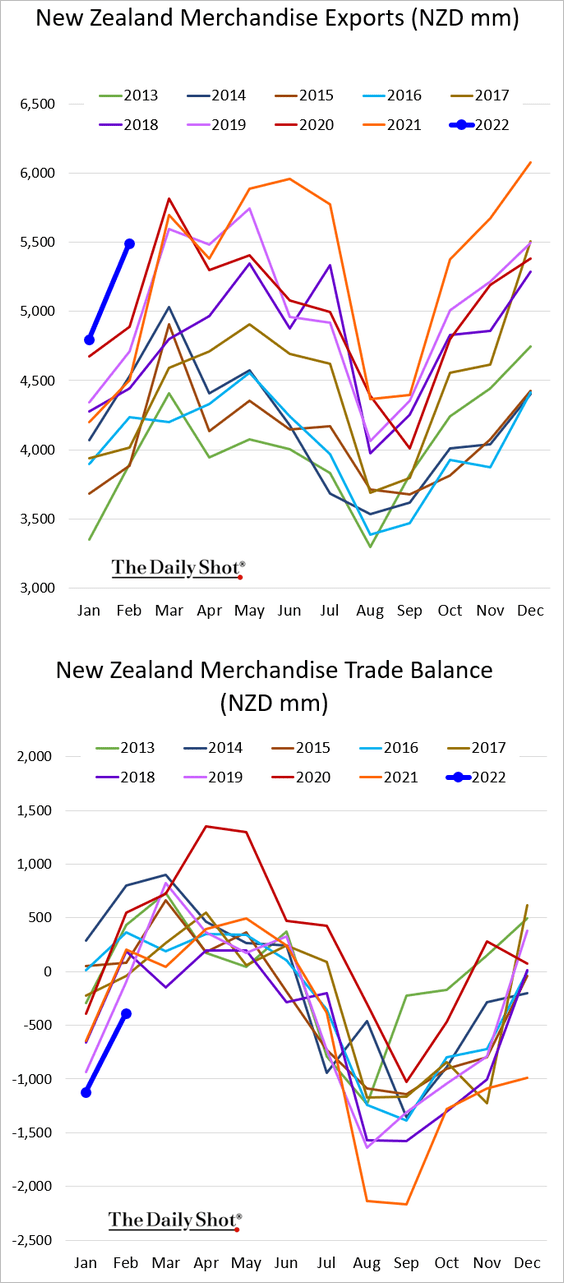
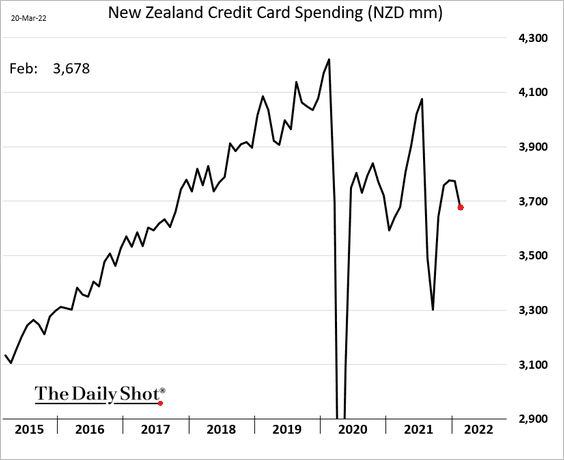
2. New Zealand’s exports remain at multi-year highs, but the trade deficit persists.
New Zealand’s credit card spending declined in February.
Back to Index
China
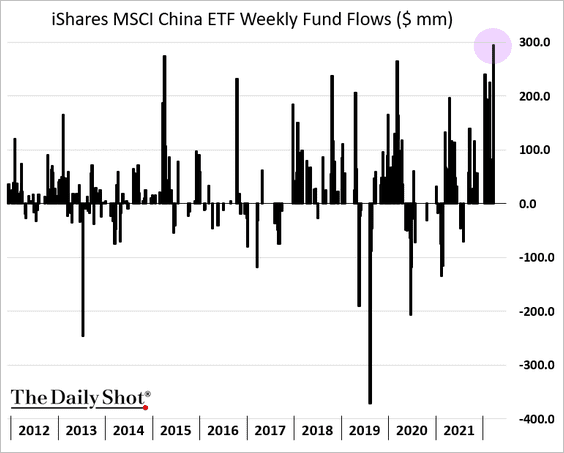
1. Equity fund flows picked up last week.
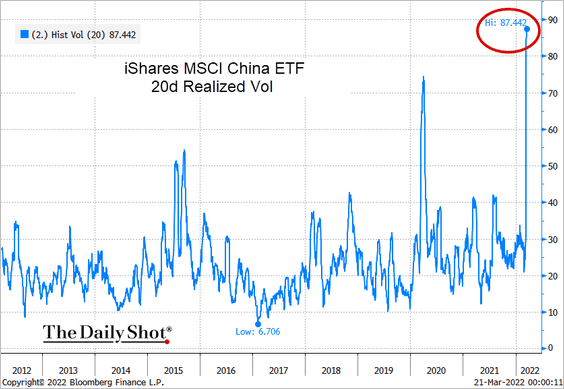
2. Equity volatility surged over the past month.
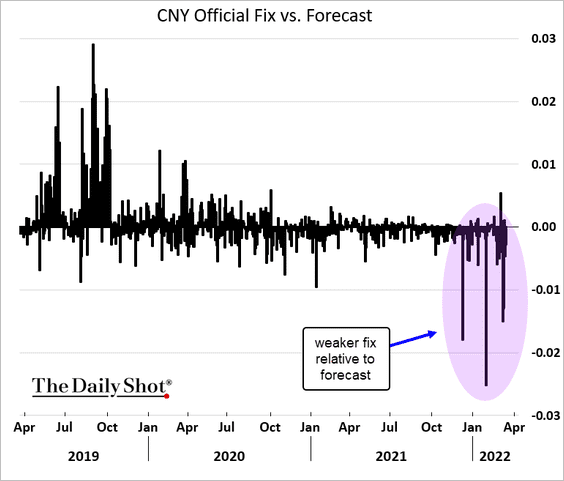
3. Beijing has been signaling a weaker bias for the renminbi.
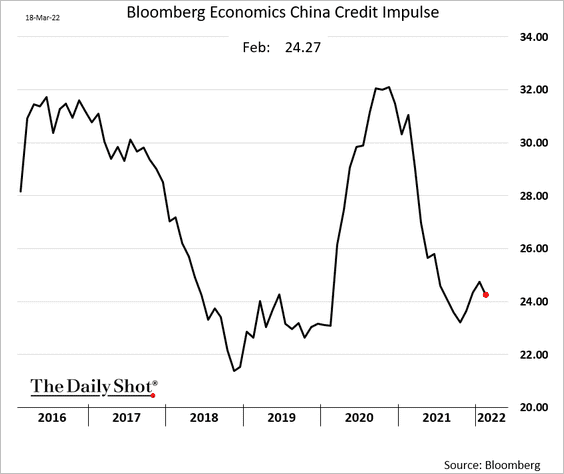
4. The credit impulse weakened last month.
5. China appears to be self-sufficient in key grains, which should contain upward price pressure.
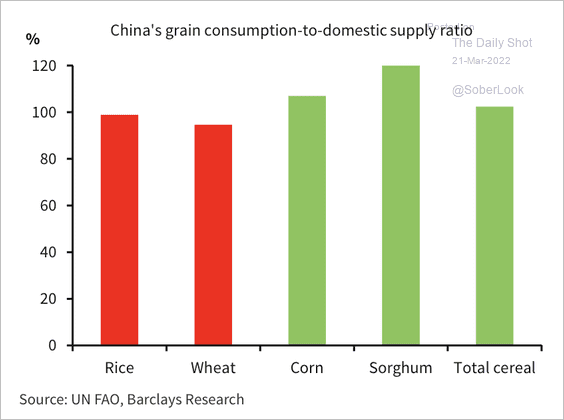 Source: Barclays Research
Ukraine accounts for a large share of corn imports, mostly used for pig feed. Also, Canada and Russia are top fertilizer suppliers to China.
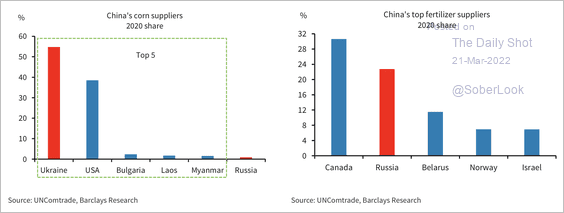 Source: Barclays Research
Back to Index
Emerging Markets
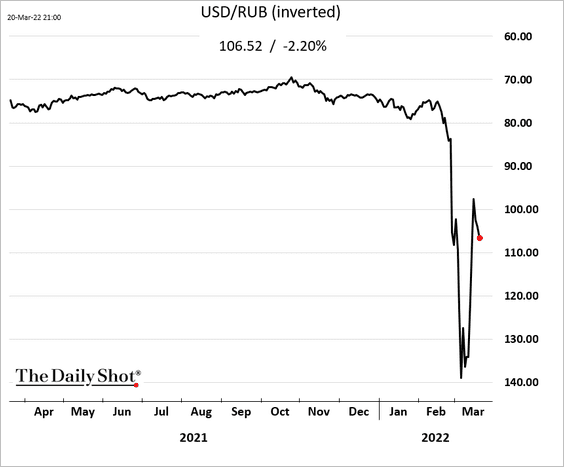
1. The ruble rebounded last week as Russia made a payment on its US-dollar bond.
• How high will Russia’s inflation get?
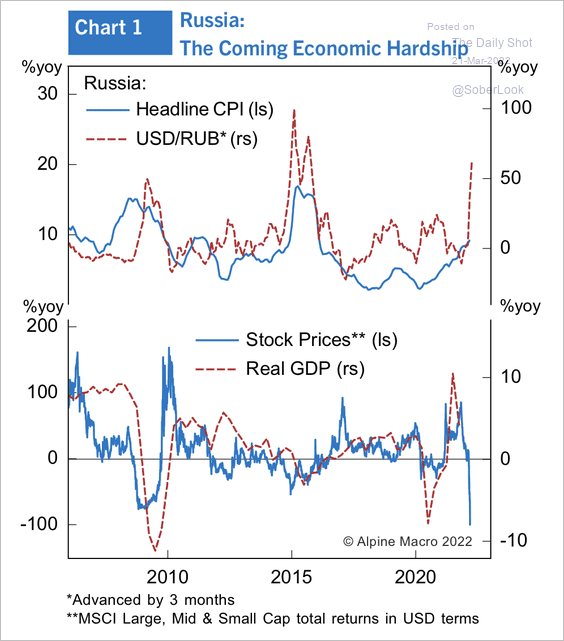 Source: Alpine Macro
• How many people will leave Russia this year?
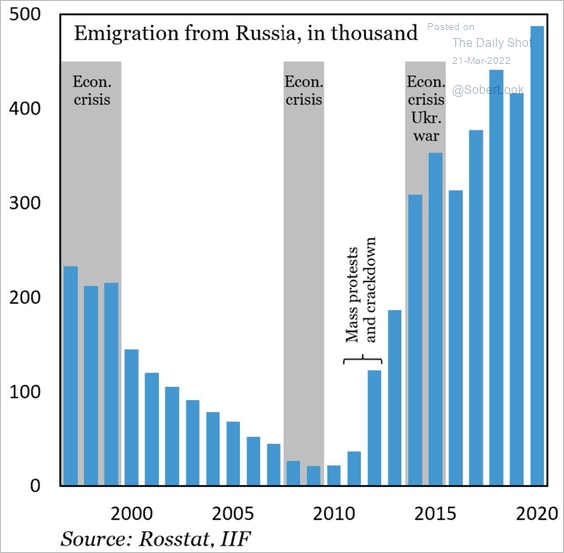 Source: IIF; @b_judah
——————–
2. LatAm equity markets have been outperforming, with earnings expectations pushing higher (2nd chart).
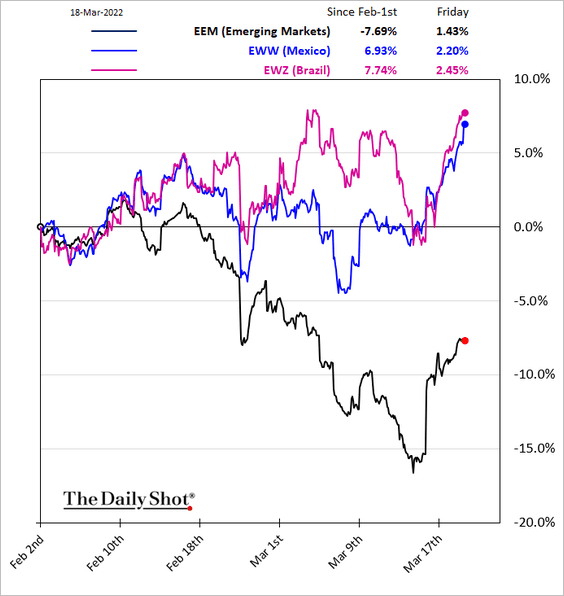
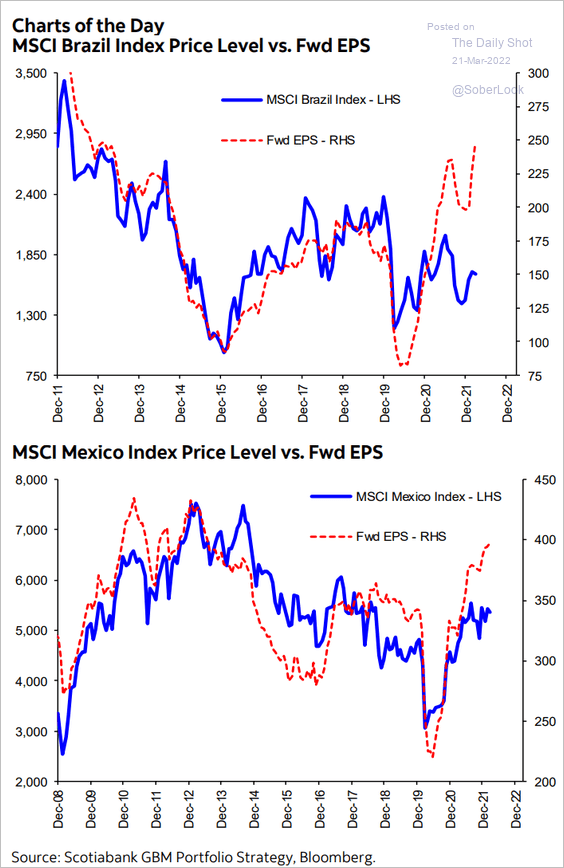 Source: Hugo Ste-Marie, Portfolio & Quantitative Strategy Global Equity Research, Scotia Capital
——————–
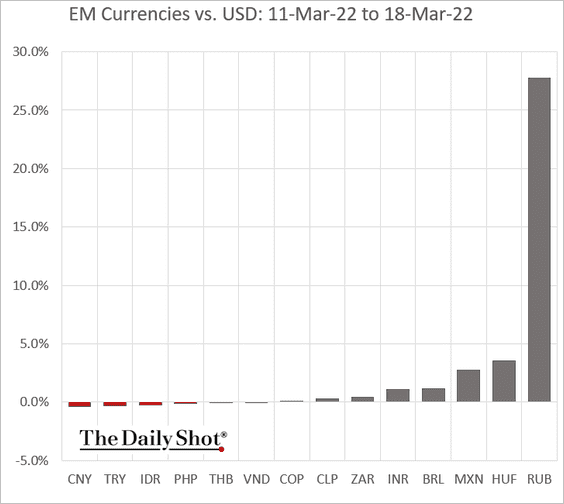
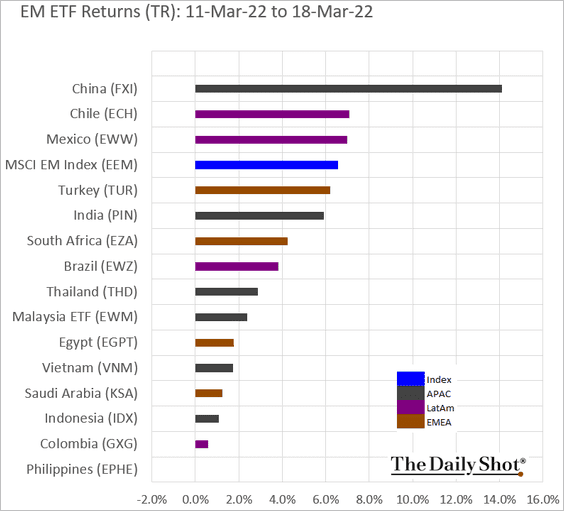
3. This chart shows last week’s EM ETF performance.
Back to Index
Cryptocurrency
1. Ether (ETH) has outperformed other large cryptos over the past month.
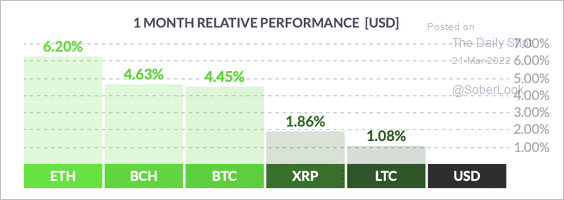 Source: FinViz
2. The ETH/BTC price ratio is approaching resistance.
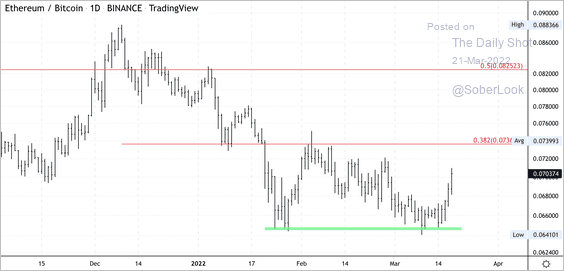 Source: CoinDesk Read full article
3. Total transaction fees on the Ethereum network have declined this year, which means miners are paid less. Lower demand could also stem from declining interest in NFTs, which are minted and traded on Ethereum.
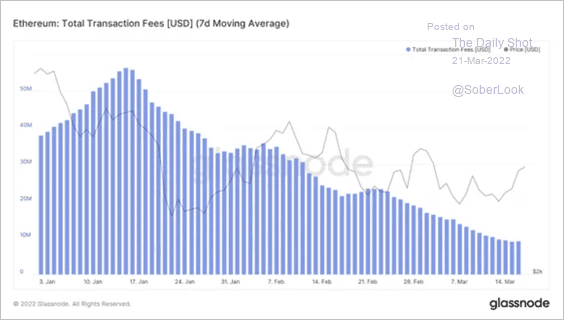 Source: @glassnode
4. ApeCoin rebounded partially after an 80% price crash on Thursday.
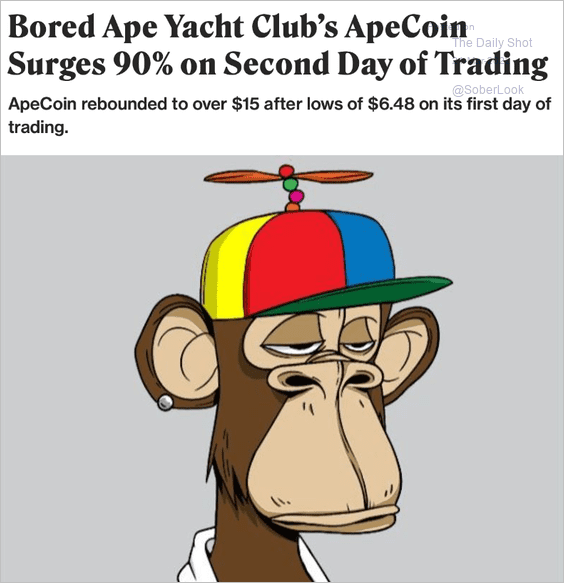 Source: CoinDesk Read full article
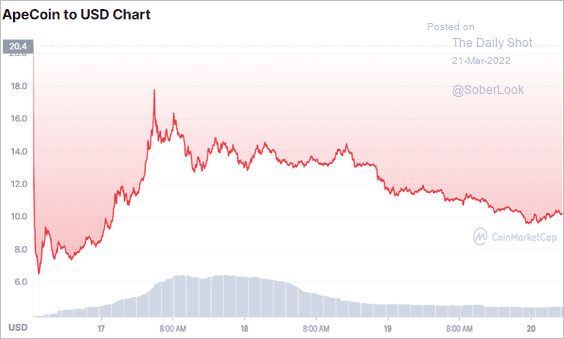 Source: CoinMarketCap
Back to Index
Commodities
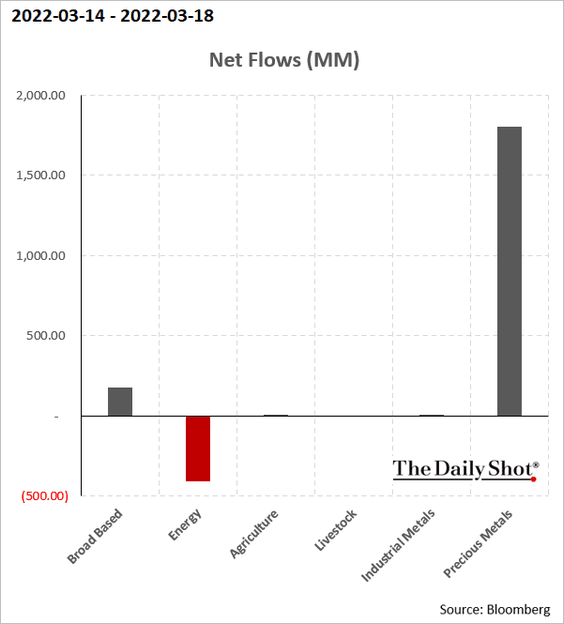
1. Precious metals ETFs continue to enjoy strong inflows.
2. European steel prices are soaring.
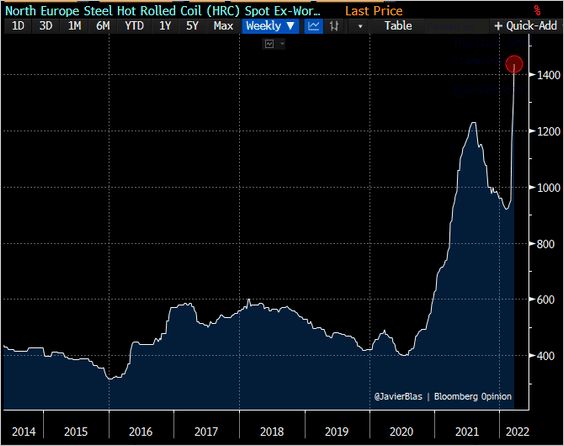 Source: @JavierBlas
3. Who exports vegetable oils?
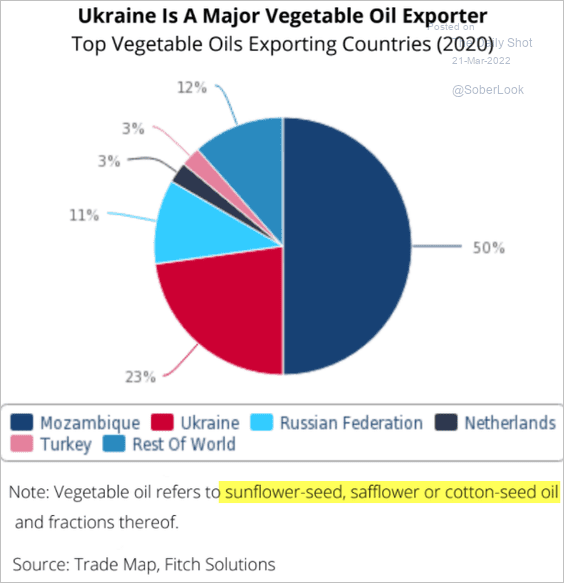 Source: Fitch Solutions Macro Research
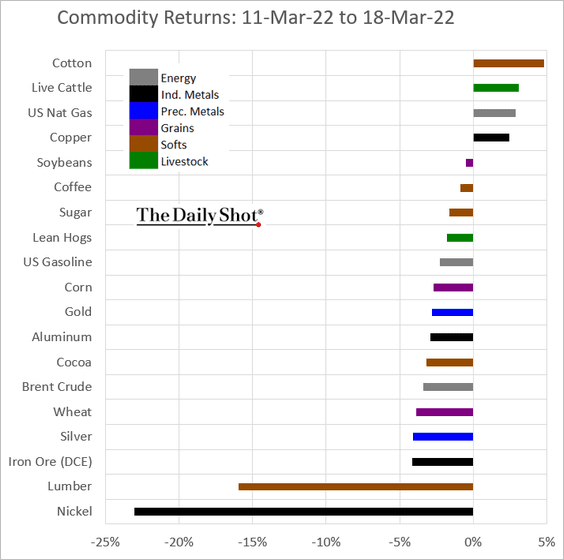
4. Commodities pulled back from the highs last week, with nickel leading the way.
Back to Index
Energy
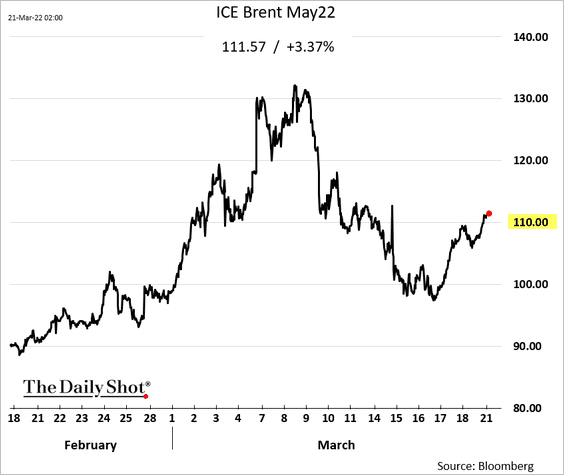
1. Brent crude is back above $110/bbl, putting some downward pressure on equities.
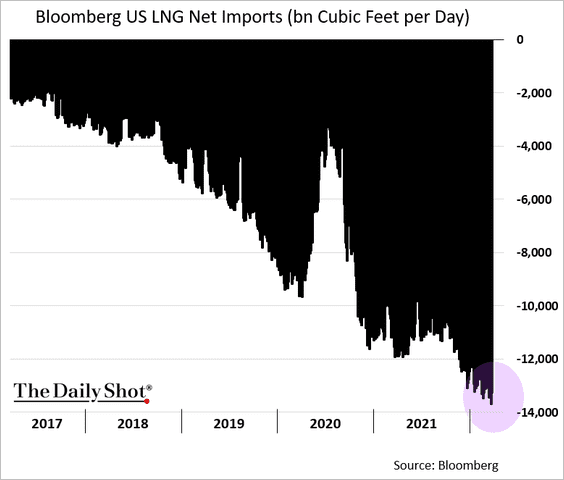
2. US LNG exports continue to break records.
3. US gasoline demand has been rising despite higher prices.
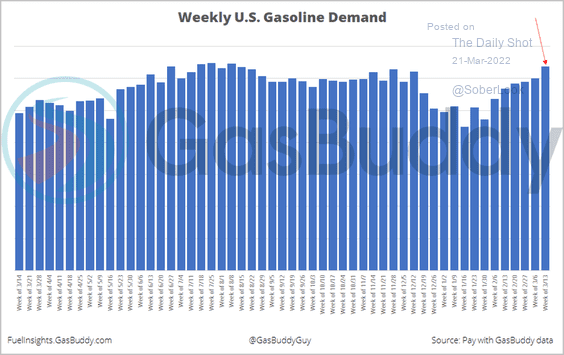 Source: @GasBuddyGuy
Back to Index
Equities
1. Global equities had a good week.
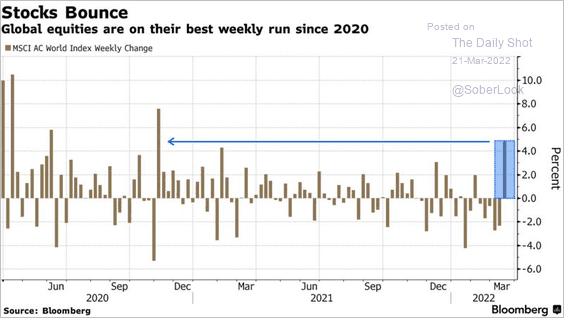 Source: @markets Read full article
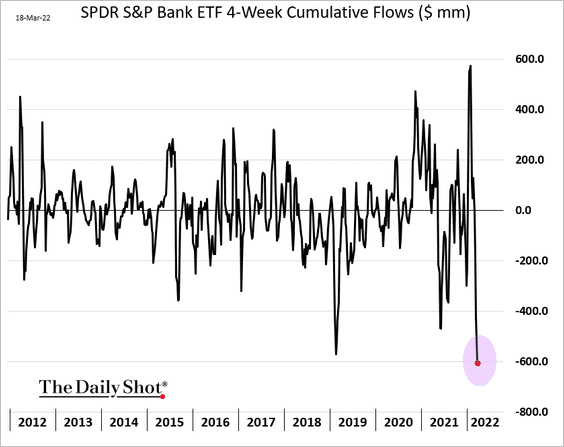
2. Equity ETFs, especially large caps, saw substantial inflows last week.
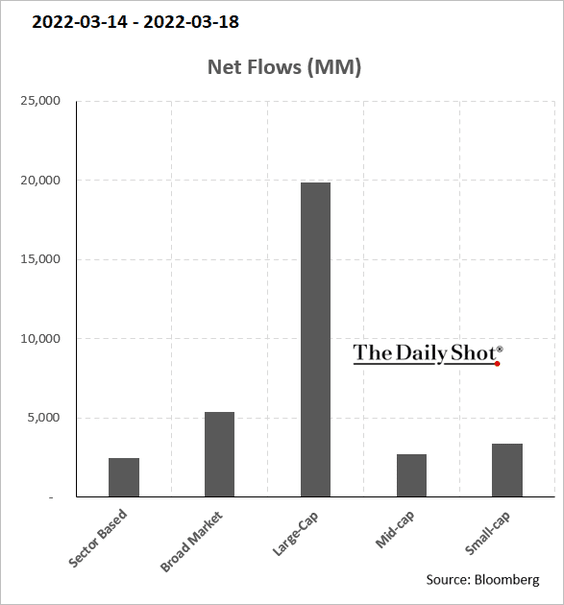
The largest bank-focused ETF experienced substantial outflows over the past month.
——————–
3. US companies with foreign affiliates have significant exposure to Europe.
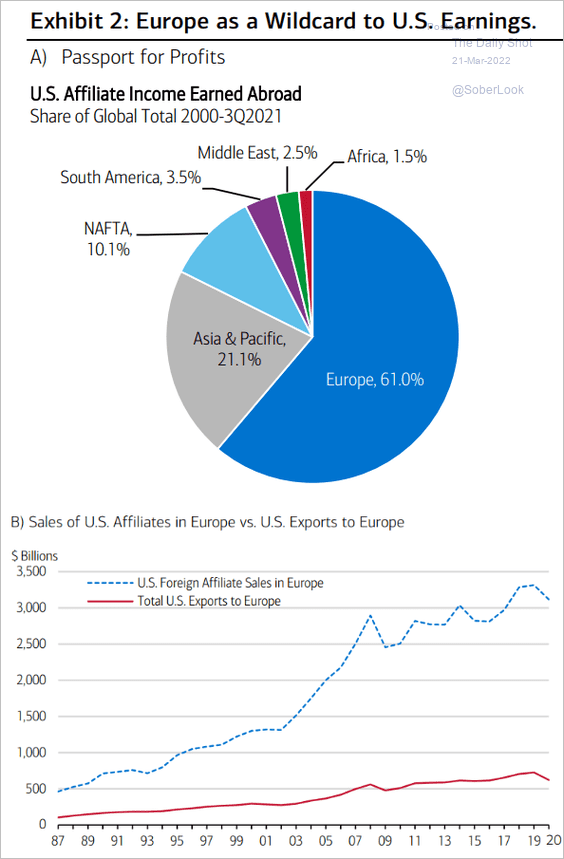 Source: Merrill Lynch
4. Fund managers expect profits to slump.
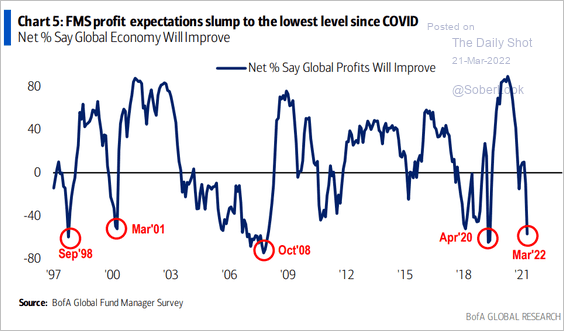 Source: BofA Global Research
5. The forward P/E of 18x was the recent support level for the S&P 500. Will 20x end up being resistance for the index?
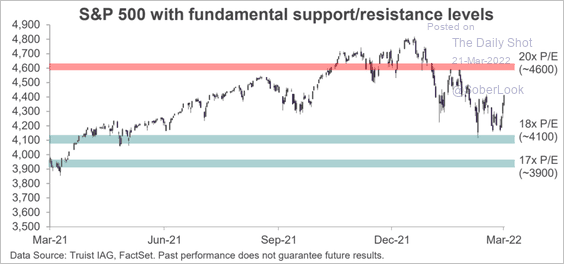 Source: Truist Advisory Services
6. The S&P 500’s equity risk premium remains elevated, albeit below the post-financial crisis average.
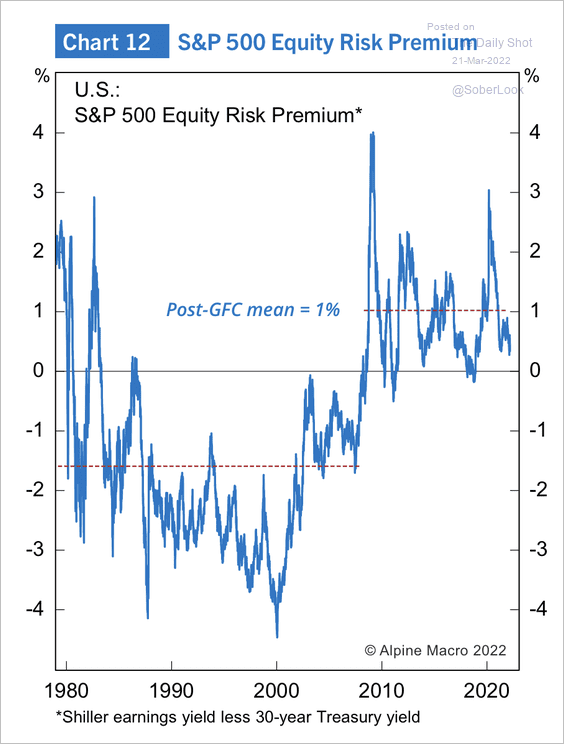 Source: Alpine Macro
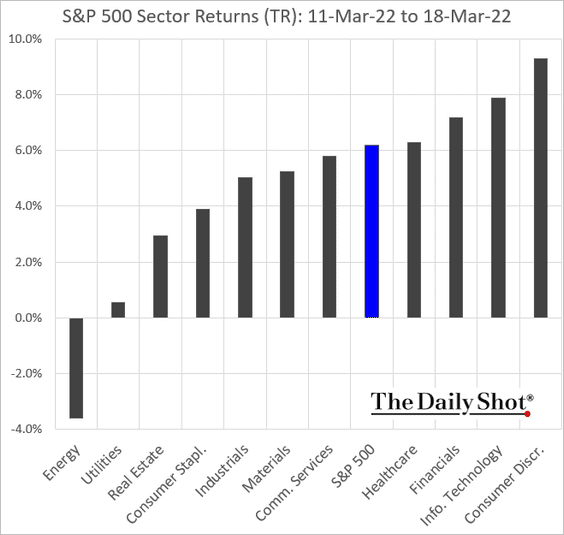
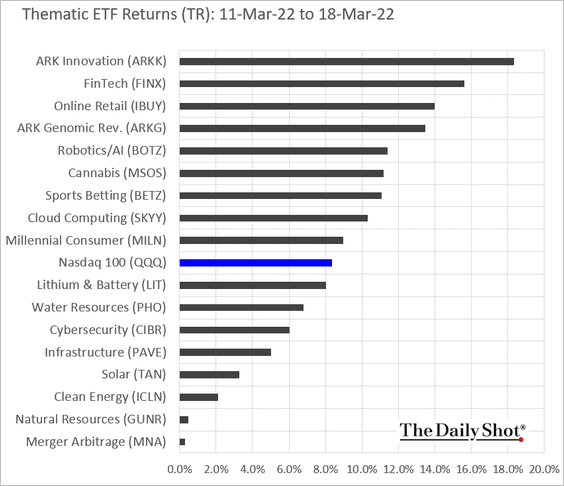
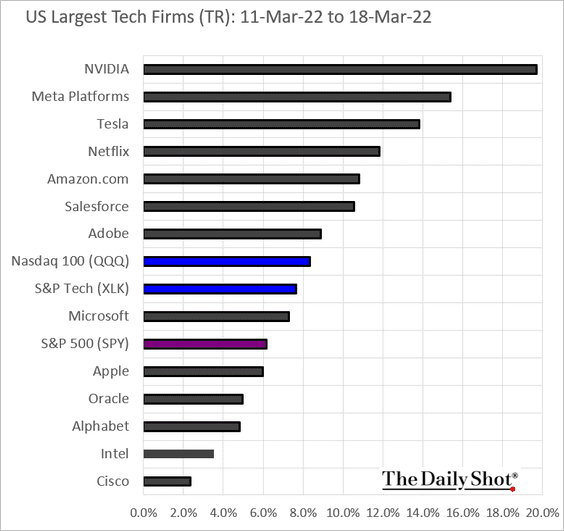
7. Next, let’s take a look at last week’s performance data.
• Sectors:
• Equity factors:

• Thematic ETFs:
• The largest tech firms:
Back to Index
Alternatives:
1. Here is a look at Y Combinator’s support of startups in Latin America over the past nine years.
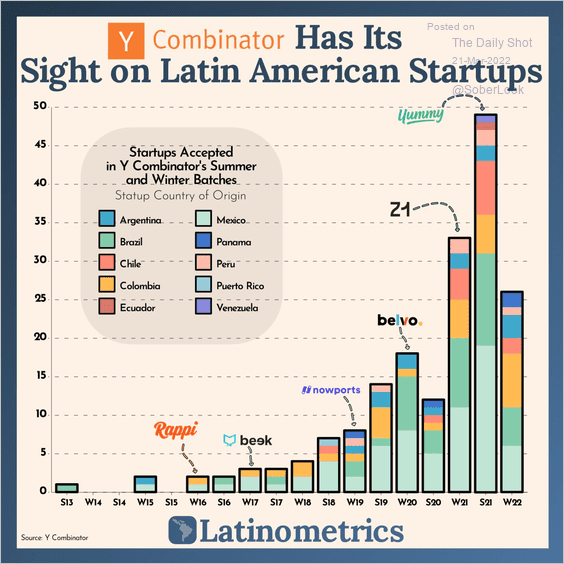 Source: @LatamData
2. Climate and sustainability-focused startups raised impressive amounts of capital last year.
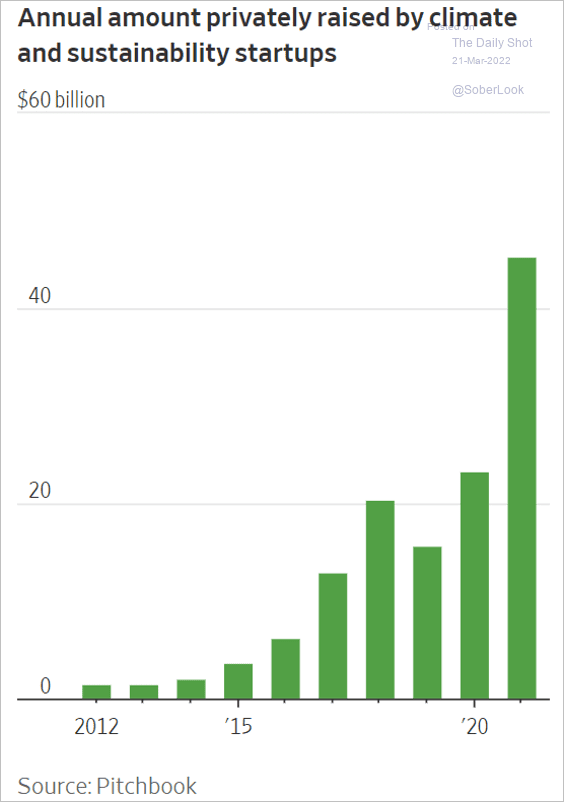 Source: @WSJ Read full article
3. Equity raise volumes in privacy and cybersecurity companies have increased substantially over the past decade.
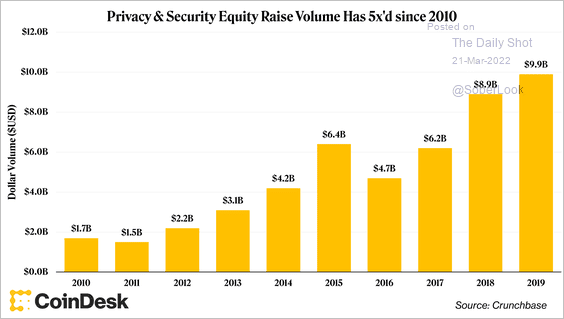 Source: CoinDesk Read full article
4. Wealth managers are adding more alternatives to their clients’ portfolios.
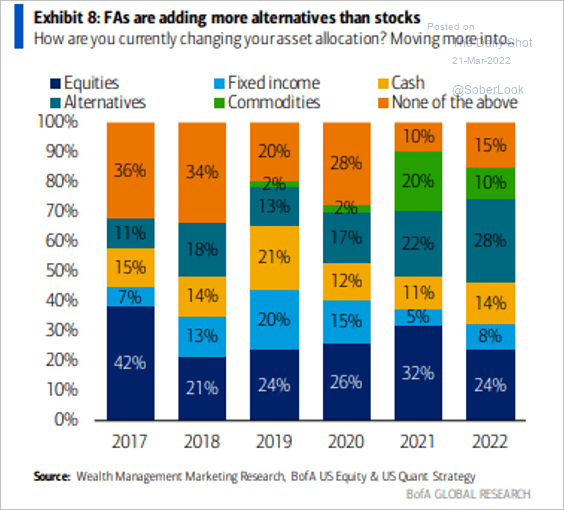 Source: BofA Global Research; @MikeZaccardi
Back to Index
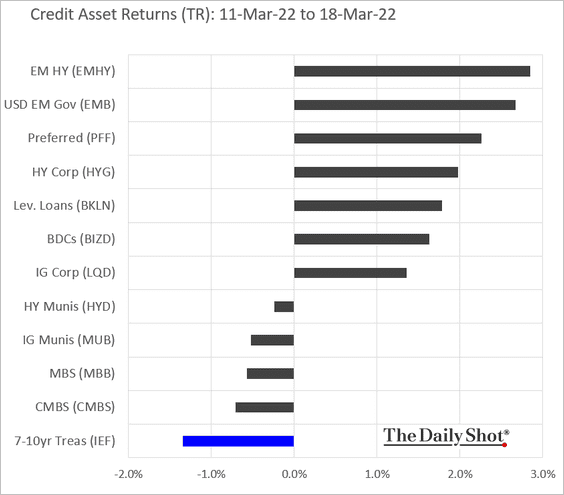
Credit
Rate-sensitive credit assets underperformed last week.
Back to Index
Rates
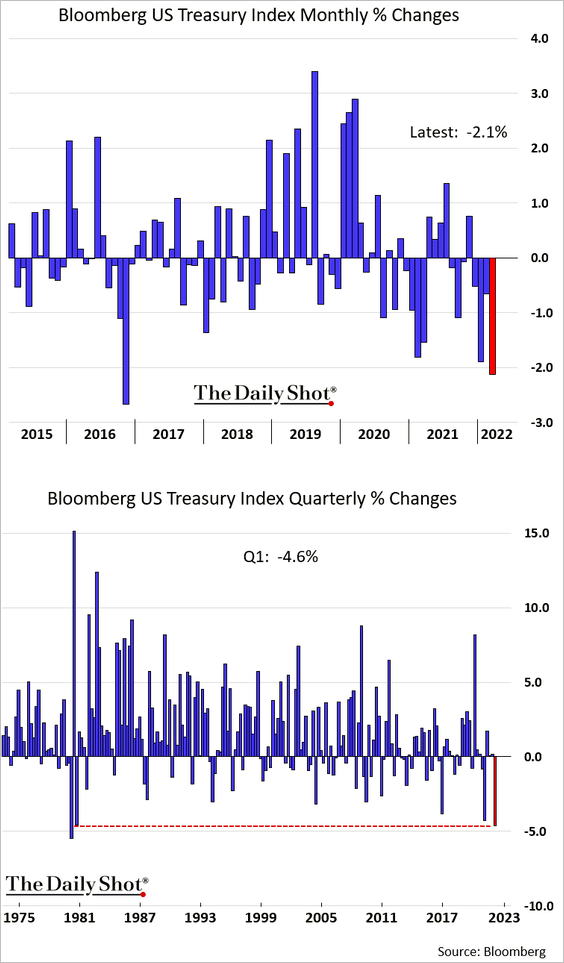
1. It’s been a rough month for Treasuries and a really bad quarter (2nd panel).
2. This chart shows the relationship between US real yields and crude oil.
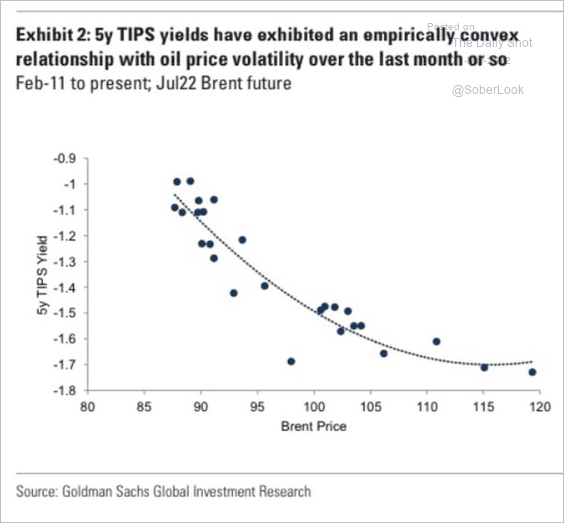 Source: Goldman Sachs
Back to Index
Global Developments
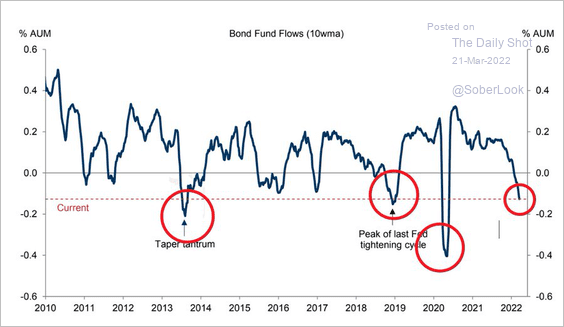
1. Fixed-income funds have been experiencing outflows.
 Source: EPFR; @parrmenidies
2. Below is the number of countries with high dependency on Ukraine and Russia.
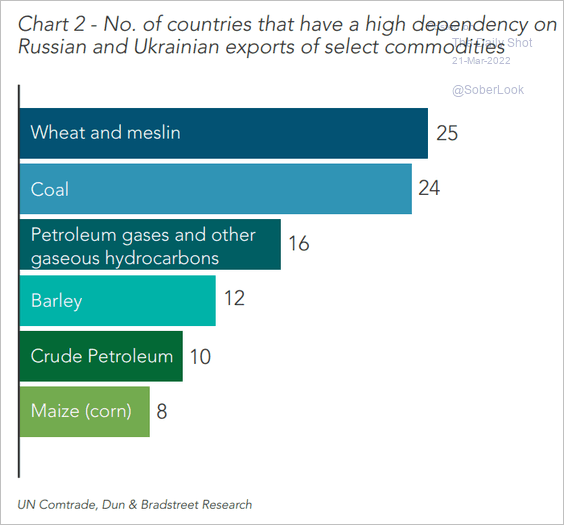 Source: Dun & Bradstreet
3. Here is a look at the oil and gas trade balance across developed and emerging countries (2 charts).
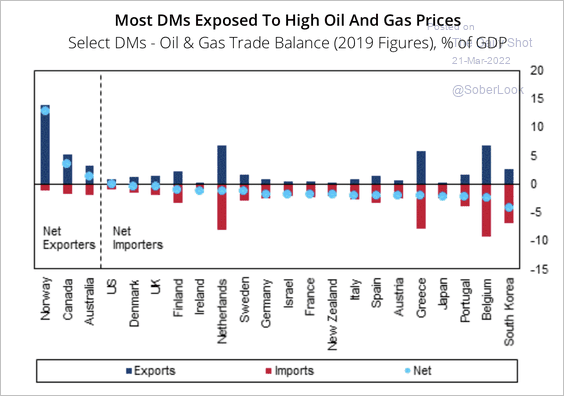 Source: Fitch Solutions Macro Research
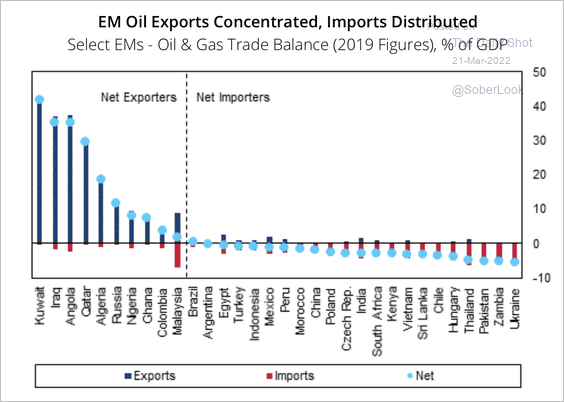 Source: Fitch Solutions Macro Research
——————–
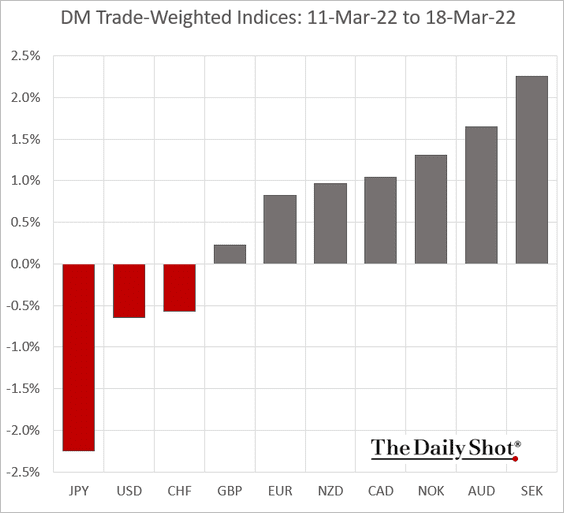
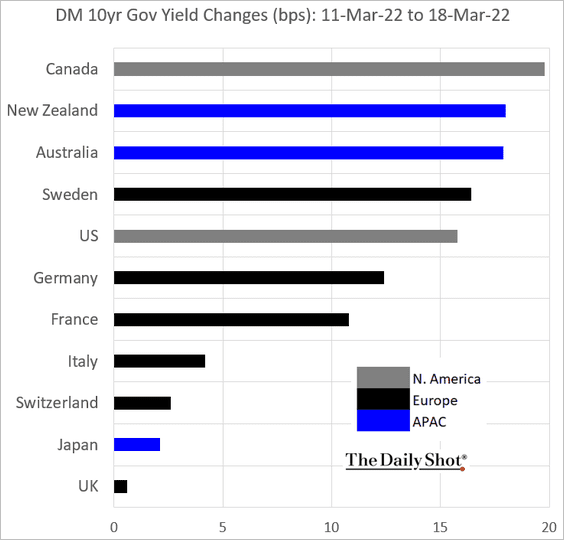
4. Next, we have last week’s performance data for advanced economies.
• Currencies (trade-weighted index):
• 10yr yields:
——————–
Food for Thought
1. Largest smartphone markets:
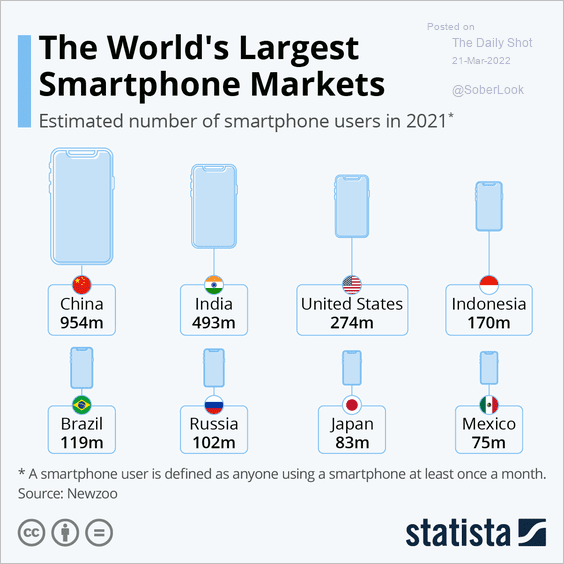 Source: Statista
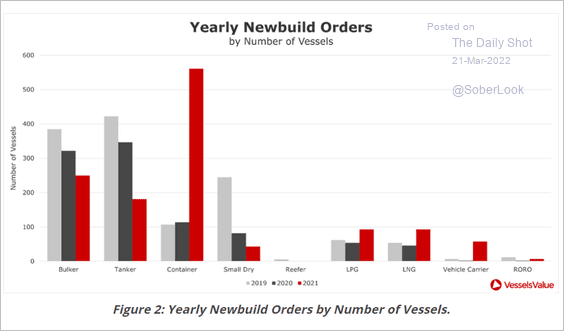
2. Vessel builders:
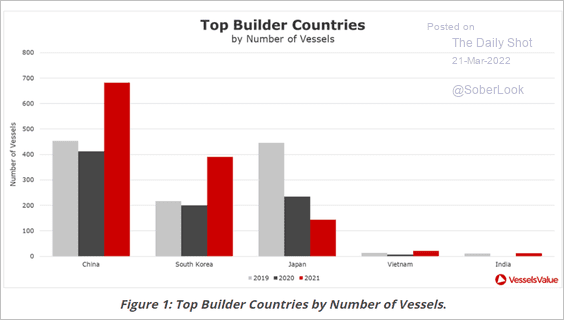 Source: VesselsValue Read full article
• Vessel buyers:
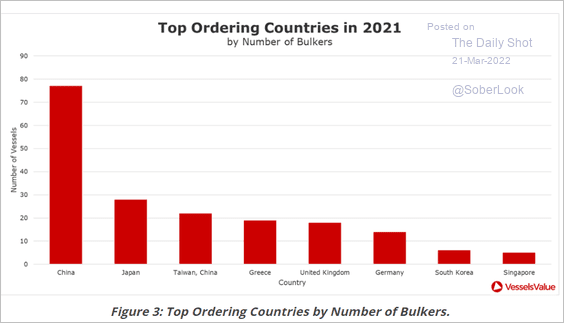 Source: VesselsValue Read full article
• Vessel demand:
 Source: VesselsValue Read full article
——————–
3. US median weekly checking account balances relative to 2019:
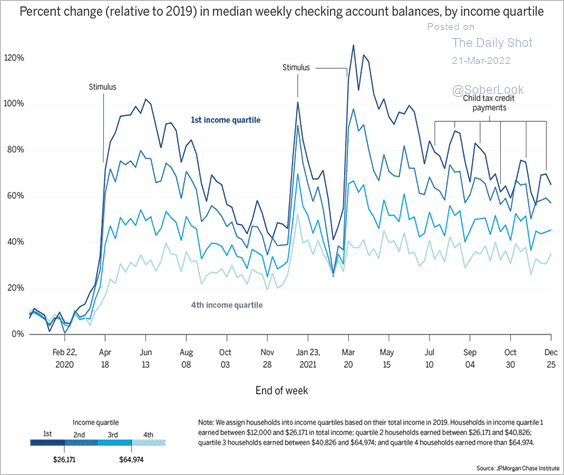 Source: JPMorgan Chase Institute
4. World population growth rate:
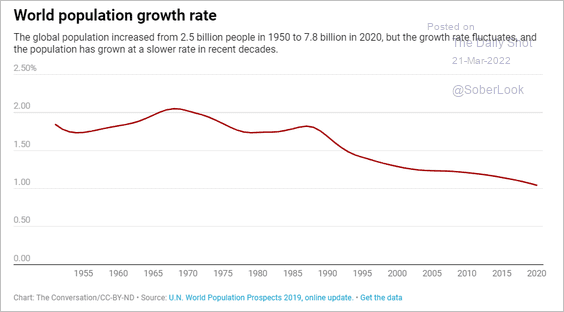 Source: The Conversation Read full article
5. Enrollment in state-funded pre-K programs:
 Source: Wells Fargo Securities
6. Ukrainians’ views on defeating Russia:
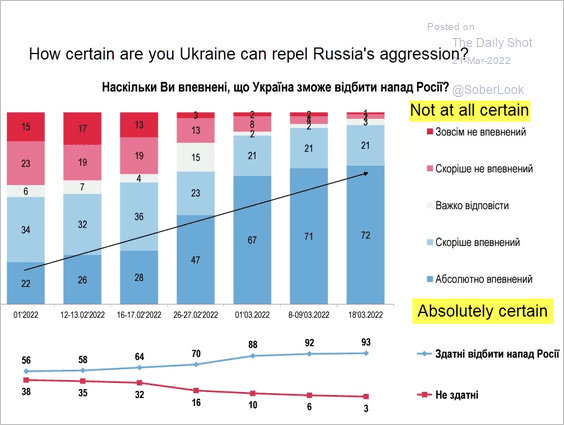 Source: @ukraine_world
7. US spending growth vs. health insurance enrollment growth:
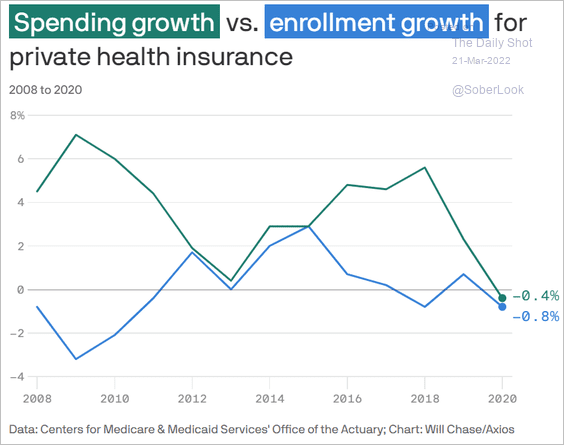 Source: @axios Read full article
8. US solar panel imports:
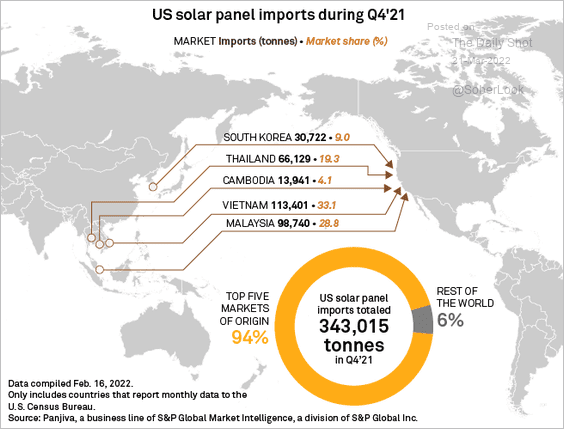 Source: S&P Global Market Intelligence
9. Share of the population killed in WW-II:
 Source: @tyggy
——————–
Back to Index