
The Daily Shot: 28-Mar-22
• The United States
• The United Kingdom
• The Eurozone
• Asia – Pacific
• China
• Emerging Markets
• Cryptocurrency
• Commodities
• Energy
• Equities
• Credit
• Rates
• Global Developments
• Food for Thought
The United States
1. The market continues to drive up rate expectations. Eight 25 bps hikes are now fully priced in (nine including the one this month). Could we get more?
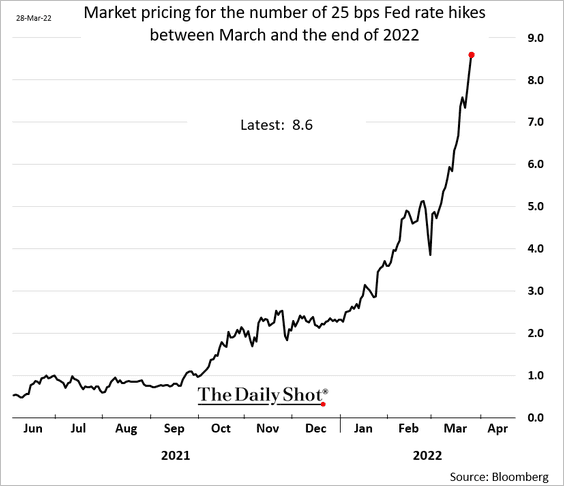
Of course, there aren’t eight additional FOMC meetings this year, which means we will get a few 50 bps hikes along the way.
 Source: @WSJ Read full article
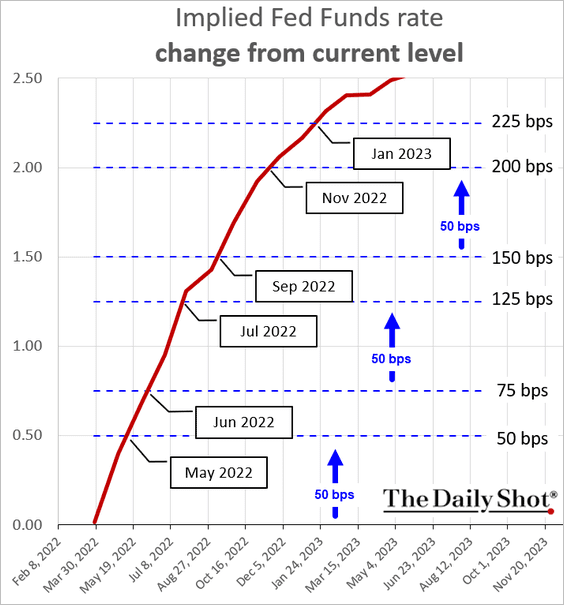
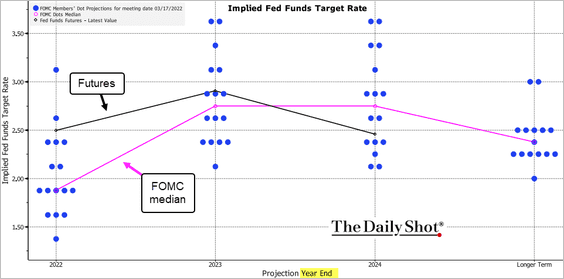
At this point, the market expectation for the end of 2022 is well above the FOMC’s dot plot.
 Source: @TheTerminal, Bloomberg Finance L.P.
——————–
2. The 2-year Treasury yield is headed for 2.5%.
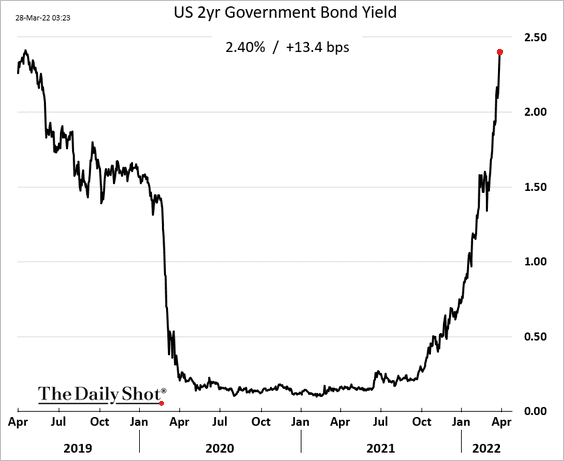
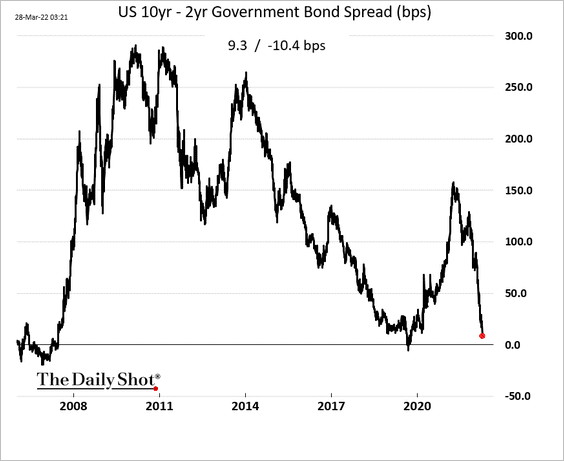
The 30yr – 5yr portion of the Treasury curve has inverted this morning for the first time since 2006.
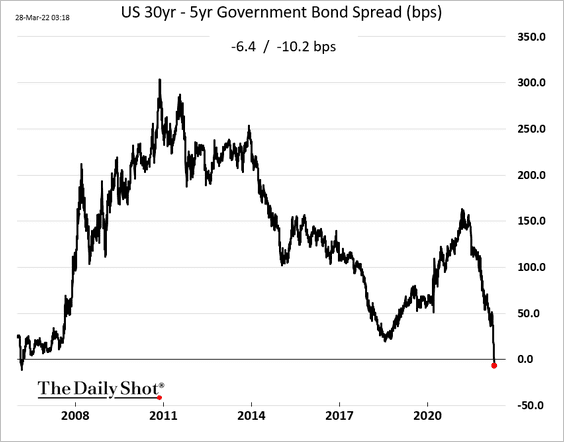
The 10yr – 2yr inversion is a few basis points away.
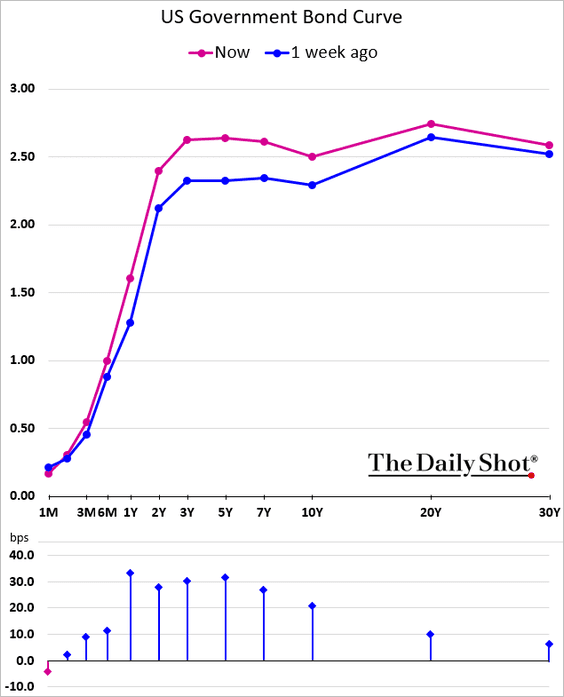
Here is the yield curve.
——————–
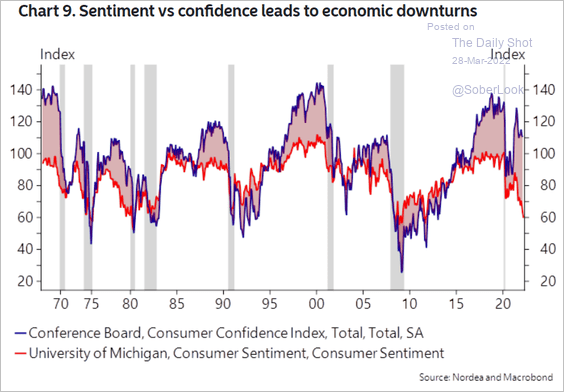
3. The updated U. Michigan consumer sentiment figures were worse than the earlier report.
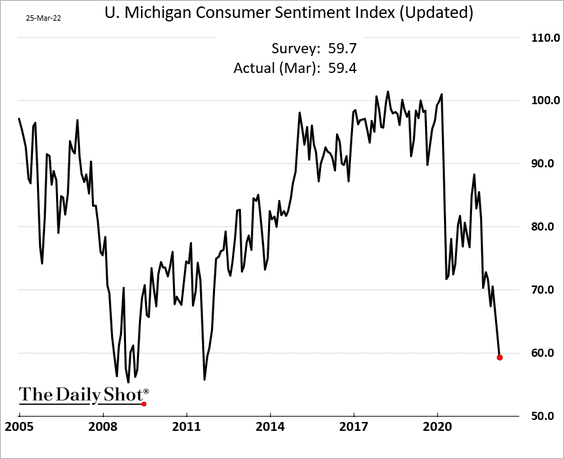
A sharp divergence between the U. Michigan’s and the Conference Board’s sentiment indicators tends to lead to economic downturns.
 Source: Nordea Markets
To put it another way, the U. Michigan weakness could indicate softer labor market dynamics ahead.
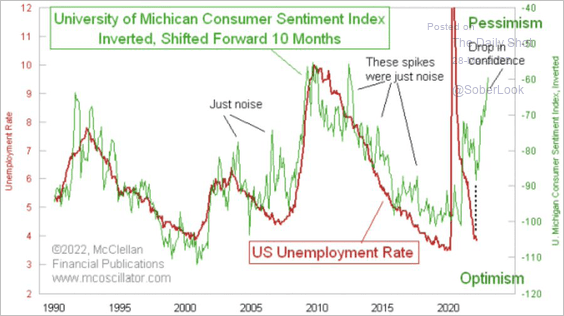 Source: @jessefelder Read full article
——————–
4. Next, we have some updates on the housing market.
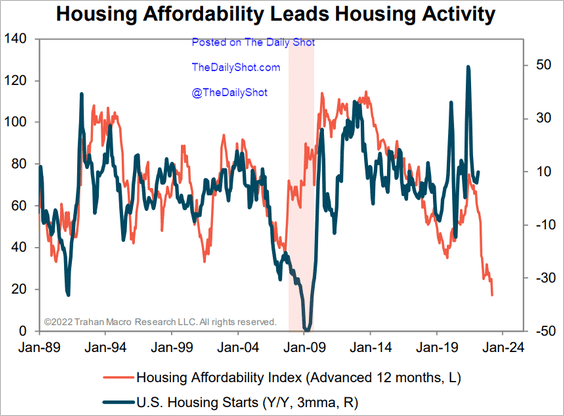
• Mortgage rates continue to surge with Treasury yields, …
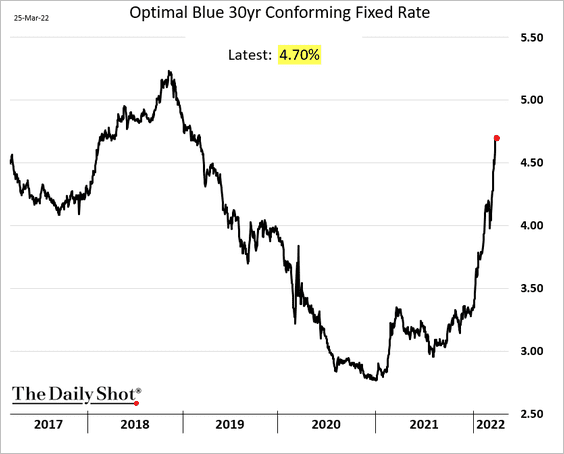
… which signals tougher times ahead for homebuilders, …
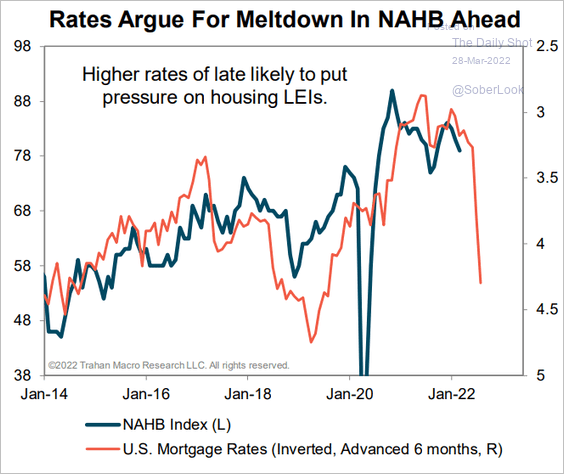 Source: Trahan Macro Research
… as affordability deteriorates (2 charts).
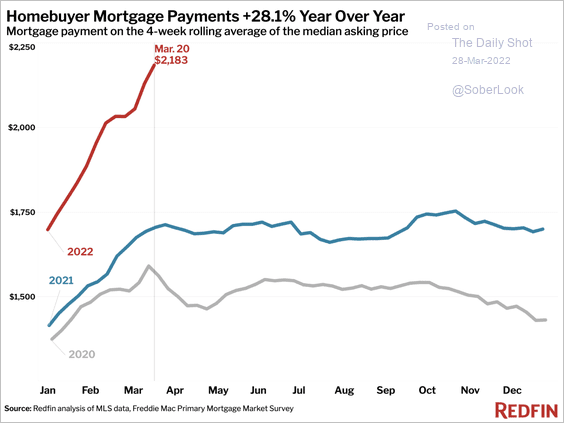 Source: Redfin
 Source: Trahan Macro Research
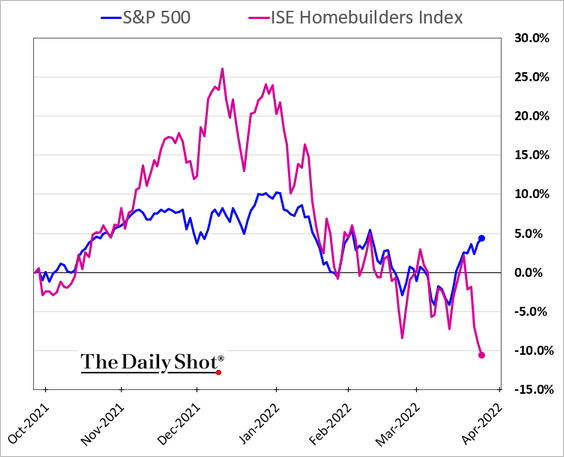
That’s why homebuilder shares have underperformed sharply.
• The spike in mortgage rates could have broader implications for the economy.
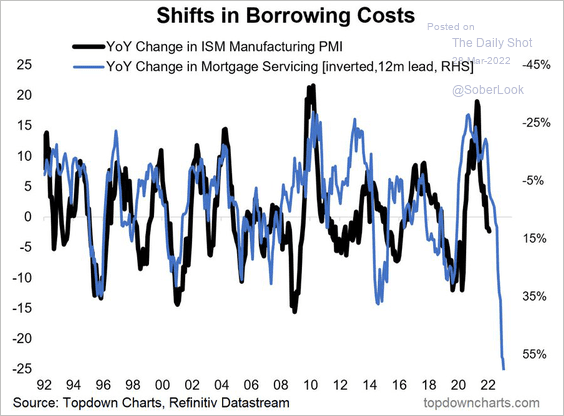 Source: @topdowncharts Read full article
• Pending home sales were softer than expected last month, …
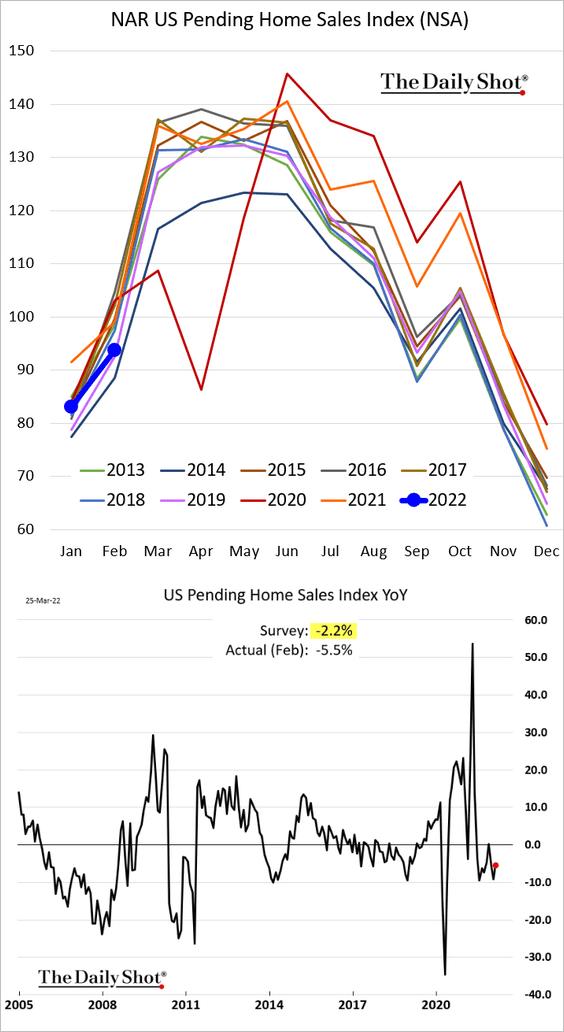
… which points to weaker existing home sales this month.
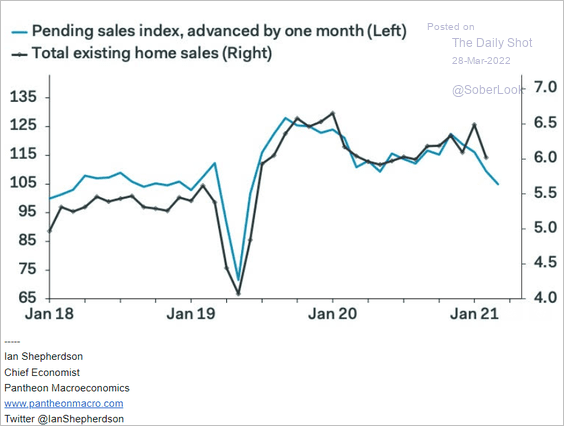 Source: Pantheon Macroeconomics
• Tight inventories could keep home prices from declining.
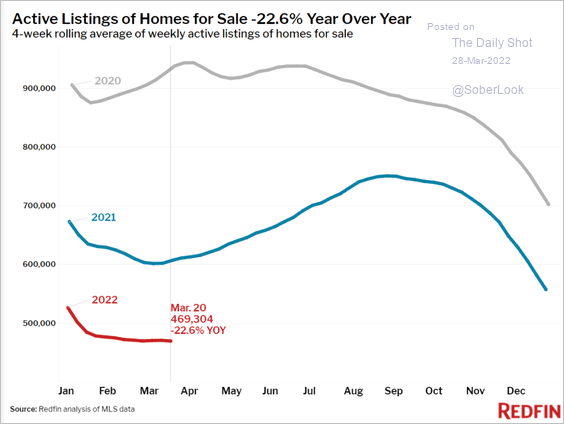 Source: Redfin
And homes are still selling quickly.
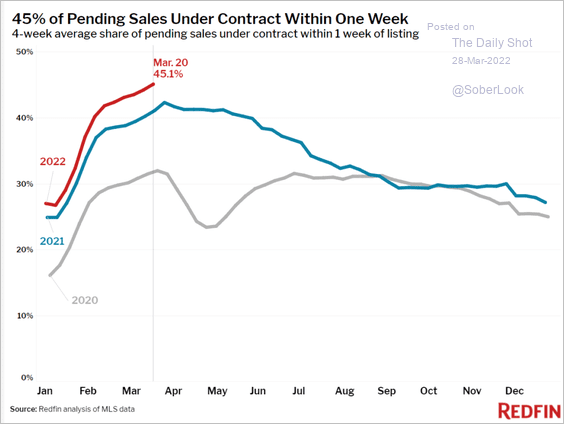 Source: Redfin
——————–
5. The share of household spending on food and energy is a long way off 1970s levels.
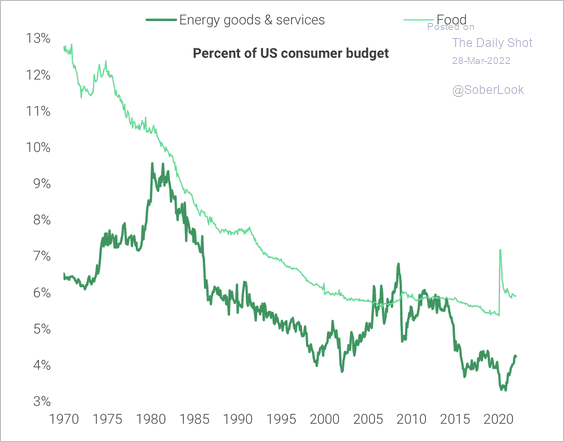 Source: TS Lombard
6. The spike in diesel prices is putting pressure on freight transportation companies.
![]() Source: @WSJ Read full article
Source: @WSJ Read full article
7. According to JP Morgan, near-term recession odds remain low. But their model shows a much higher probability three years out.
 Source: JP Morgan Research; @dlacalle_IA
8. Finally, this chart shows US business investment excluding tech-related spending (as a share of GDP).
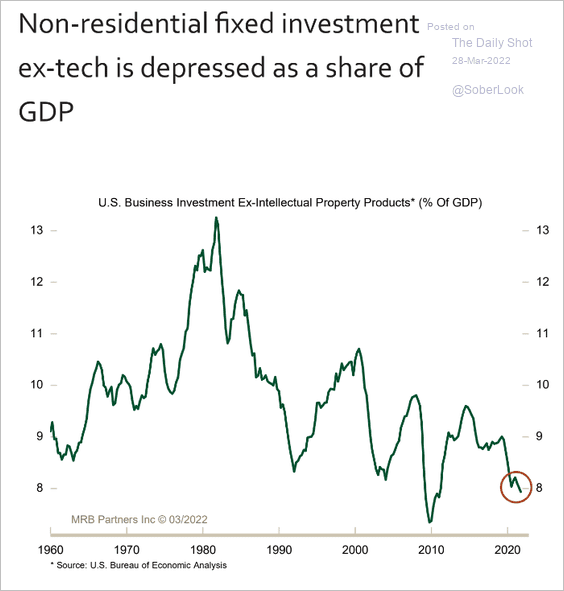 Source: MRB Partners
Back to Index
The United Kingdom
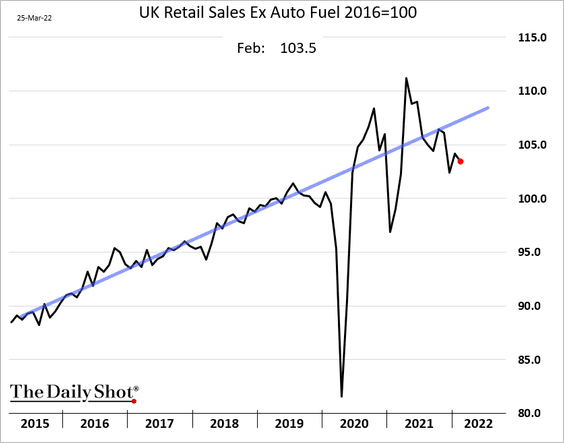
1. Retail sales were disappointing in February.
2. The UK missed out on the post-COVID trade rebound.
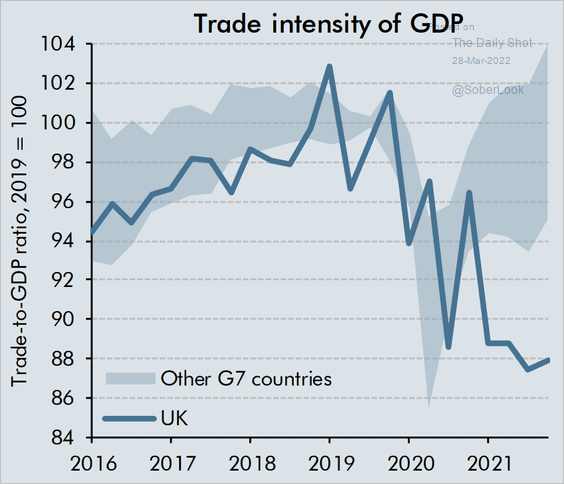 Source: OBR; h/t @russ_lynch Read full article
3. Tax burden has been climbing.
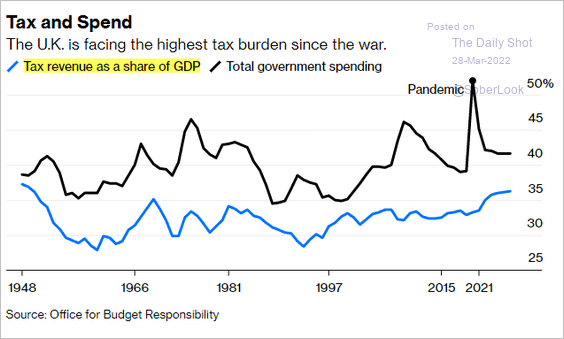 Source: @bopinion Read full article
4. This chart shows the composition of the UK money supply.
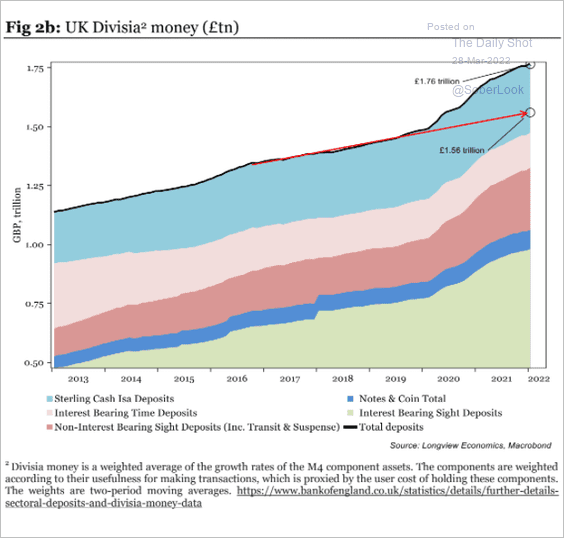 Source: Longview Economics
Back to Index
The Eurozone
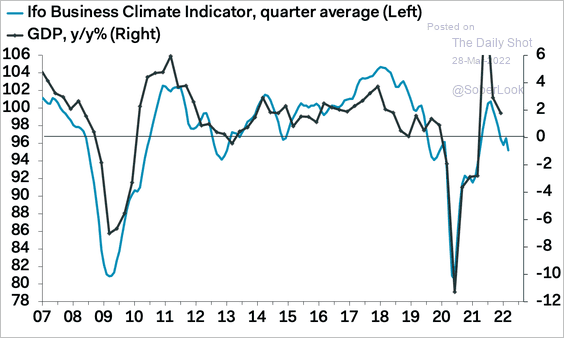
1. Germany’s Ifo business expectations index tumbled this month, …
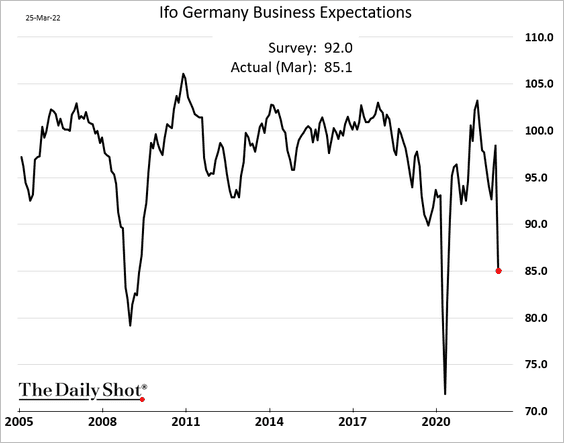
… with weakness across key sectors.
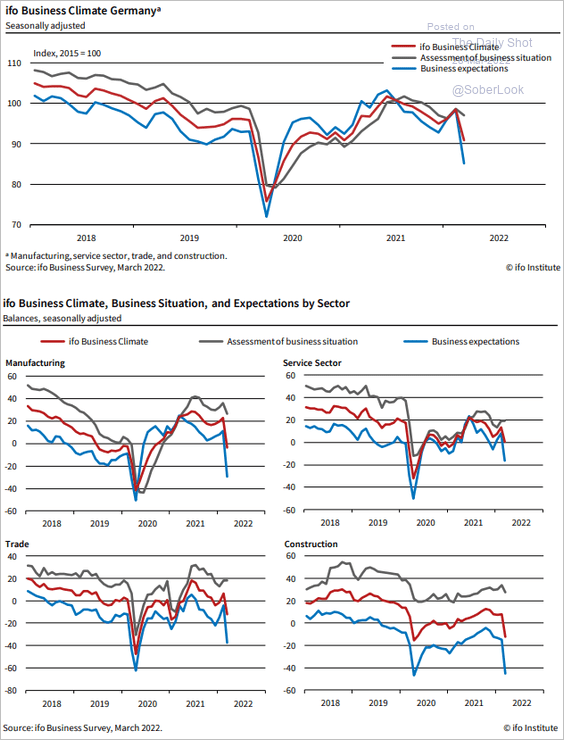 Source: ifo Institute
What does this mean for economic growth?
 Source: Pantheon Macroeconomics
——————–
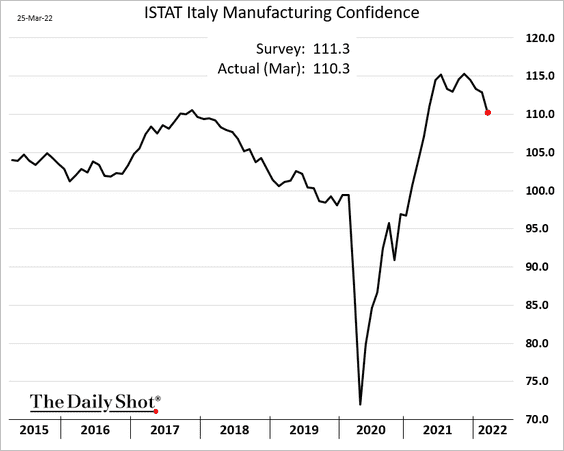
2. Italian consumer confidence has deteriorated sharply.
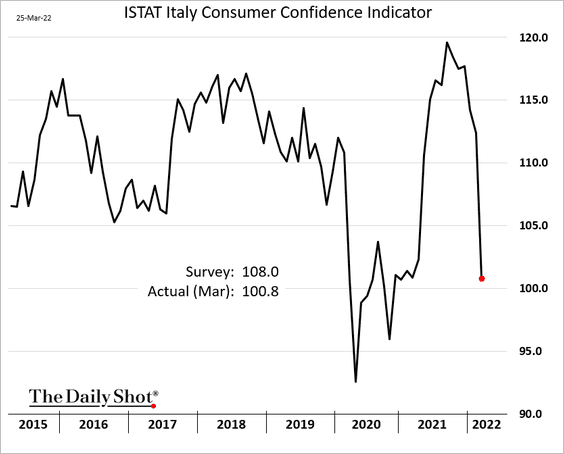
Manufacturing confidence is also softer but still well above pre-COVID levels.
——————–
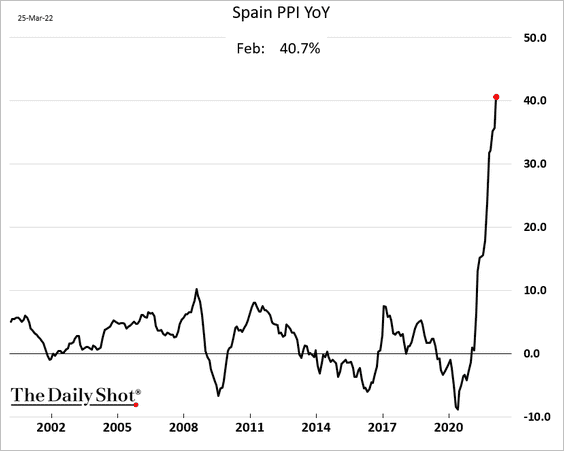
3. Spain’s producer prices are up over 40% relative to last year’s levels.
4. The euro-area money supply growth has been slowing, …
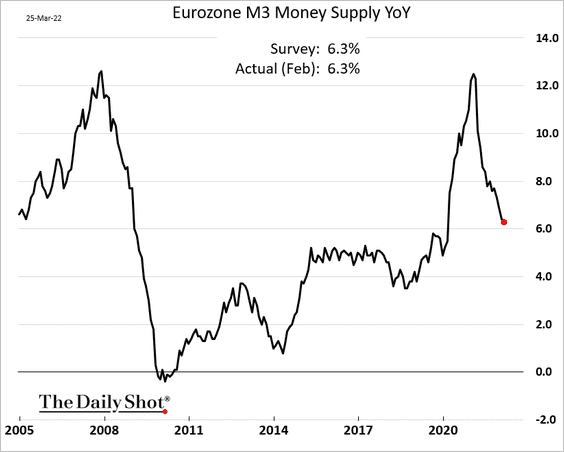
… which doesn’t bode well for business activity in the months ahead.
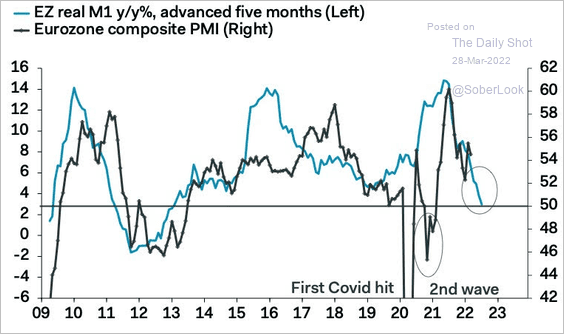 Source: Pantheon Macroeconomics
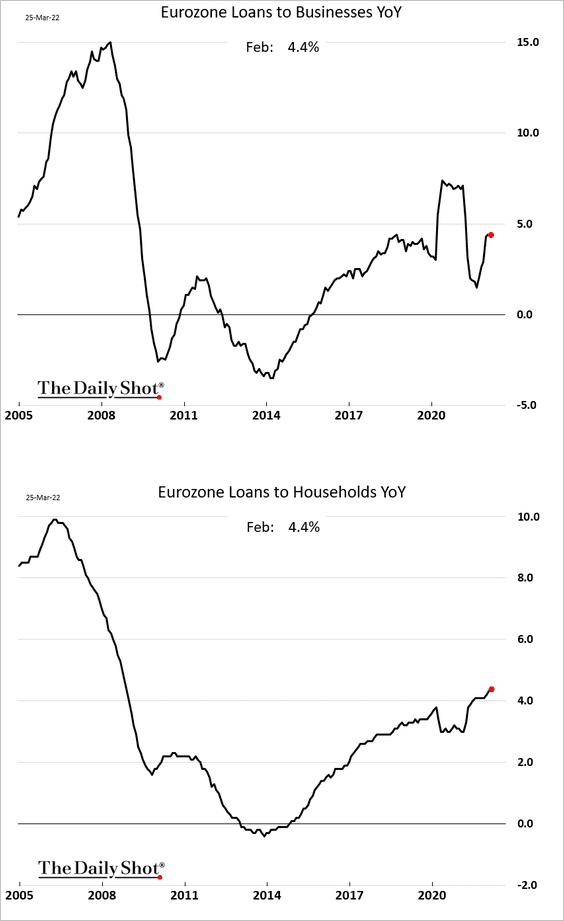
Loan growth has been holding up.
——————–
5. The Markit PMI report shows sharp gains in the Eurozone’s input costs.
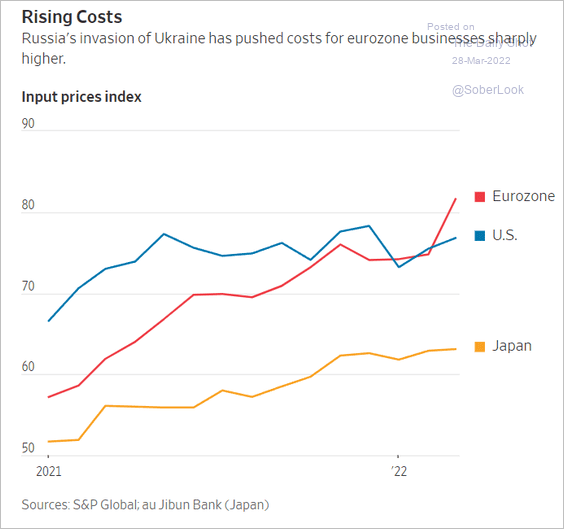 Source: @WSJ Read full article
And it’s not just about energy. For example, steel prices have gone vertical.
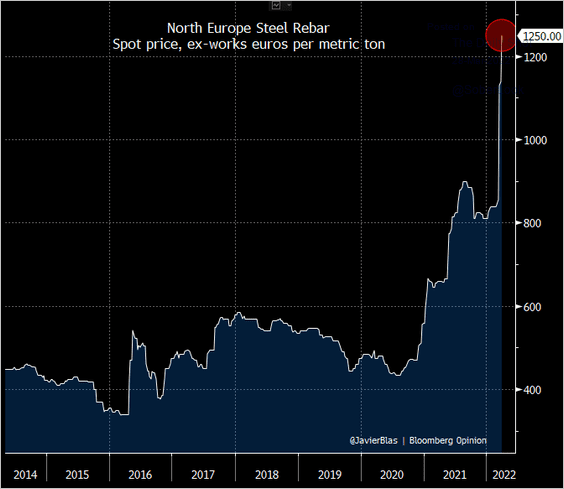 Source: @JavierBlas, @bopinion Read full article
——————–
6. The labor market keeps tightening.
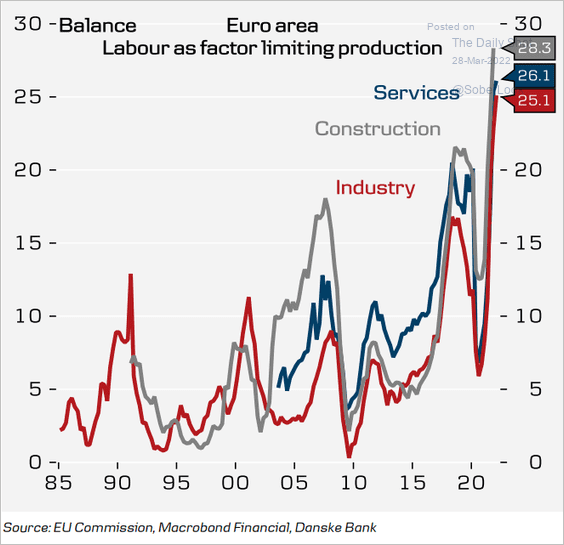 Source: Danske Bank
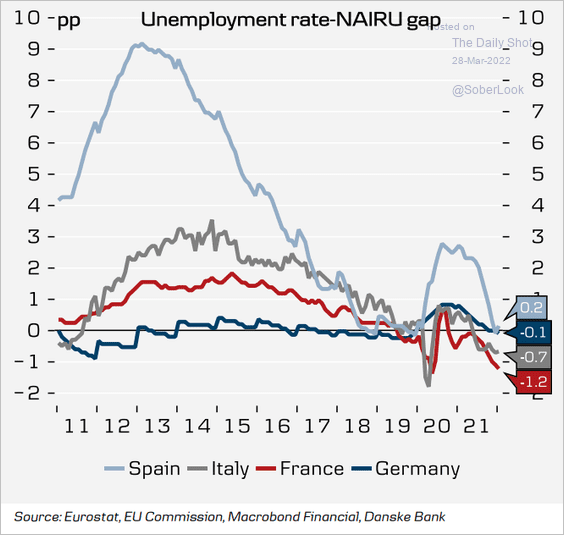 Source: Danske Bank
——————–
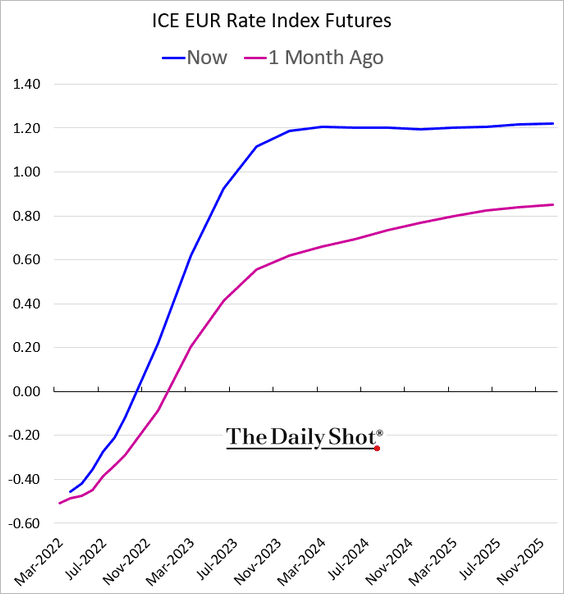
7. Short-term rate futures continue to price a steeper trajectory for ECB rate hikes.
Back to Index
Asia – Pacific
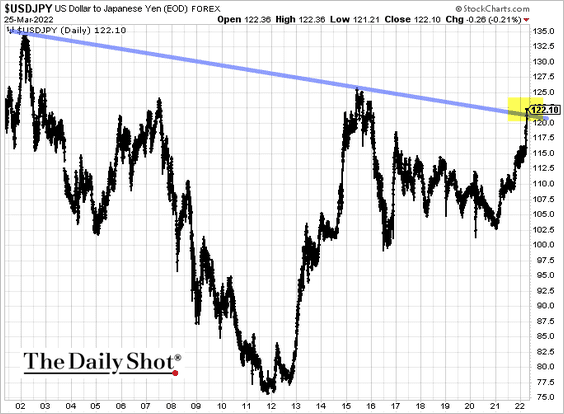
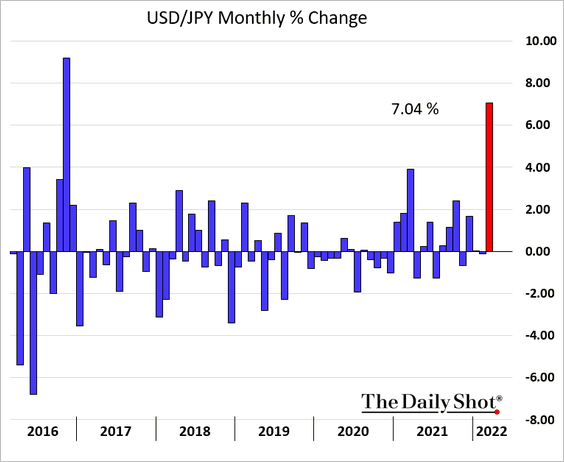
1. Dollar-yen is testing long-term resistance.
Japan’s retail investors are massively short foreign currencies, despite running negative carry.
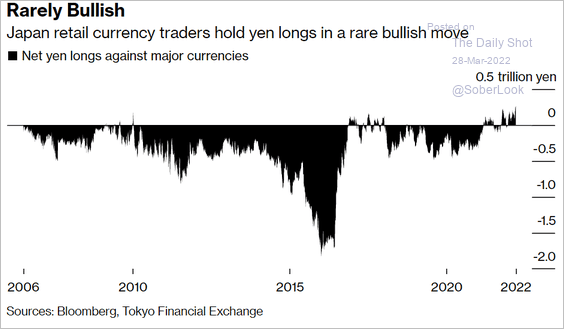 Source: Bloomberg Read full article
——————–
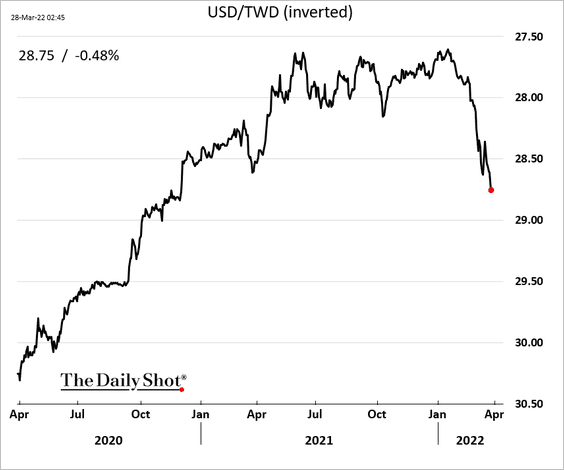
2. The Taiwan dollar is rolling over.
3. Australian banks are well-capitalized.
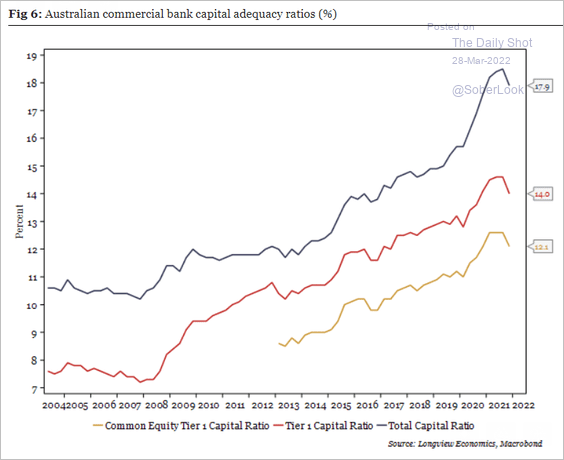 Source: Longview Economics
Back to Index
China
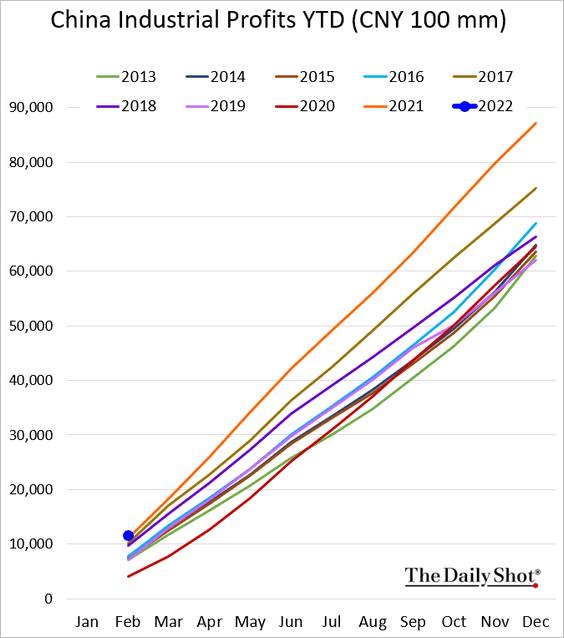
1. Industrial profits started the year on a strong note (in line with 2021).
2. COVID infections are surging, …
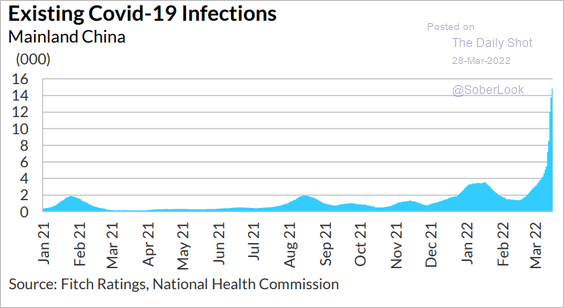 Source: Fitch Ratings
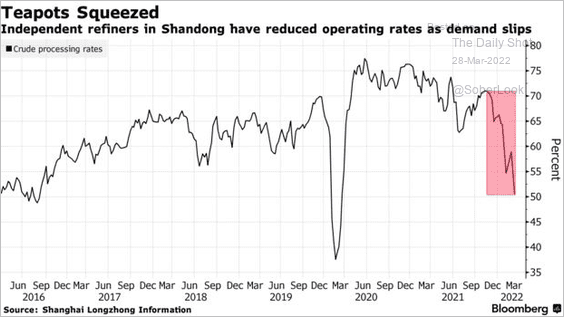
… resulting in massive lockdowns in Shanghai. That’s impacting the energy markets.
 Source: @WSJ Read full article
Airline activity is slowing rapidly.
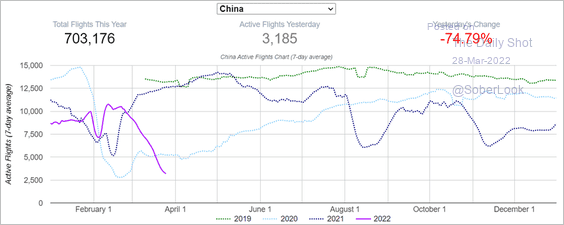 Source: @Insider_FX
——————–
3. China will invest heavily in energy this year.
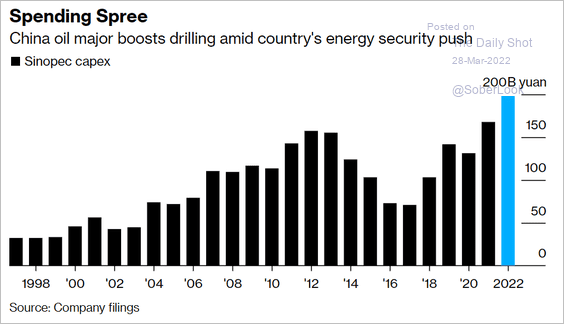 Source: @markets Read full article
Back to Index
Emerging Markets
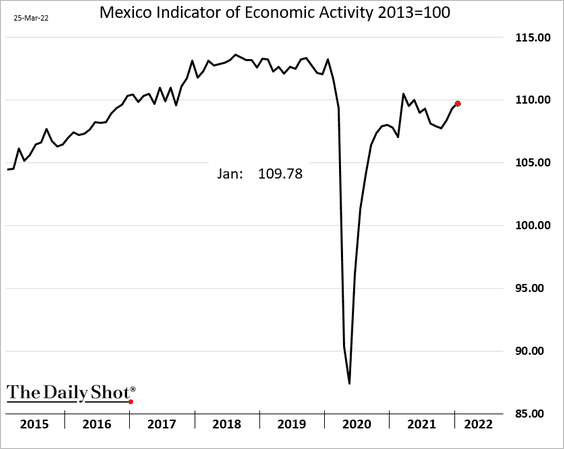
1. Mexico’s economic activity is gradually recovering.
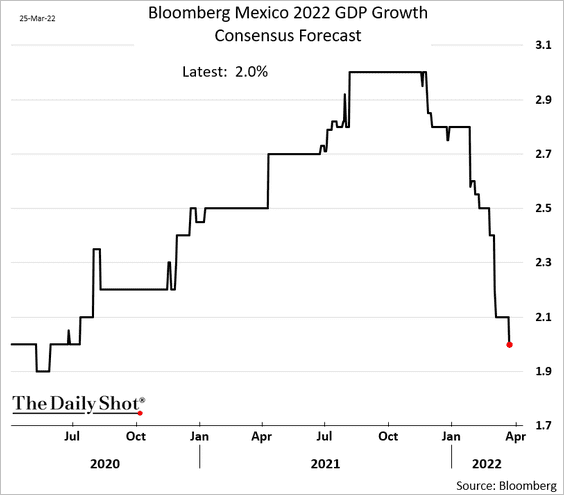
But economists are increasingly gloomy about growth this year.
Banxico sharply increased its inflation forecasts.
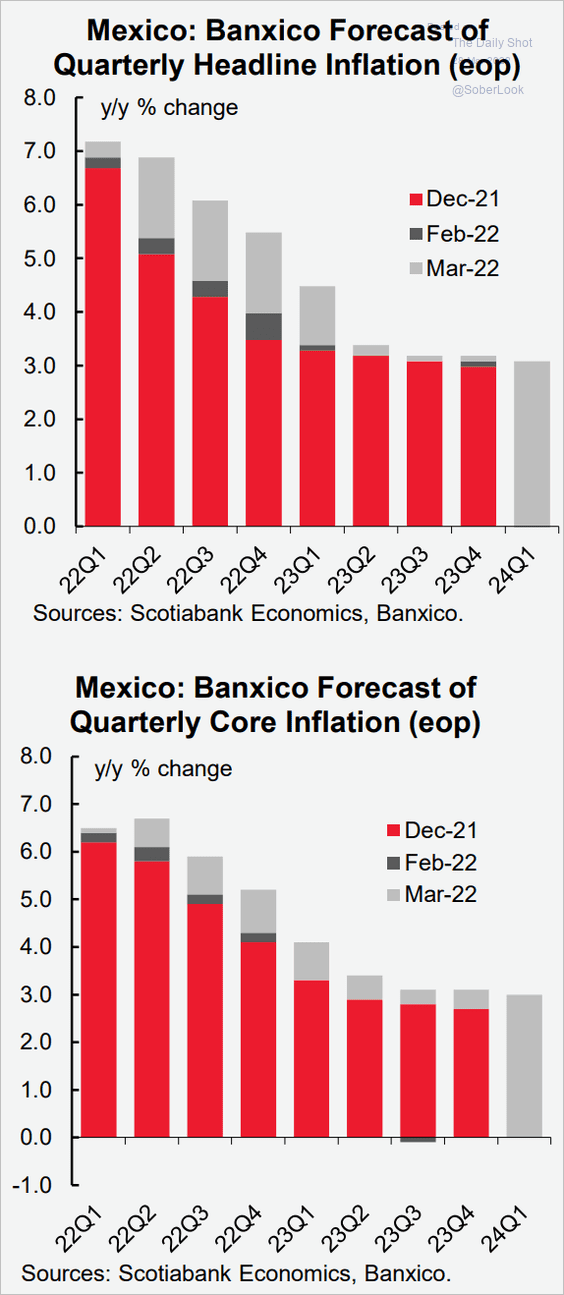 Source: Scotiabank Economics
——————–
2. Brazil’s inflation is holding near 11%.
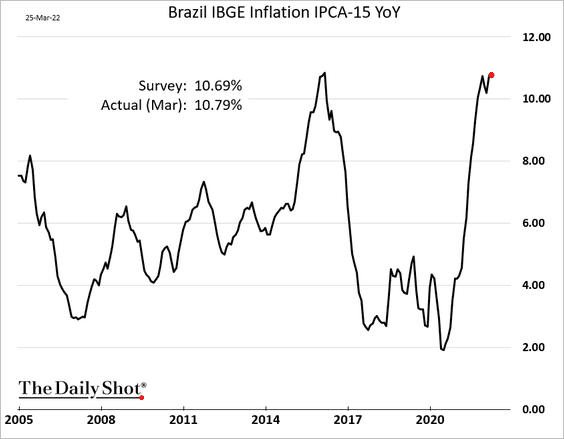
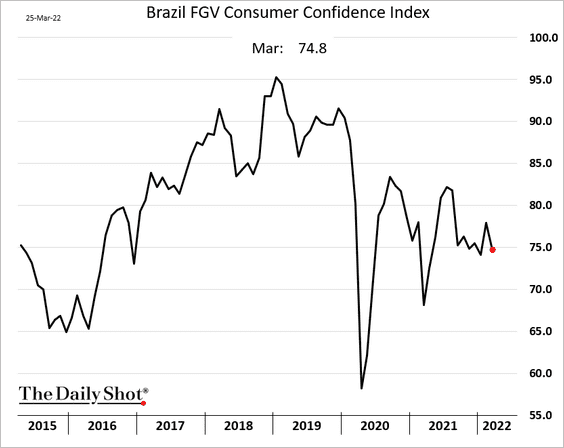
Consumer confidence edged lower this month.
——————–
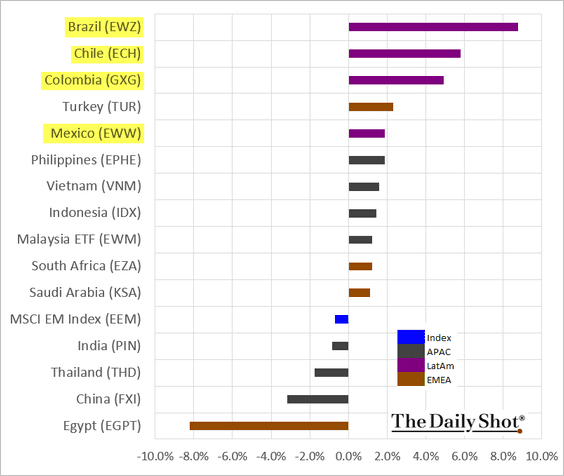
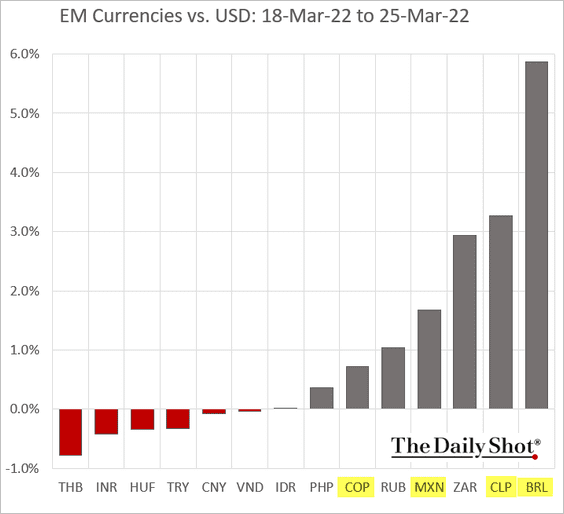
3. LatAm markets continue to outperform (3 charts) …
• EM ETF performance last week:
• EM currencies:
• LatAm ETF:
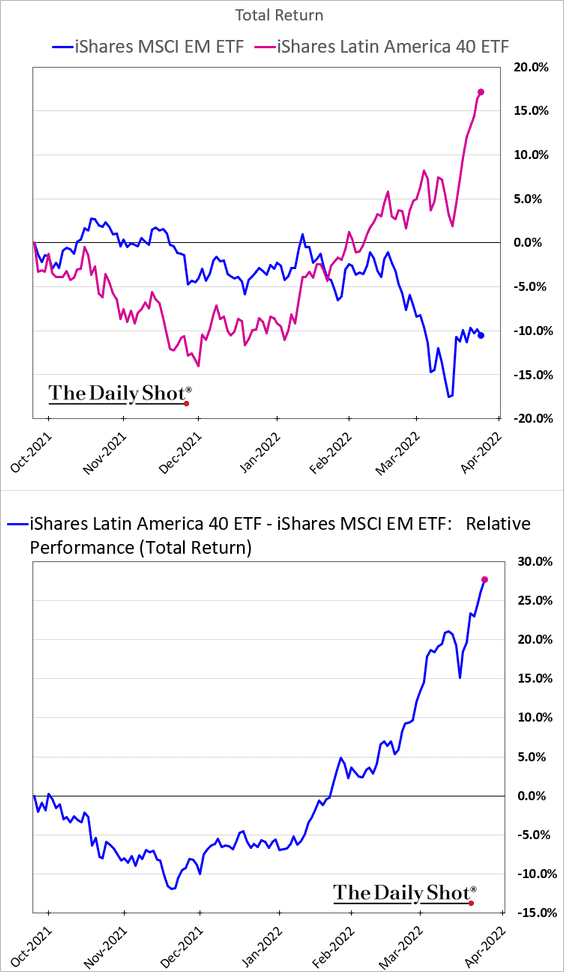
… as fund inflows accelerate (LatAm commodity exporters are particularly popular).

——————–
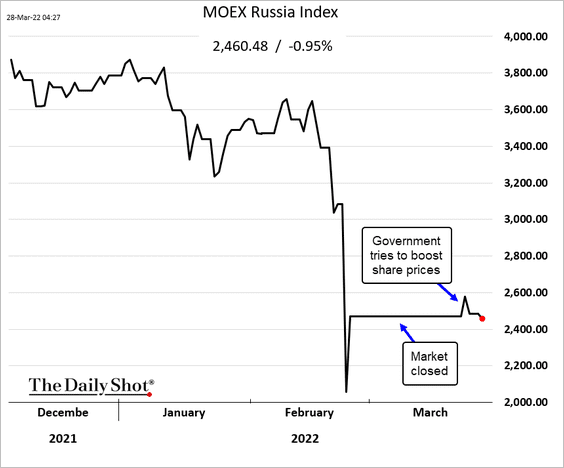
4. Russia’s stock market reopened last week (sort of), and the government tried to boost share prices.
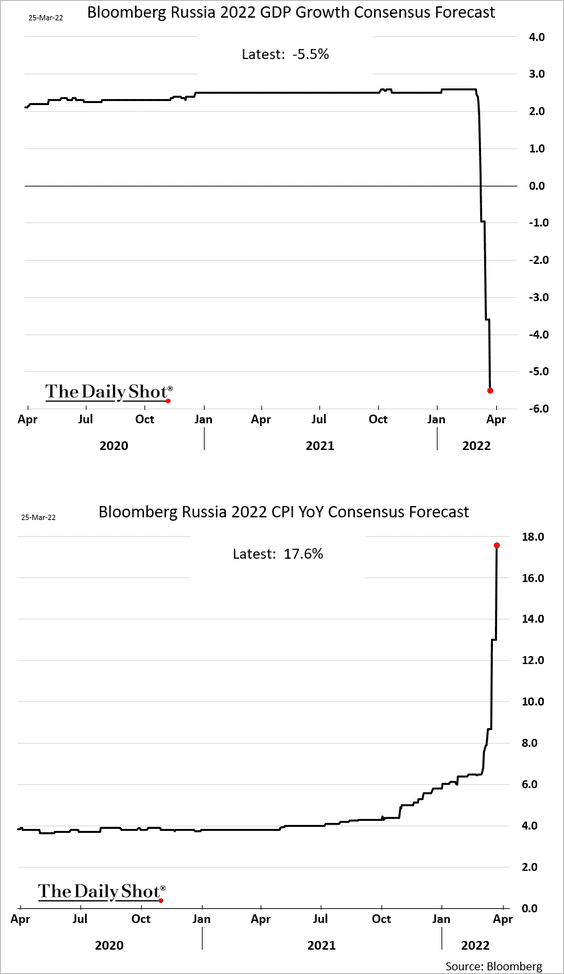
Economists see massive stagflation in Russia this year.
——————–
5. Below is an illustration of EM economic vulnerability.
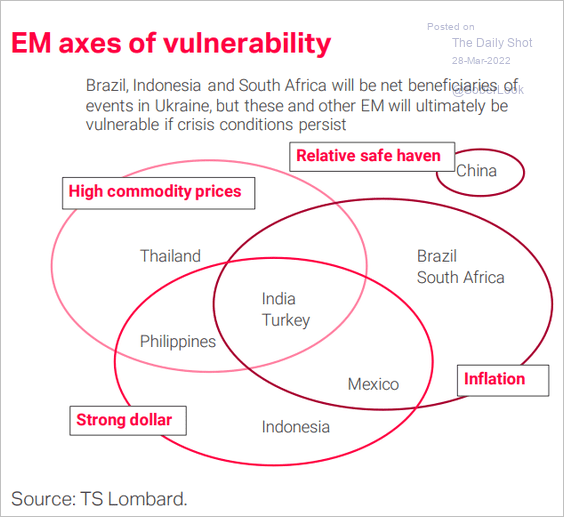 Source: TS Lombard
Back to Index
Cryptocurrency
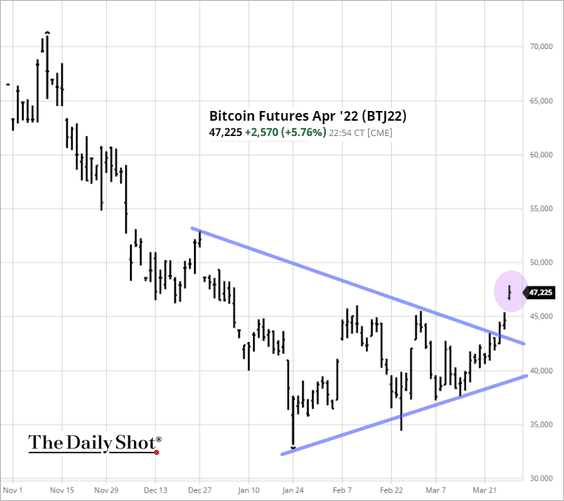
1. Cryptos have been surging, …
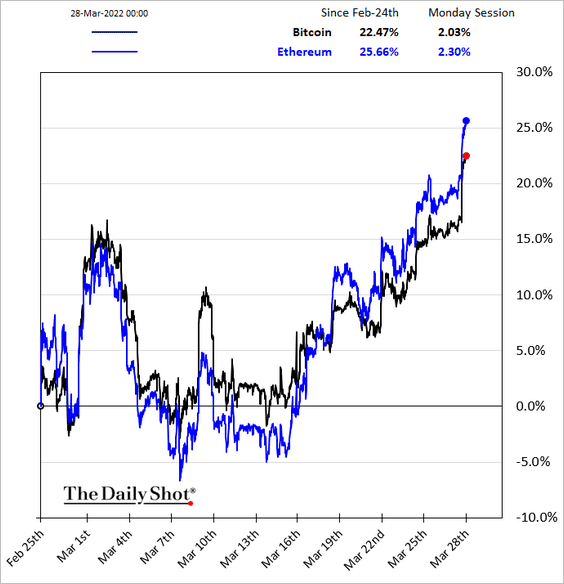
… as bitcoin futures broke to the upside.
 Source: barchart.com
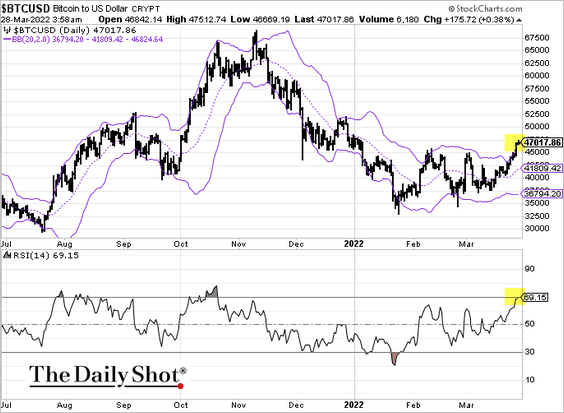
But technicals suggest that bitcoin is nearing overbought territory. The cryptocurrency is at the upper Bollinger Band.
——————–
2. Russia may want to get paid in bitcoin.
 Source: CNBC Read full article
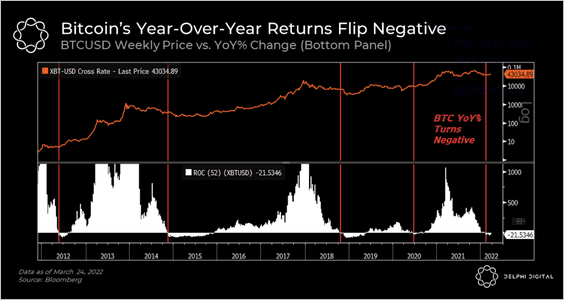
3. This chart shows prior instances when BTC’s year-over-year return turned negative, which preceded major price troughs. Still, negative returns can persist for a few months, similar to what occurred in 2014 and 2018.
 Source: Delphi Digital Read full article
4. The average price paid for bitcoin by short-term investors after the October price high was $45,900, which is seen as resistance, according to blockchain data compiled by Glassnode.
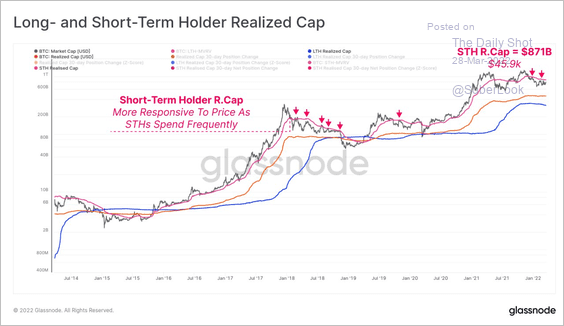 Source: @glassnode
5. Exxon Mobil is using excess natural gas to power crypto mining operations.
 Source: Bloomberg Read full article
6. This chart shows the recent decline in mining revenue.
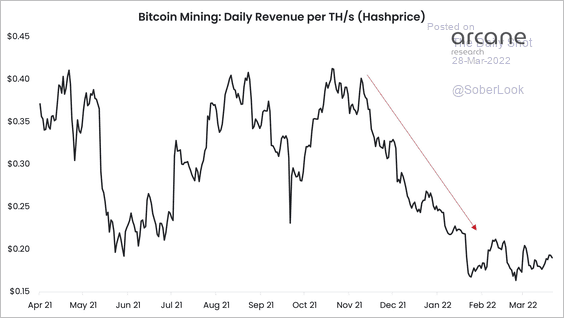 Source: @ArcaneResearch
7. Get ready for more crypto regulations, particularly regarding stablecoins.
 Source: CNBC Read full article
Back to Index
Commodities
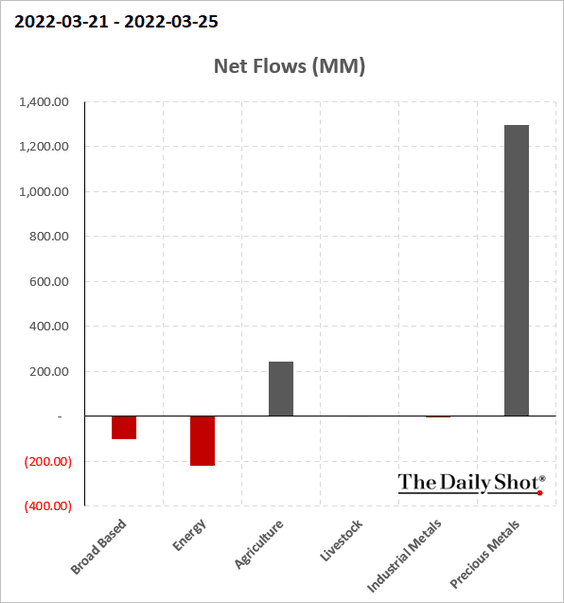
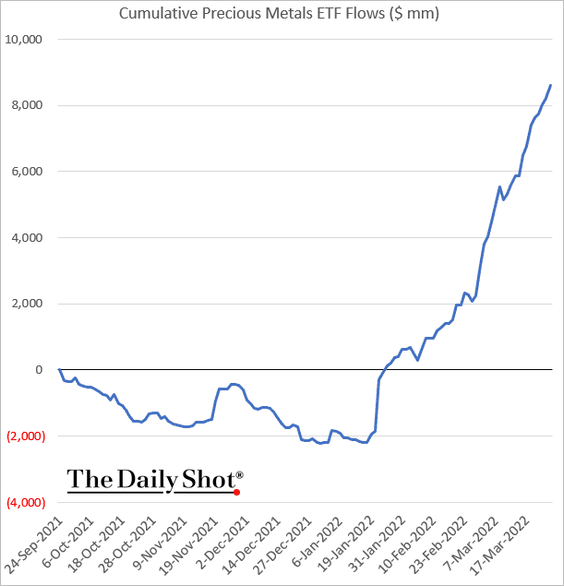
1. Precious metals continue to see significant capital inflows.
This chart shows cumulative flows over the past six months.
——————–
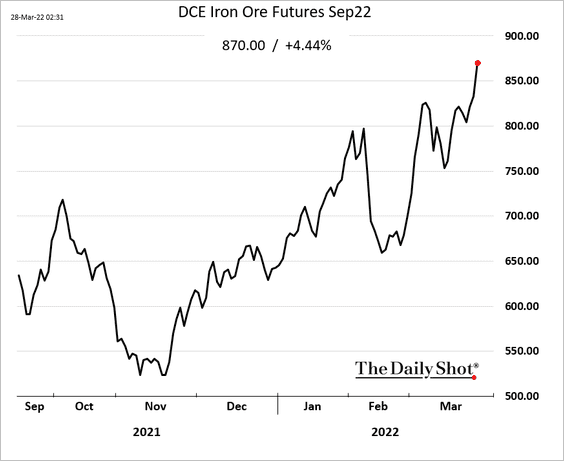
2. Iron ore prices are surging in China.
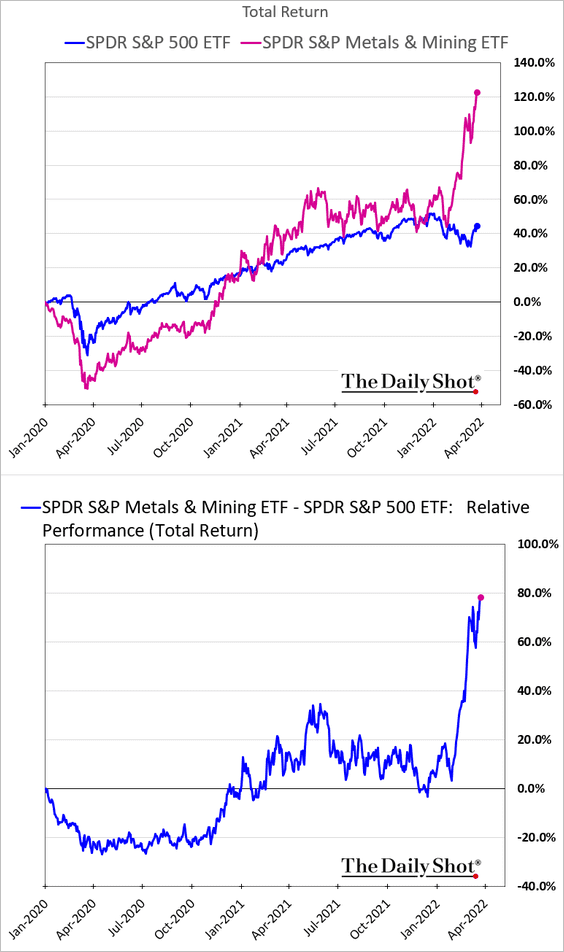
3. The Metals & Mining sector share outperformance has been impressive.
4. Sugar is rebounding amid supply concerns.
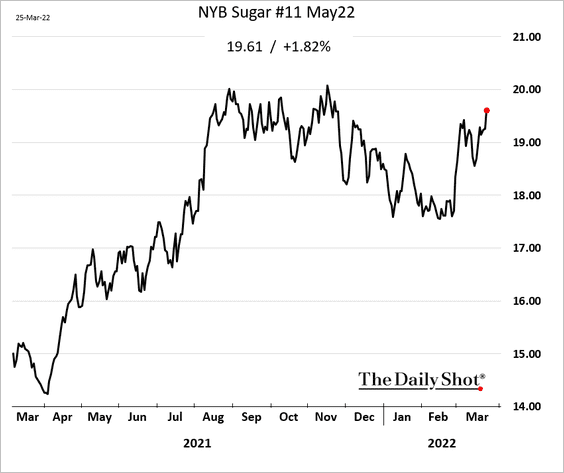
 Source: Reuters Read full article
——————–
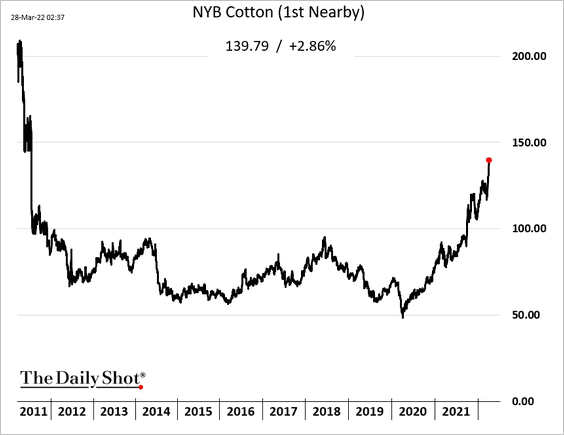
5. US cotton futures hit a multi-year high.
6. Fertilizer prices continue to surge.
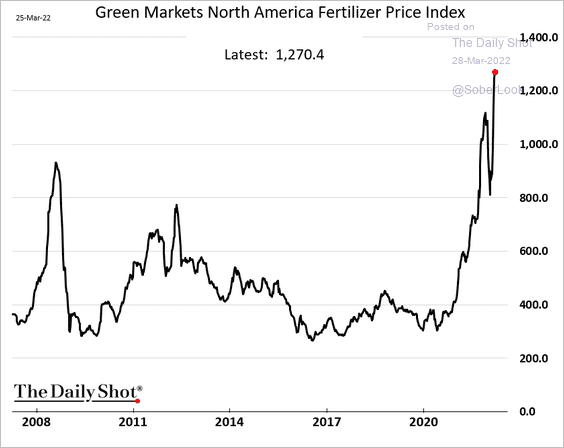 h/t Walter
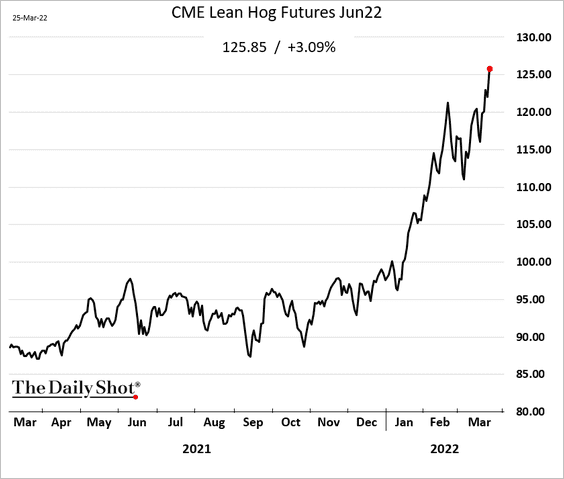
7. When it rains, it pours.
 Source: @markets, @mhirtz Read full article
Chicago hog futures are up sharply.
——————–
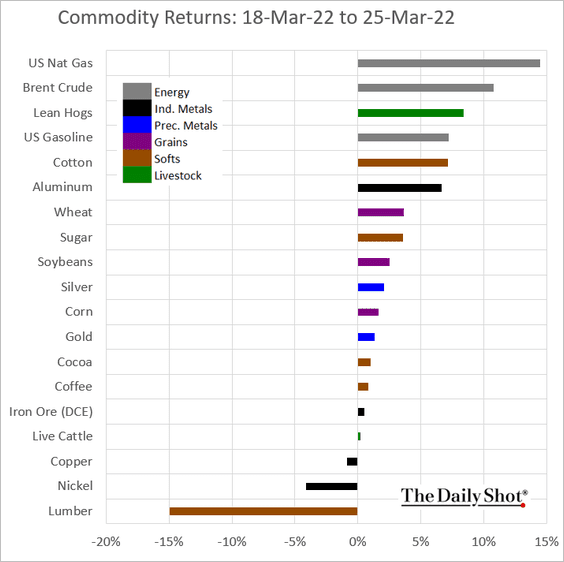
8. Here is last week’s performance across key commodity markets.
9. It’s been quite a quarter for commodities (2 charts).
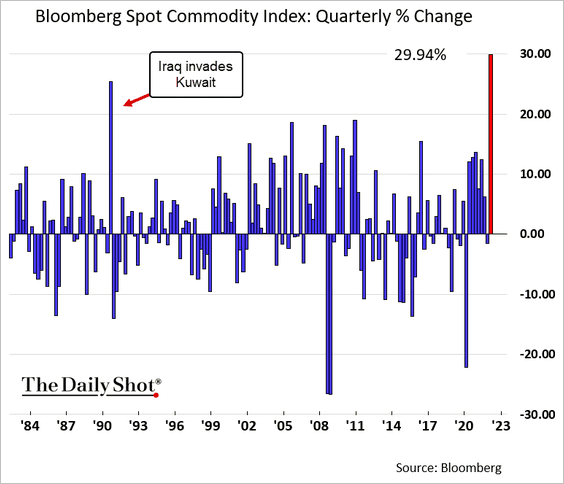
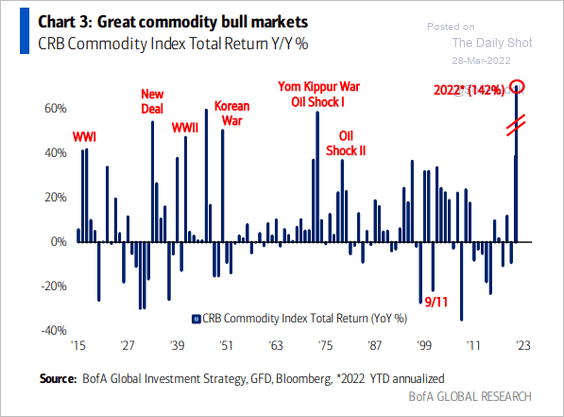 Source: BofA Global Research; @MikeZaccardi
Back to Index
Energy
1. Crude oil is lower amid China’s COVID lockdowns,…
 Source: Reuters Read full article
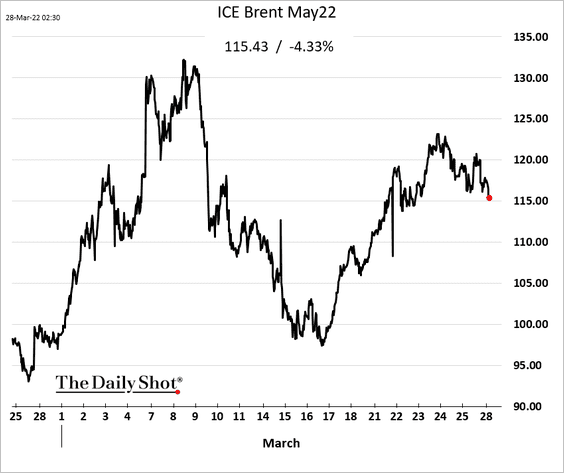
… which are dampening demand.
 Source: @markets Read full article
——————–
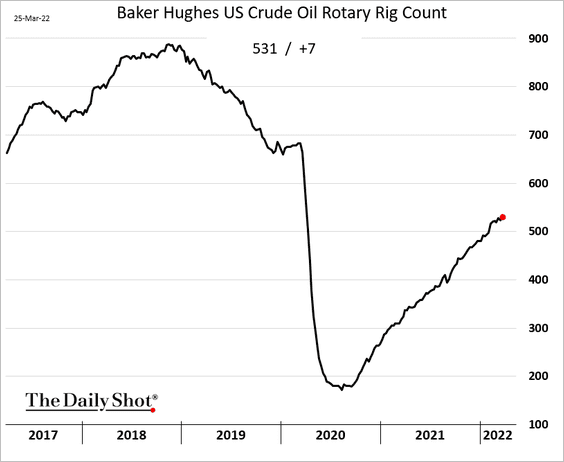
2. The US rig count keeps climbing but remains below pre-COVID levels.
3. Here is the breakdown of US LNG exports.
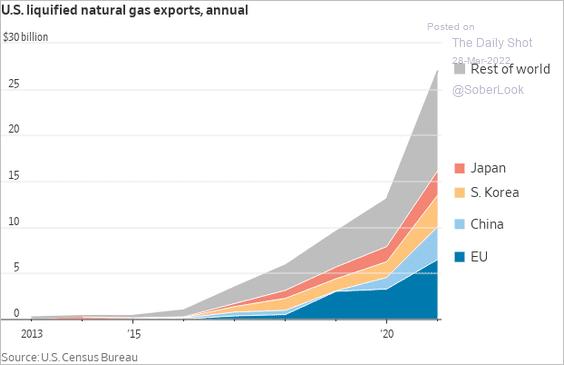 Source: @WSJ Read full article
4. Middle-East spare capacity is not enough to replace Russian oil supplies.
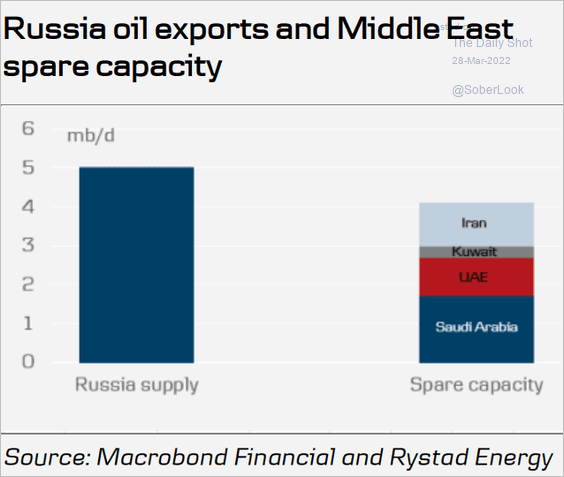 Source: Danske Bank
Back to Index
Equities
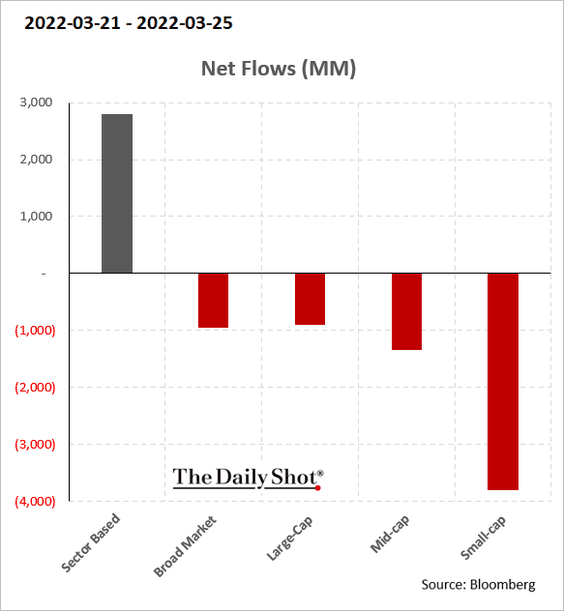
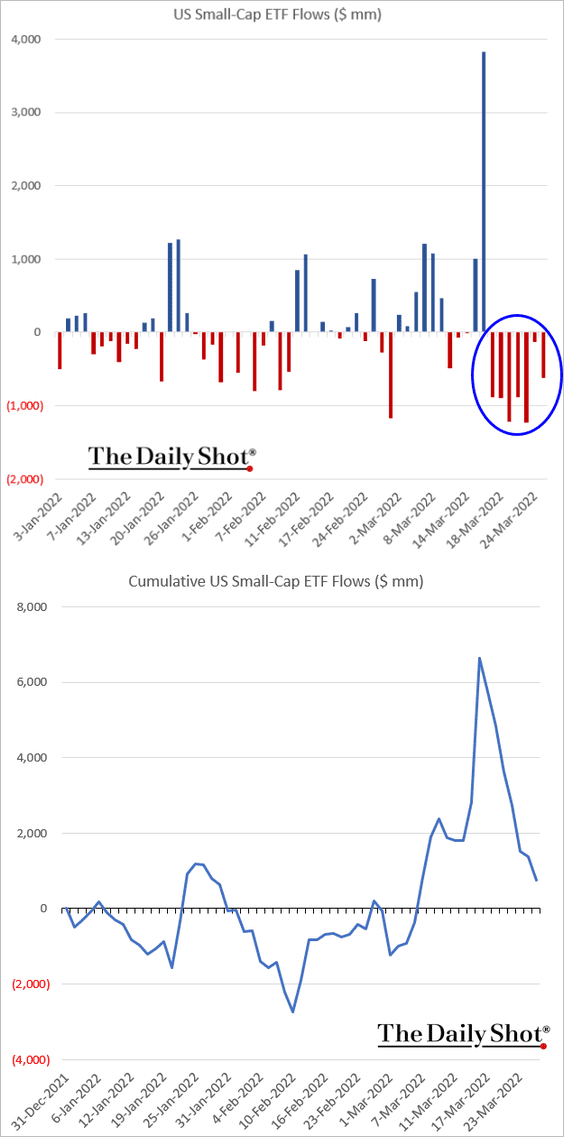
1. Small caps underperformed last week, …
… as fund flows remained negative (2 charts).
——————–
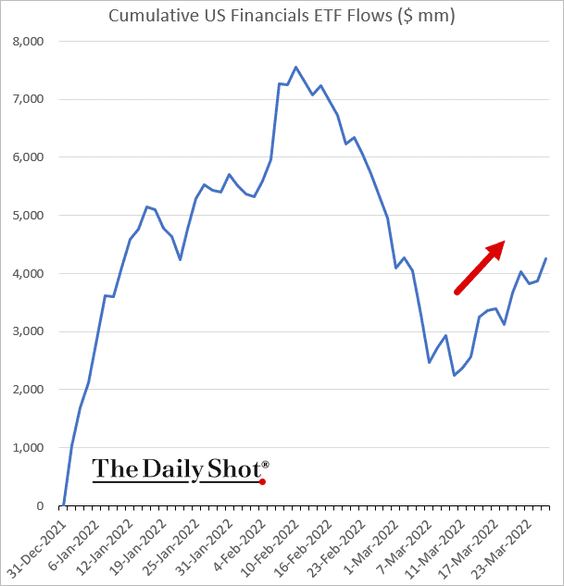
2. Financials are experiencing a rebound in fund flows (2 charts).
——————–
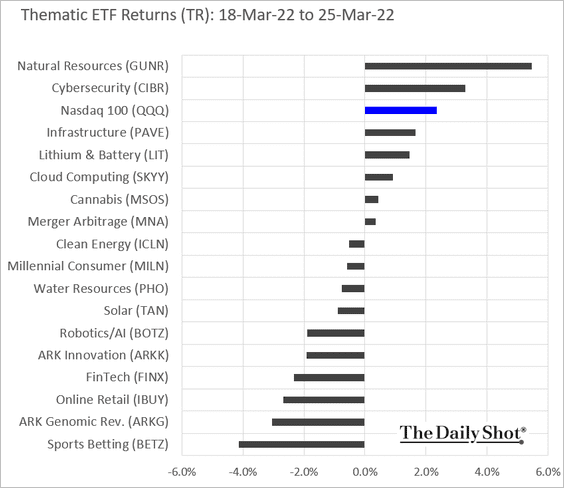
3. Investors continue to pull capital out of thematic funds, …
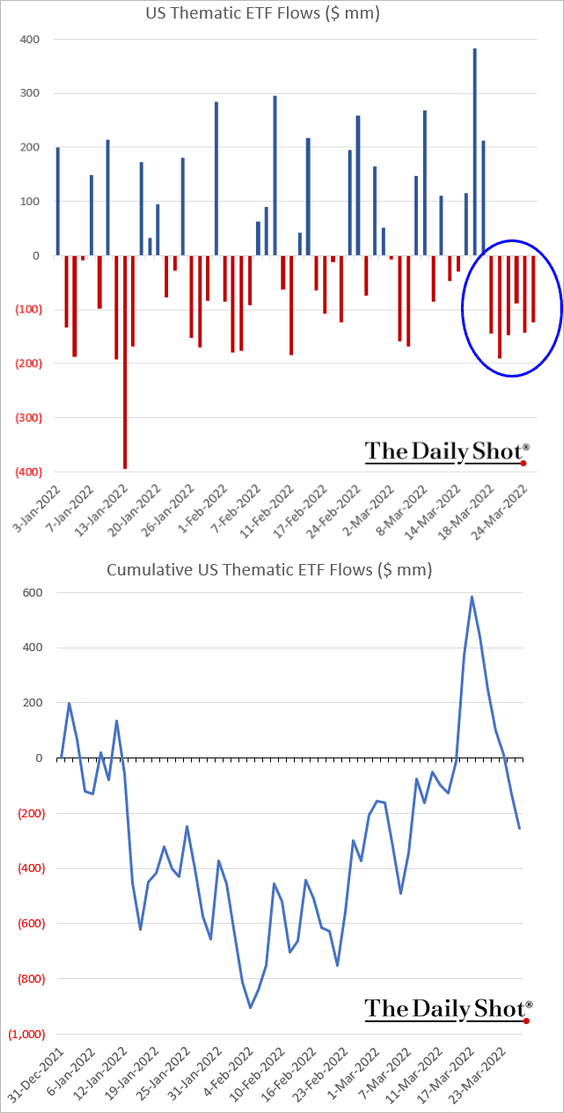
… resulting in underperformance among the more speculative ETFs.
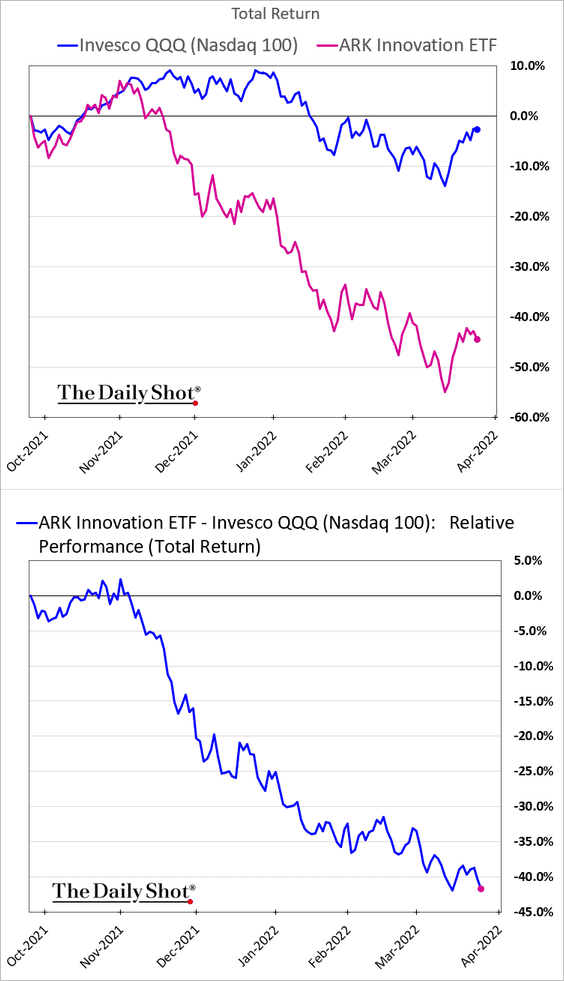
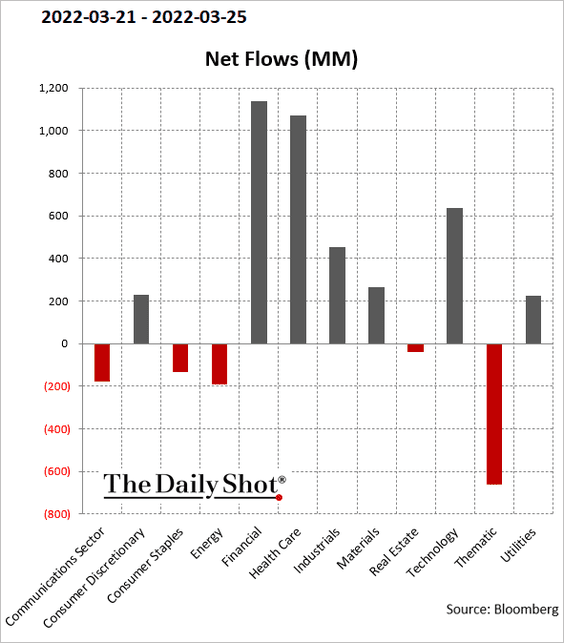
Here is last week’s performance.
——————–
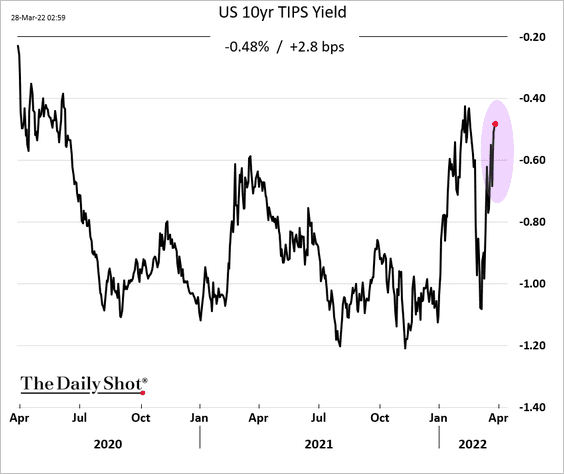
4. The S&P 500 equity risk premium hit the lowest level since 2018, …
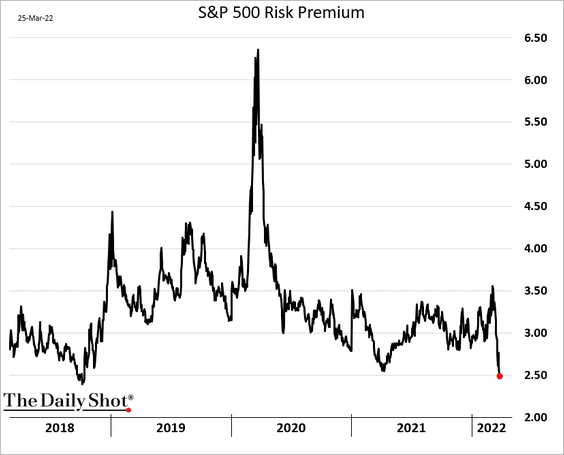
… as stocks massively outperform bonds. The stock market has been remarkably resilient in the face of rapidly rising yields.
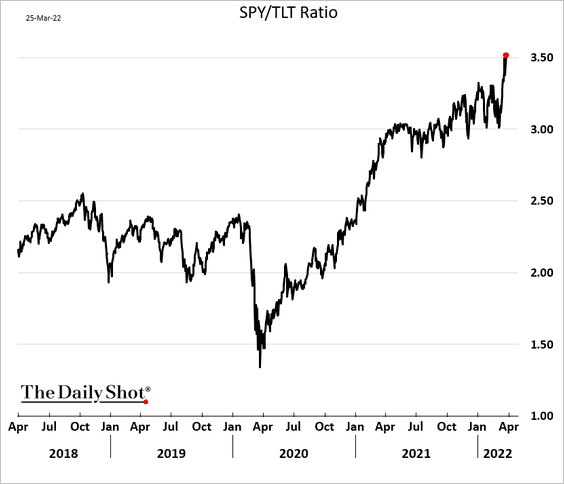
It’s hard to see this trend continuing for much longer as real rates surge (potentially putting pressure on growth stocks).
——————–
5. Deutsche Bank’s positioning indicator edged higher but remains below average.
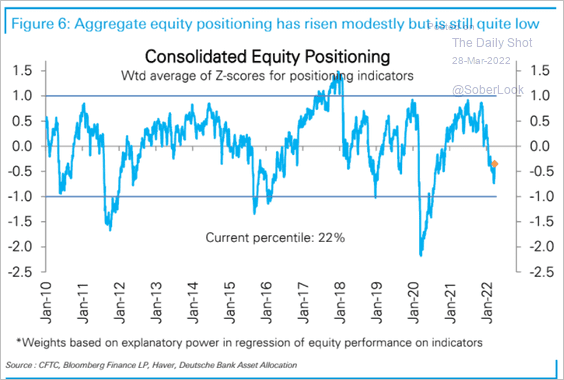 Source: Deutsche Bank Research
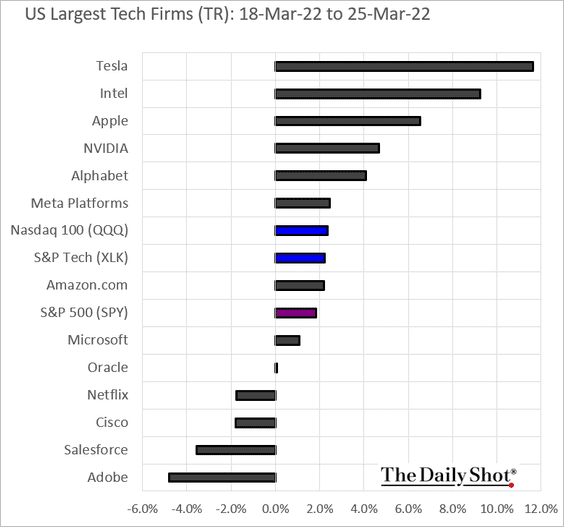
6. Next, we have the largest tech stocks’ performance last week.
Back to Index
Credit
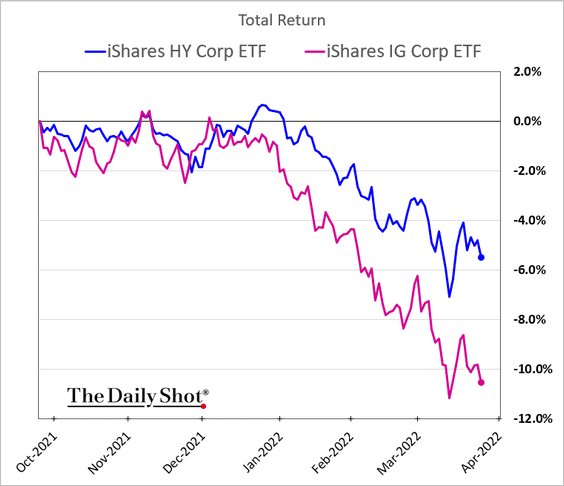
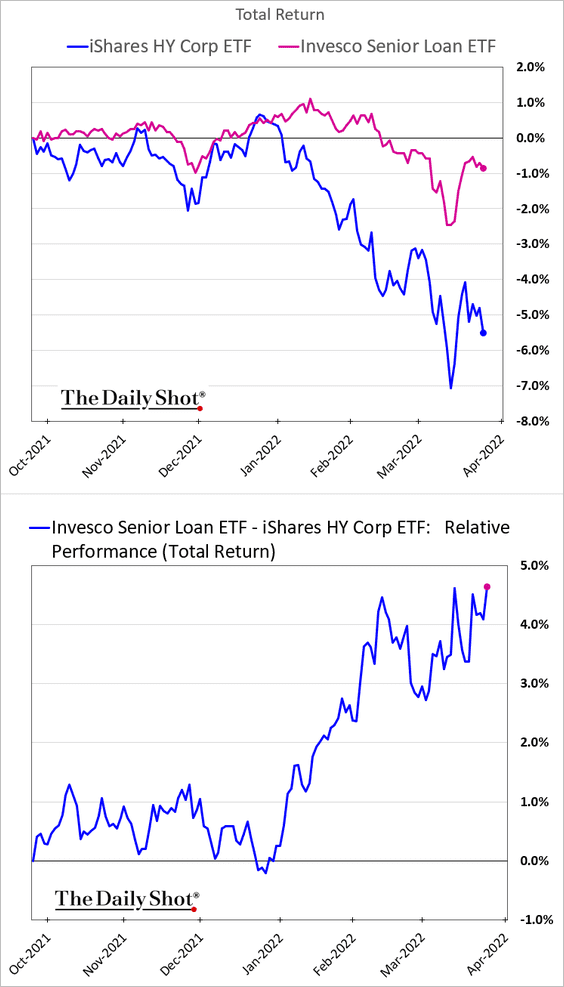
1. Corporate bonds continue to struggle as Treasuries slump.
But leveraged loans resumed the outperformance.
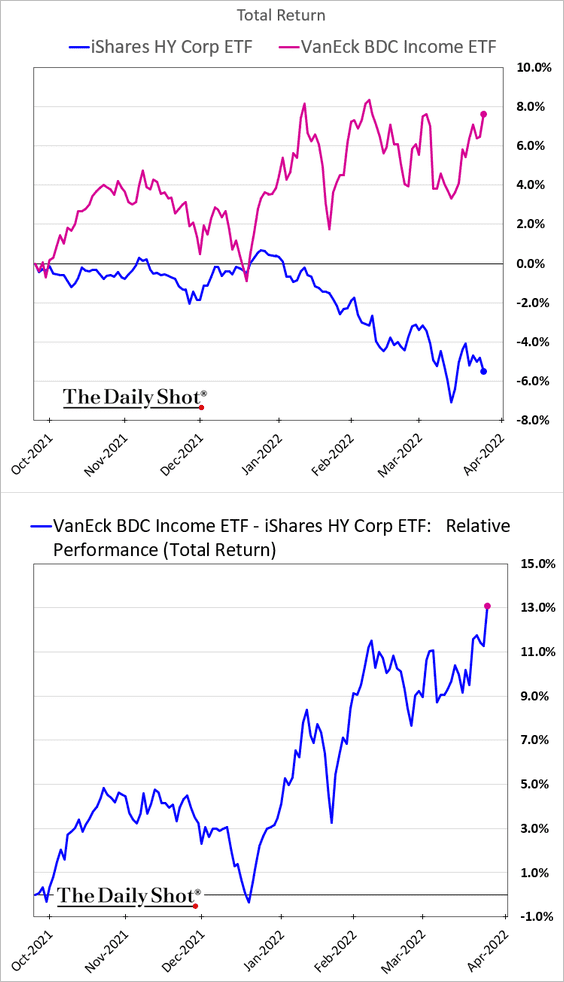
And BDCs are doing quite well.
——————–
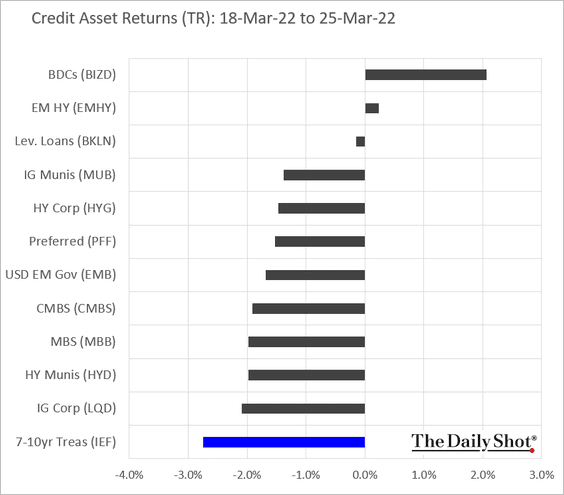
2. This chart shows last week’s performance by asset class.
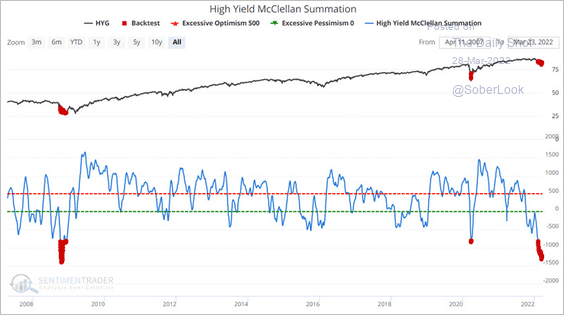
3. Market breadth indicators for the iShares High Yield Corporate Bond ETF (HYG) reached the lowest levels since 2008.
 Source: SentimenTrader
Back to Index
Rates
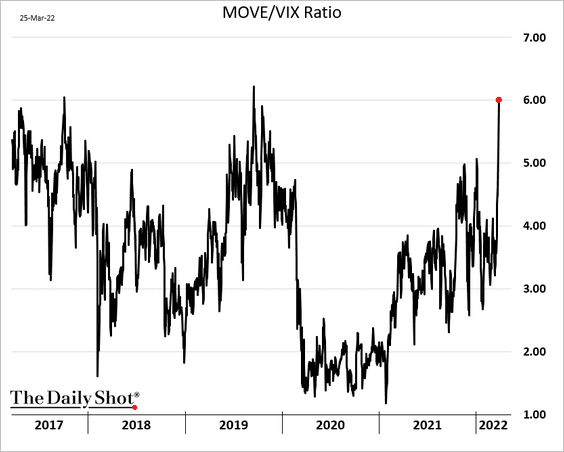
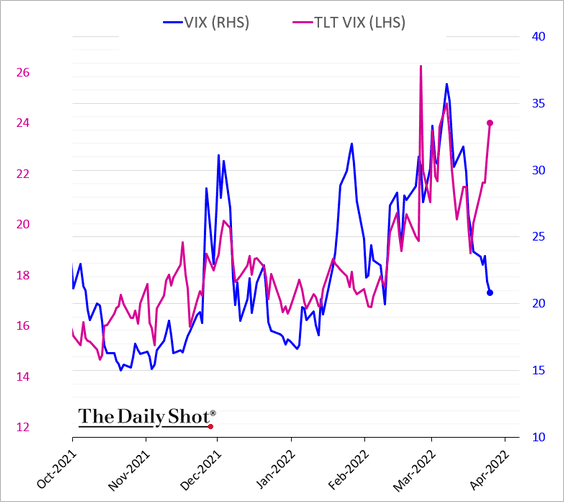
1. Treasury implied vol (MOVE) has been outpacing equity vol (VIX).
——————–
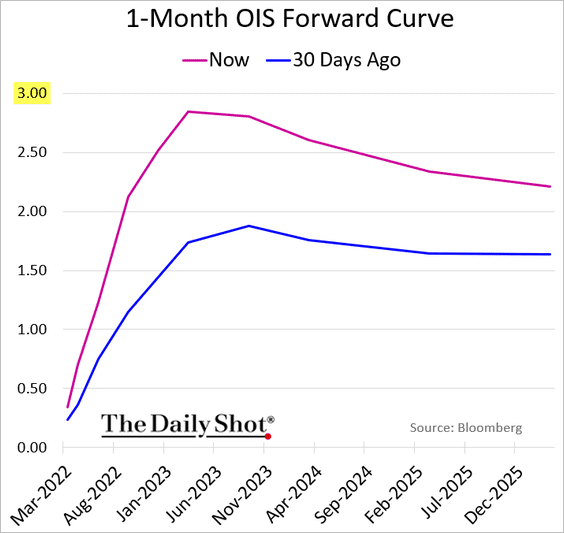
2. Where will the Fed’s rate hikes peak? Could we hit 3%?
3. Treasury yields and the slope of the yield curve have diverged massively from seasonal trends.
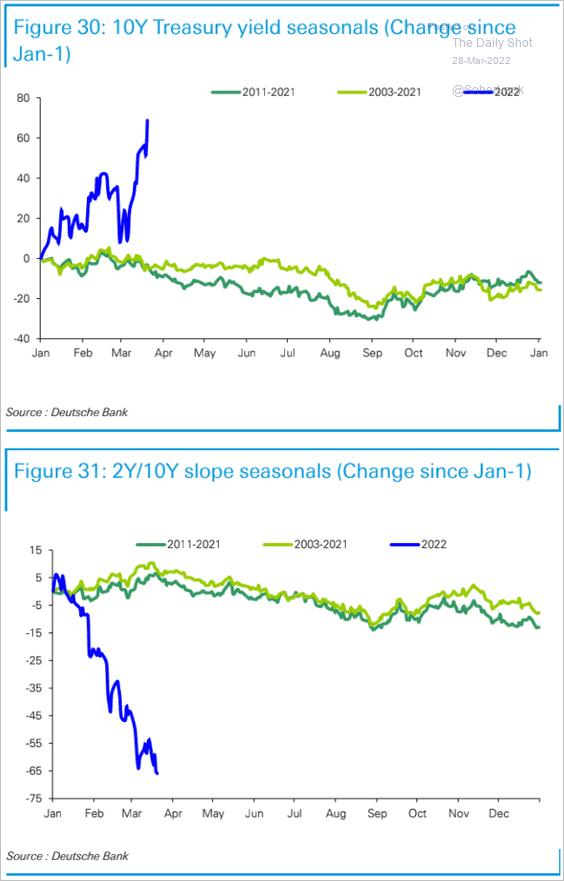 Source: Deutsche Bank Research
4. The 10-year Treasury yield is at resistance.
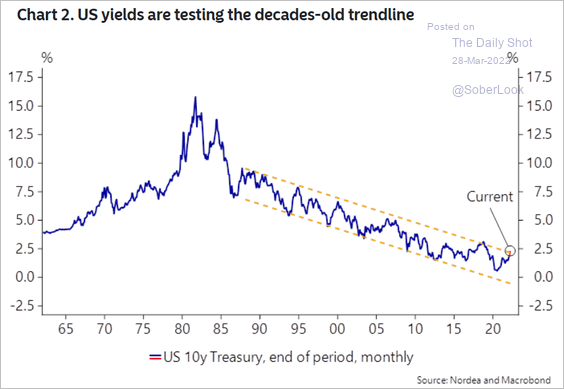 Source: Nordea Markets
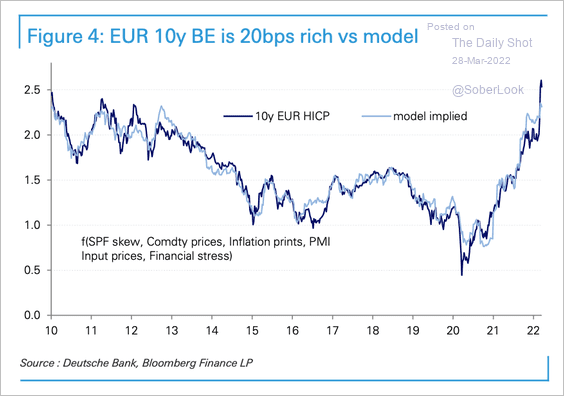
5. 10-year breakeven rates in the US and Europe are about 20-40 basis points rich compared to Deutsche Bank’s models.
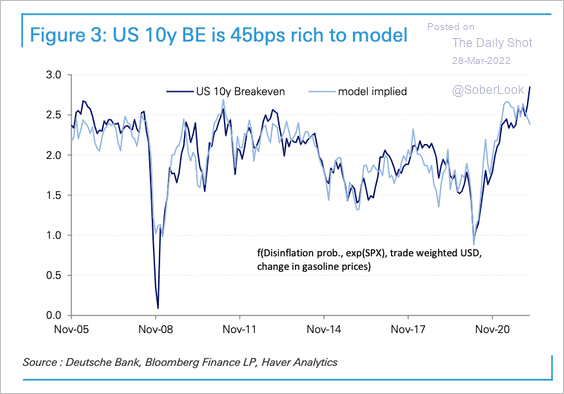 Source: Deutsche Bank Research
 Source: Deutsche Bank Research
Back to Index
Global Developments
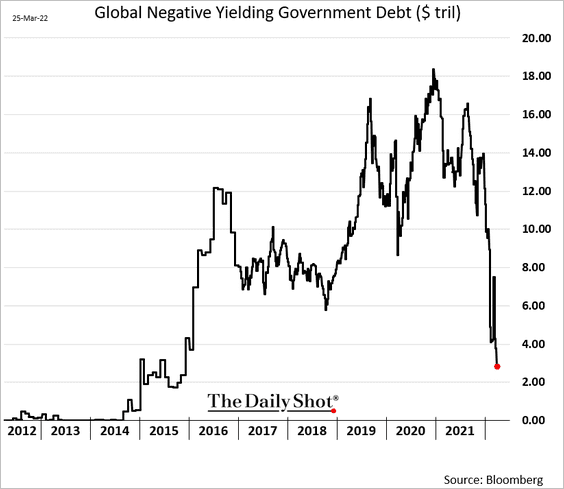
1. The amount of negative-yielding debt continues to tumble.
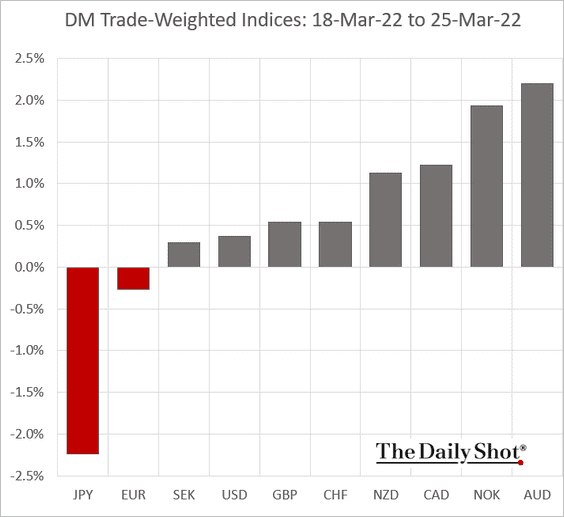
2. Next, we have two performance charts from last week.
• Bond yields:
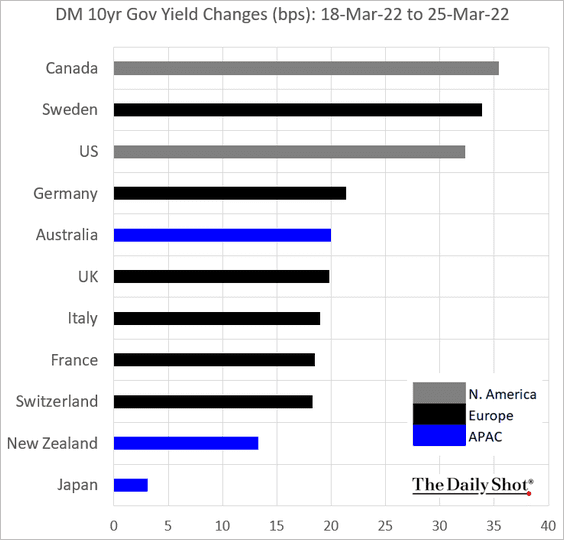
• Trade-weighted currency indices:
——————–
Food for Thought
1. US office occupancy rates:
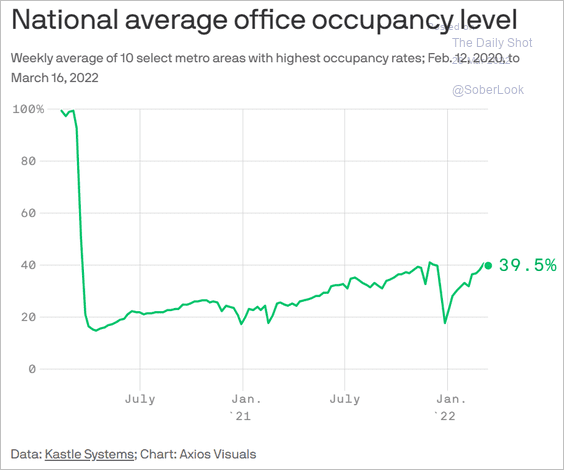 Source: @axios Read full article
2. Ransomware attacks by industry:
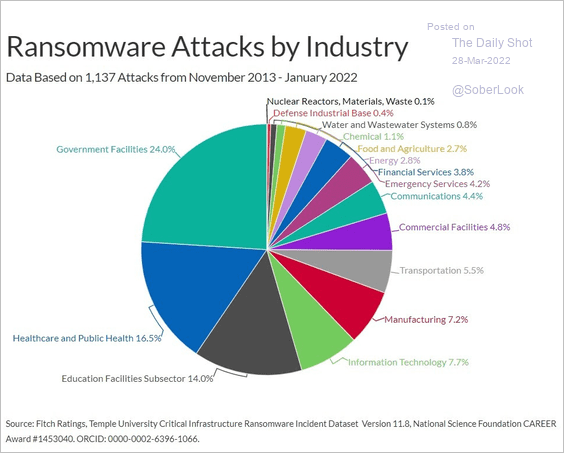 Source: Fitch Ratings
3. Views on the fairness of the 2022 midterm elections:
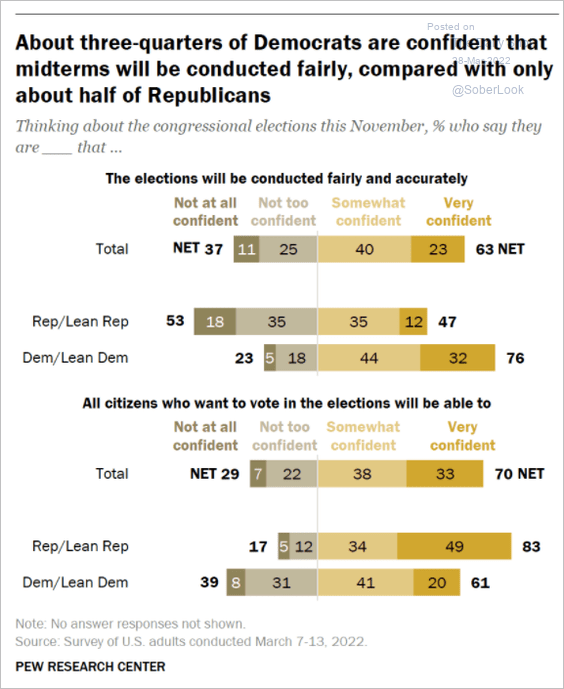 Source: Pew Research Center Read full article
4. Planned wind projects:
 Source: S&P Global Market Intelligence
5. North Korea’s missile tests:
 Source: @myhlee Read full article
6. Frequency of red hair in Europe:
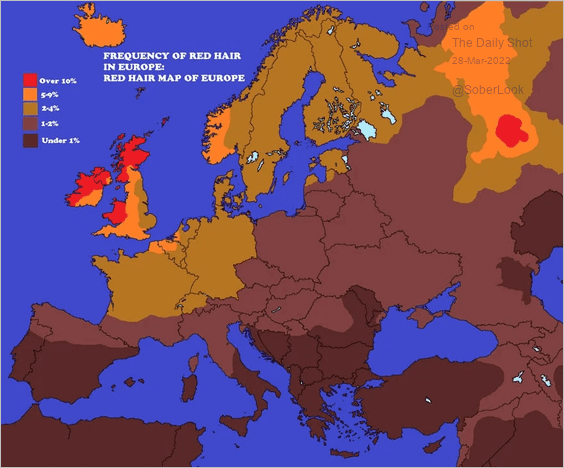 Source: The Telegraph Read full article
——————–
Back to Index