
The Daily Shot: 01-Apr-22
• The United States
• Canada
• The Eurozone
• Europe
• Japan
• Asia – Pacific
• China
• Emerging Markets
• Cryptocurrency
• Commodities
• Energy
• Equities
• Credit
• Rates
• Global Developments
• Food for Thought
The United States
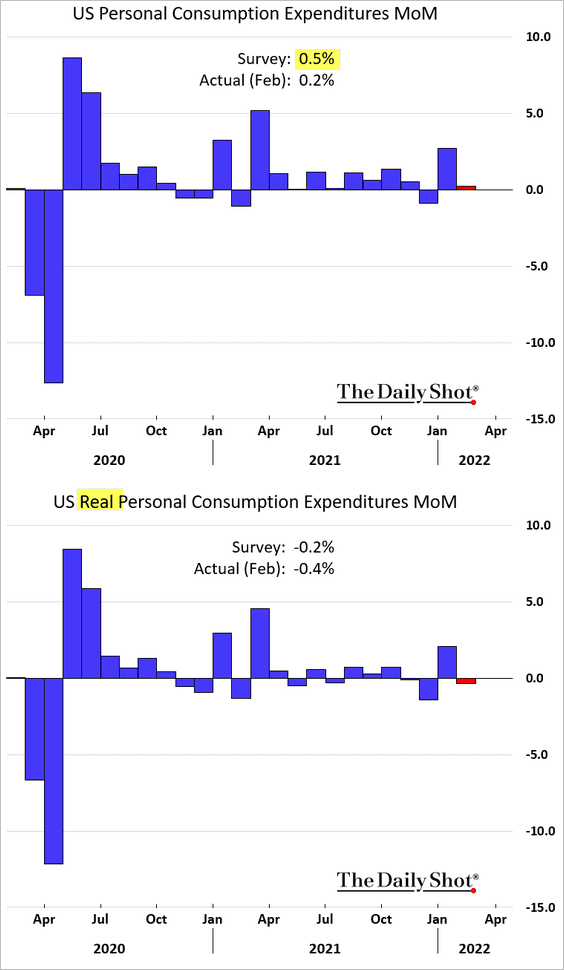
1. Consumer spending was softer than expected in February as inflation eats into disposable incomes. Real consumption declined (second panel).
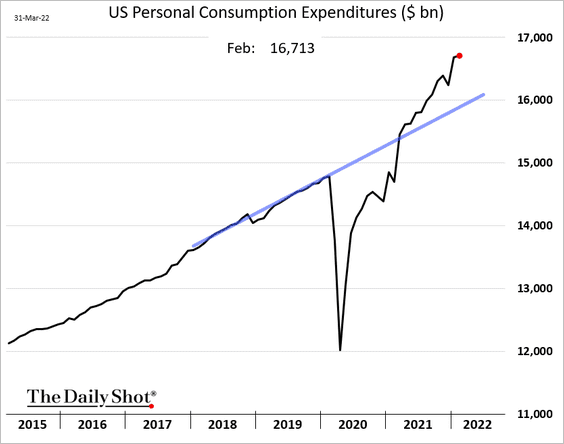
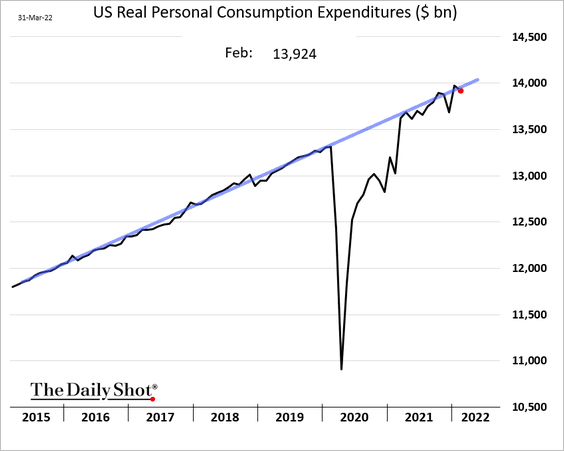
Here are the nominal and real spending indices as well as the pre-COVID trend.
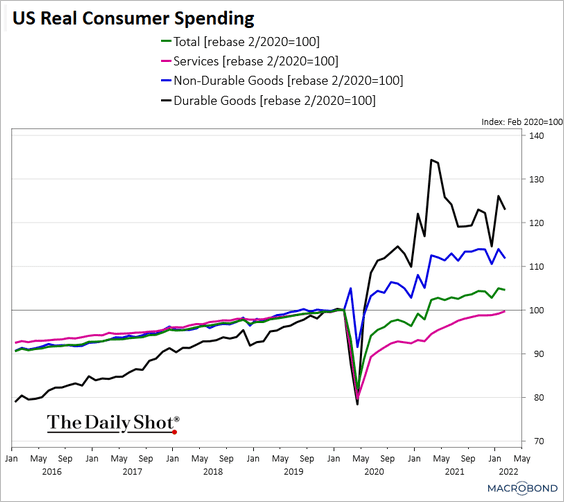
Services spending has now nearly fully recovered.
 Source: Chart and data provided by Macrobond
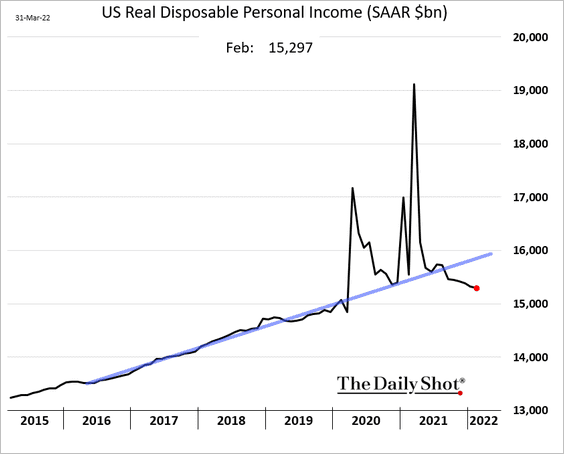
2. Real disposable income continues to trend lower, significantly deviating from the trend.
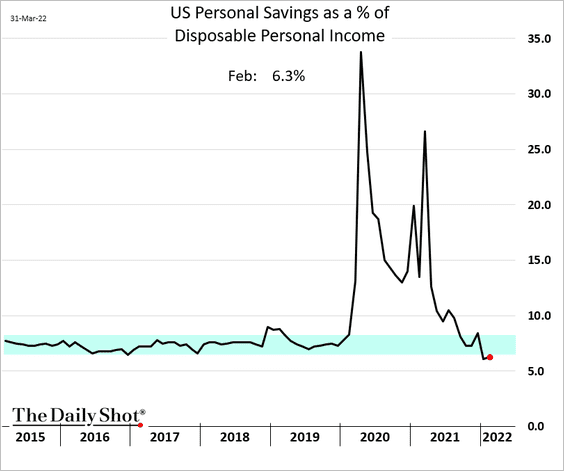
3. The index of personal savings as a share of disposable income is holding below pre-COVID levels.
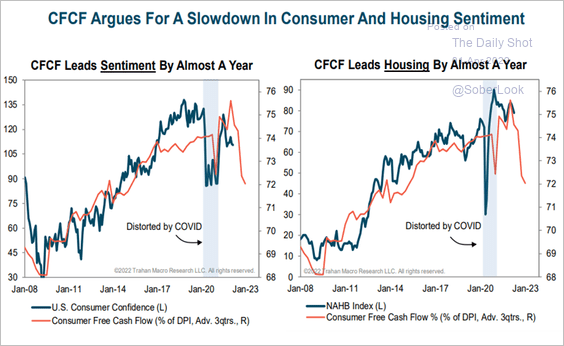
4. Consumer “free cash flow” is signaling slower economic activity ahead.
 Source: Trahan Macro Research
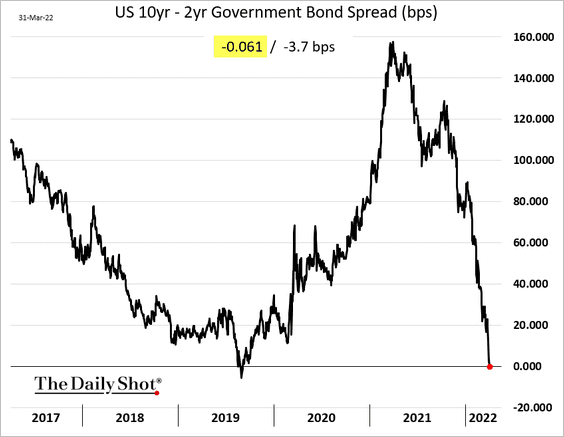
The market agrees. The yield curve has inverted, with the 10yr – 2yr spread dipping into negative territory.
——————–
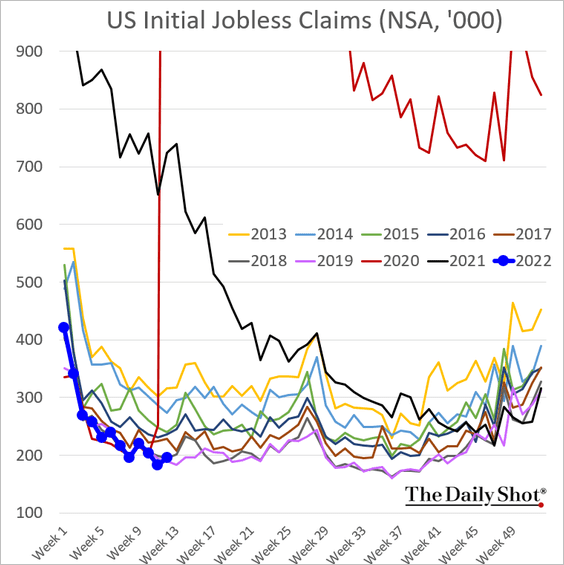
5. Next, we have some updates on the labor market.
• Jobless claims ticked up last week but remain near multi-decade lows.
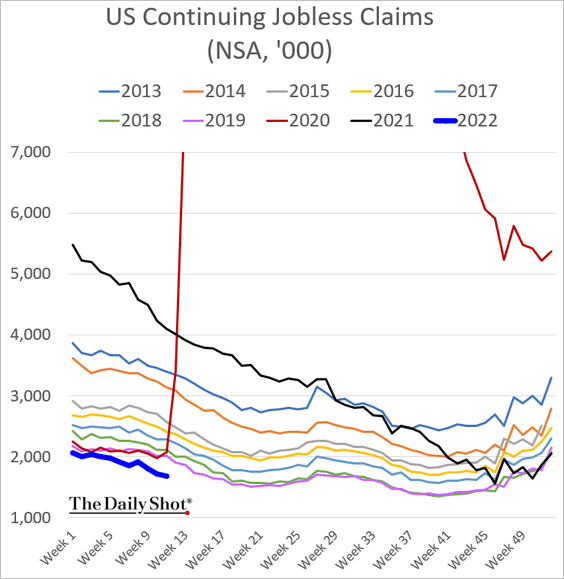
Here are the continuing claims.
• Morgan Stanley expects to see 550k new jobs created in March, …
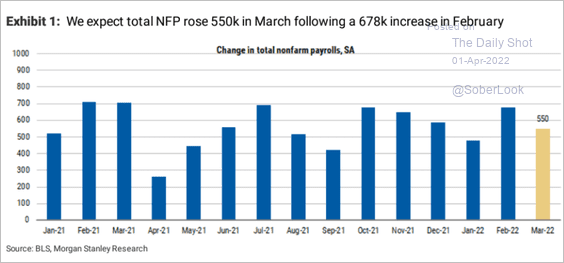 Source: Morgan Stanley Research
… with the unemployment rate dropping to 3.6%.
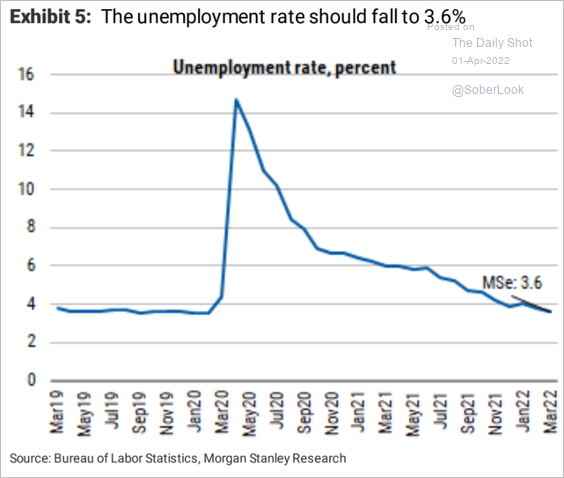 Source: Morgan Stanley Research
• US manufacturing job postings as a share of global vacancies are coming off the downward trend.
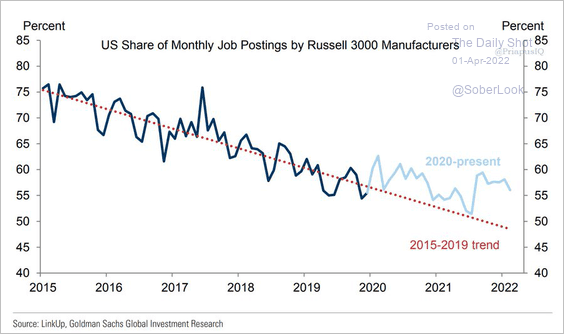 Source: Goldman Sachs; @PriapusIQ
• Unemployed workers are finding jobs quickly.
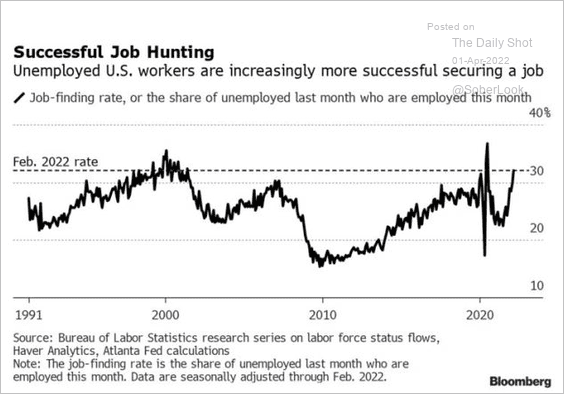 Source: Bloomberg Law Read full article
——————–
6. Based on the recent wage growth trend, the Fed could push rates above 4%.
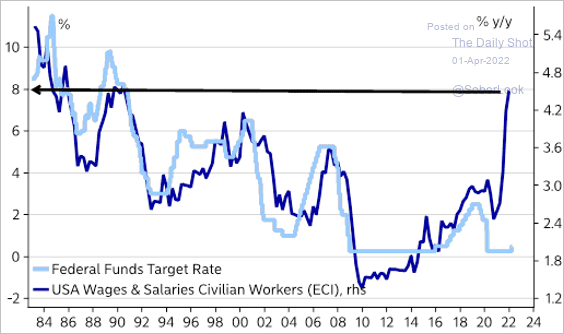 Source: @AndreasSteno
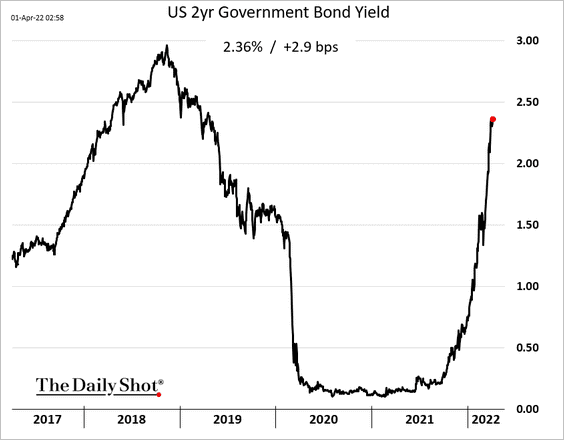
The 2-year Treasury yield continues to climb.
——————–
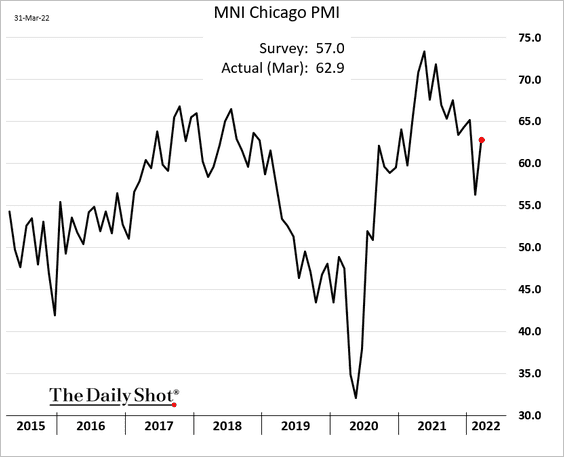
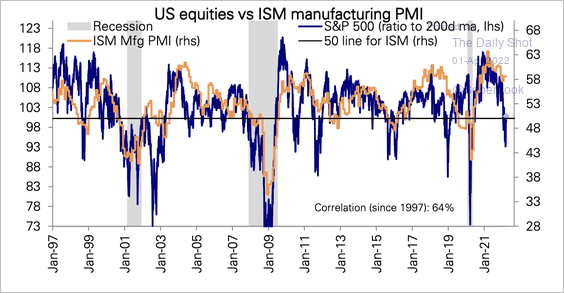
7. The Chicago PMI index jumped in March, which bodes well for the ISM Manufacturing PMI at the national level.
8. Mobility continues to improve.
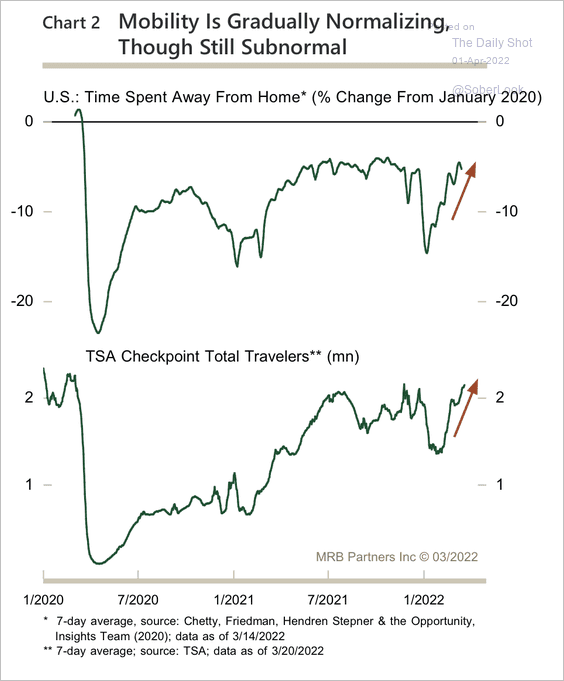 Source: MRB Partners
Back to Index
Canada
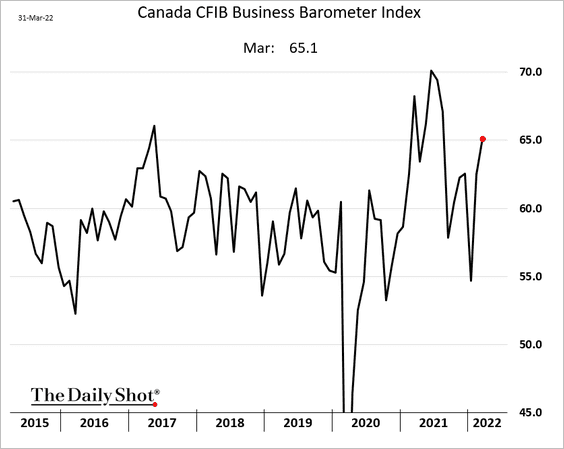
1. Small/medium-size business activity climbed further in March.
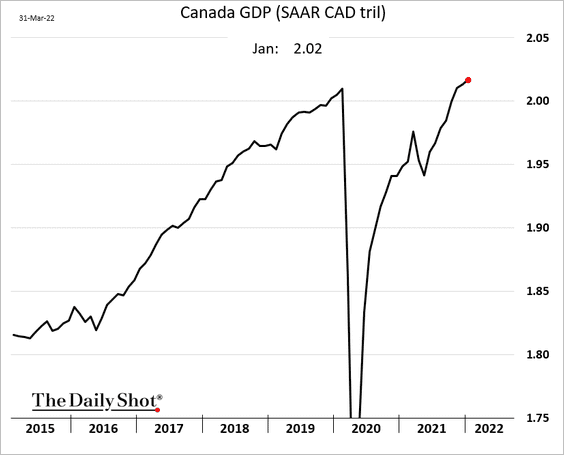
2. Canada’s GDP continued to rise in January (roughly in line with forecasts).
Back to Index
The Eurozone
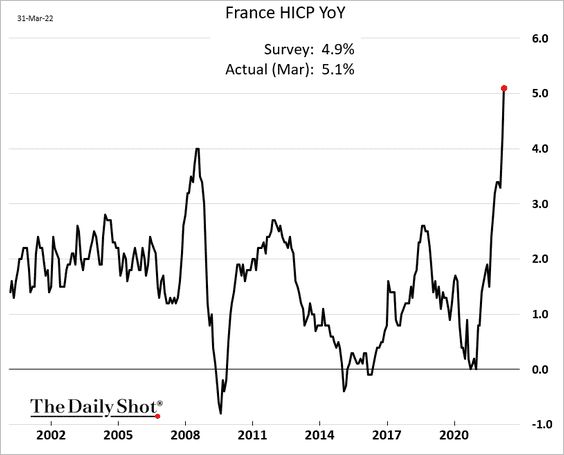
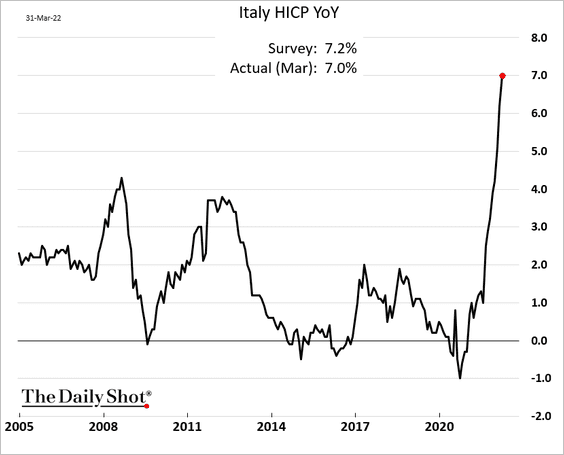
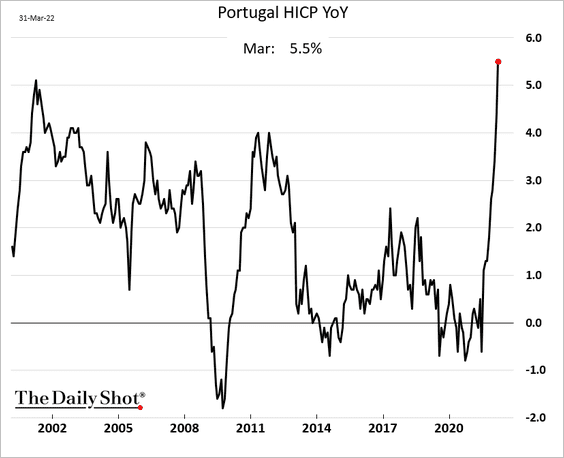
1. The euro area saw more reports of surging inflation on Thursday.
• France:
• Italy:
• Portugal:
——————–
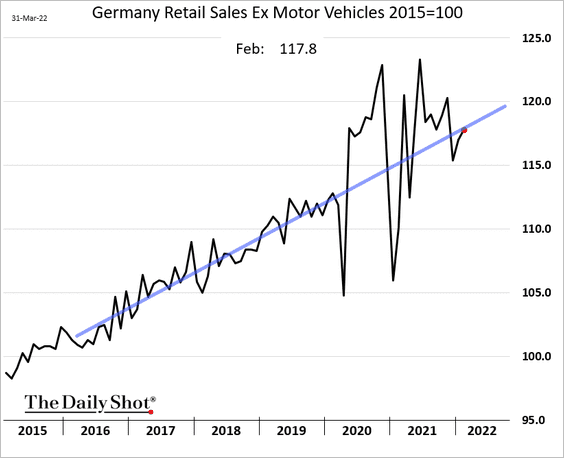
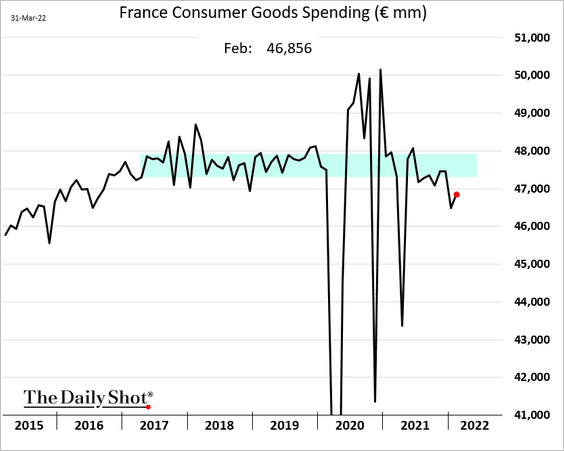
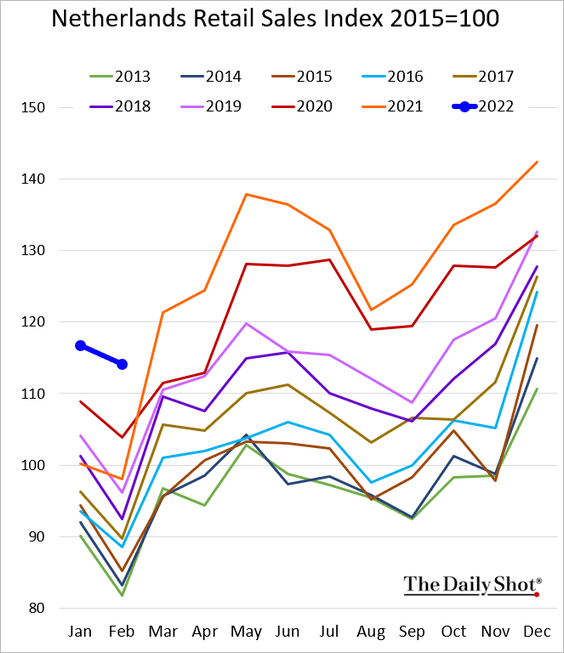
2. German retail sales were below forecasts but are now back on the pre-COVID trend.
• French consumer spending on goods remains below pre-pandemic levels.
• Dutch retail sales were very strong in February.
——————–
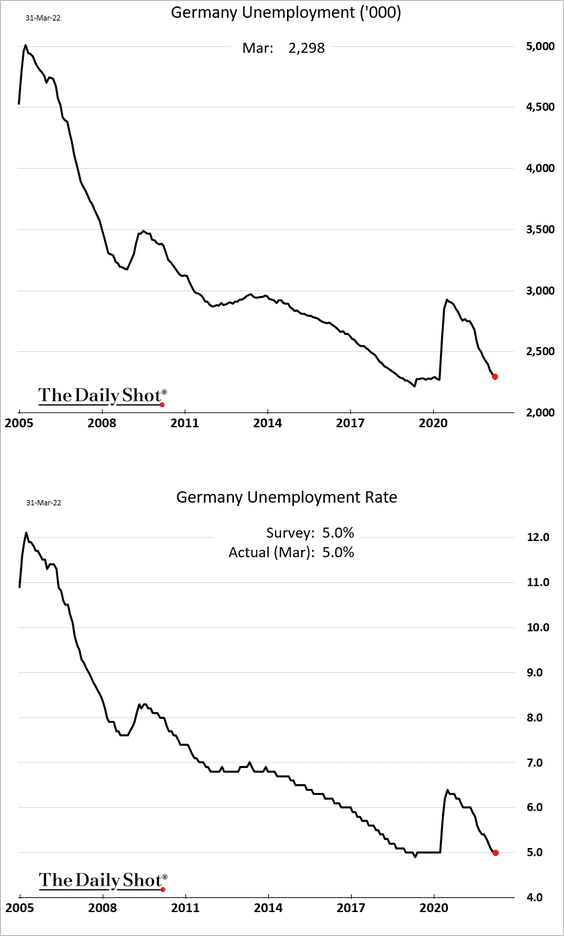
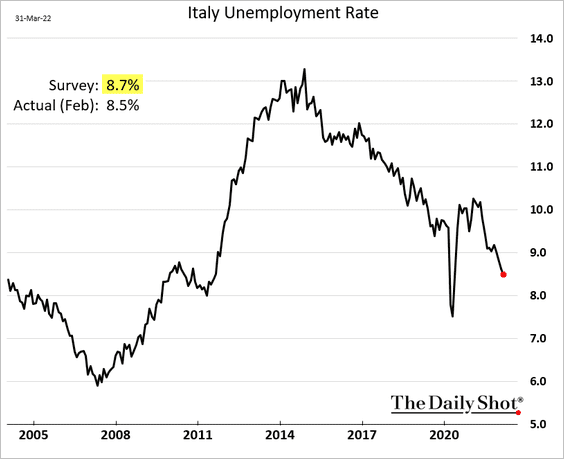
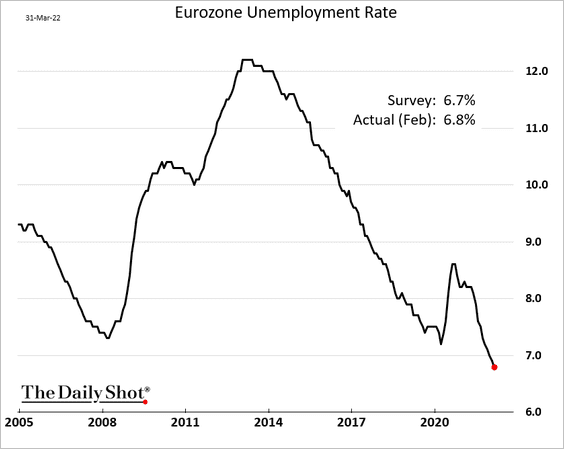
3. Unemployment trends continue to show improvement, and economists expect tight labor markets to persist.
• Germany:
• Italy:
• The Eurozone:
——————–
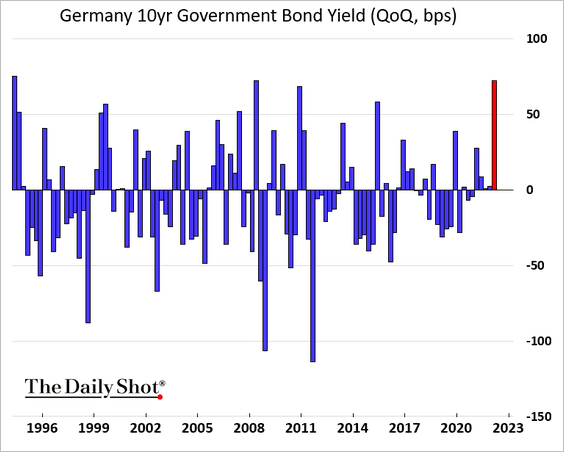
4. The jump in Bund yields in Q1 was massive.
Back to Index
Europe
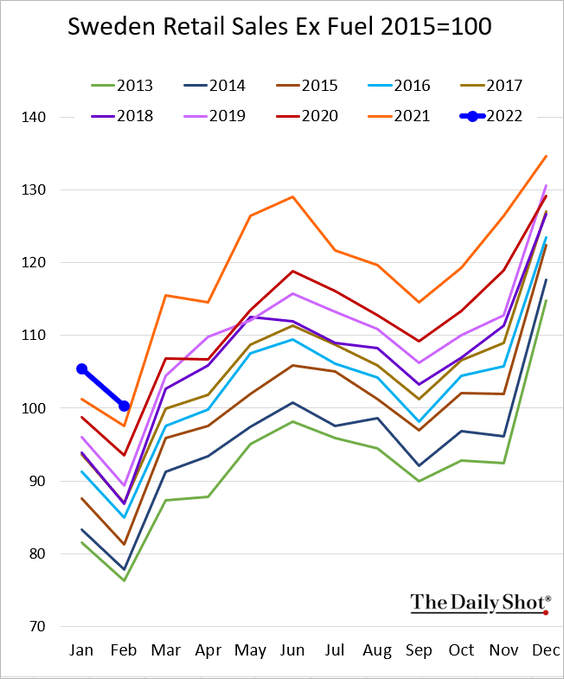
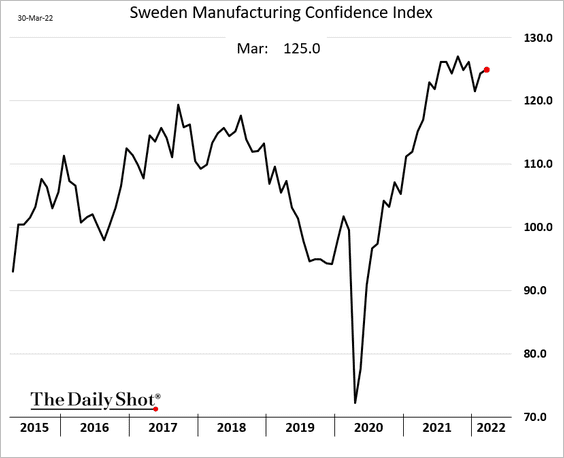
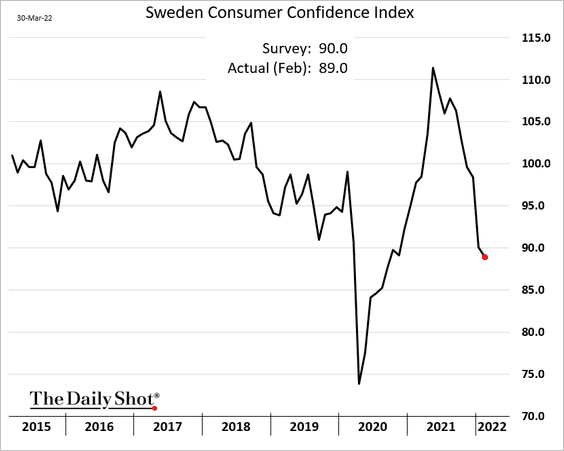
1. Let’s begin with some updates on Sweden.
• Retail sales (still quite strong in February):
• Manufacturing confidence (resilient):
• Consumer confidence (moving lower):
——————–
2. April is historically a good month to be long European shares.
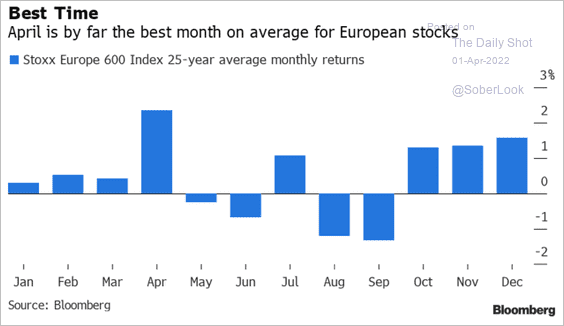 Source: @mikamsika Read full article
3. Who works the longest hours in the EU?
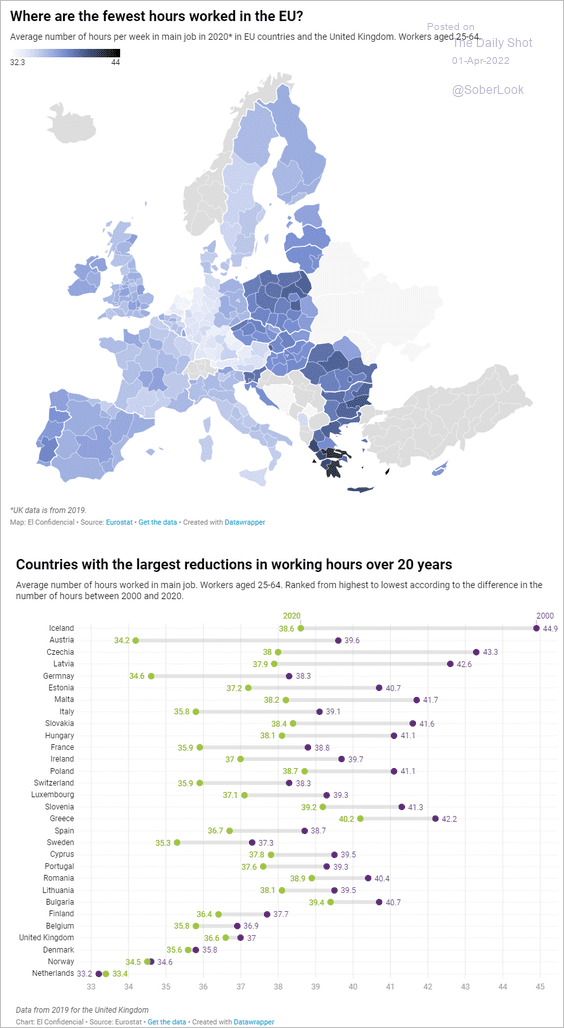 Source: EDJNet Read full article
Back to Index
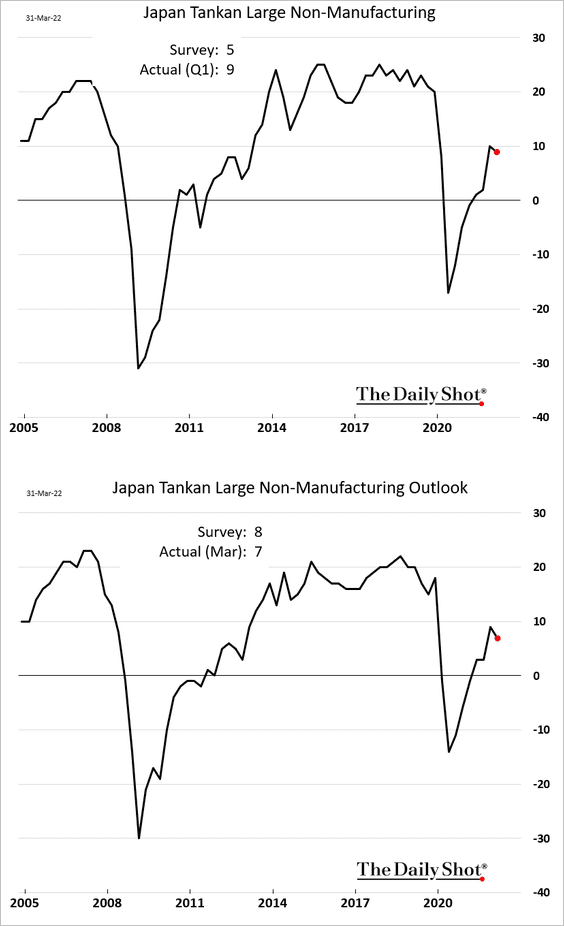
Japan
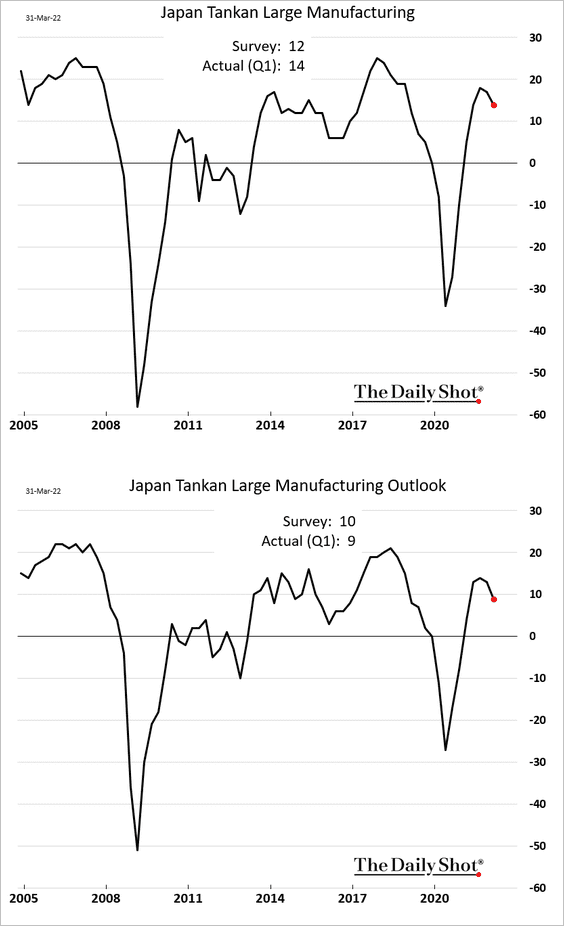
1. The Tankan report showed a weaker business outlook, but suggests resilient business activity for now.
• Manufacturing:
• Non-manufacturing:
——————–
2. Yen sentiment indicators are the most negative in nearly a decade.
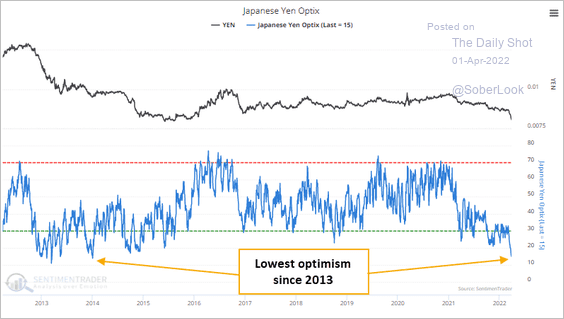 Source: SentimenTrader
Back to Index
Asia – Pacific
1. South Korea’s manufacturing growth eased sharply in March.
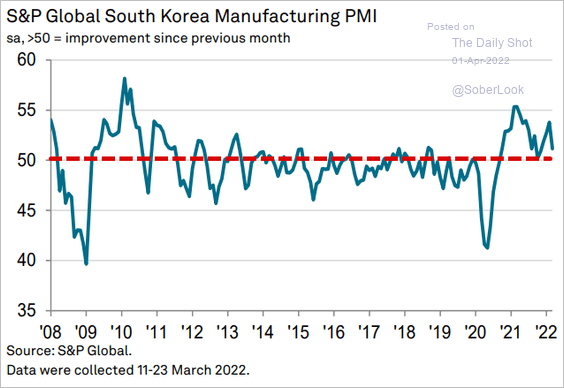 Source: IHS Markit
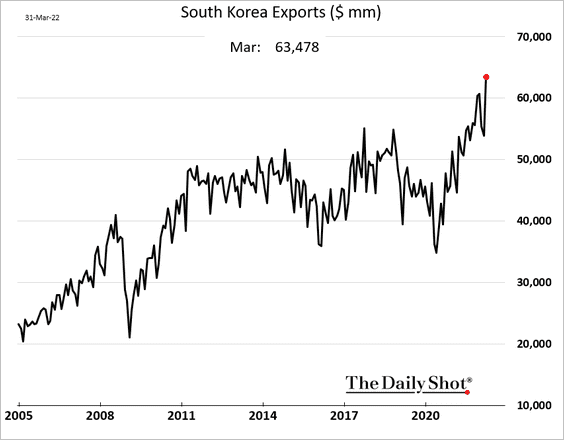
But exports hit a record high.
——————–
2. Taiwan’s manufacturing growth held steady.
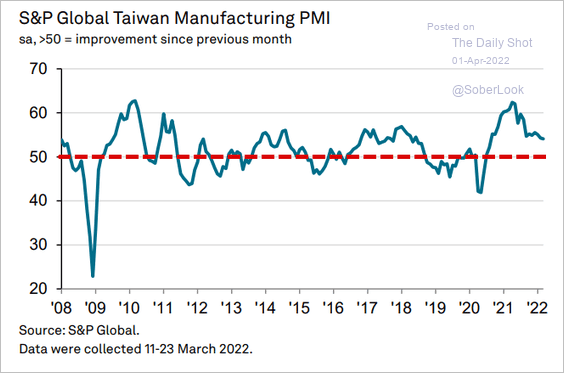 Source: IHS Markit
3. The market sees the RBA pushing rates above 3%.
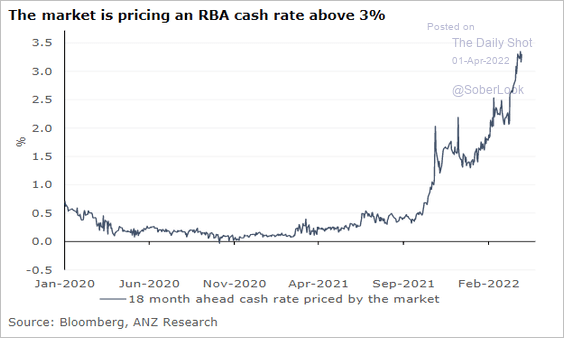 Source: @ANZ_Research, @DavidPlank12
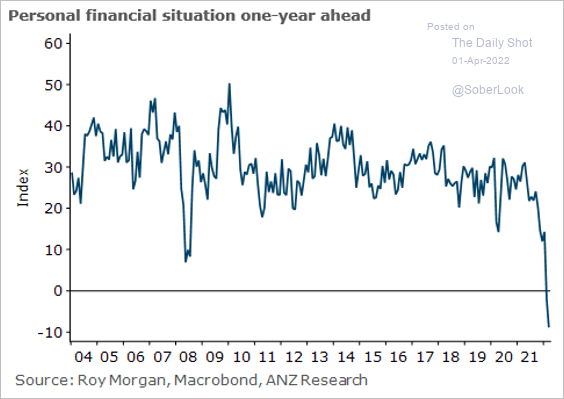
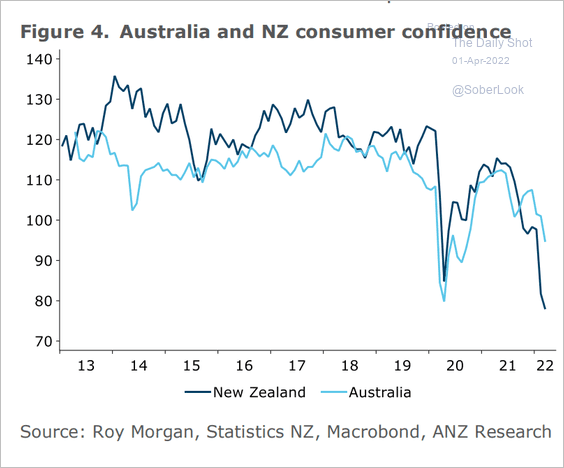
4. New Zealand’s consumer confidence hit a multi-decade low, …
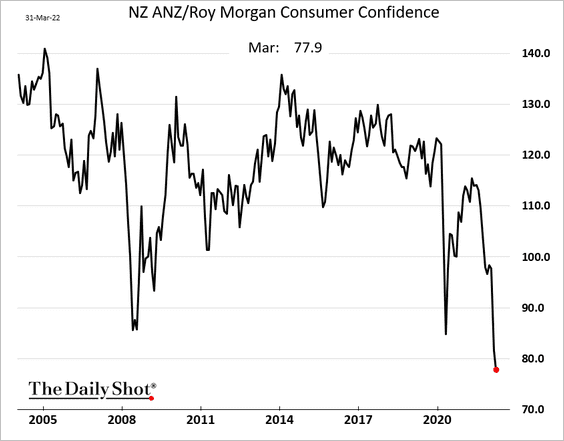
 Source: @sharon_zollner
… diverging sharply from Australia.
 Source: ANZ Research
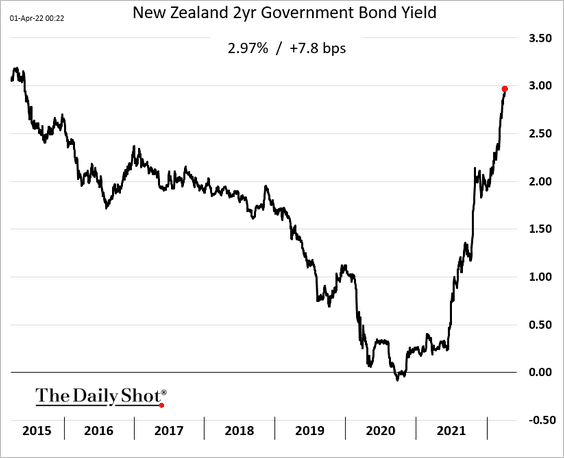
• New Zealand’s 2-year yield is nearing 3% for the first time since 2015.
Back to Index
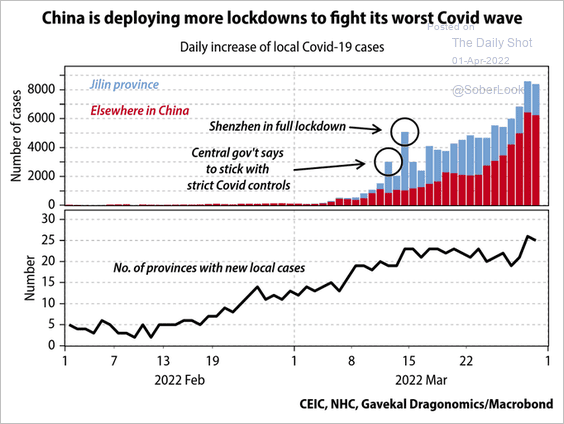
China
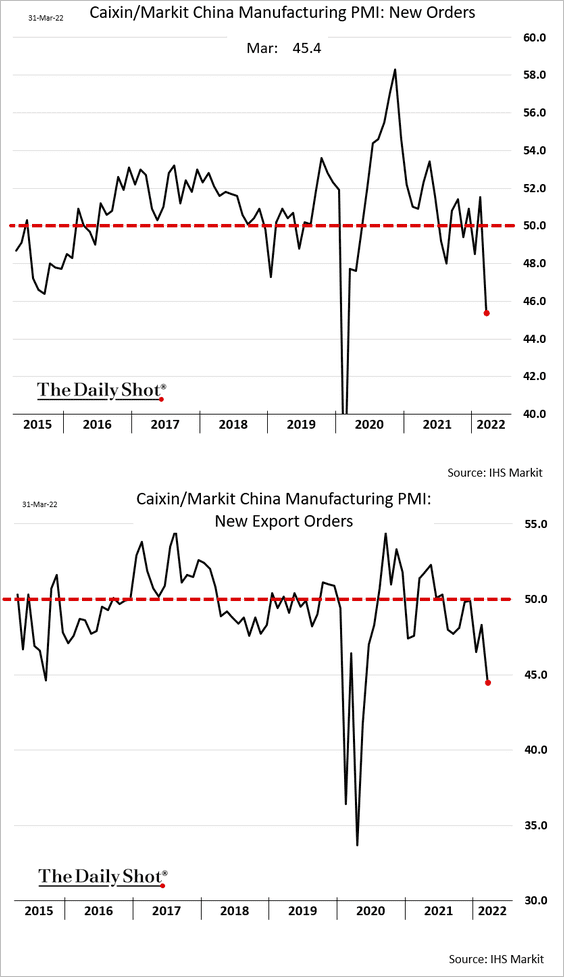
1. The Markit PMI confirmed the official figures showing manufacturing contraction in March …
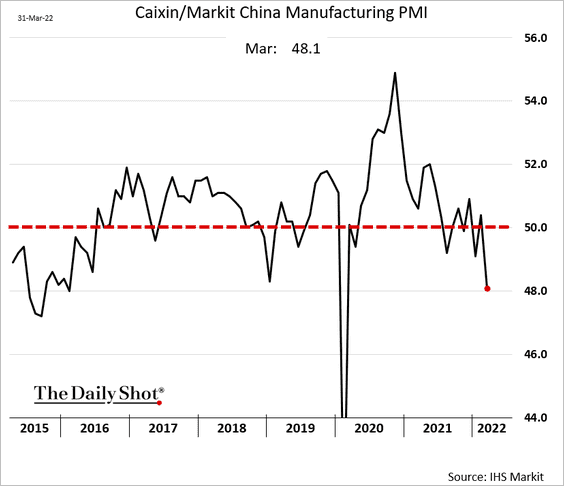
… amid lockdowns.
 Source: @Gavekal
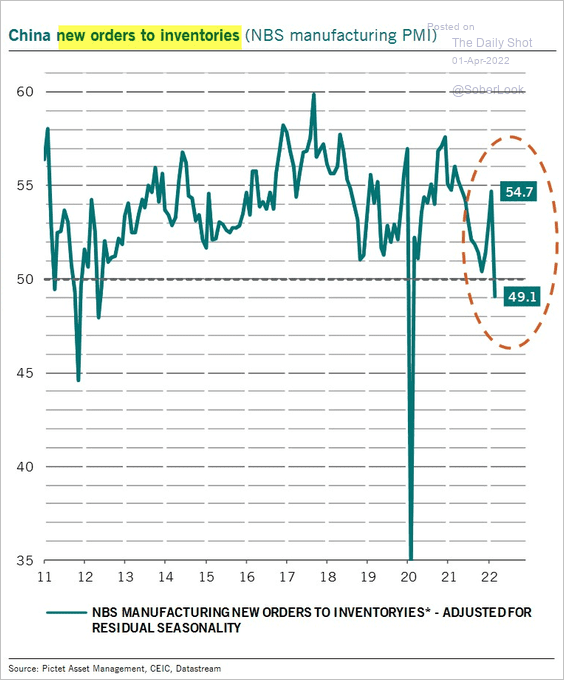
Factory orders deteriorated sharply.
This chart shows the orders-to-inventories index from the official PMI data.
 Source: @PkZweifel
——————–
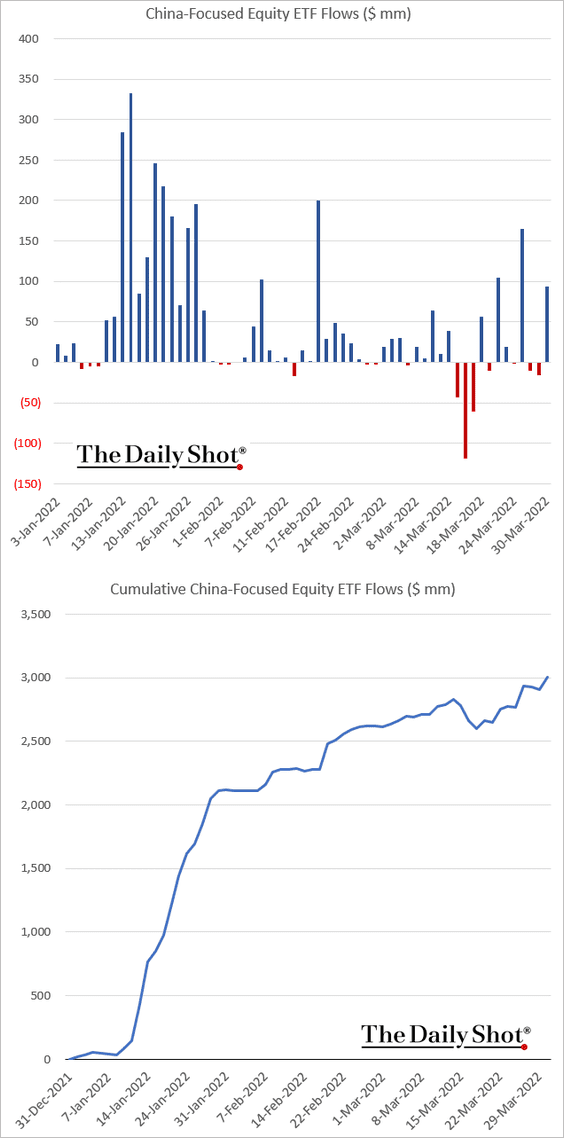
2. Flows into China-focused equity ETFs resumed their upward trend after the massive selloff a couple of weeks ago.
3. Funding costs in China remain low.
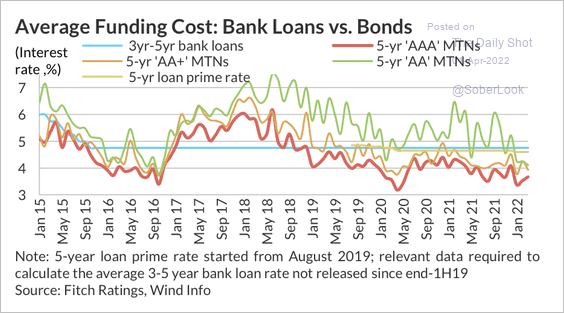 Source: Fitch Ratings
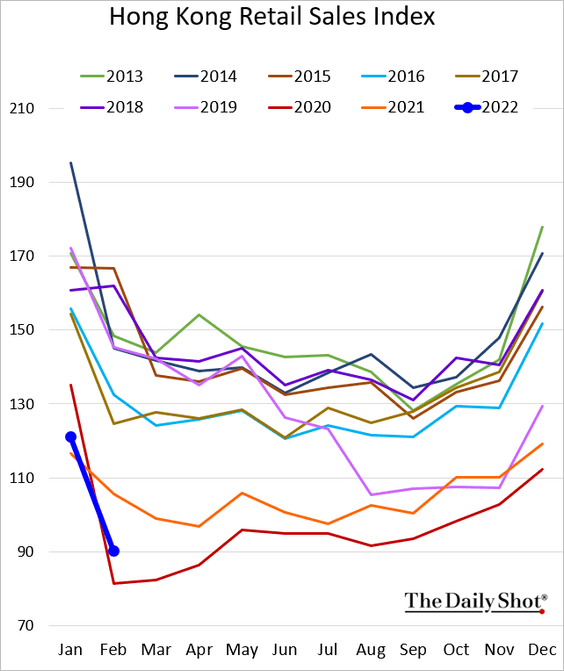
4. Hong Kong’s retail sales were soft in February.
Back to Index
Emerging Markets
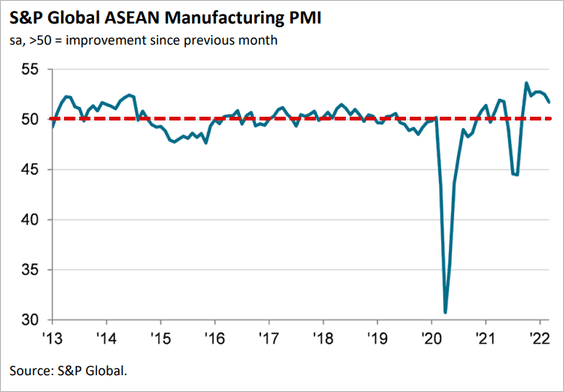
1. EM Asia PMIs declined in most economies, but factory activity remained in growth mode (with one exception).
• ASEAN:
• Indonesia:
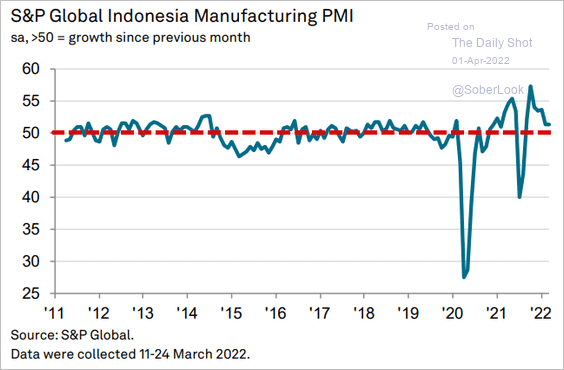 Source: IHS Markit
• Malaysia (back in contraction):
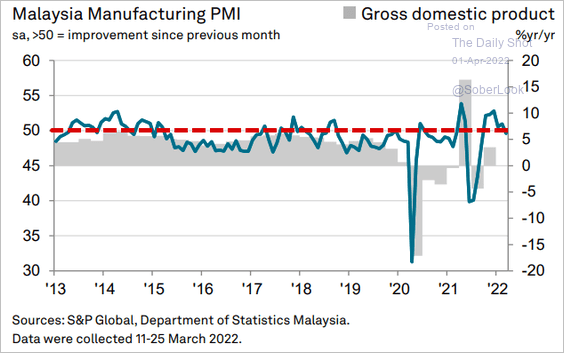 Source: IHS Markit
• The Philippines (accelerating):
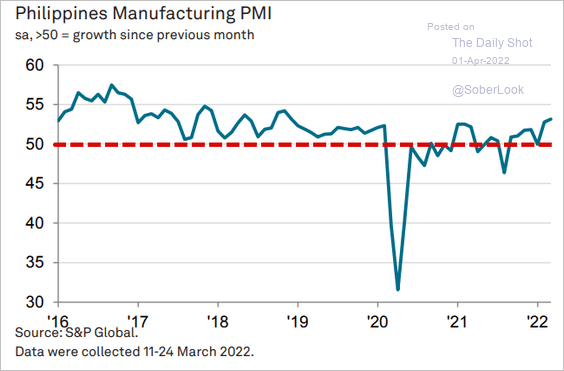 Source: IHS Markit
• Thailand:
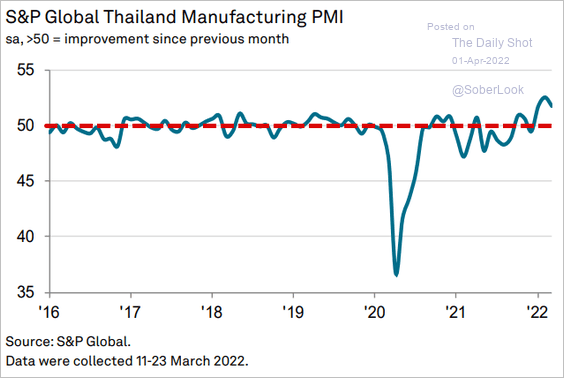 Source: IHS Markit
• Vietnam:
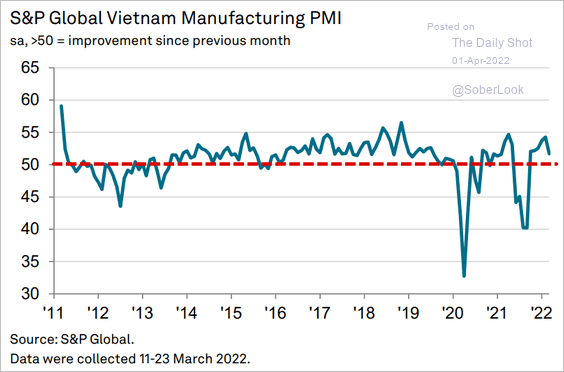 Source: IHS Markit
——————–
2. India’s industrial output was strong in February.
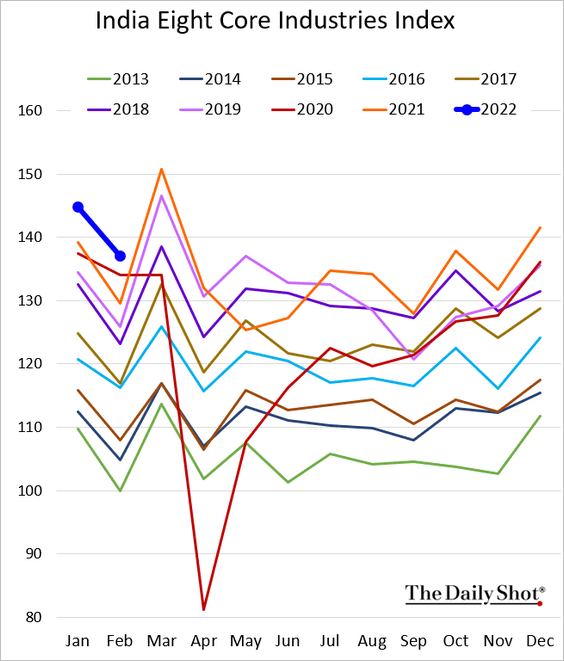
The budget deficit is surging.
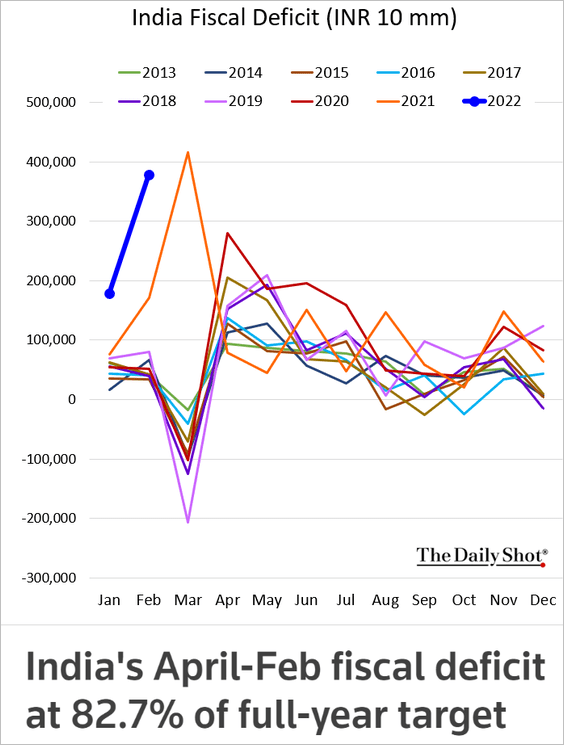 Source: Reuters Read full article
——————–
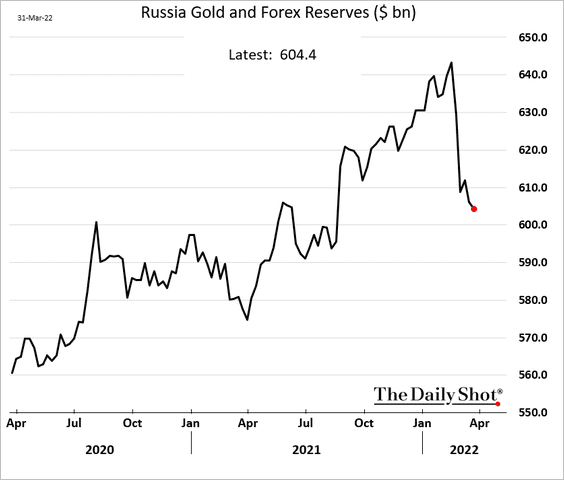
3. Russia’s F/X reserves declined since the start of the war.
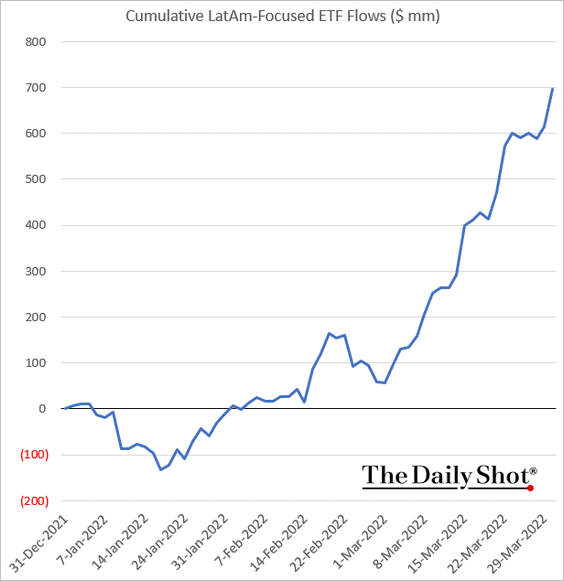
4. LatAm-focused ETFs outperformed in March, …
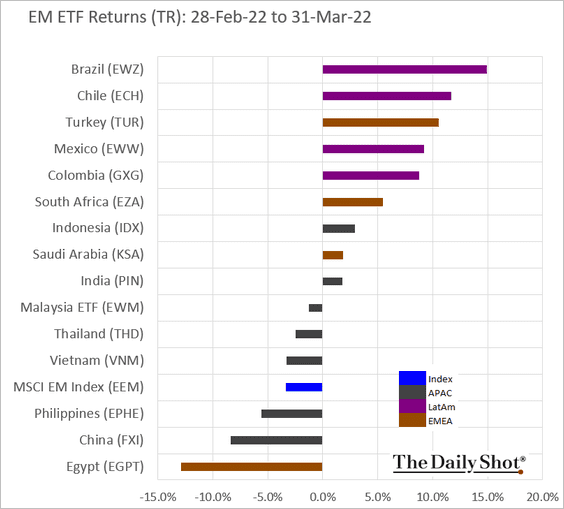
… as fund inflows surged.
Back to Index
Cryptocurrency
1. On Thursday, the EU voted to outlaw anonymous crypto transactions, which weighed on crypto prices.
 Source: CoinDesk Read full article
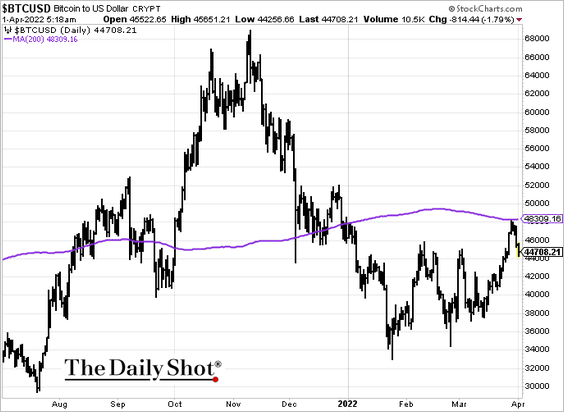
2. Bitcoin held resistance at the 200-day moving average.
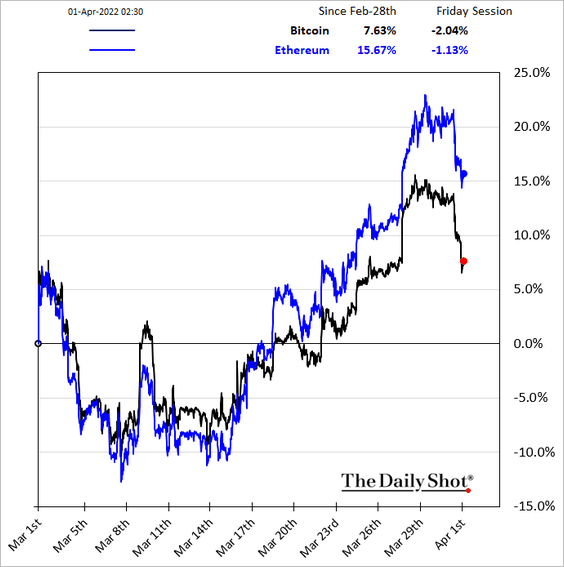
3. Ether has been outperforming.
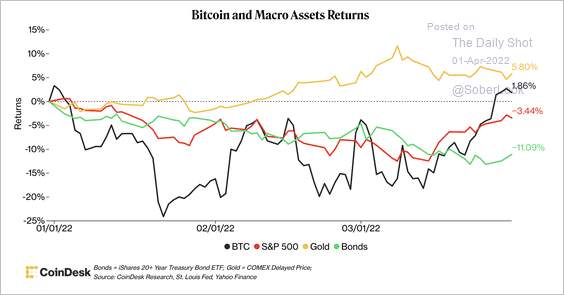
4. Bitcoin is outperforming the S&P 500 so far this year but has lagged gold.
 Source: CoinDesk Read full article
5. Altcoins outperformed bitcoin in March, indicating a stronger appetite for risk among crypto traders.
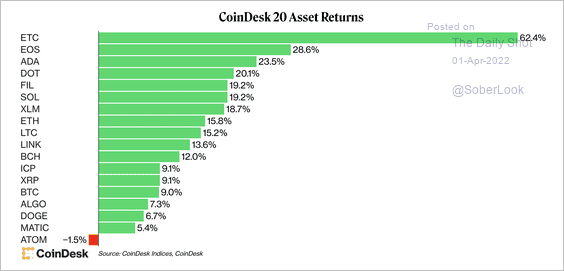 Source: CoinDesk Read full article
6. Bitcoin is entering a seasonally strong period.
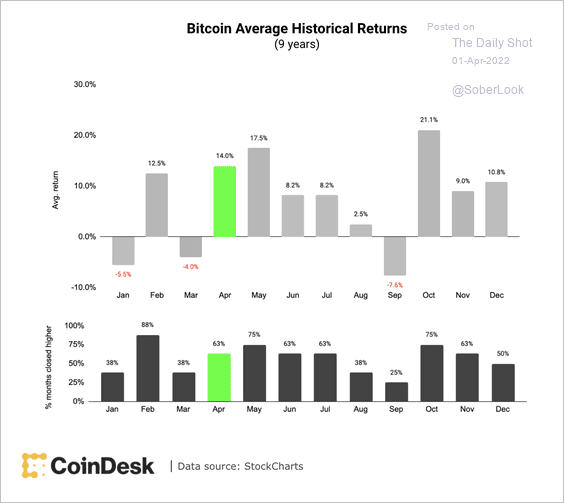 Source: CoinDesk Read full article
7. Tether and USDC continue to dominate the stablecoin market, …
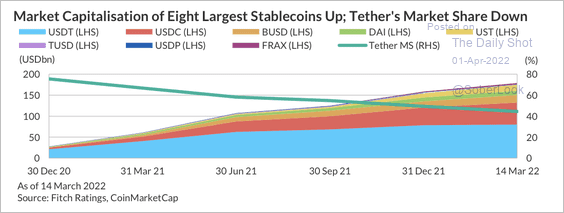 Source: Fitch Ratings
…although price action has not been stable.
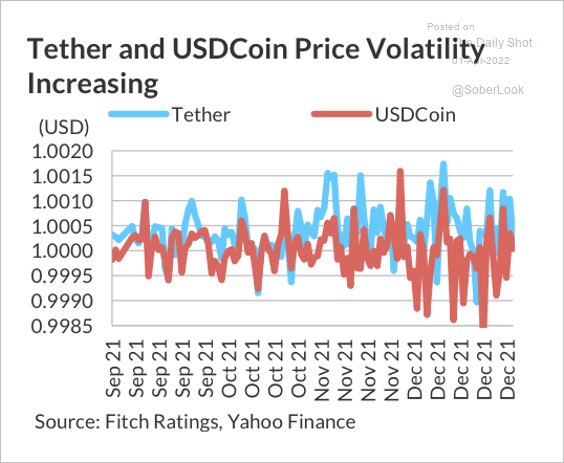 Source: Fitch Ratings
8. Here is a look at Tether’s reserves.
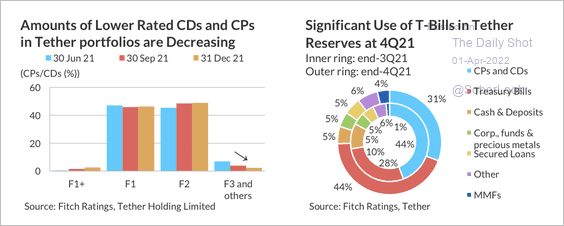 Source: Fitch Ratings
9. Will we see more transparency in the stablecoin market?
 Source: CoinDesk Read full article
Back to Index
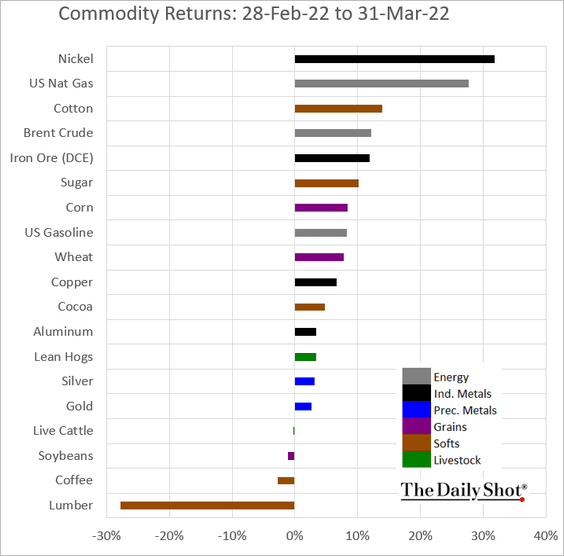
Commodities
Here is last month’s performance across the key commodity markets.
Back to Index
Energy
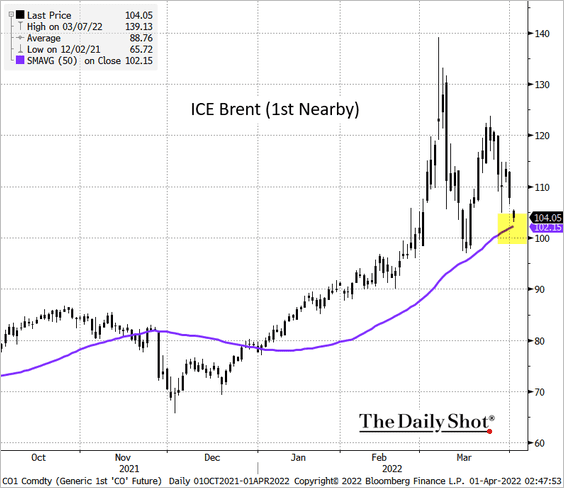
1. Brent crude is testing support at the 50-day moving average.
Fitch expects oil prices to remain elevated due to tight supply conditions.
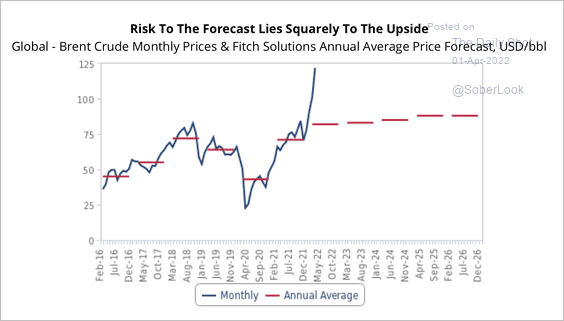 Source: Fitch Solutions Macro Research
——————–
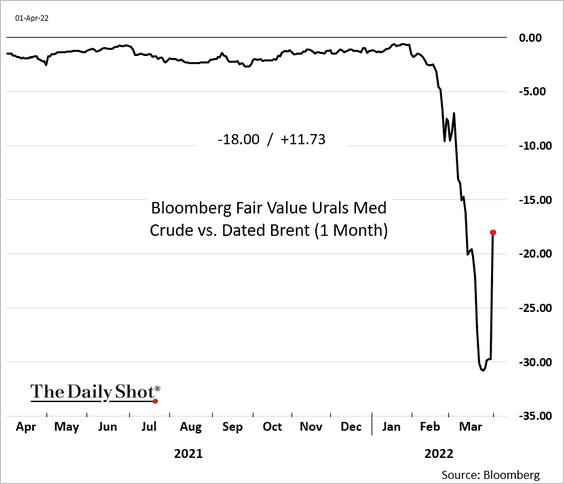
2. Russian crude oil discount to Brent is shrinking.
3. US natural gas prices have been climbing again, …
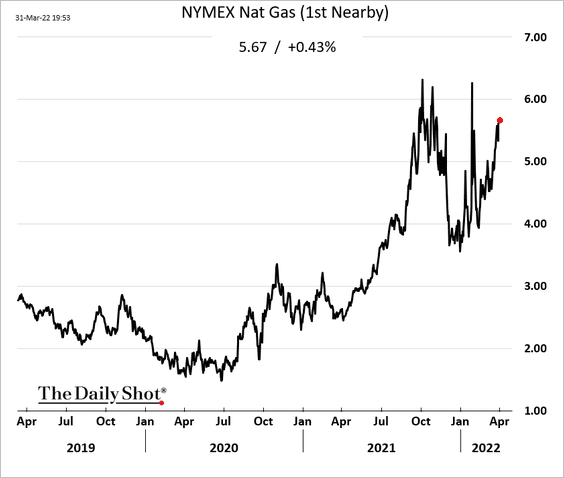
… as rising US LNG exports …
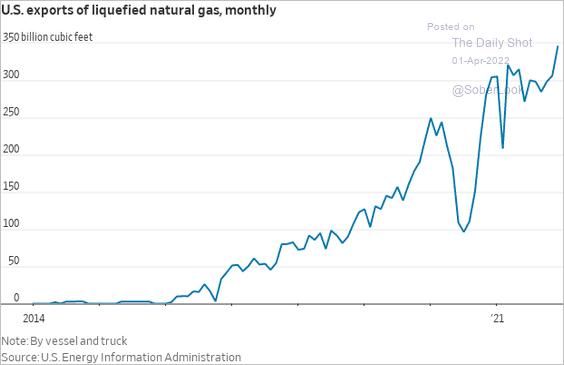 Source: @WSJ Read full article
… tighten domestic supplies.
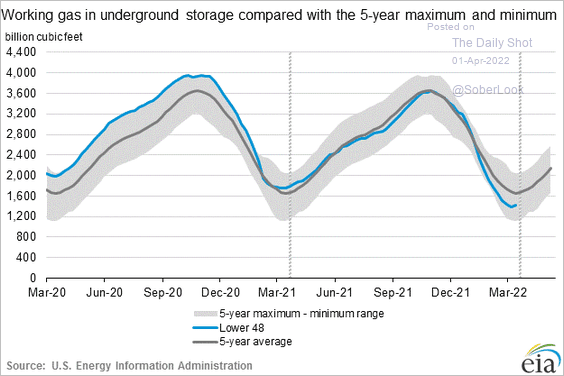
US LNG capacity keeps climbing.
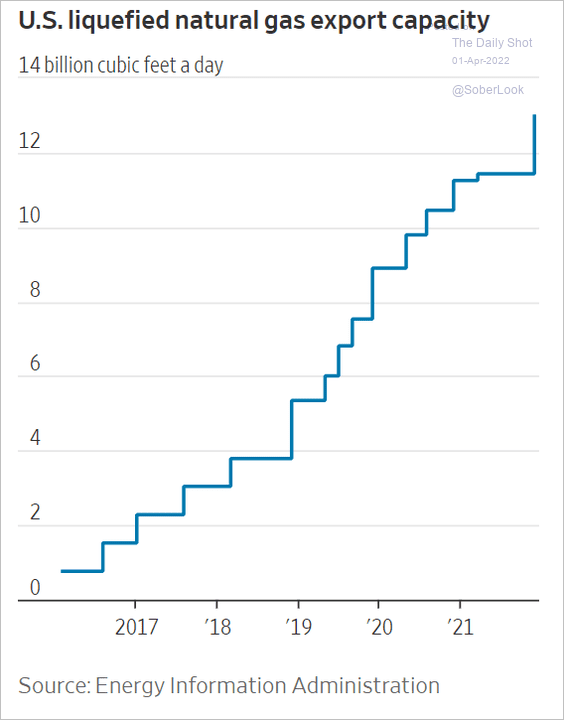 Source: @WSJ Read full article
And this chart shows planned US liquefaction projects.
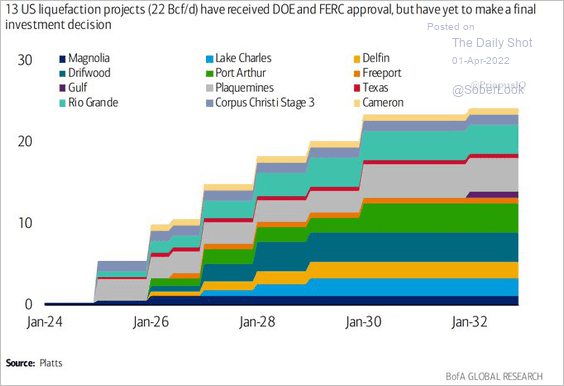 Source: BofA Global Research; @PriapusIQ
——————–
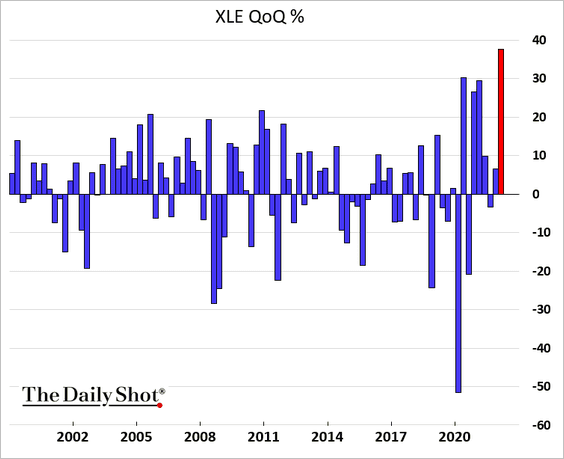
4. It’s been an impressive quarter for energy equities.
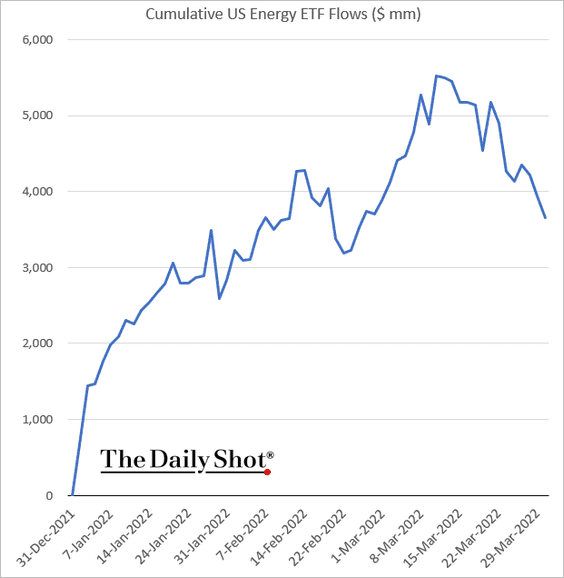
But energy equity ETFs have been seeing outflows lately.
——————–
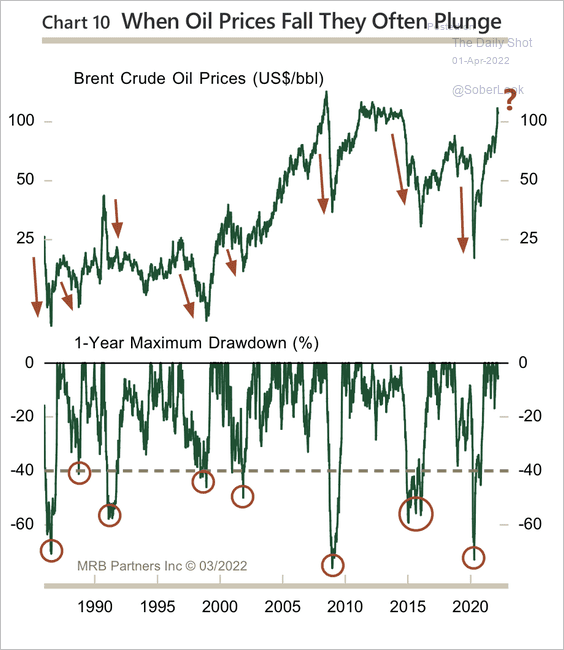
5. Major oil price declines tend to be sharp.
 Source: MRB Partners
Back to Index
Equities
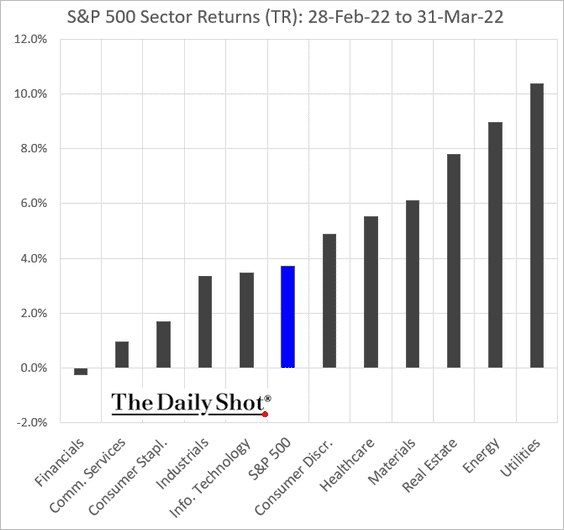
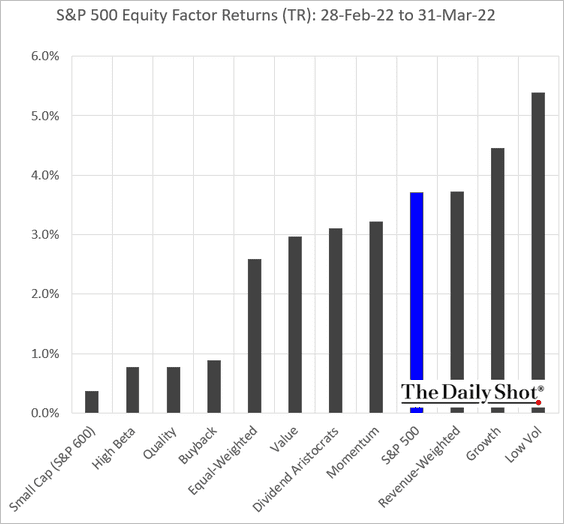
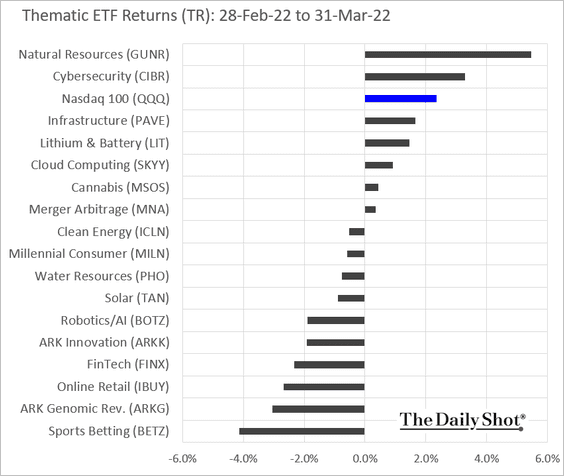
1. Let’s begin with the March performance charts.
• Sectors:
• Equity factors:
• Thematic ETFs:
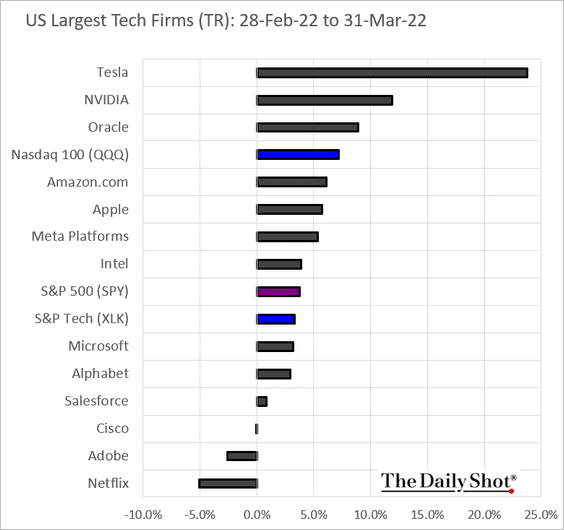
• The largest tech firms:
——————–
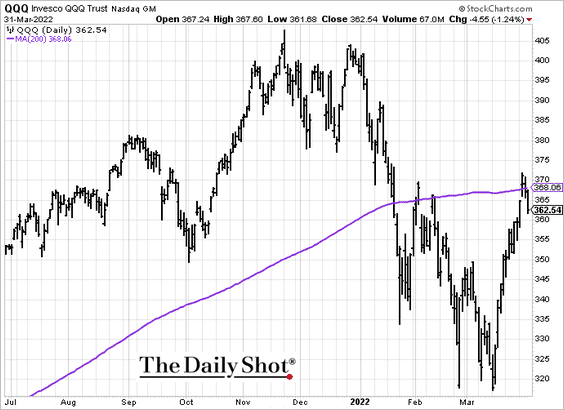
2 The Nasdaq 100 failed to hold above the 200-day moving average.
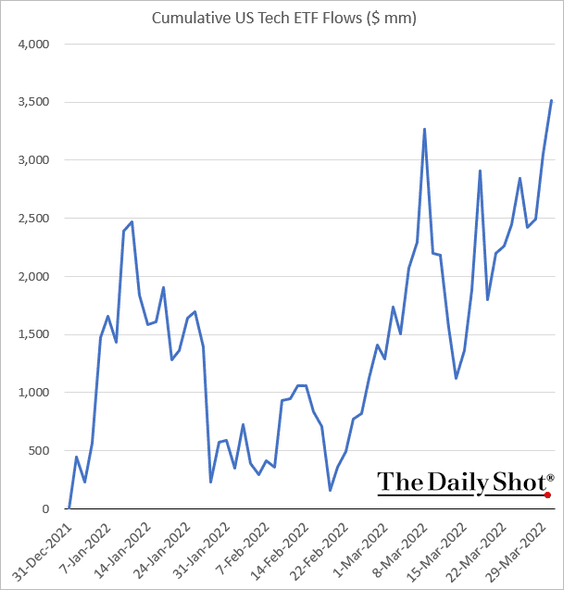
3. Tech ETF inflows remain strong.
4. Discretionary investor positioning has moved above neutral, while systematic strategies are still extremely underweight equities.
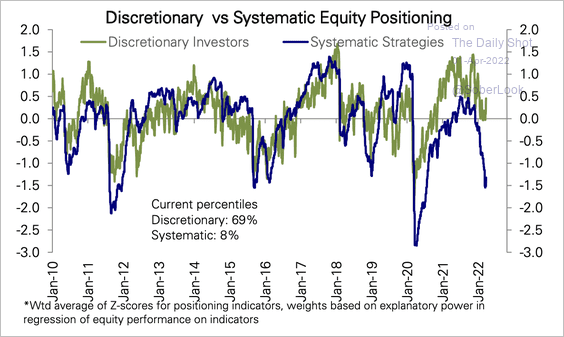 Source: Deutsche Bank Research
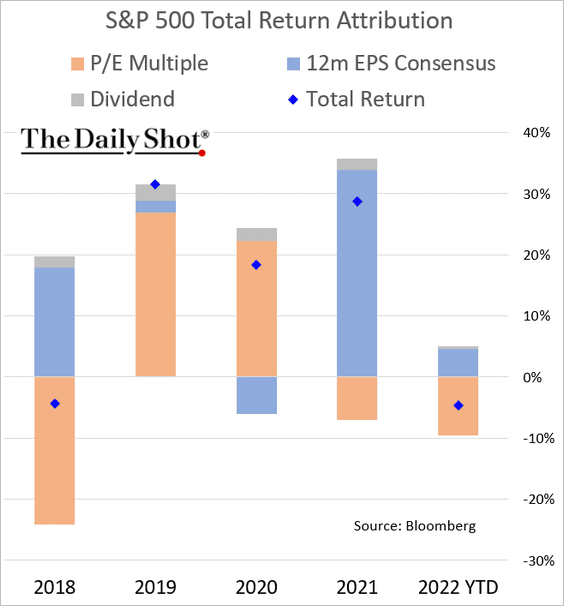
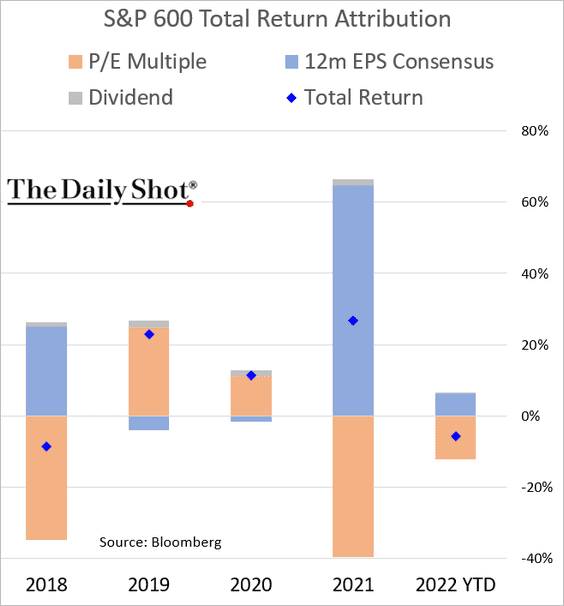
5. Next, we have the year-to-date attribution charts.
• S&P 500:
• S&P 600 (small caps):
——————–
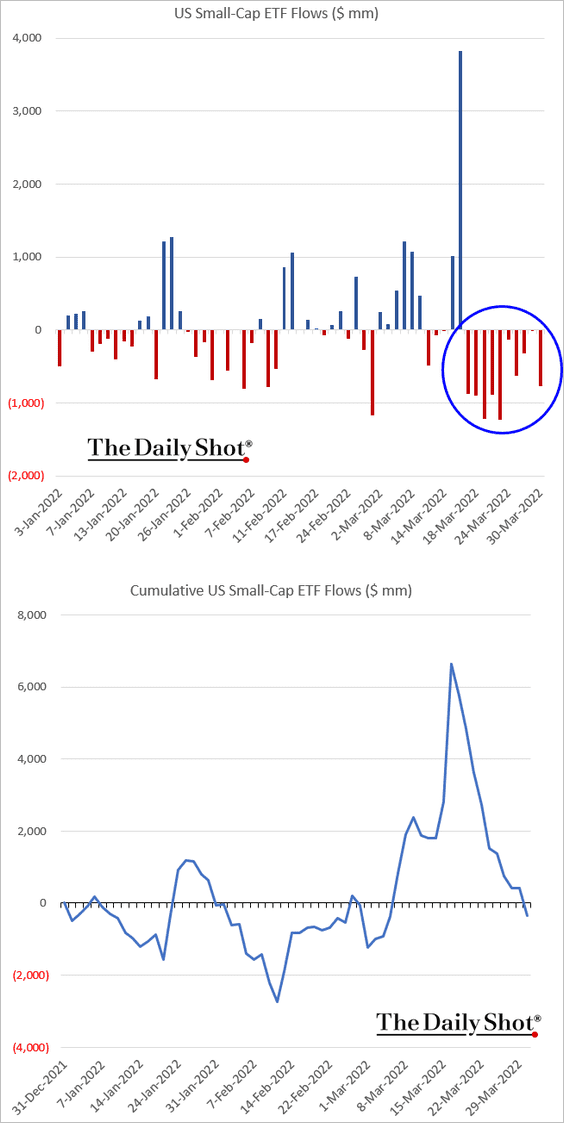
6. Small-cap ETFs continue to see outflows.
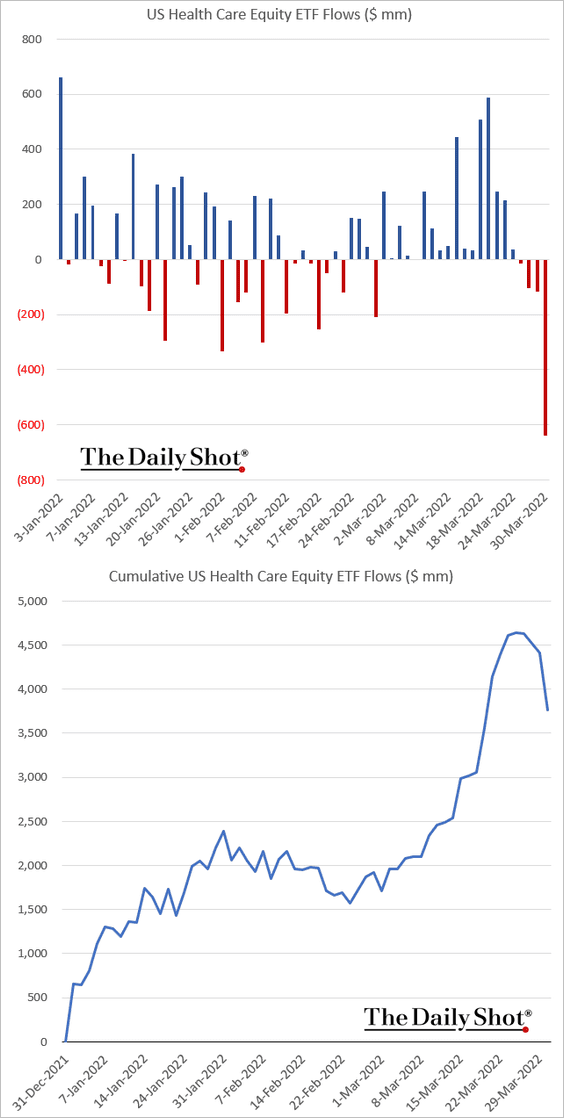
7. Health-care ETFs saw outflows this week.
8. The S&P 500 is still pricing in slower economic growth ahead.
 Source: Deutsche Bank Research
Back to Index
Credit
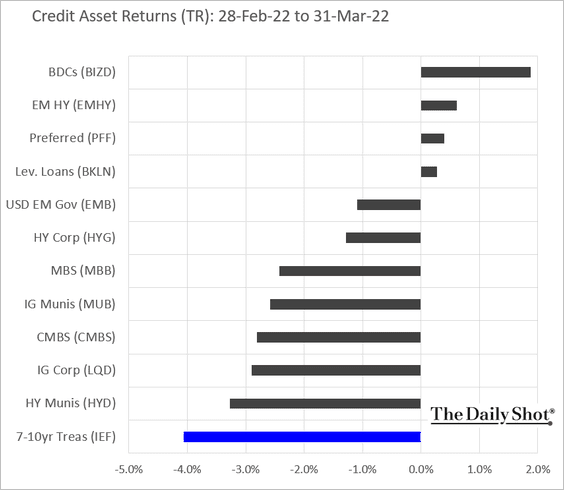
1. Let’s start with last month’s performance across credit asset classes.
2. Corporate funding costs are still relatively low.
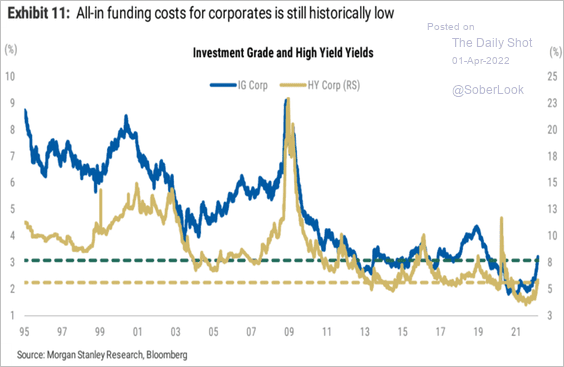 Source: Morgan Stanley Research
3. Interest coverage for corporations has been healthy.
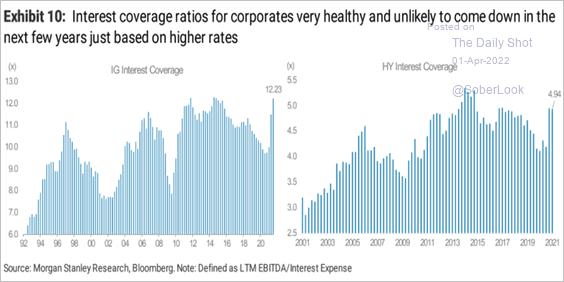 Source: Morgan Stanley Research
4. US loan growth has picked up again.
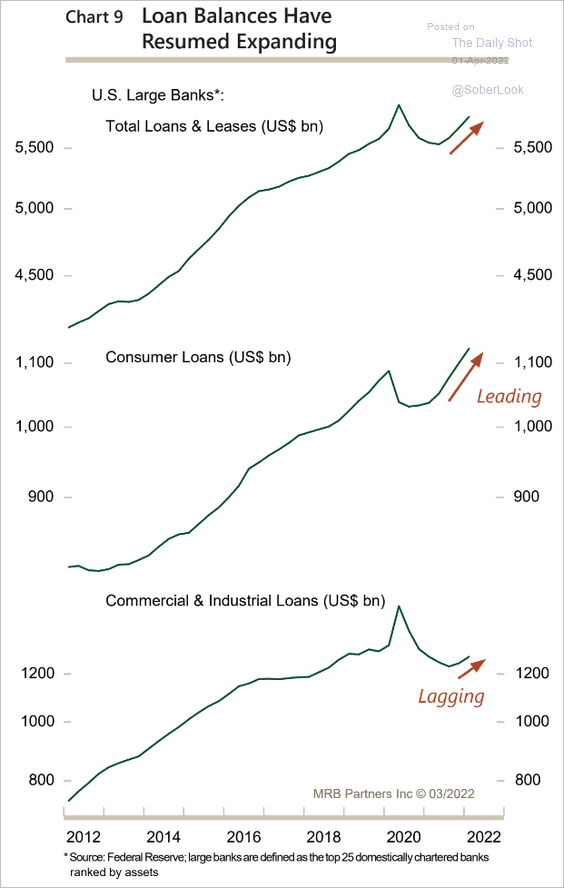 Source: MRB Partners
5. Deposit costs have been very low for US banks, driven by the drop in rates during the height of the pandemic and large deposit inflows from fiscal stimulus.
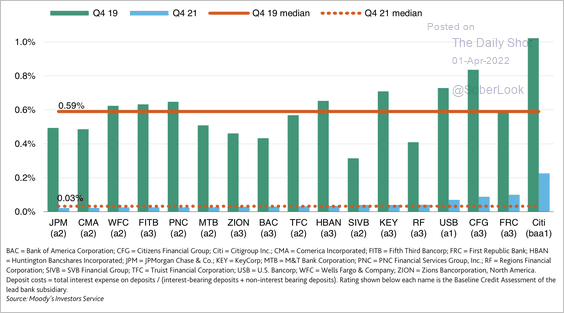 Source: Moody’s Investors Service
Back to Index
Rates
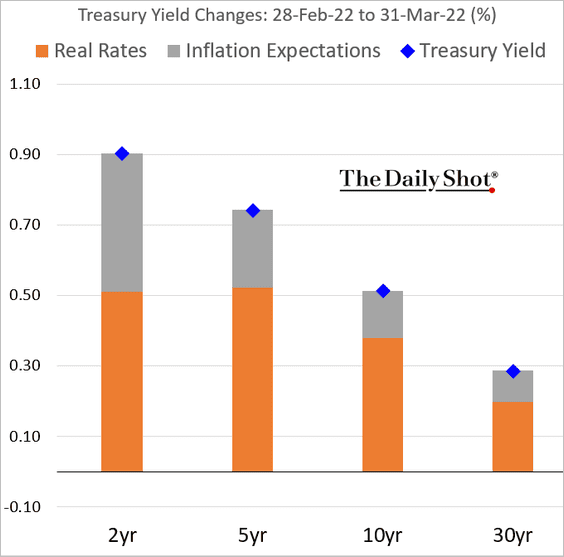
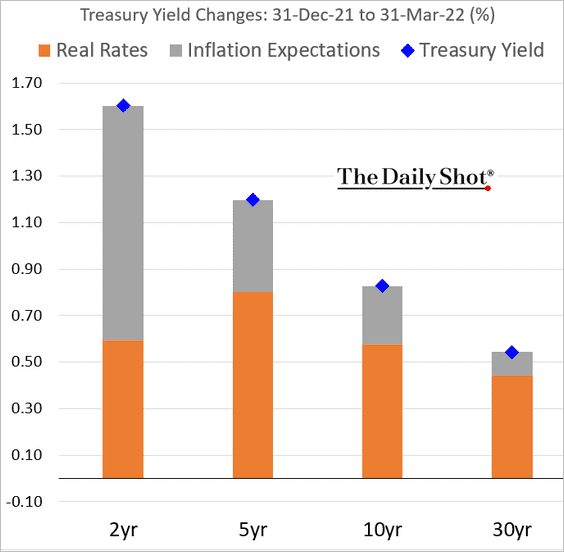
1. Here is a look at Treasury yield attribution.
• March:
• Q1:
——————–
2. Bond ETFs have been getting some inflows.
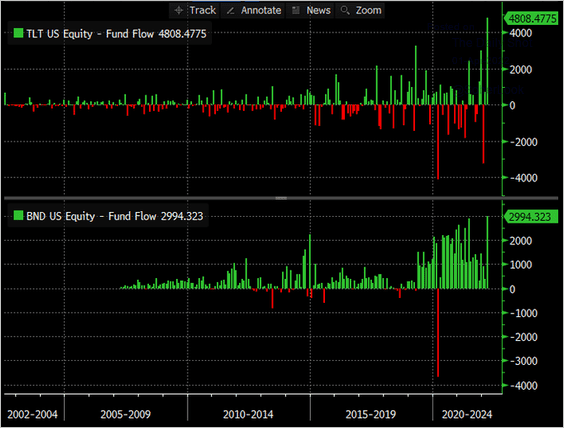 Source: @kgreifeld
3. Merrill Lynch’s clients remain extremely under-allocated to bonds.
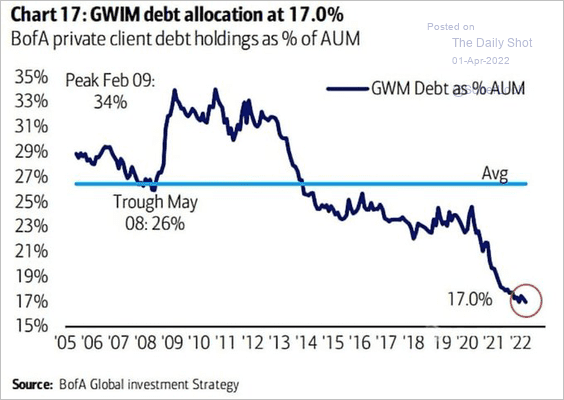 Source: BofA Global Research
Back to Index
Global Developments
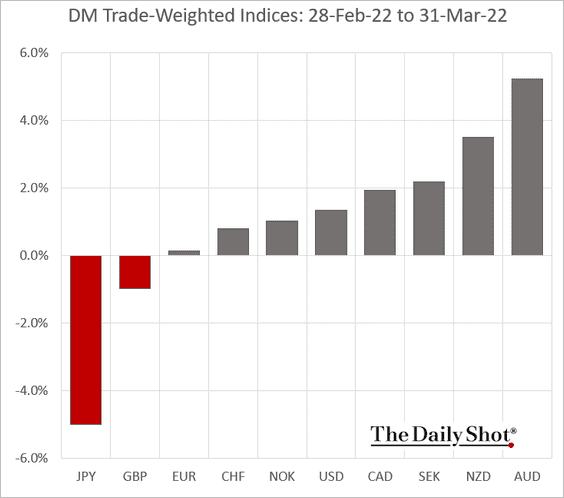
1. Let’s start with last month’s rates and currency moves in advanced economies.
• Trade-weighted currency indices:
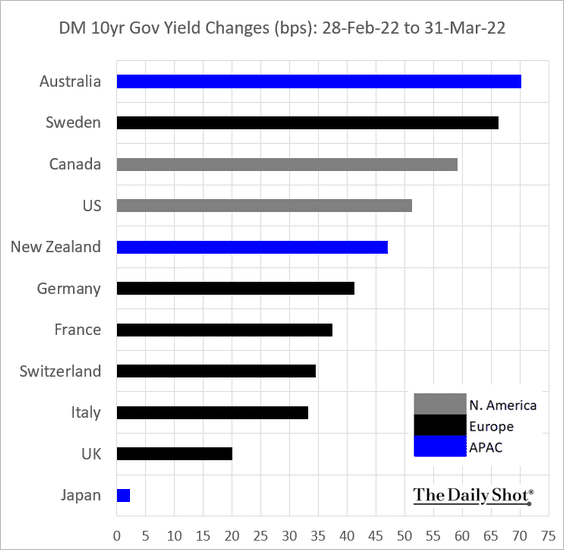
• Bond yields:
——————–
2. Leading indicators point to robust global trade.
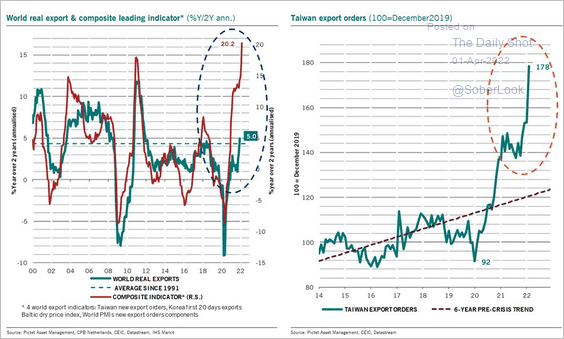 Source: @PkZweifel
3. Weakening global credit impulse signals softer economic activity ahead.
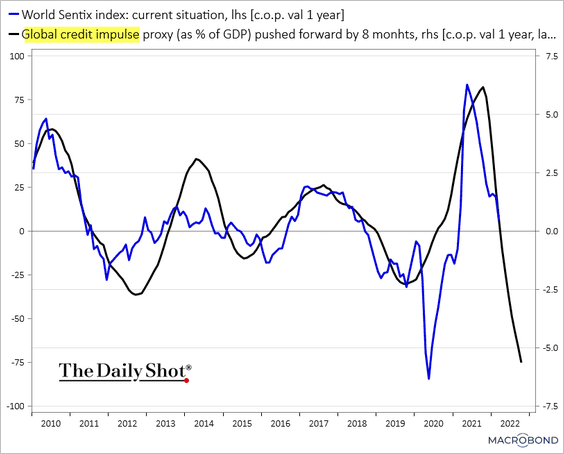 Source: Chart and data provided by Macrobond
Back to Index
Food for Thought
1. Asking for a raise:
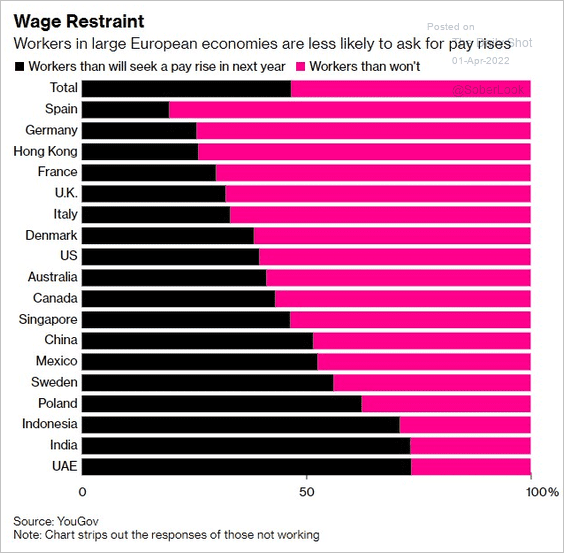 Source: @ZSchneeweiss, @_DavidGoodman Read full article
2. Internet crimes:
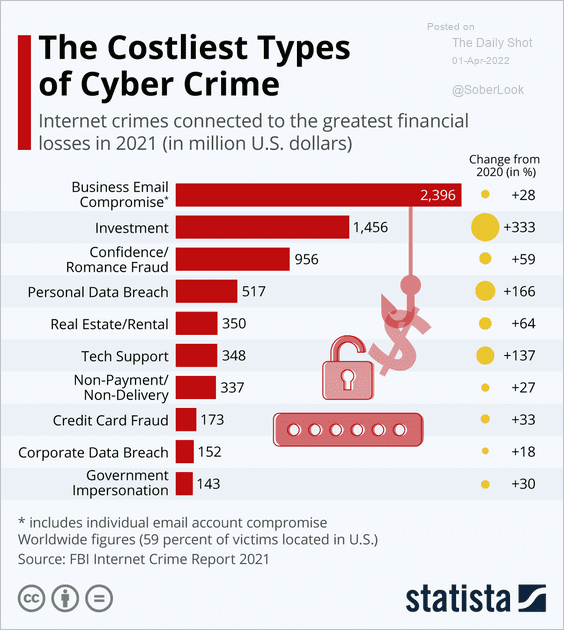 Source: Statista
3. Water stress:
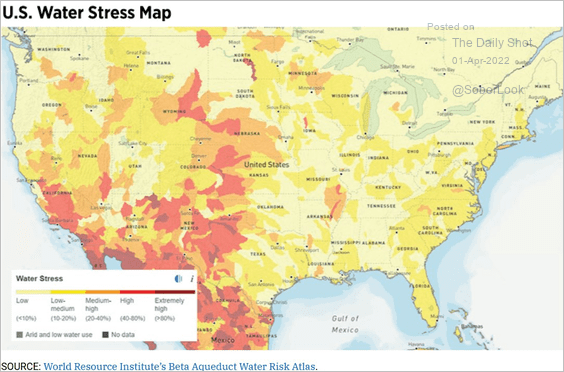 Source: @stlouisfed Read full article
4. Transportation sector emissions:
![]() Source: IEA; @ntsafos
Source: IEA; @ntsafos
5. Food insecurity:
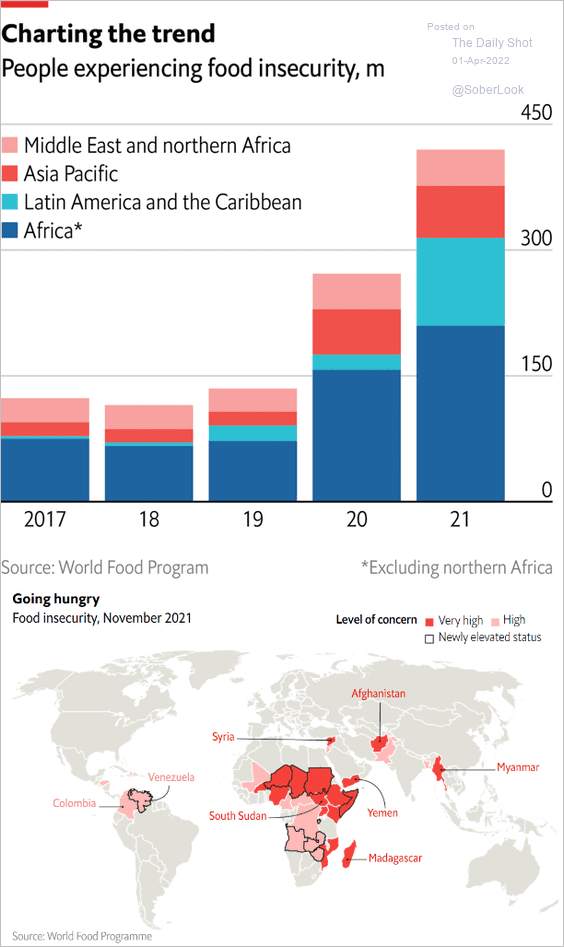 Source: The Economist Read full article
6. The emerging Cold War:
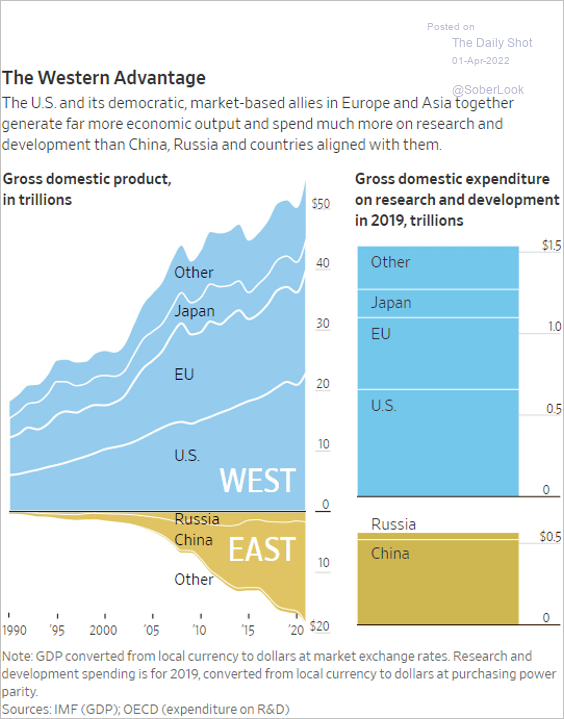 Source: @WSJ Read full article
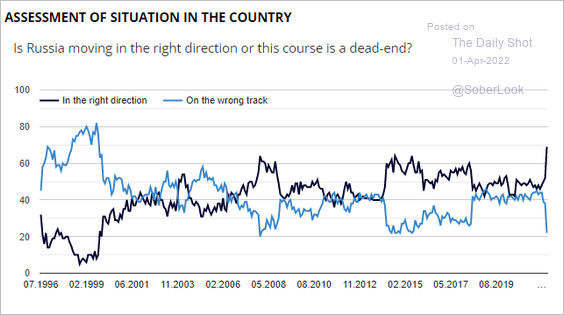
7. Putin’s approval ratings:
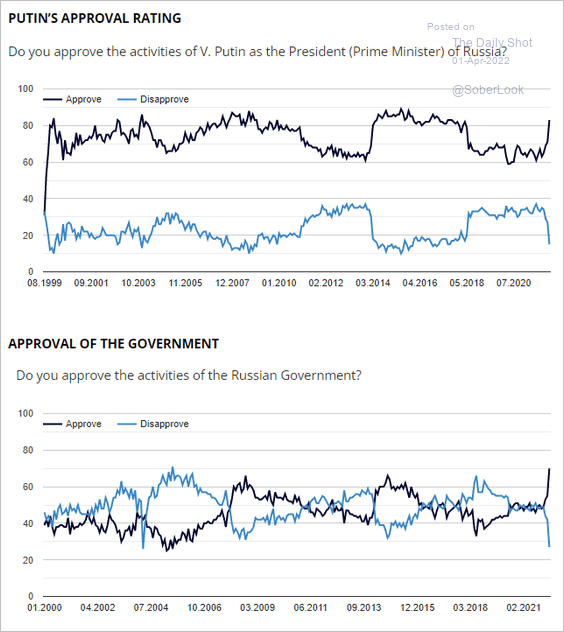 Source: Levada-Center
 Source: Levada-Center
——————–
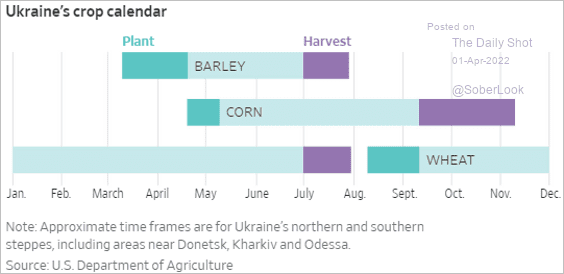
8. Ukraine’s crop calendar:
 Source: @WSJ Read full article
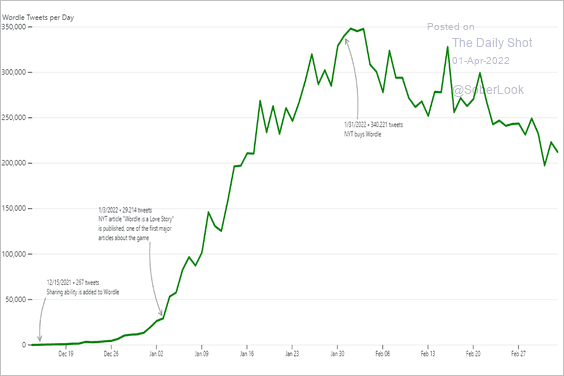
9. Wordle tweets per day:
 Source: Observable Read full article
——————–
Have a great weekend!
Back to Index