
The Daily Shot: 05-Apr-22
• The United States
• Canada
• Europe
• Asia – Pacific
• China
• Emerging Markets
• Cryptocurrency
• Commodities
• Energy
• Equities
• Credit
• Global Developments
• Food for Thought
The United States
1. Let’s begin with the housing market.
• Housing demand remains strong despite the recent spike in mortgage rates.
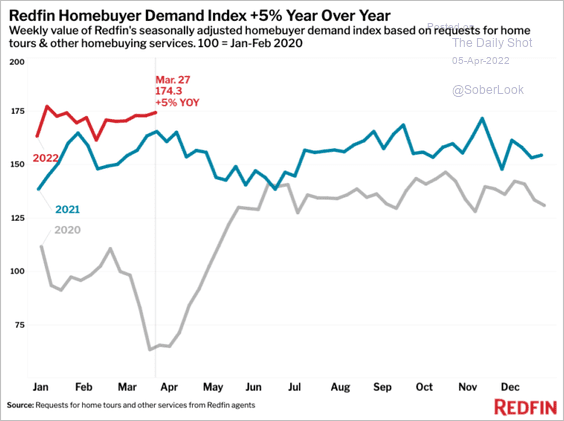 Source: Redfin
More than half of US homes are sold above the list price.
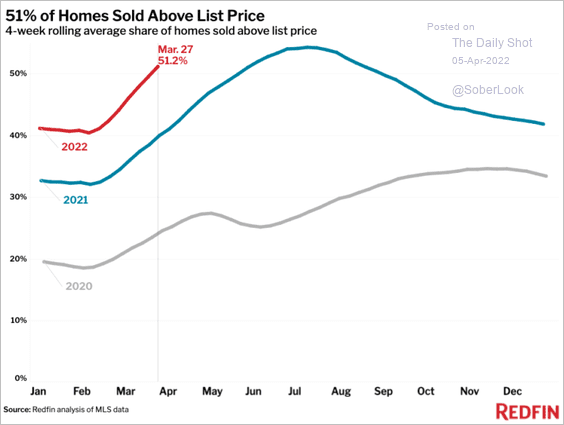 Source: Redfin
But second homes saw a pullback in demand.
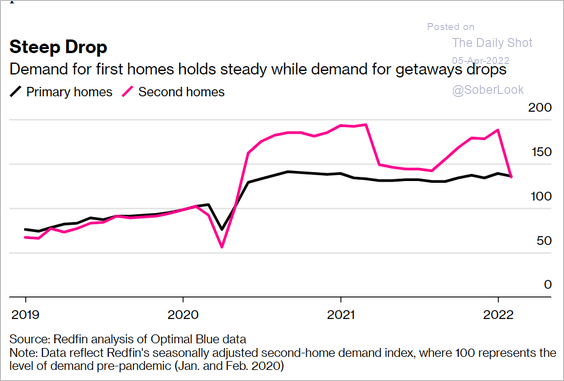 Source: Bloomberg Read full article
• Prices continue to climb, …
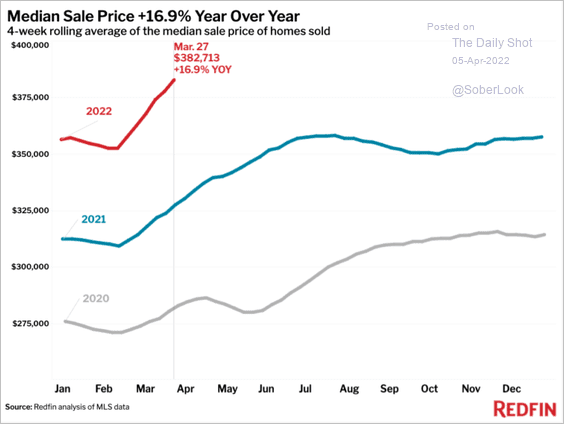 Source: Redfin
… pressuring affordability (2 charts).
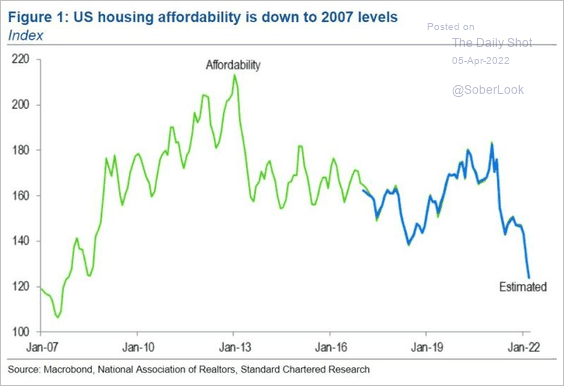 Source: Standard Chartered Global Research; @MikeZaccardi
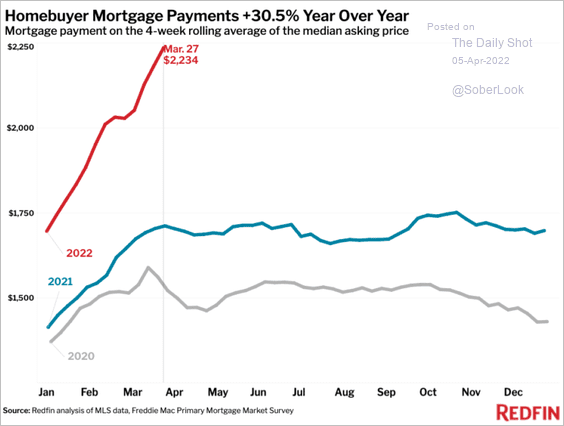 Source: Redfin
• Demand for apartments has been surging.
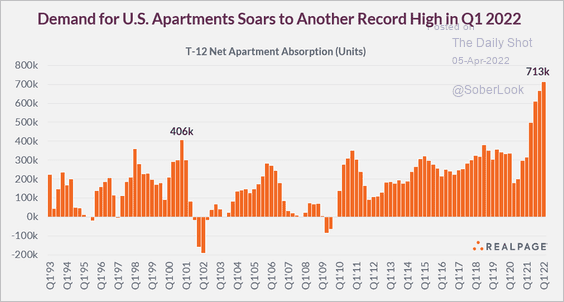 Source: @jayparsons
• Rents have been rising quickly, …
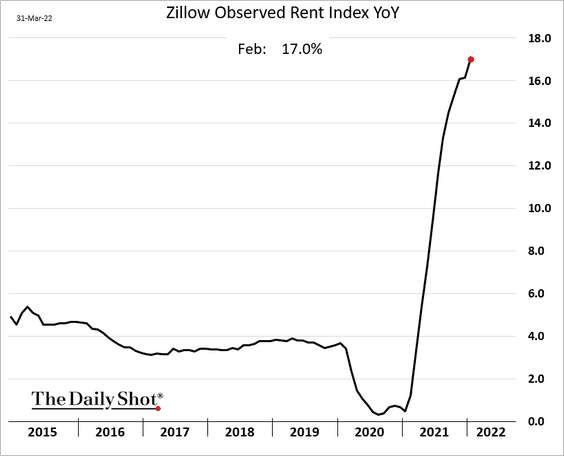
… but renting is increasingly cheaper than buying.
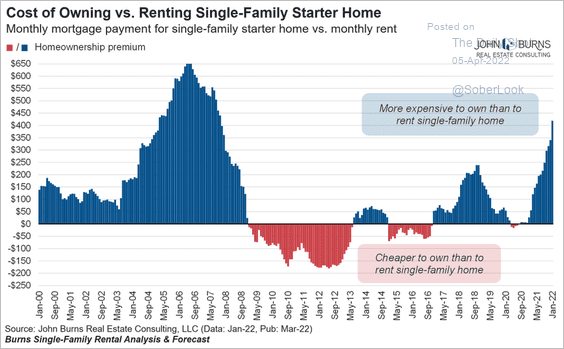 Source: @RickPalaciosJr
The price-to-rent ratio does not bode well for home price appreciation going forward.
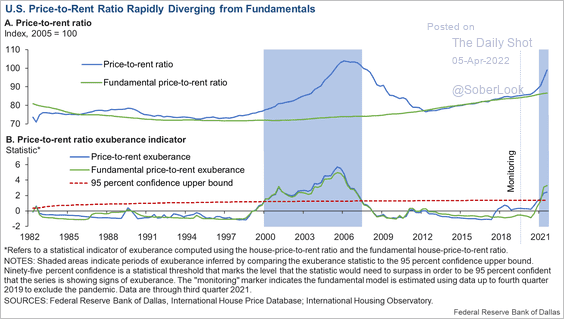 Source: @jessefelder, @DallasFed Read full article
——————–
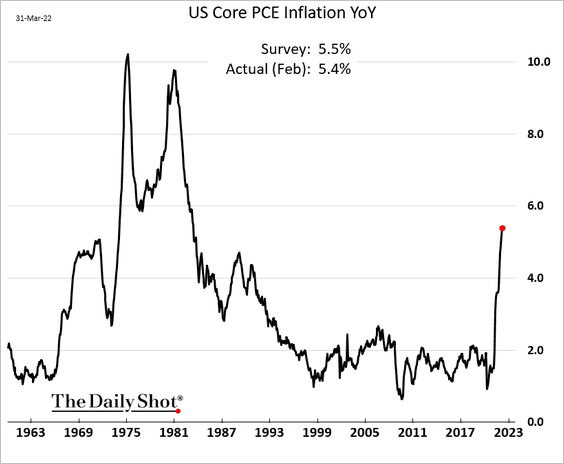
2. Next, let’s take a look at some inflation trends.
• The core PCE inflation (the Fed’s preferred measure):
• A comparison to previous inflation spikes:
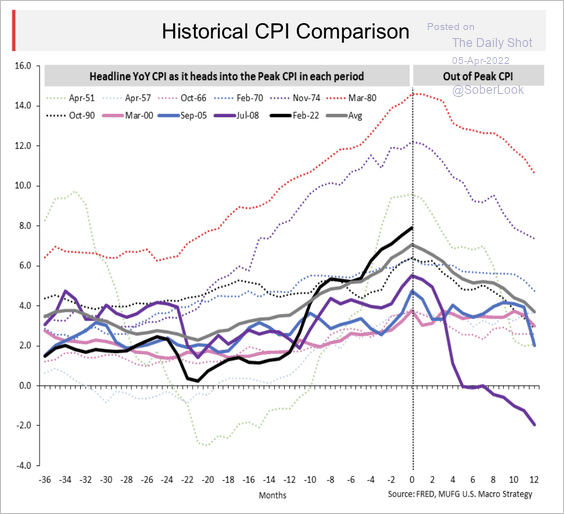 Source: MUFG
• Consumer services PPI (upstream) vs. the PCE services inflation (downstream):
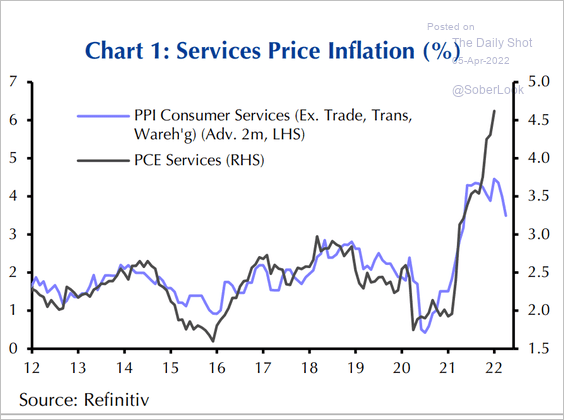 Source: Capital Economics
• The commodity price shock (% of consumer spending):
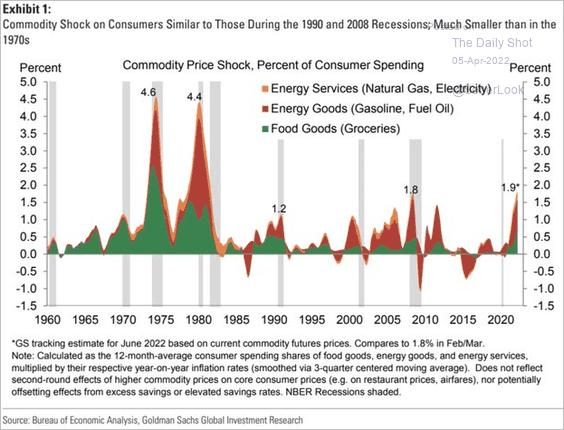 Source: Goldman Sachs
• Consumers are spending $3k more per year to maintain the pre-pandemic consumption trend.
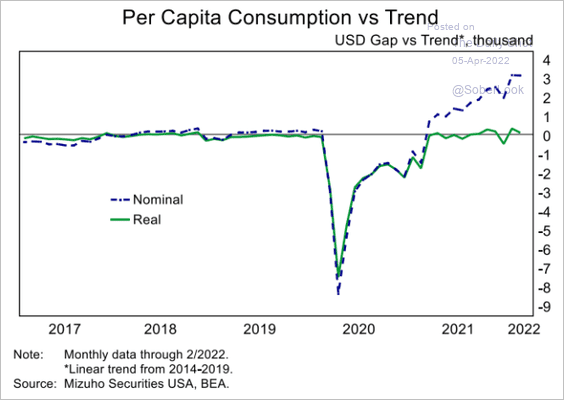 Source: Mizuho Securities USA
——————–
3. Now, let’s take a look at a couple of labor market trends.
• Retired workers are returning to the labor force, pulled by inflation and higher wages.
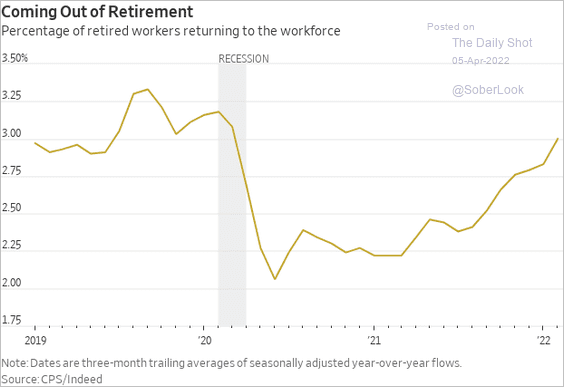 Source: @WSJ Read full article
• The jobs/workers gap shows unusual tightness in the labor market.
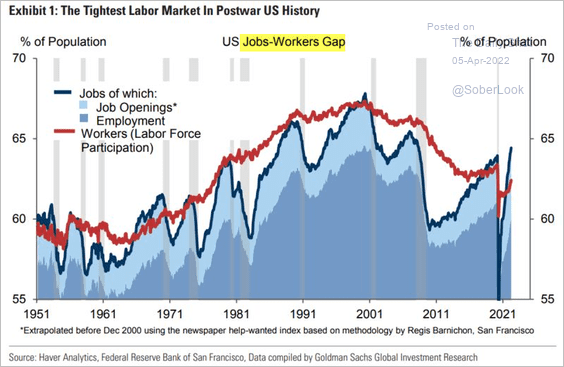 Source: Goldman Sachs; @AnsteyAsia Read full article
——————–
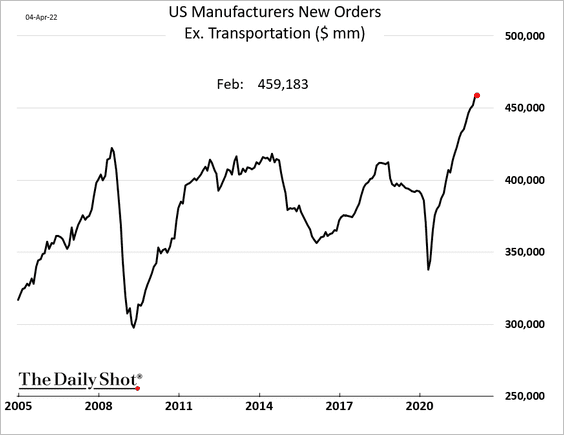
4. US factory orders have been very strong.
Back to Index
Canada
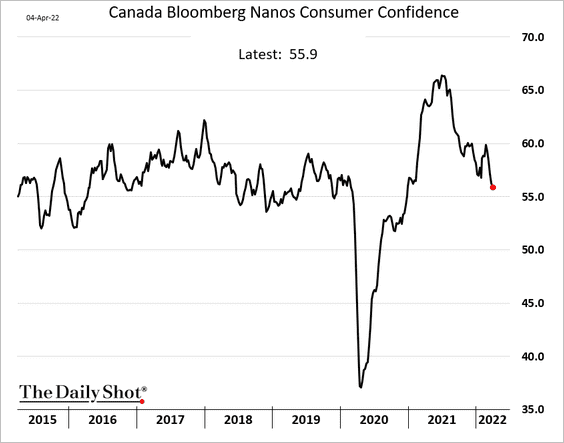
1. Consumer confidence is now below pre-COVID levels.
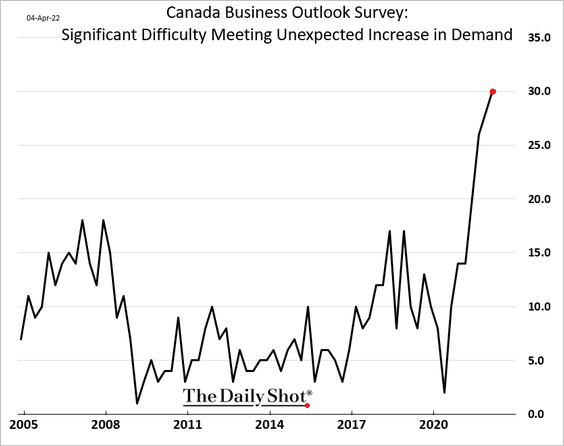
2. Business outlook slumped in the first quarter.
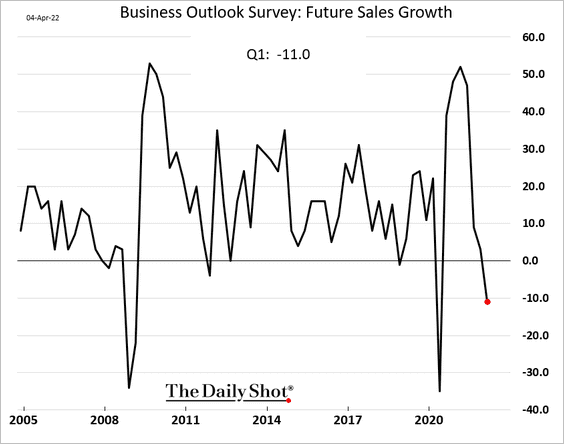
Supply/capacity issues have worsened, with more companies saying they would be unable to meet an increase in demand.
——————–
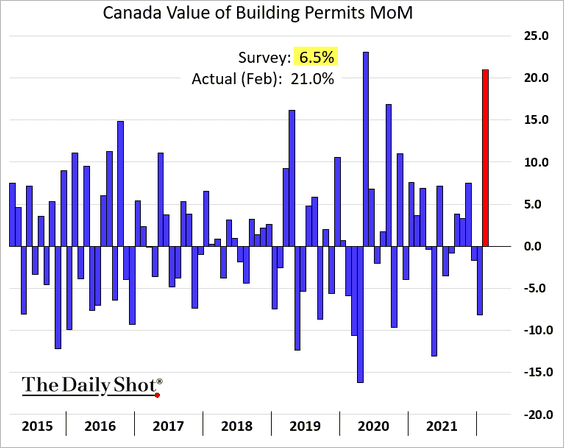
3. Building permits surged in February.
4. Unlike in the US, Canada’s small caps outperformed last month.
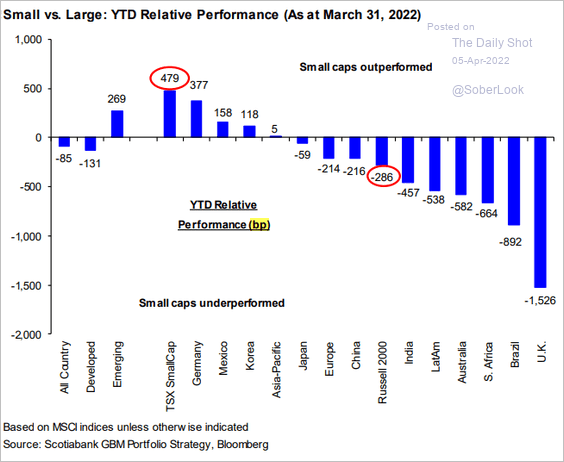 Source: Hugo Ste-Marie, Portfolio & Quantitative Strategy Global Equity Research, Scotia Capital
Back to Index
Europe
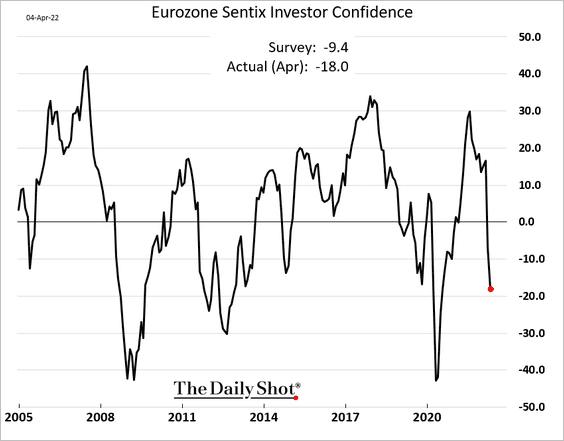
1. The Sentix index of euro-area investor confidence has deteriorated sharply.
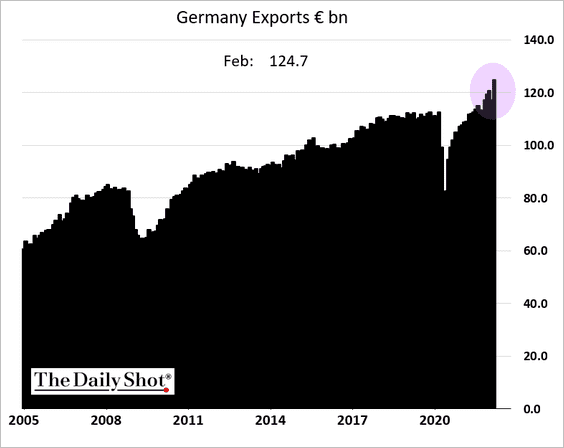
2. German exports hit a record high.
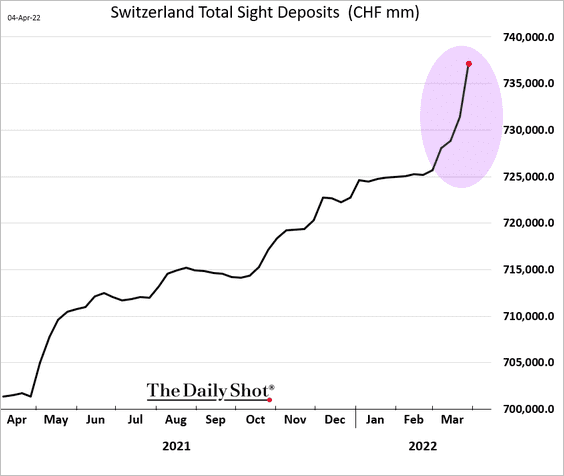
3. The Swiss franc looks set to make another run at parity with the euro.
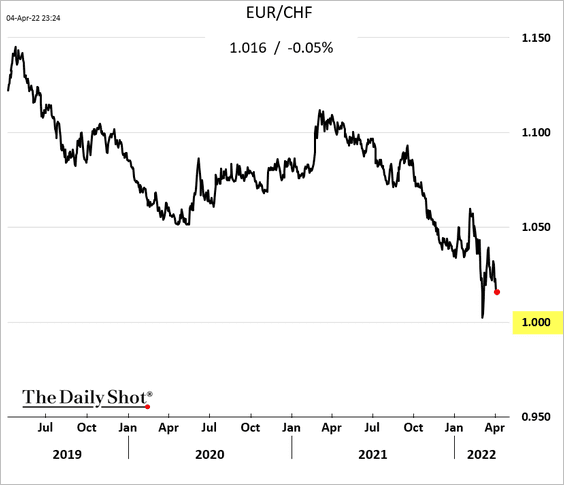
The Swiss central bank appears to be intervening in the F/X market to keep the currency from appreciating further.
——————–
4. This chart shows Europe’s energy burden relative to the US.
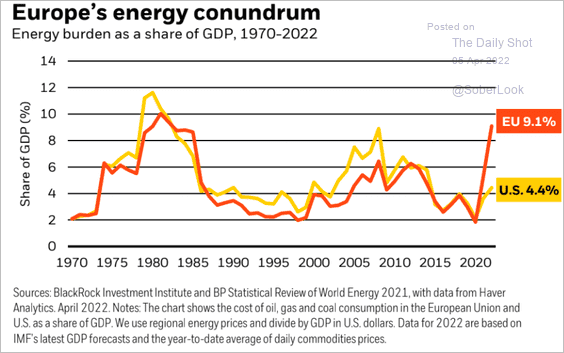 Source: BlackRock Investment Institute
5. Finally, here is a look at tax subsidies for R&D.
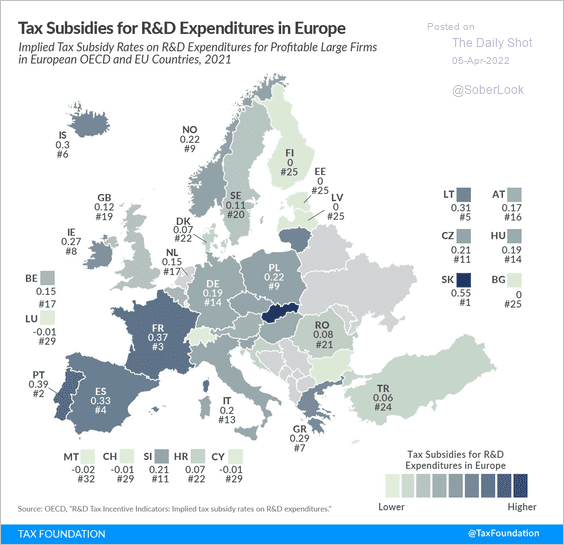 Source: @TaxFoundation, @danieldbunn Read full article
Back to Index
Asia – Pacific
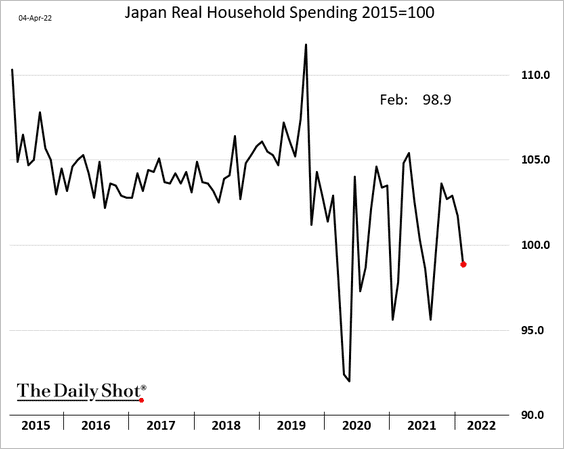
1. Japan’s household spending has been slowing again.
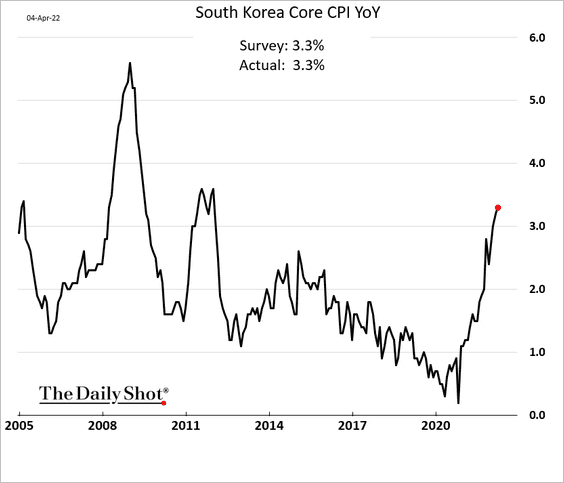
2. South Korea’s inflation continues to rise.
3. Aussie-Yen hit the highest level since 2015.
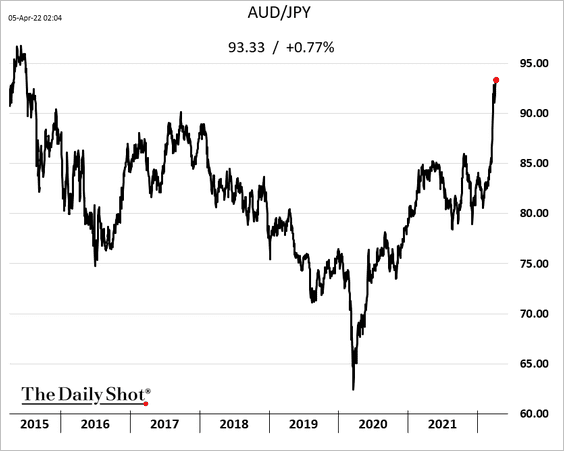
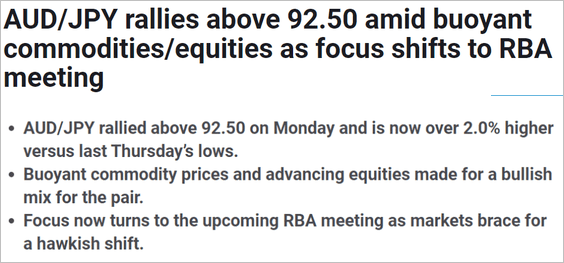 Source: FXStreet Read full article
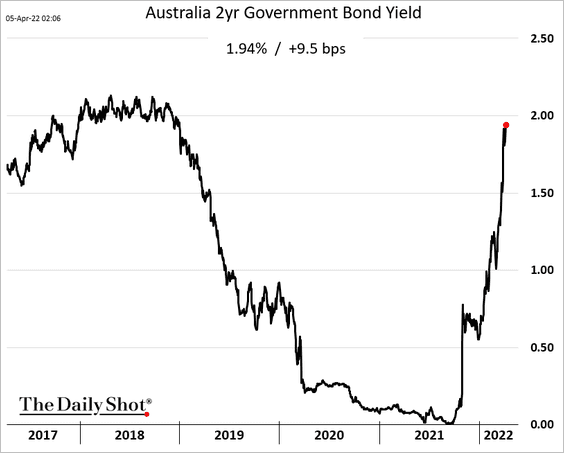
Australia’s 2-year yield is nearing 2%.
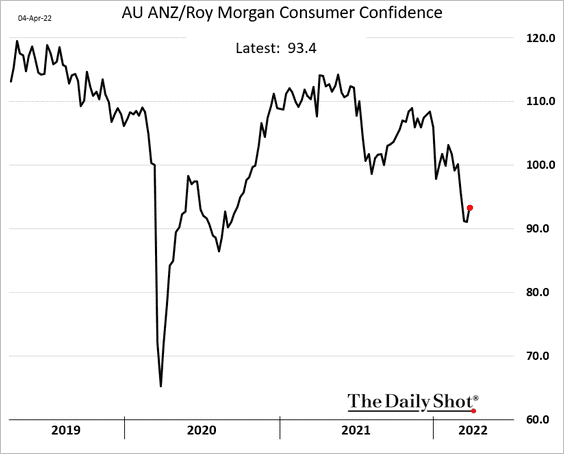
4. Australian consumer confidence seems to have stabilized.
Back to Index
China
1. While the authorities are denying it, the Shanghai Port is facing increasing logistics bottlenecks.
 Source: South China Morning Post Read full article
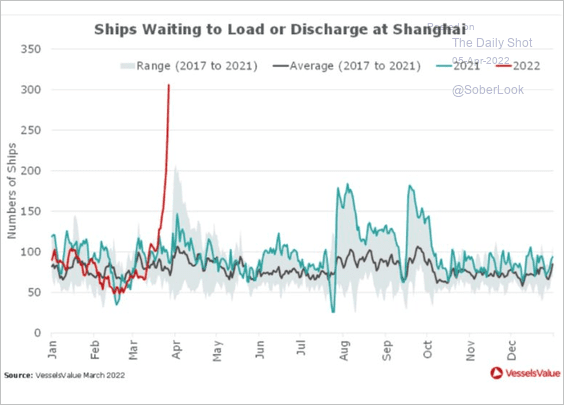 Source: VesselsValue
——————–
2. Tech stocks rallied yesterday on Beijing’s decision to allow some firms to “comply” with US audit rules. But is it enough to keep US-listed firms in the US?
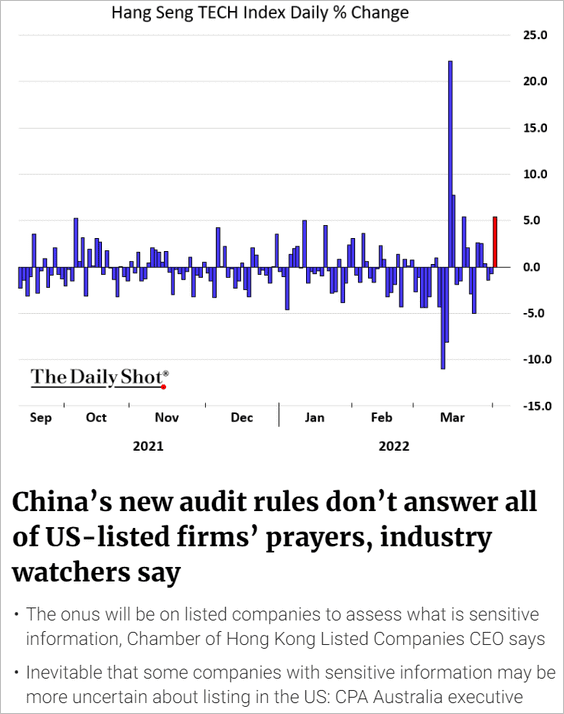 Source: South China Morning Post Read full article
3. Equity valuations are at the lowest level since 2018.
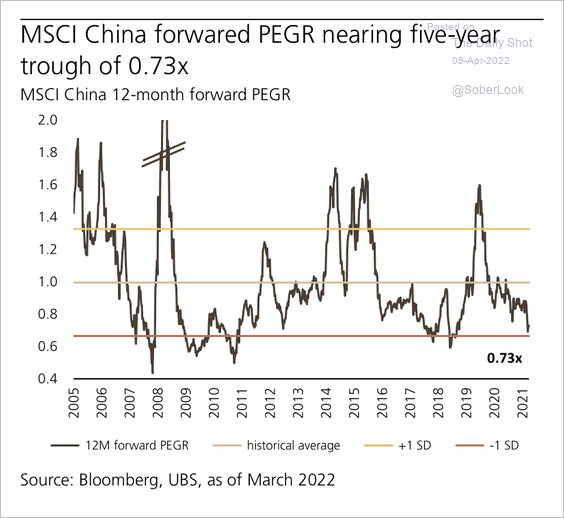 Source: UBS Research
4. Mobility in Shenzhen is improving.
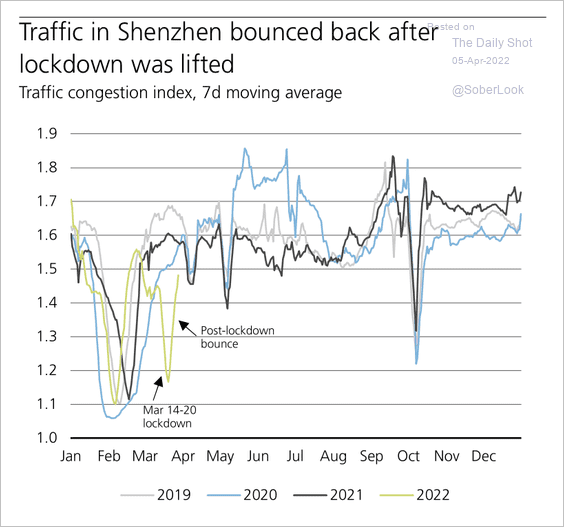 Source: UBS Research
5. The options market is pricing in higher downside risks for the renminbi.
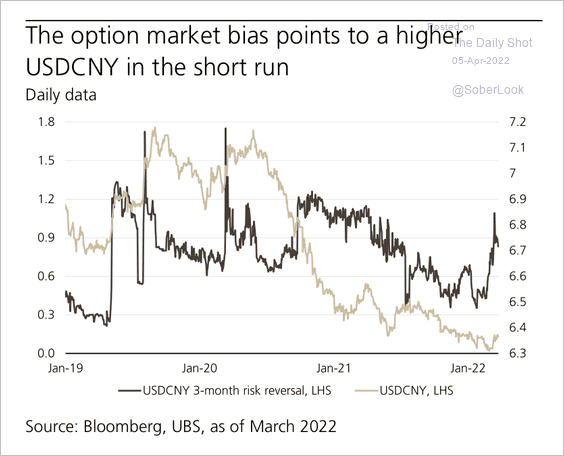 Source: UBS Research
6. According to TS Lombard, China’s GDP is facing a significant slowdown.
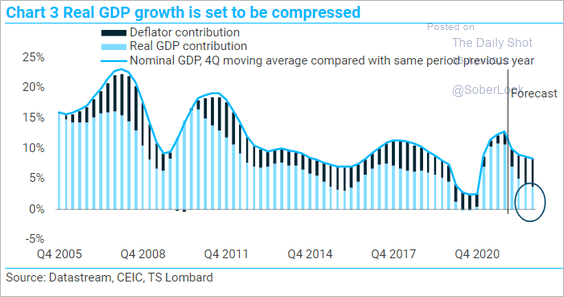 Source: TS Lombard
7. The debt/GDP ratio has accelerated since the financial crisis, outpacing the US.
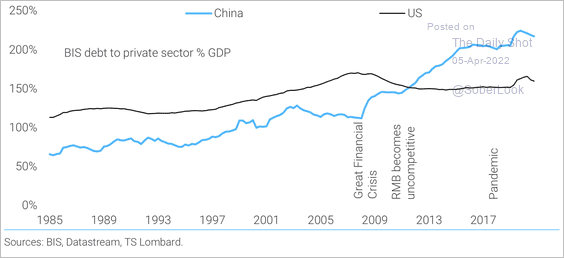 Source: TS Lombard
Back to Index
Emerging Markets
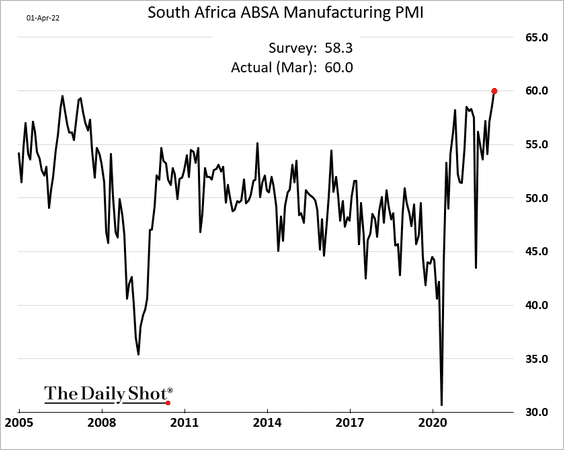
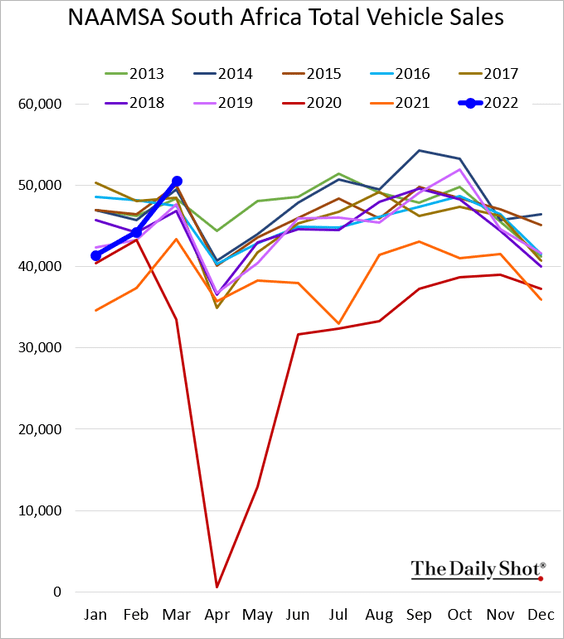
1. Let’s begin with South Africa.
• The manufacturing PMI hit a record high.
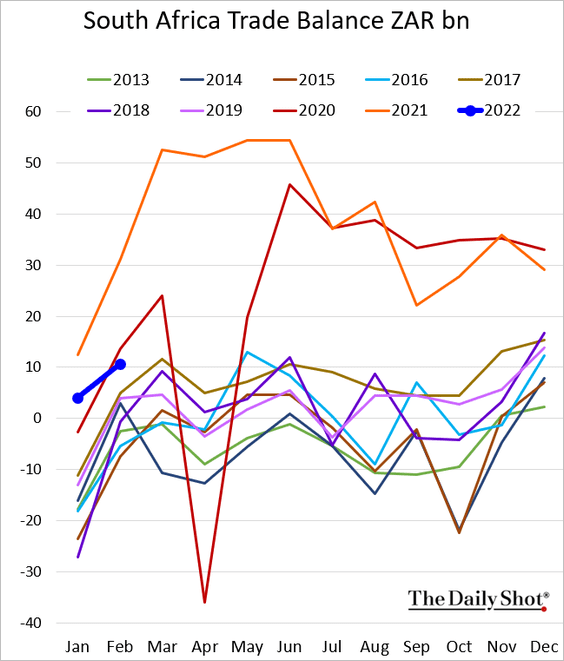
• The trade surplus was softer than expected in February.
• Vehicle sales surged last month.
——————–
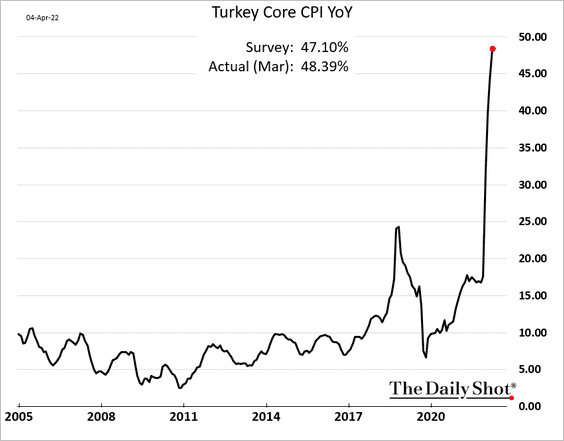
2. Turkey’s manufacturing is back in contraction.
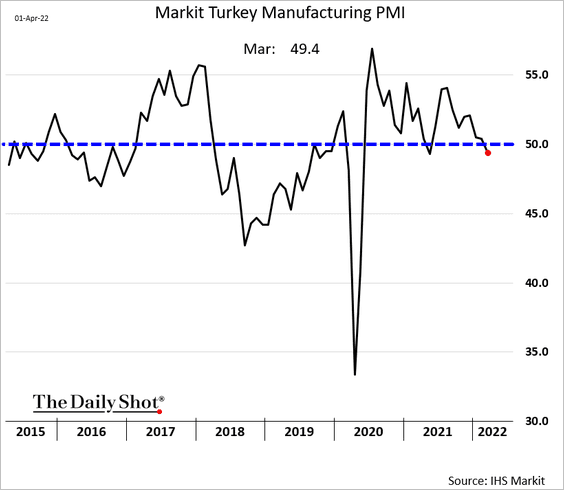
Core inflation is nearing 50%.
——————–
3. India’s manufacturing activity remains resilient.
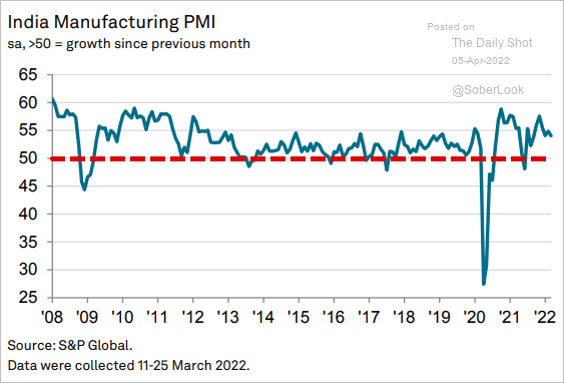 Source: IHS Markit
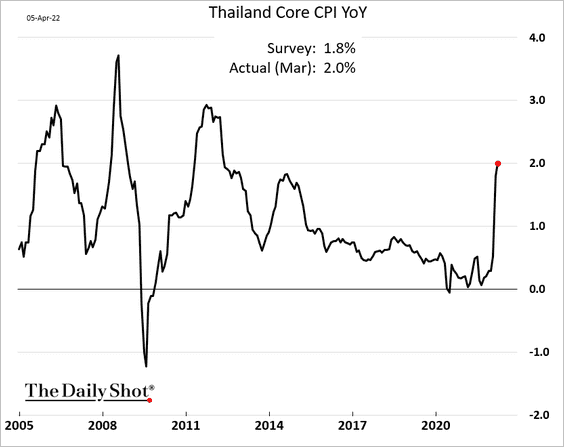
4. Thailand’s inflation has picked up momentum.
5. Some LatAm equity markets look attractive as earnings expectations outpace price gains.
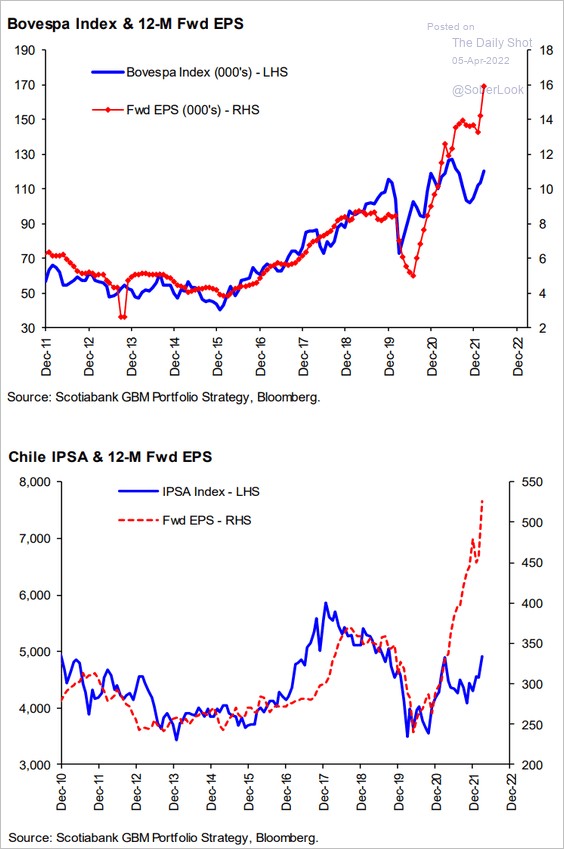 Source: Hugo Ste-Marie, Portfolio & Quantitative Strategy Global Equity Research, Scotia Capital
6. The relative performance of the MSCI EM stock index versus the MSCI Global Equity Index is inversely tied to the dollar.
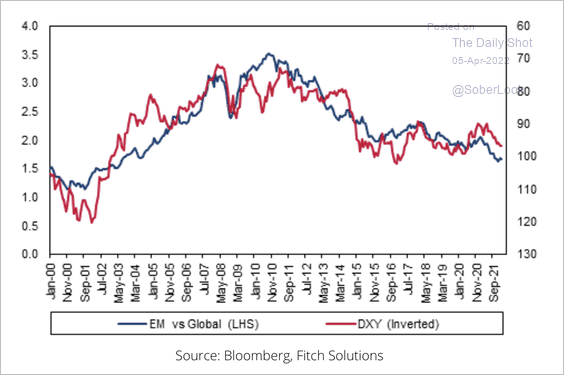 Source: Fitch Solutions Macro Research
By the way, here are the weights in the MSCI EM stock index over time.
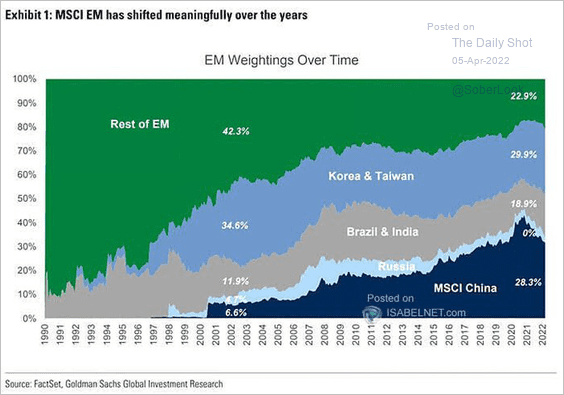 Source: Goldman Sachs; @ritholtz Read full article
——————–
7. EM sovereign bond returns have been weak over the past twelve months.
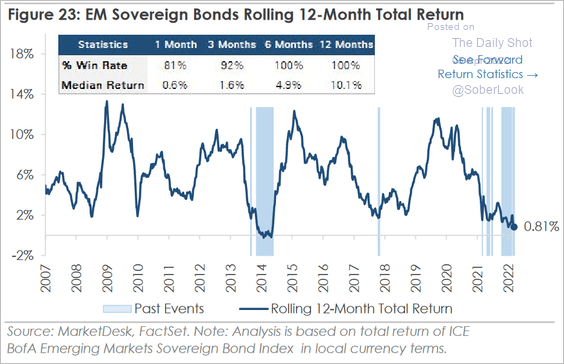 Source: MarketDesk Research
Back to Index
Cryptocurrency
1. Ether’s put/call ratio is trending higher this year, with a notable increase around the end of March.
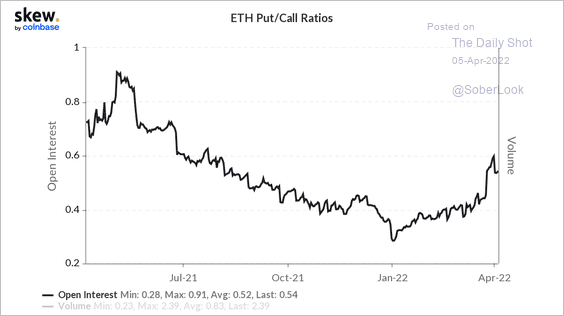 Source: Skew Read full article
2. The ETH/BTC price ratio is testing initial resistance.
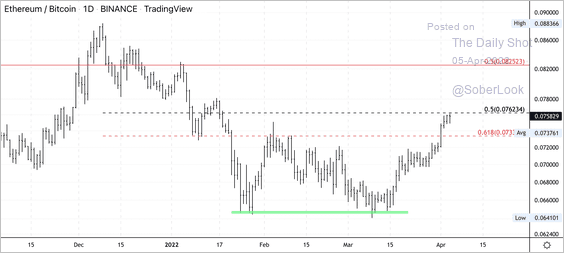 Source: CoinDesk Read full article
3. Indonesia and Brazil have the highest crypto ownership rates, according to data from Gemini.
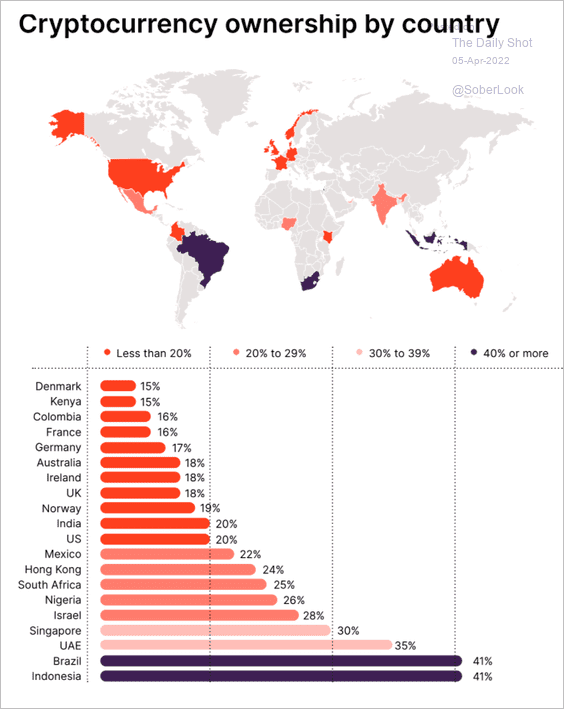 Source: Gemini Read full article
Here is another global survey.
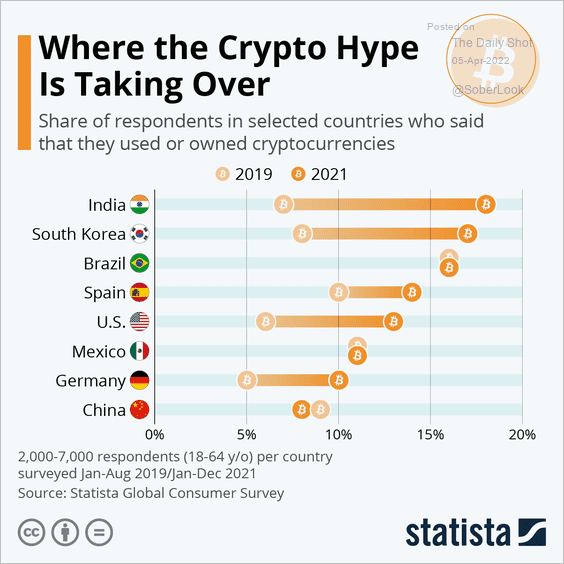 Source: Statista
——————–
4. Relatively few crypto users use cryptocurrencies to purchase goods or services.
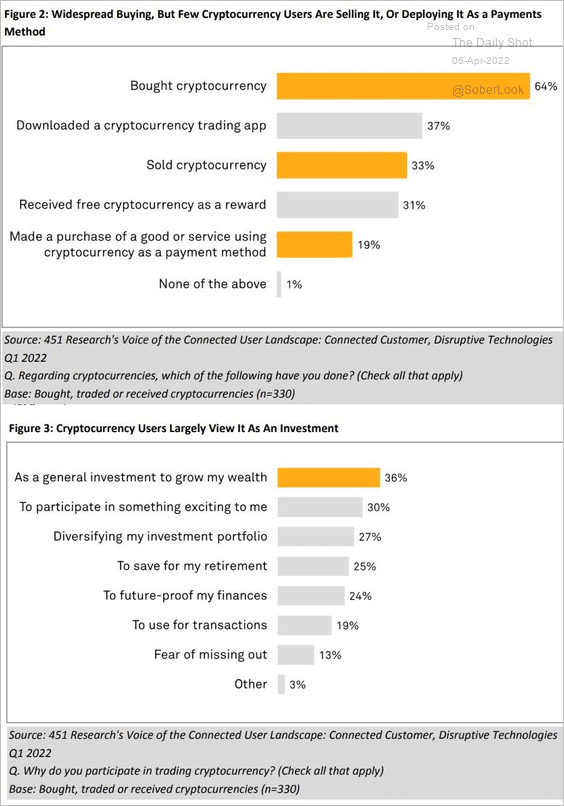 Source: S&P Global Market Intelligence
5. This map shows the most searched cryptos on Google in each state.
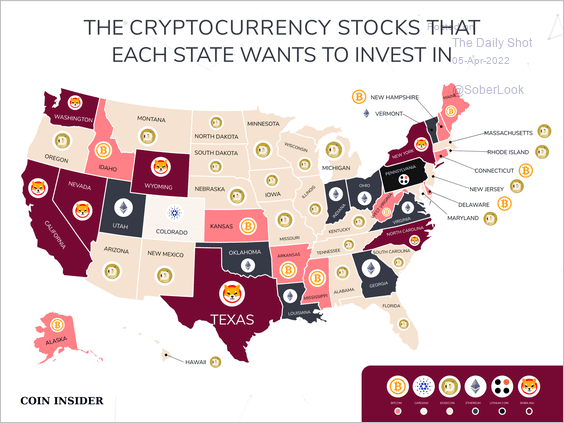 Source: @coininsidercom
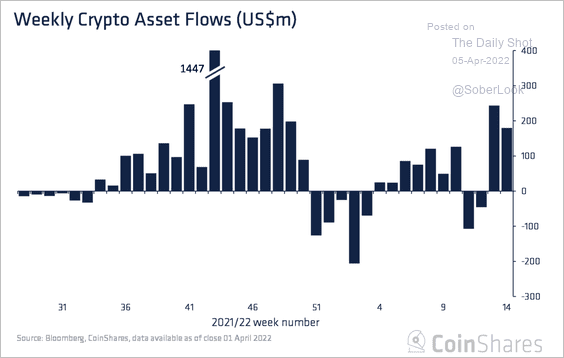
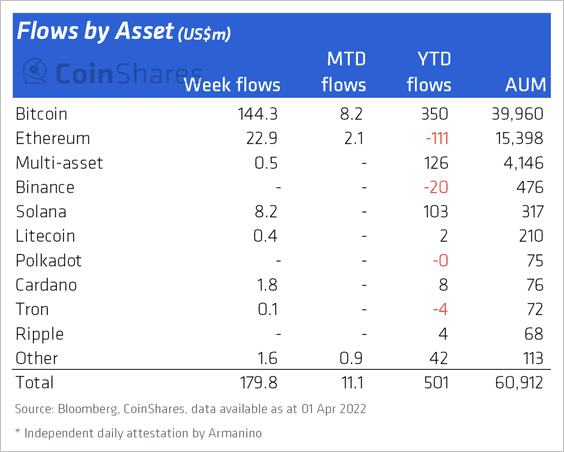
6. Crypto funds saw $180 million in inflows last week.
 Source: CoinShares Read full article
Bitcoin-focused funds accounted for the majority of inflows last week. Ethereum-focused funds also attracted capital, although net flows remain negative for the year.
 Source: CoinShares Read full article
——————–
7. Which US department will oversee crypto trading platforms?
 Source: CoinDesk Read full article
Back to Index
Commodities
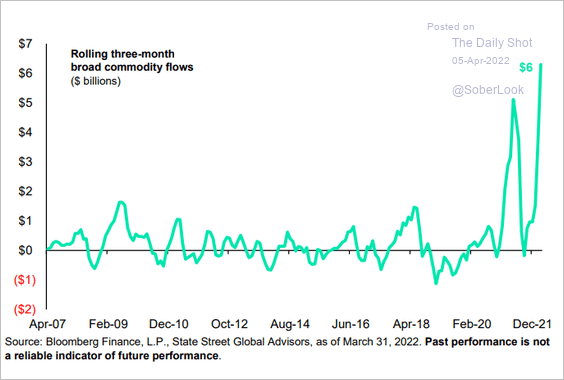
1. Commodity ETF flows surged in March.
 Source: SPDR Americas Research, @mattbartolini
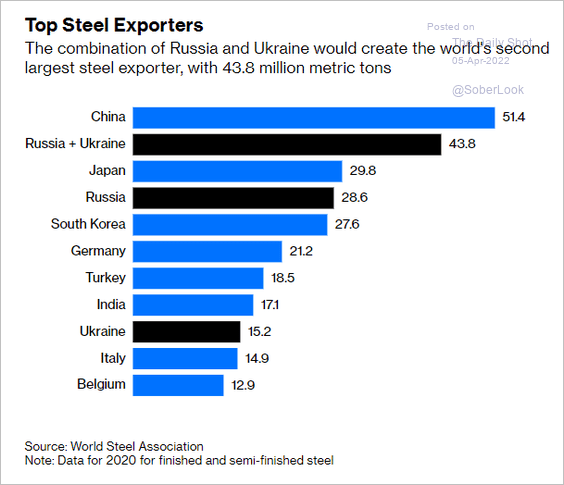
2. Who are the largest exporters of steel?
 Source: Bloomberg Read full article
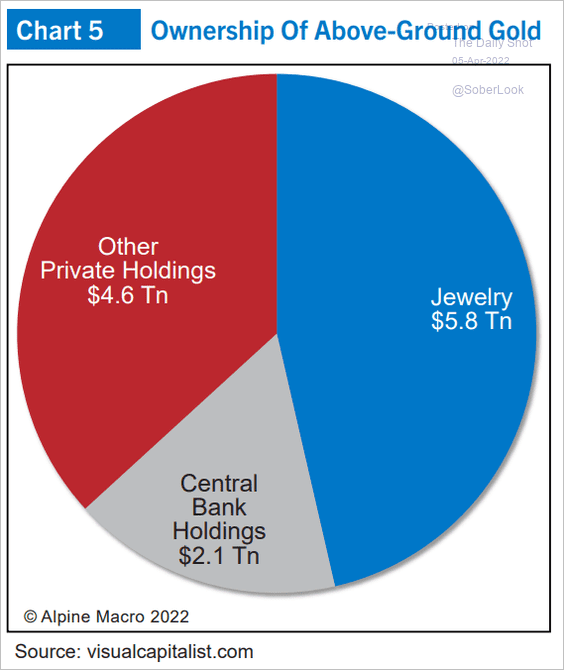
3. Here is the distribution of ownership of above-ground gold.
 Source: Alpine Macro
Back to Index
Energy
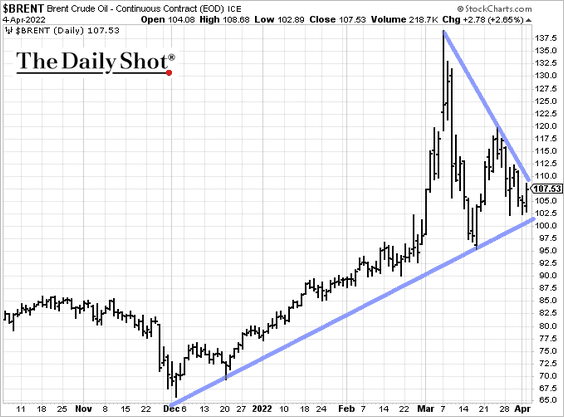
1. Crude oil prices have been consolidating.
2. New York Harbor jet fuel prices have gone vertical.
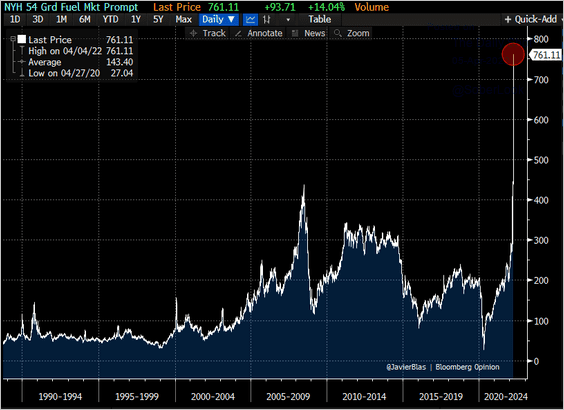 Source: @JavierBlas
3. Global crude oil inventories continue to shrink.
![]() Source: Goldman Sachs; @OpenSquareCap
Source: Goldman Sachs; @OpenSquareCap
4. Natural gas flows from Russia to Europe via Ukraine hit the highest level since November.
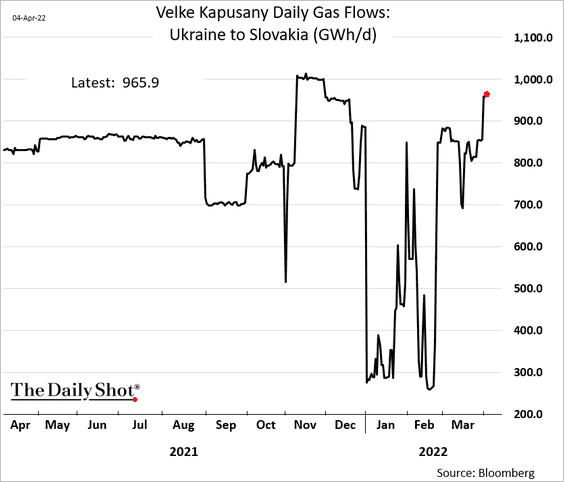 h/t @JavierBlas
5. Russia’s Gazprom output changed little month-over-month and year-over-year despite uncertainty over sanctions and payment terms (yet).
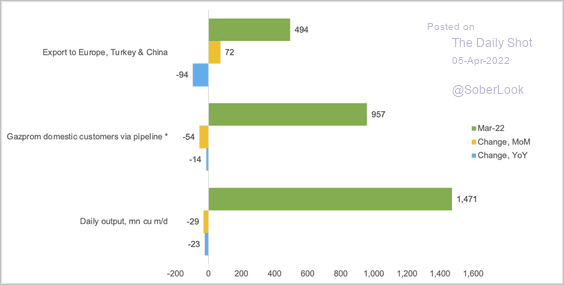 Source: Nadia Kazakova, REA Research Read full article
Gazprom’s sales to regional consumers via the company’s pipeline network have declined year over year.
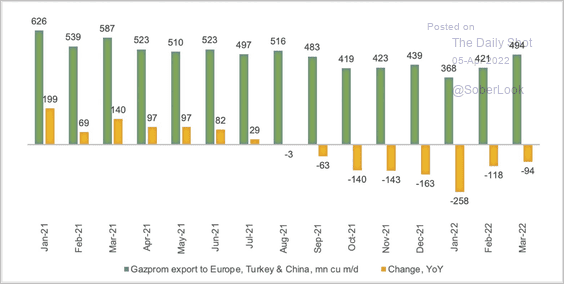 Source: Nadia Kazakova, REA Research Read full article
——————–
6. The top five importers of US LNG last year are all set to see growth in LNG demand this year.
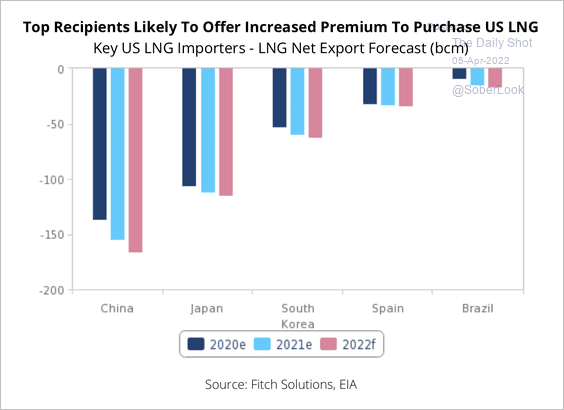 Source: Fitch Solutions Macro Research
Back to Index
Equities
1. The yield curve tends to flatten/invert over a year before the maximum drawdown in the S&P 500.
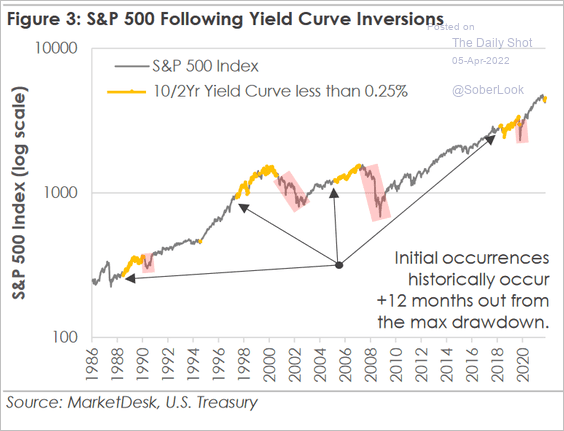 Source: MarketDesk Research
2. Mega-cap valuations remain elevated.
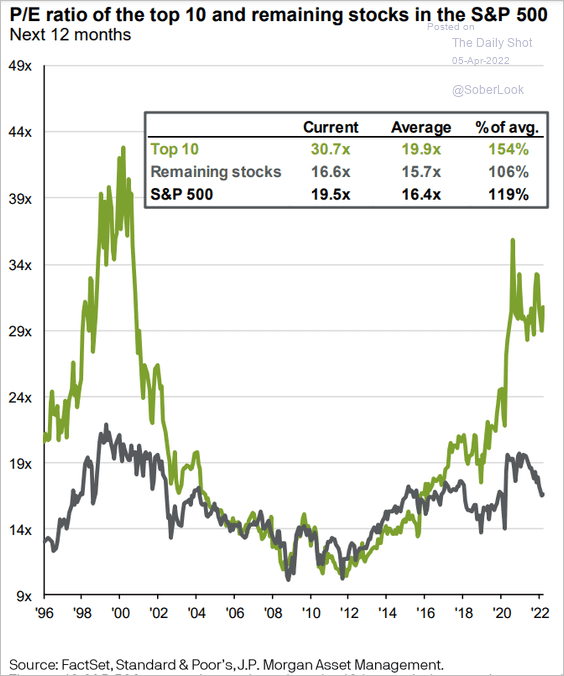 Source: J.P. Morgan Asset Management
3. Equity hedge funds have been reducing their exposure, missing the market rebound.
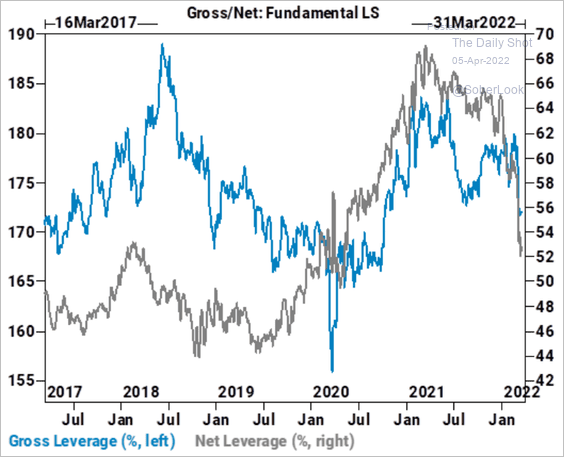 Source: Goldman Sachs Read full article
4. Returns dispersion has been climbing.
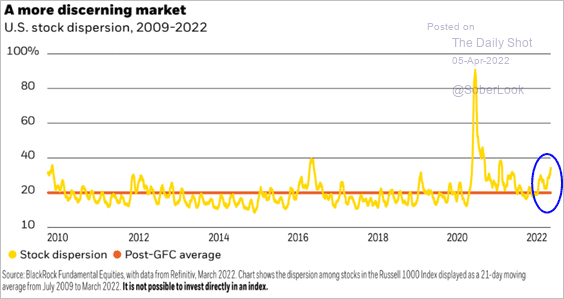 Source: BlackRock Investment Institute
5. New lows keep outpacing new highs.
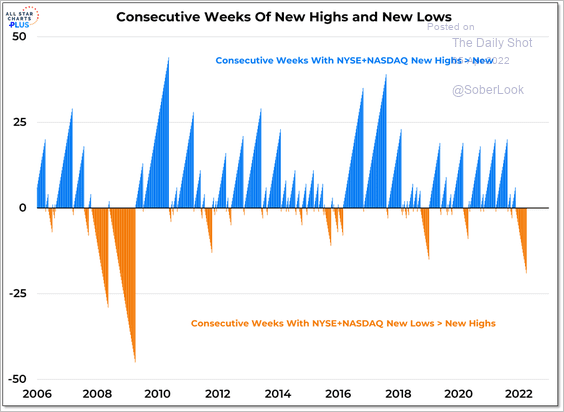 Source: @WillieDelwiche
6. Investor surveys continue to signal caution.
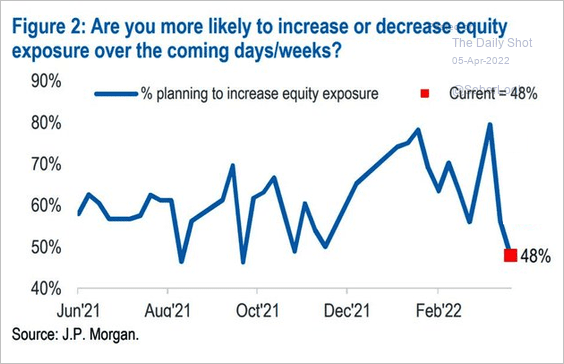 Source: JP Morgan Research; @WallStJesus
7. Small caps keep widening their underperformance, with value stocks lagging the most.
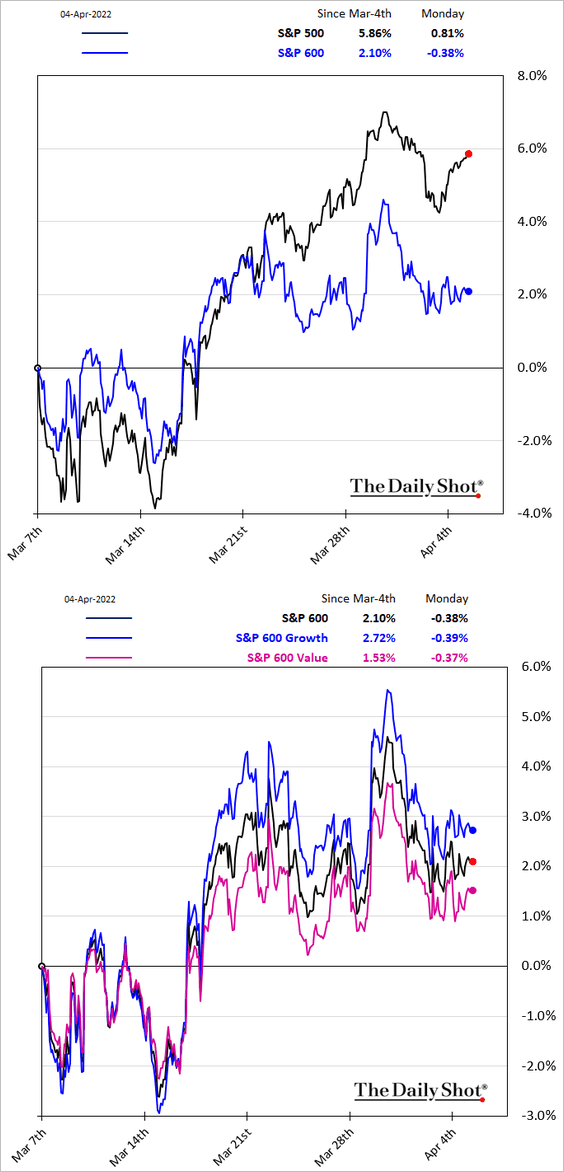
Small caps tend to outperform during periods of stagflation.
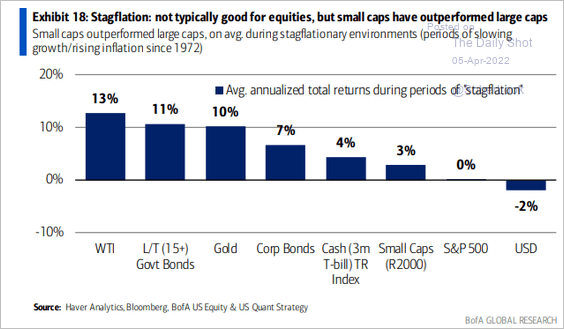 Source: BofA Global Research; @MikeZaccardi
——————–
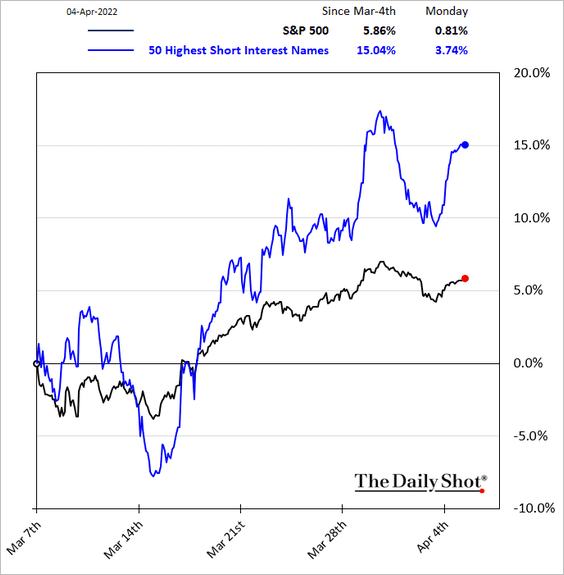
8. Speculative activity is coming back as the most-shorted names outperform.
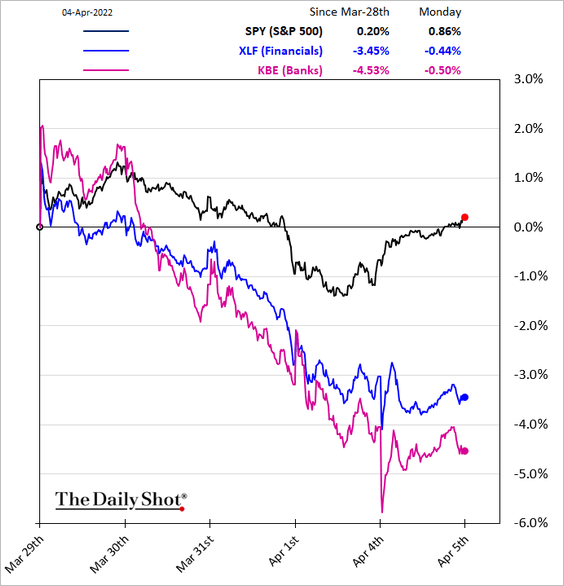
9. Next, we have some sector updates.
• Financials:
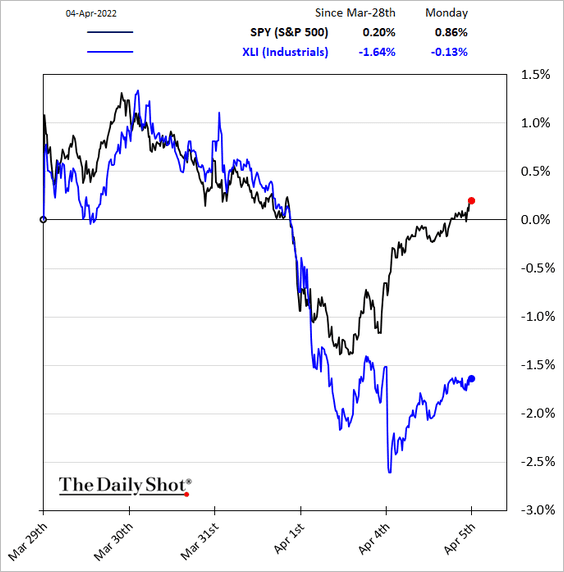
• Industrials:
• Transportation:
![]()
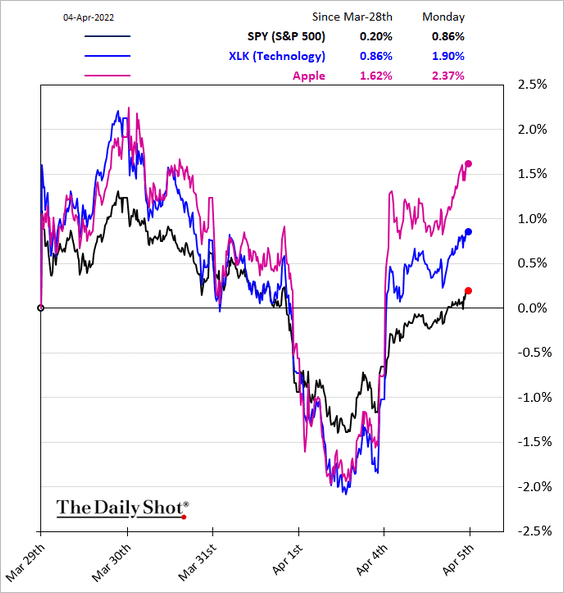
• Tech:
• Communication Services:
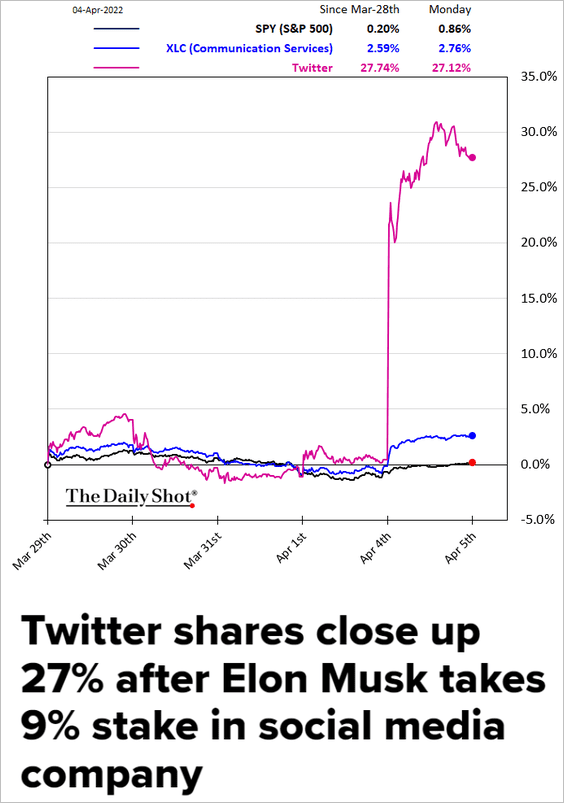 Source: CNBC Read full article
——————–
The S&P 500 utilities sector was in the top decile of its performance history, which typically leads to dramatic underperformance over the next year, according to Fidelity.
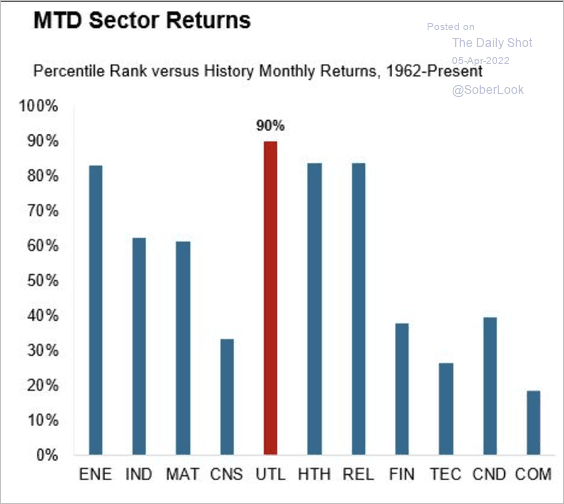 Source: Denise Chisholm, Fidelity Investments
Back to Index
Credit
1. Nonfinancial corporates have seen the largest decline in bond issuance so far this year.
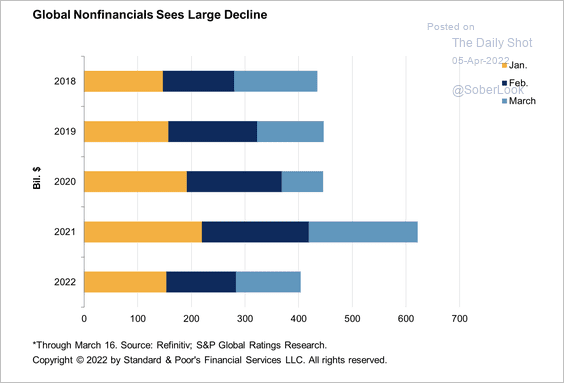 Source: S&P Global Ratings
Still, even a 35% decline in issuance would keep nonfinancial issuance on track with its long-term growth rate.
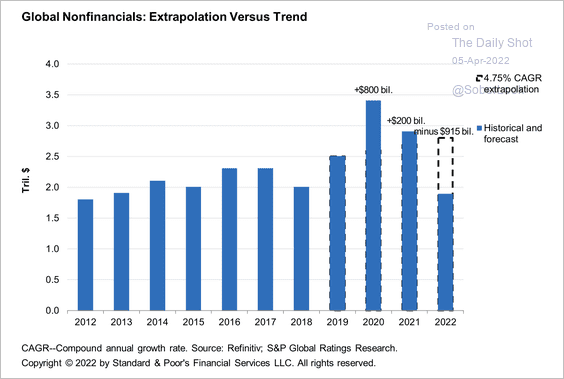 Source: S&P Global Ratings
2. High-yield flows finally turned positive last week.
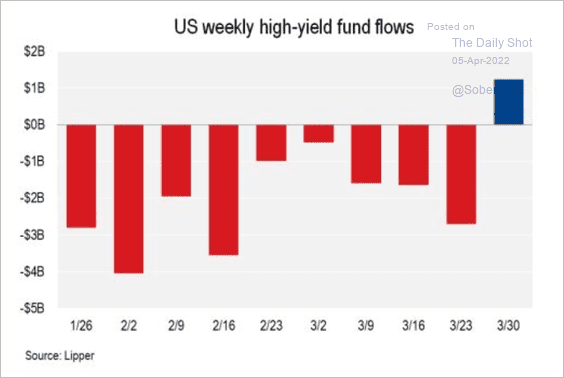 Source: @lcdnews Read full article
3. Corporate secondary bond yields are back to pre-pandemic levels after falling to historic lows.
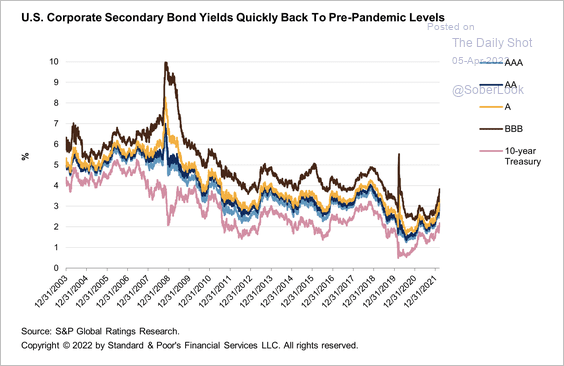 Source: S&P Global Ratings
4. Leveraged loan issuance heavily favored investors in March.
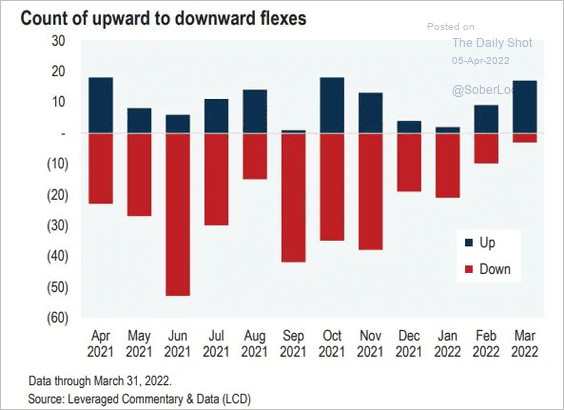 Source: @lcdnews
5. Q1 CLO issuance wasn’t bad considering SOFR implementation and the war.
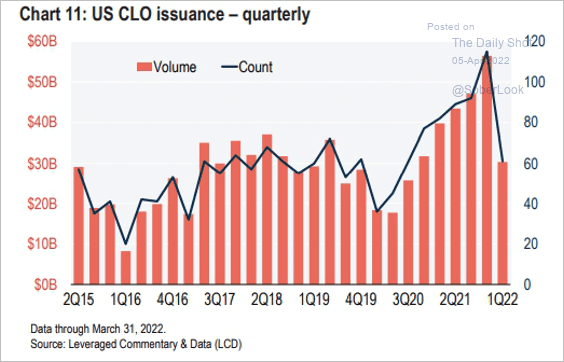 Source: @lcdnews
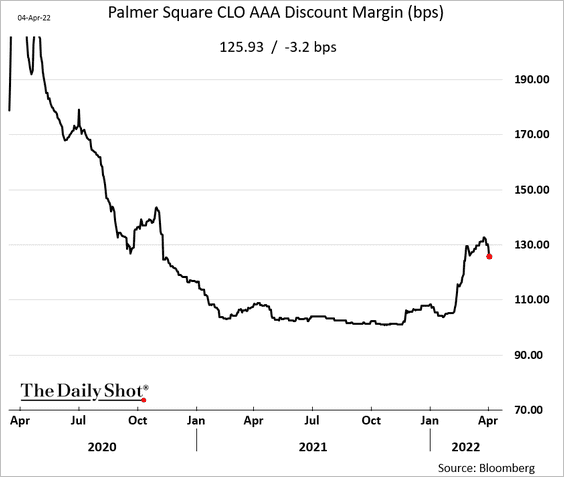
CLO AAA spreads are starting to come in.
Back to Index
Global Developments
1. Negative yields are quickly disappearing.
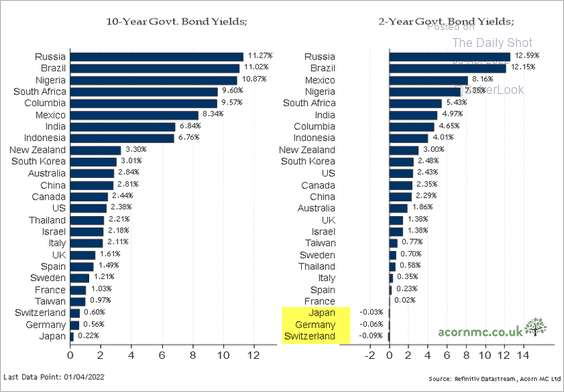 Source: @RichardDias_CF
2. Growth in global manufacturing activity has been slowing.
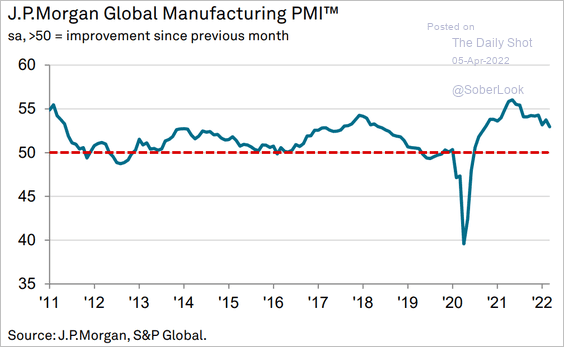 Source: IHS Markit
Here are the latest PMIs by country.
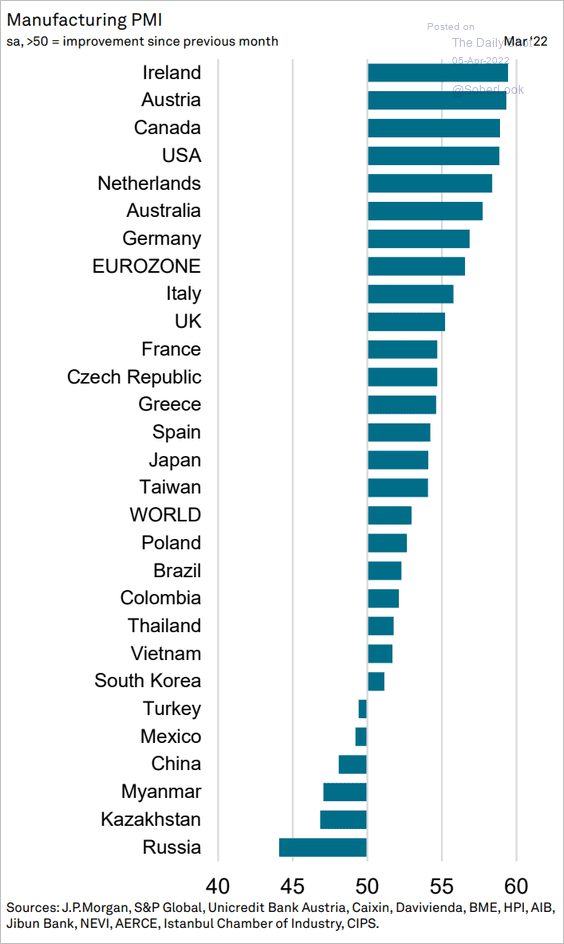 Source: IHS Markit
——————–
Food for Thought
1. US population growth by county:
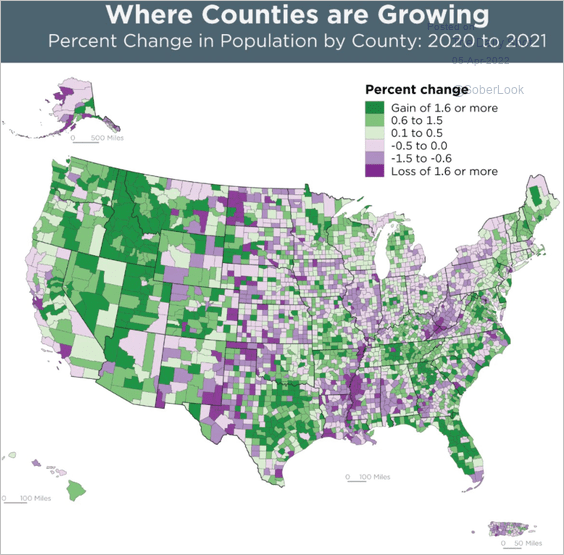 Source: U.S. Census Bureau
2. Married households as a share of total households:
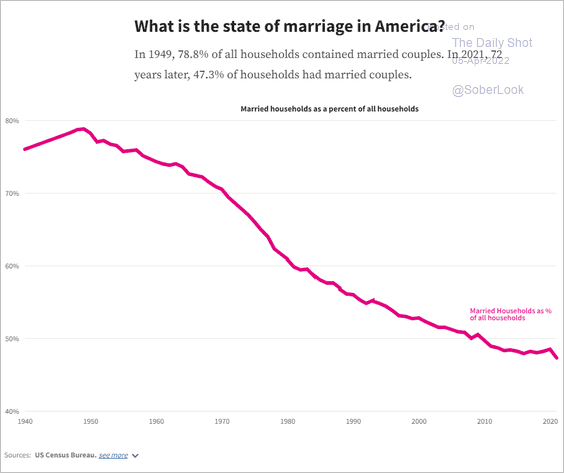 Source: USAFacts Read full article
• Median age of first marriage:
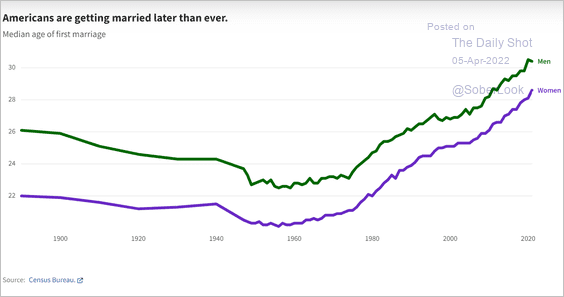 Source: USAFacts Read full article
——————–
3. Rental vacancy rates vs. homelessness:
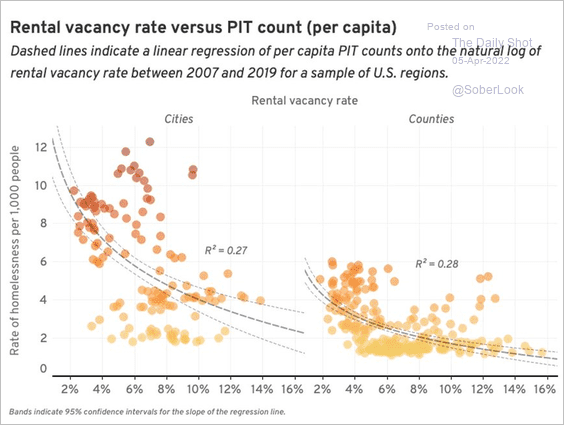 Source: @TaylorAMarr, @ColburnGregg
4. Food prices and terrorism:
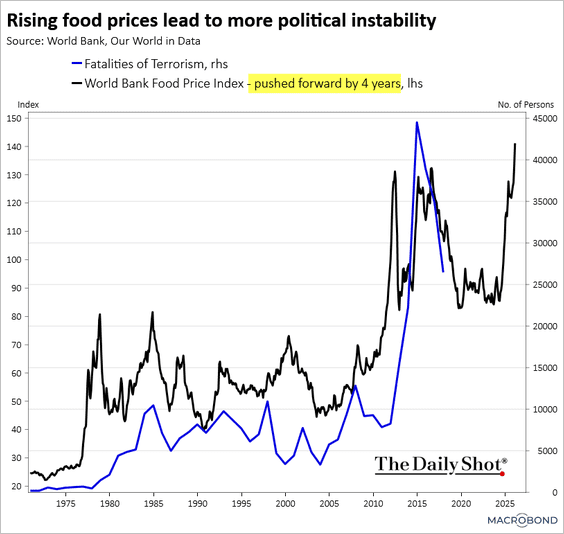 Source: Chart and data provided by Macrobond
5. Russia’s most downloaded apps in March (most used for private communications and internet browsing):
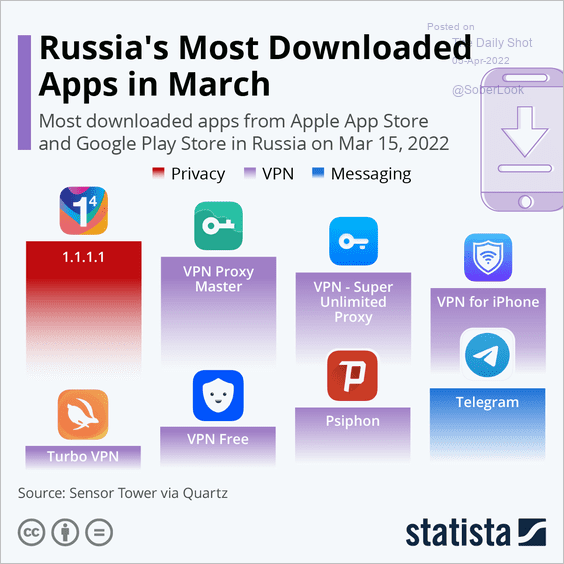 Source: Statista
6. THC- vs. CBD-infused products:
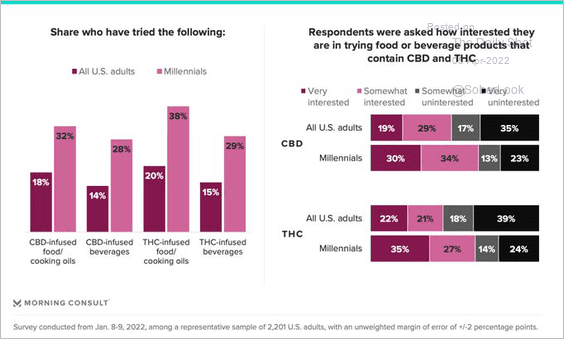 Source: @MorningConsult Read full article
7. Who is divesting from fossil fuels?
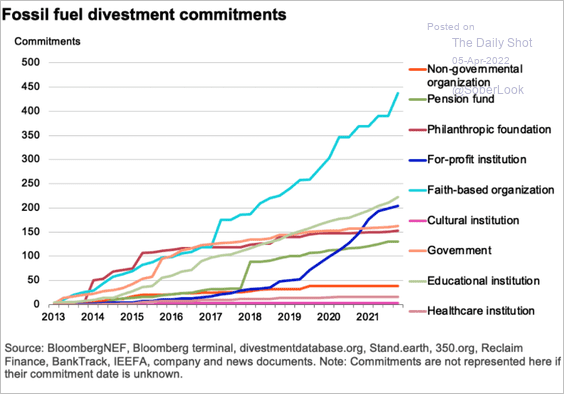 Source: @BloombergNEF Read full article
8. How to say “beer” around Europe?
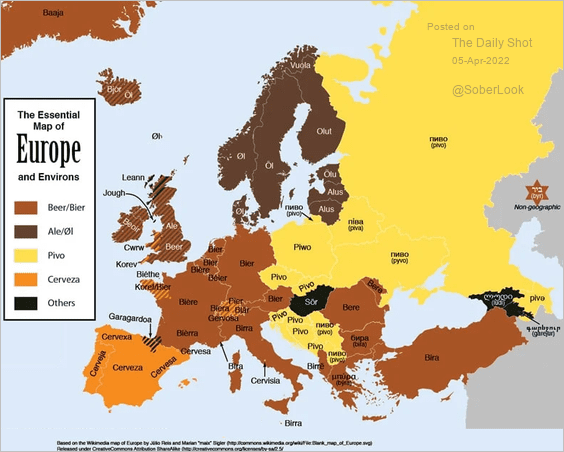 Source: Feòrag NicBhrìde, Wikimedia
——————–
Back to Index