The Daily Shot: 25-Apr-22
• The United States
• The United Kingdom
• The Eurozone
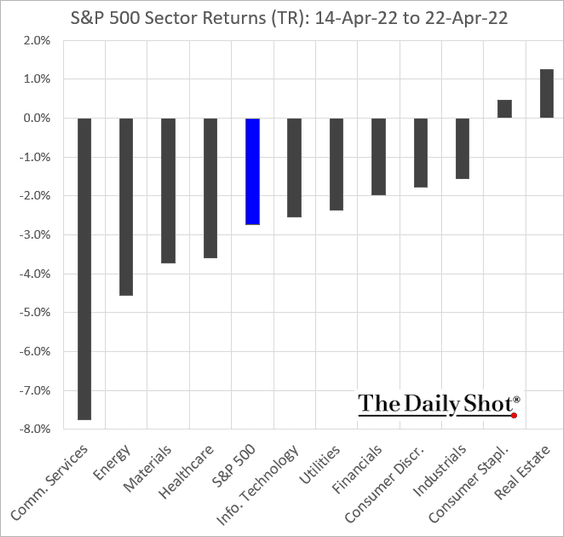
• Europe
• China
• Emerging Markets
• Cryptocurrency
• Commodities
• Equities
• Credit
• Rates
• Global Developments
• Food for Thought
The United States
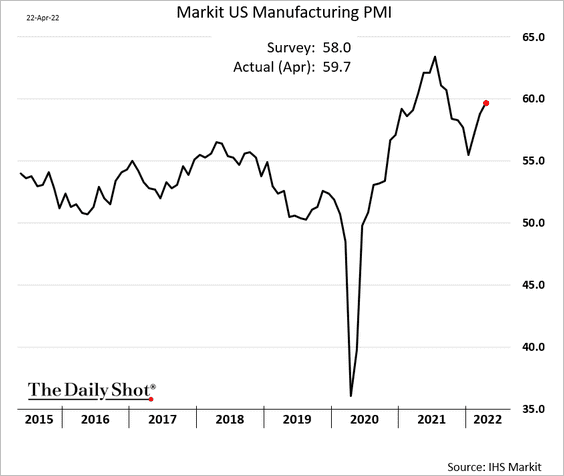
1. The April Markit PMI report was mixed.
• The manufacturing index showed robust factory activity across the US this month.
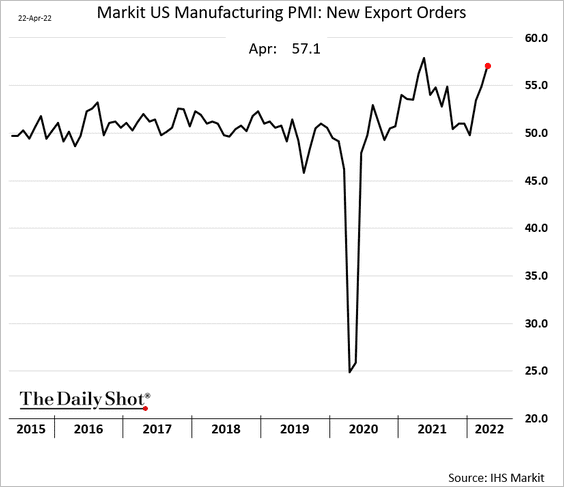
– Export orders picked up momentum.
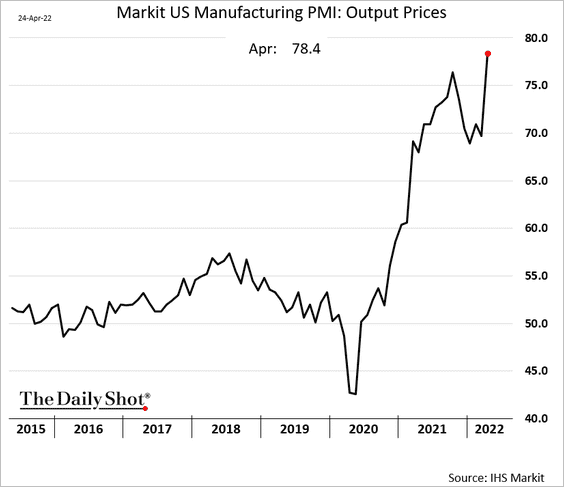
– Manufacturers are rapidly boosting prices.
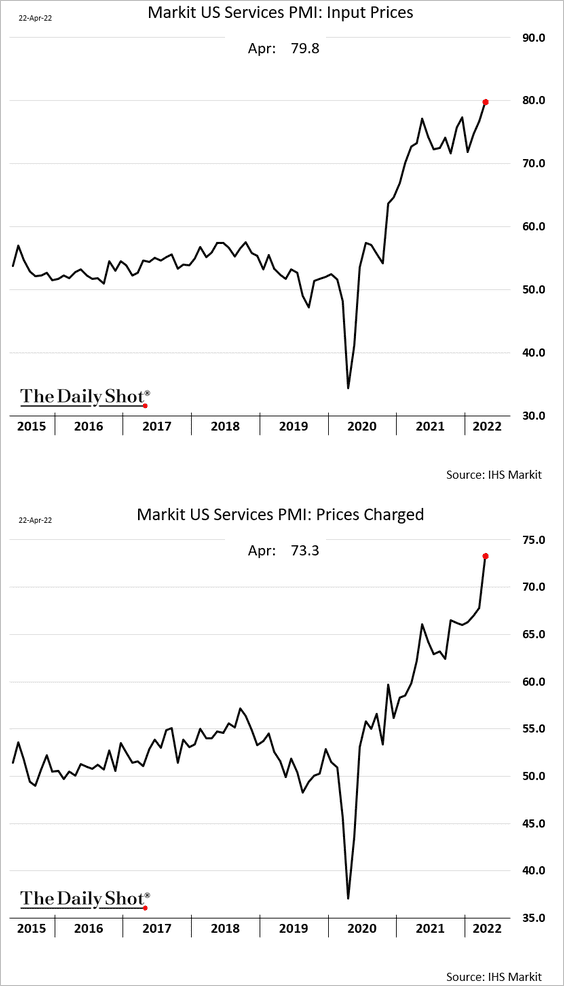
• The services PMI measure was much less upbeat, …
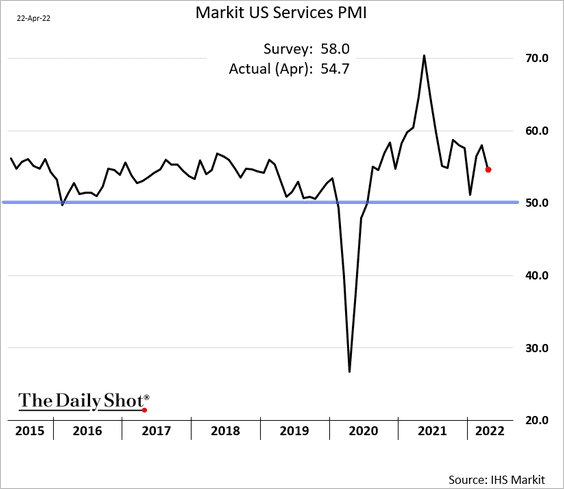
… with price pressures hitting extreme levels.
——————–
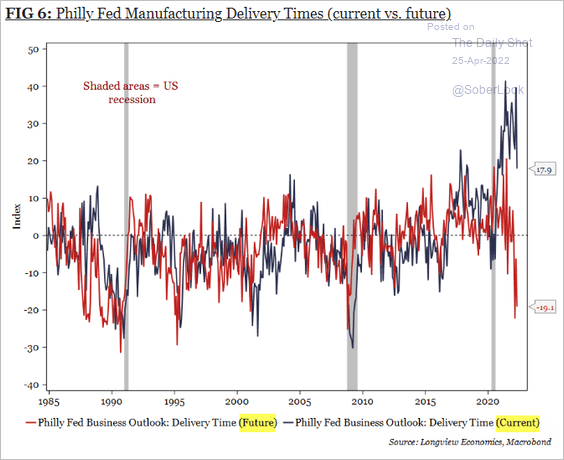
2. As we saw last week, the Philly Fed’s report showed supplier delays peaking. And manufacturers expect bottlenecks to ease further in the months ahead.
 Source: Longview Economics
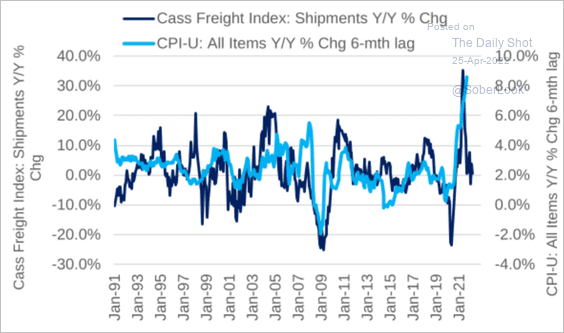
3. Slower demand should begin to alleviate inflationary pressures.
 Source: Citi Private Bank
And tighter financial conditions are expected to lessen demand, …
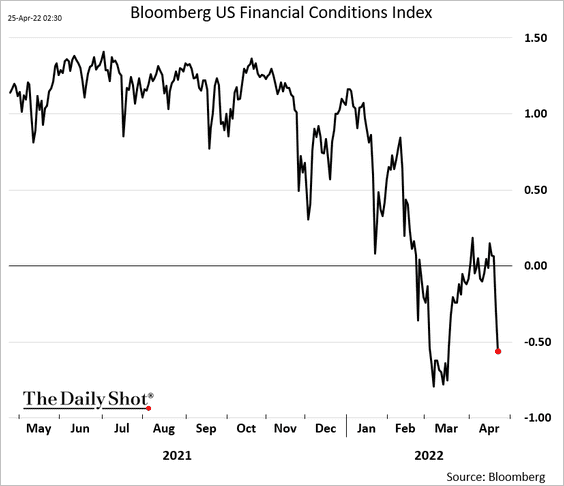
… as the Fed’s tightening and other factors chip away at US liquidity (2 charts).
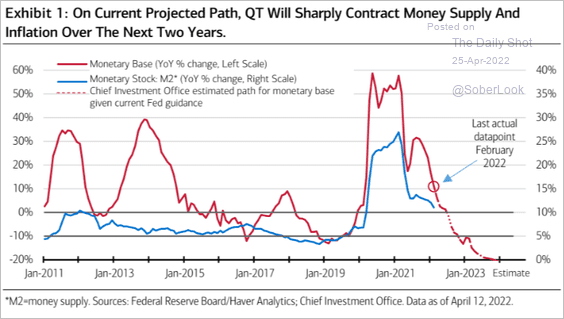 Source: Merrill Lynch
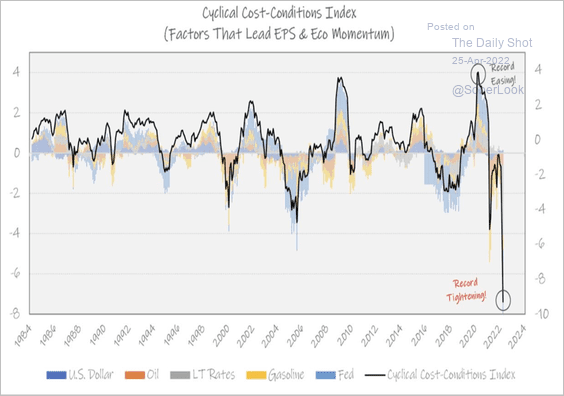 Source: @MichaelKantro
——————–
3. For now, recession risks are negligible, according to TS Lombard’s models.
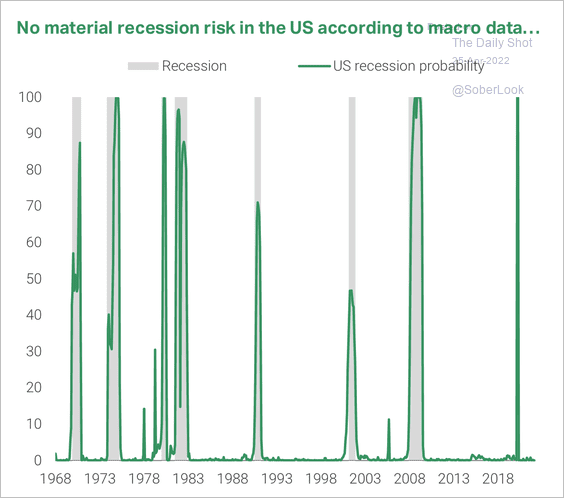 Source: TS Lombard
4. The Fed is ready to “front-load” its rate hikes.
 Source: MarketWatch Read full article
Here is the fed funds trajectory expected by the futures market.
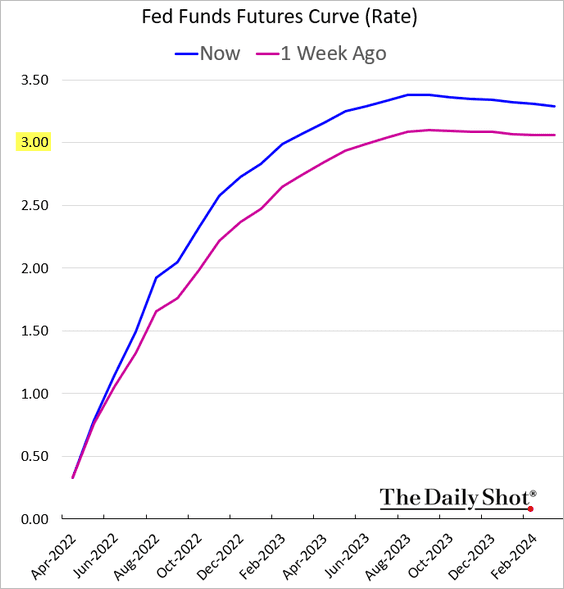
While a 75 basis point hike may not be in the cards for May, …
 Source: MarketWatch Read full article
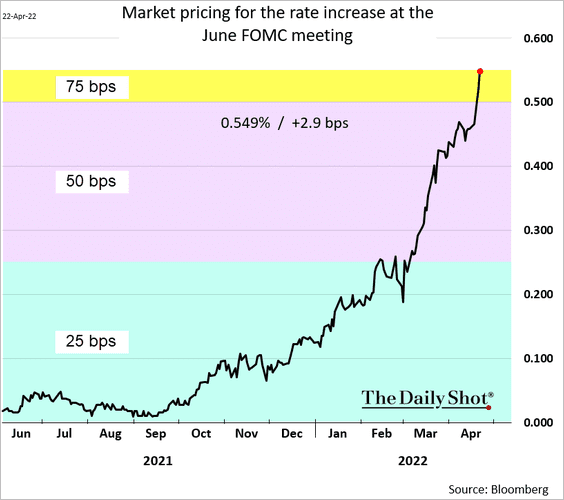
… the market now sees one-in-five odds of a 75 bps hike in June (rather than 50 bps).
——————–
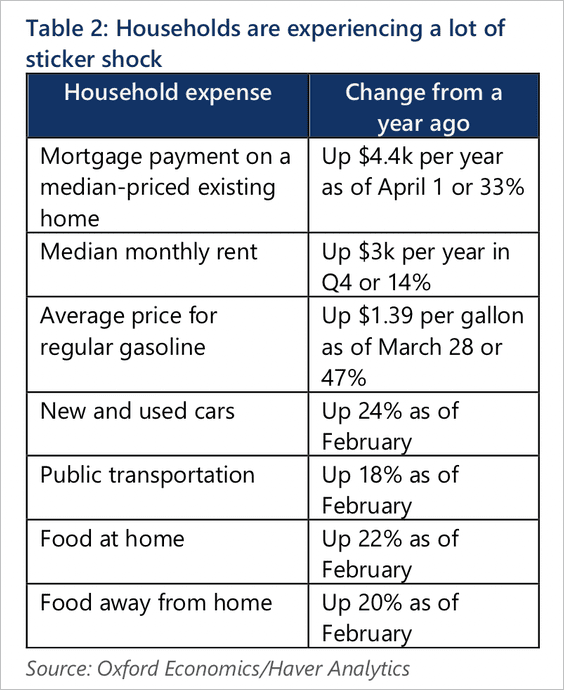
5. Household budgets have been squeezed by inflation.
 Source: Oxford Economics
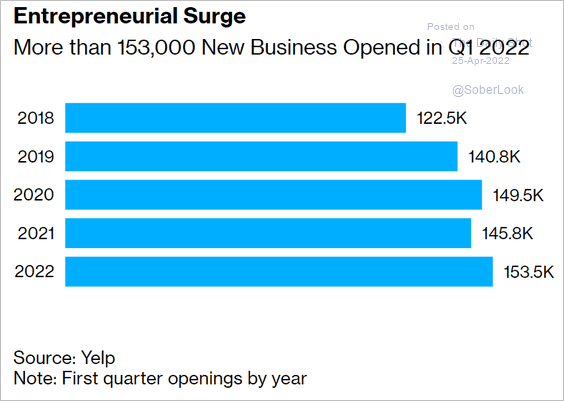
6. Business applications increased further in the first quarter.
 Source: @economics Read full article
Back to Index
The United Kingdom
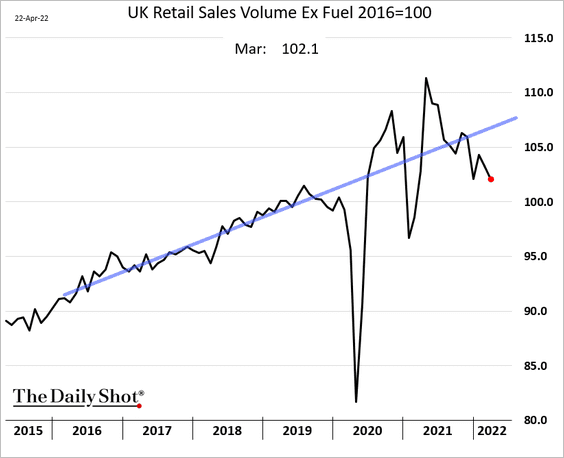
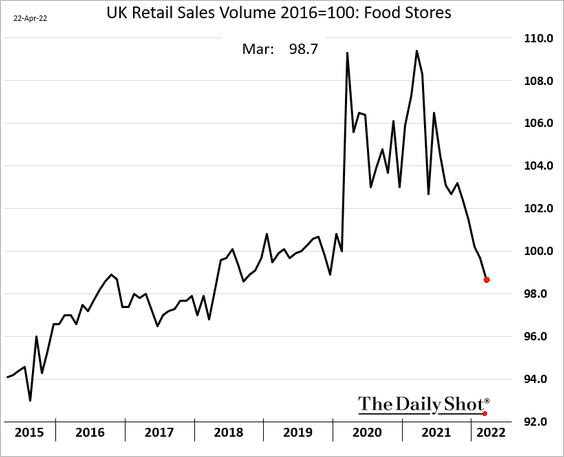
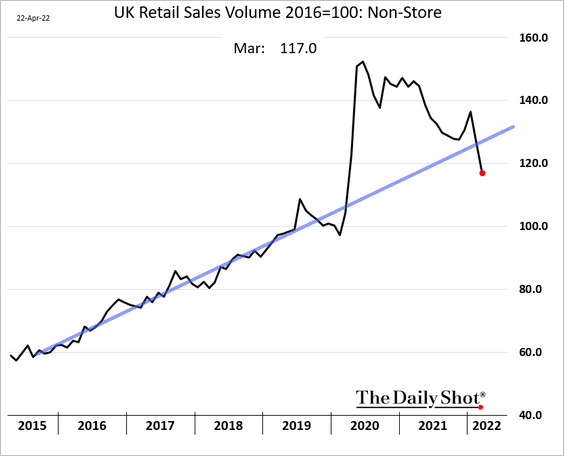
1. Retail sales deteriorated in March as prices surged.
• Food sales:
• Non-store (internet) sales:
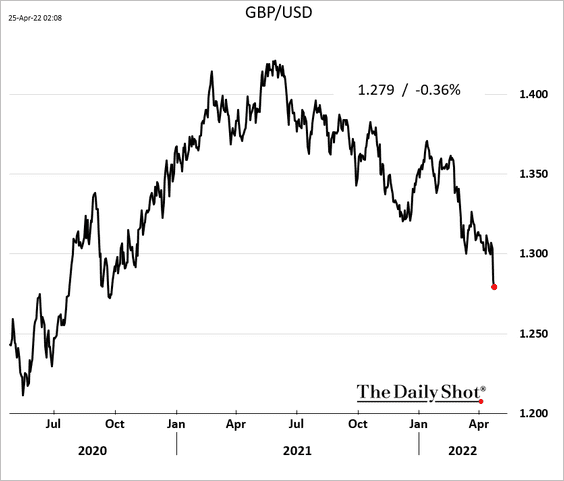
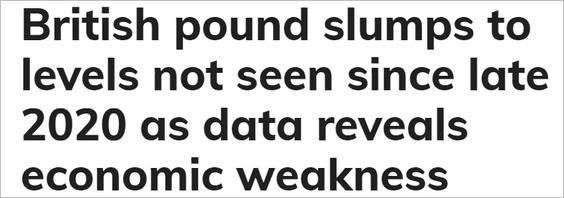
The pound slumped in response to the report.
 Source: MarketWatch Read full article
——————–
2. Factory activity held up well this month, …
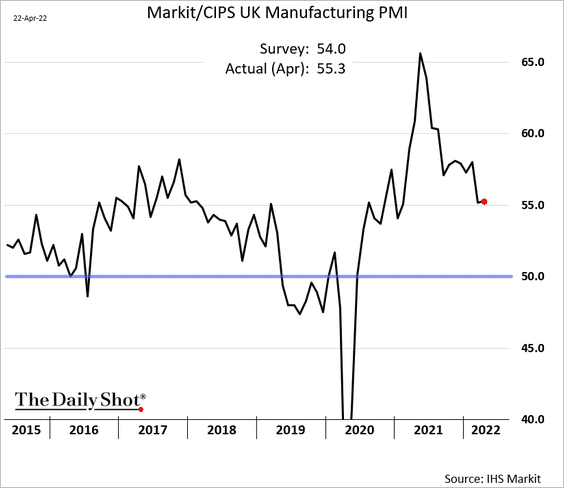
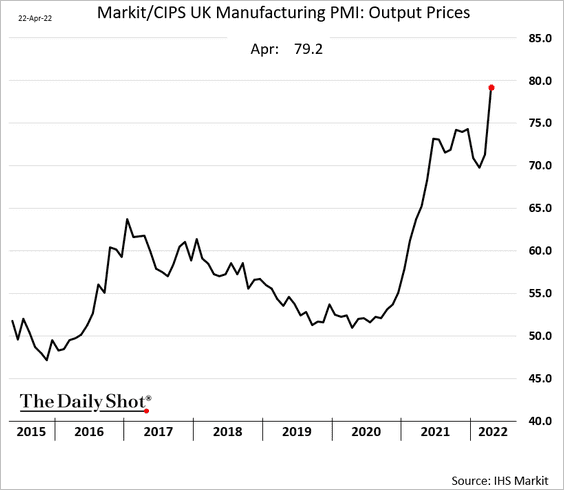
… but the pace of factory price hikes is hitting extreme levels.
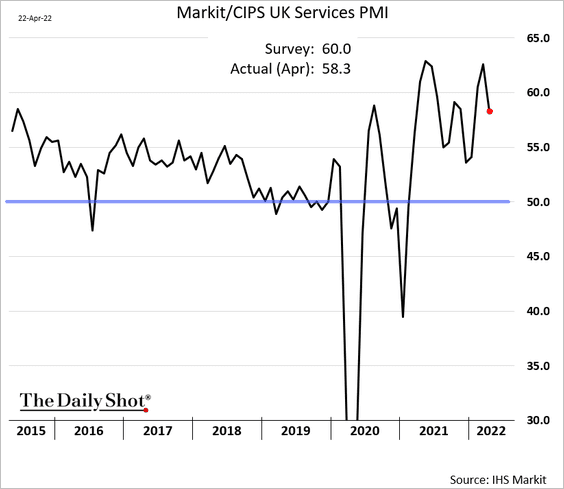
• Services PMI declined but growth remained robust.
——————–
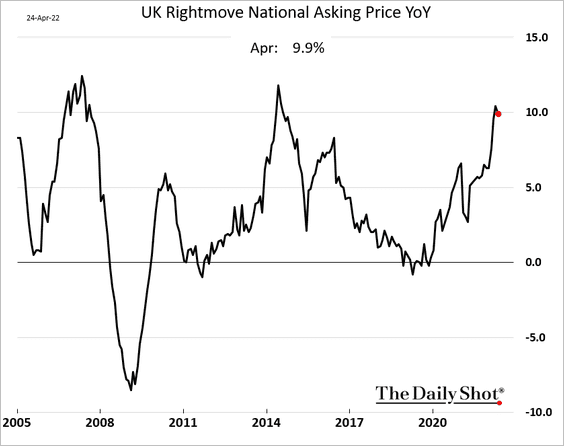
3. The housing market continues to perform well.
Back to Index
The Eurozone
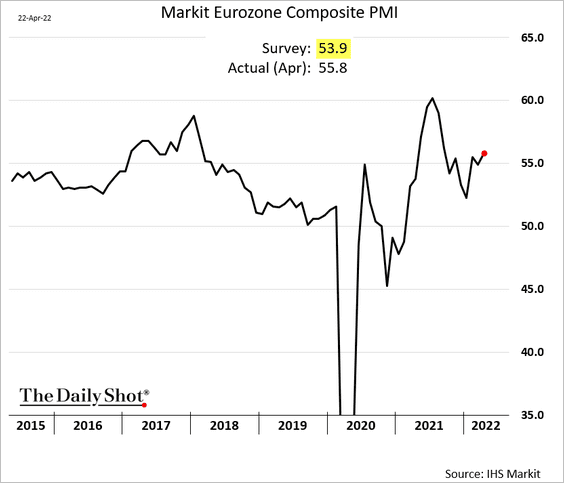
1. Overall, the April PMI report was better than expected.
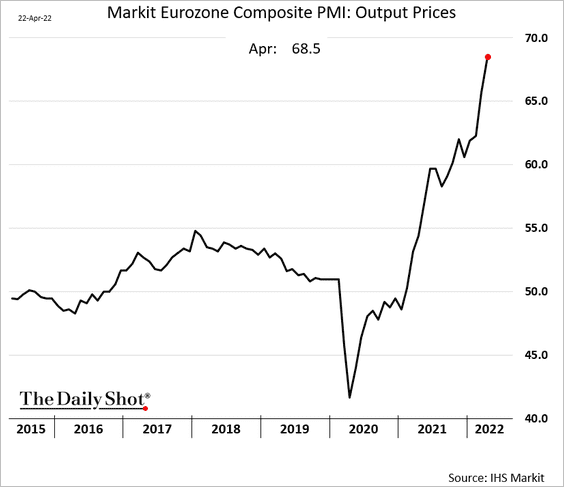
– Businesses are accelerating price hikes.
– Supply bottlenecks remain severe.
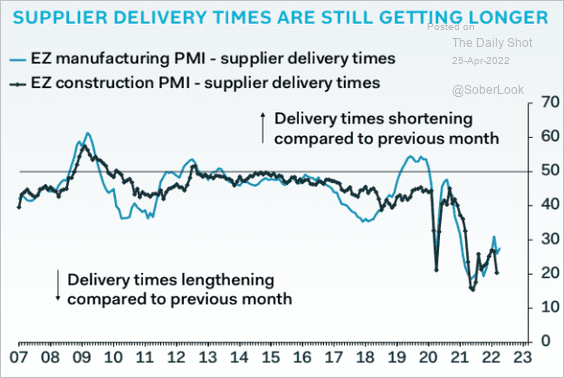 Source: Pantheon Macroeconomics
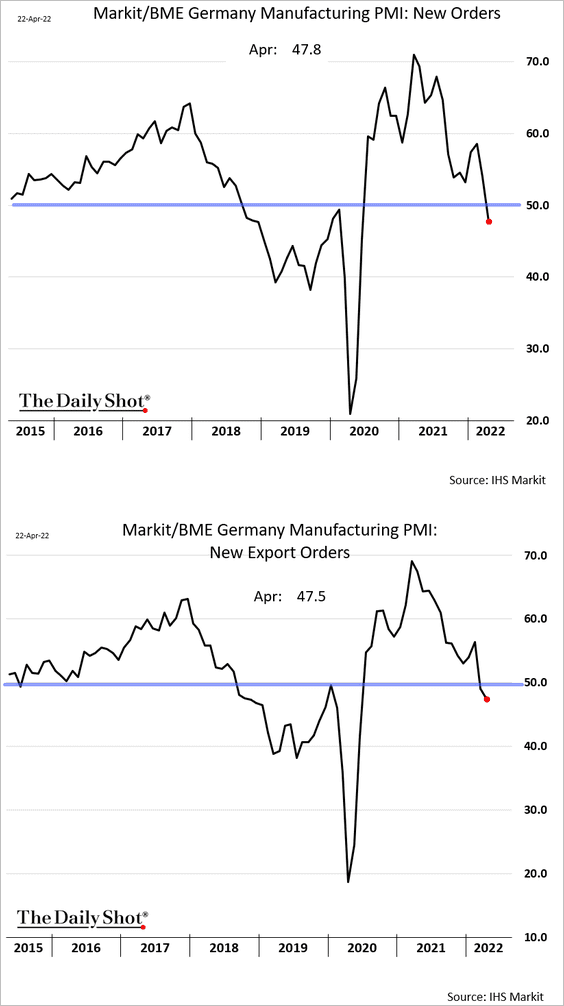
• There are signs of weakness in Germany’s manufacturing activity …
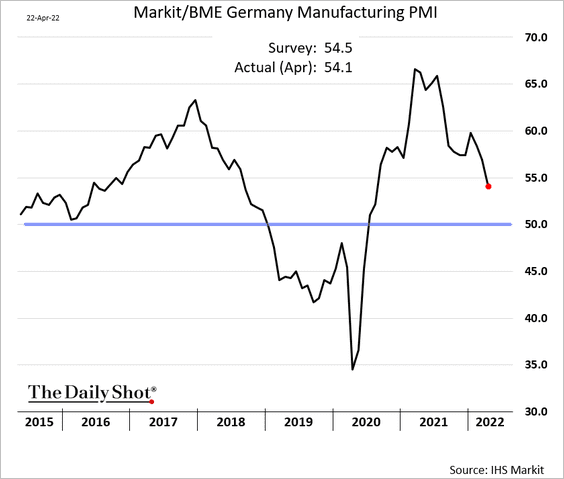
… as new orders shrink for the first time since the early stage of the pandemic.
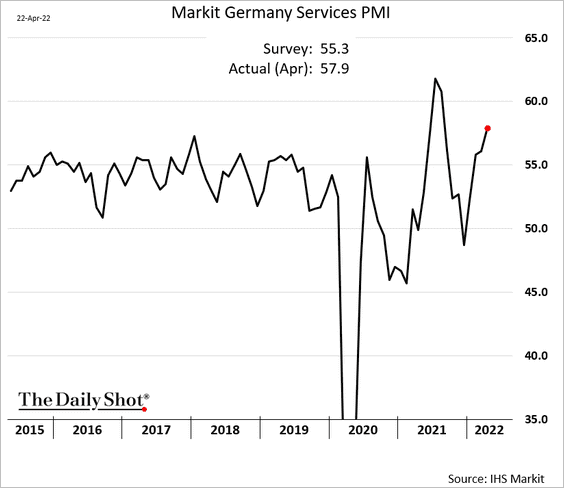
However, Germany’s service-sector activity gained momentum.
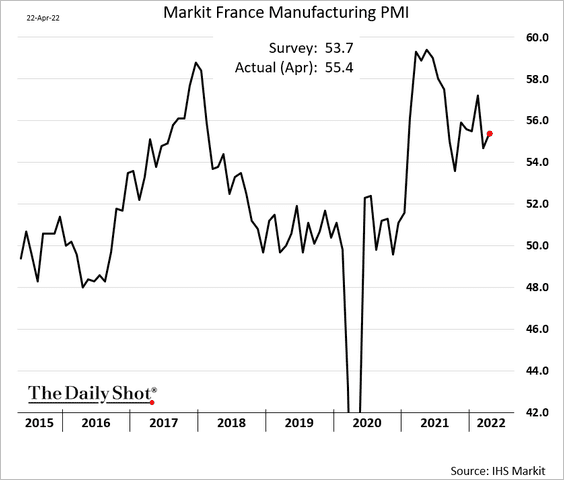
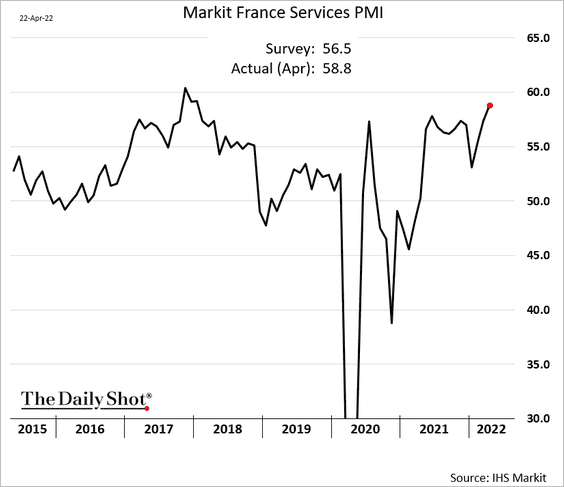
• French business activity accelerated this month.
– Manufacturing:
– Services:
——————–
2. As the betting markets expected, Macron was reelected.
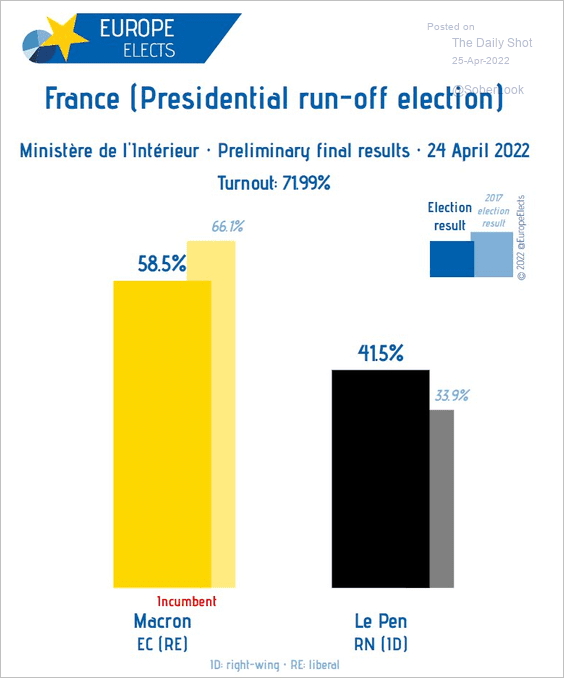 Source: @EuropeElects
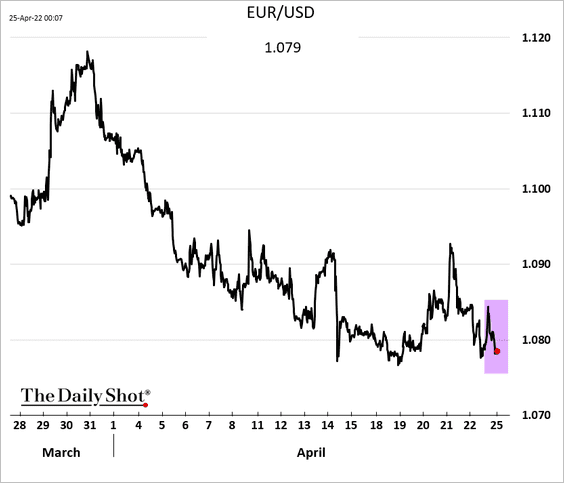
But there was no celebration in the currency markets.
The charts below show the impact of past French presidential elections across markets.
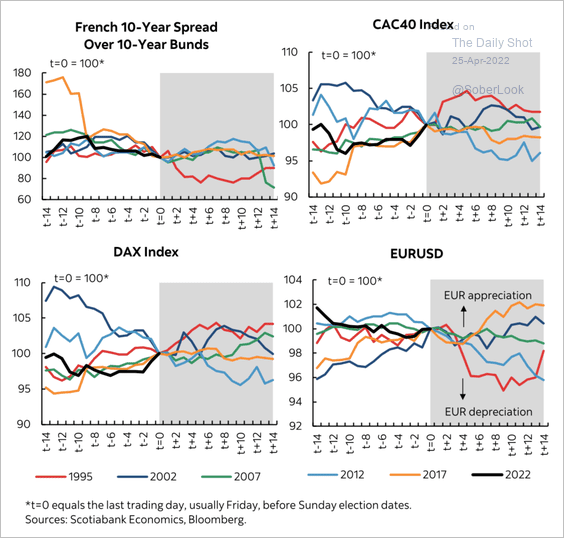 Source: Scotiabank Economics
——————–
3. Germany plans to increase its borrowing this year.
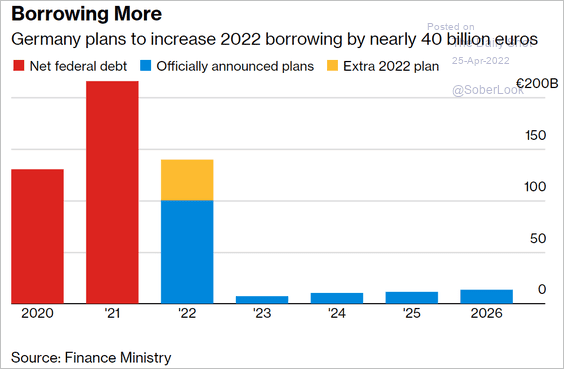 Source: @mcnienaber, @bpolitics Read full article
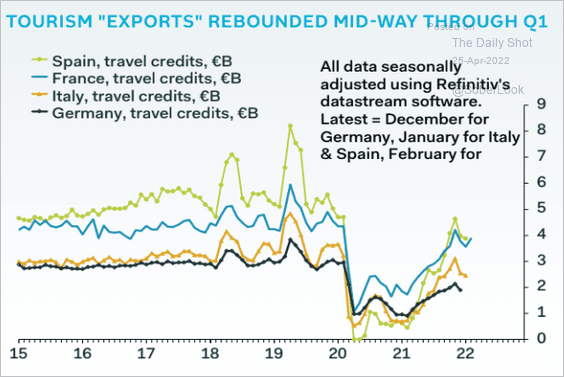
4. Euro-area tourism activity has been rebounding.
 Source: Pantheon Macroeconomics
Back to Index
Europe
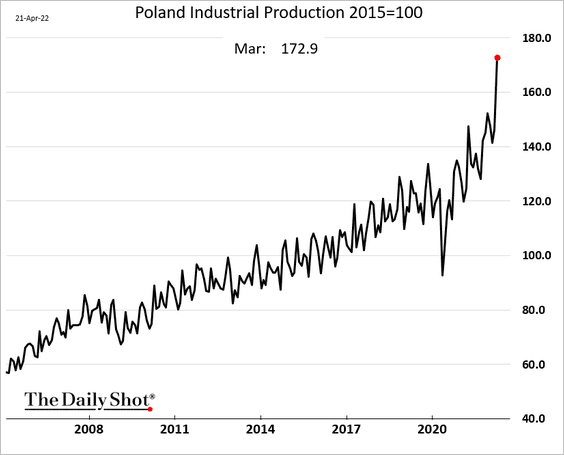
1. Poland’s industrial output soared in March.
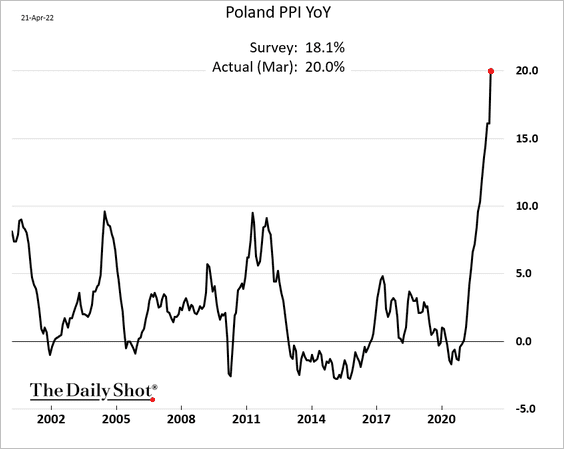
Producer price gains hit 20%.
——————–
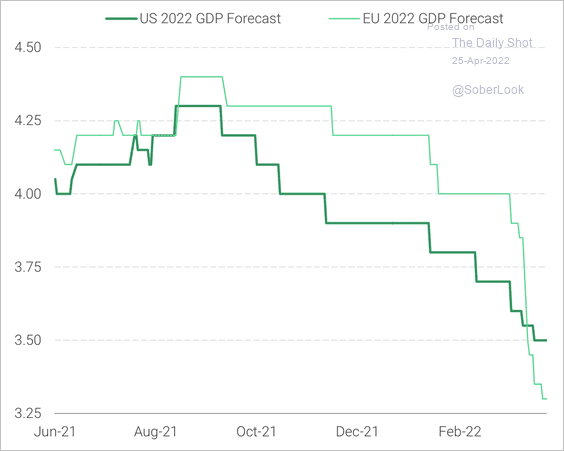
2. Economic growth in the EU is expected to be slower than in the US this year.
 Source: TS Lombard
And inflation forecasts for Europe are catching up with those in the US.
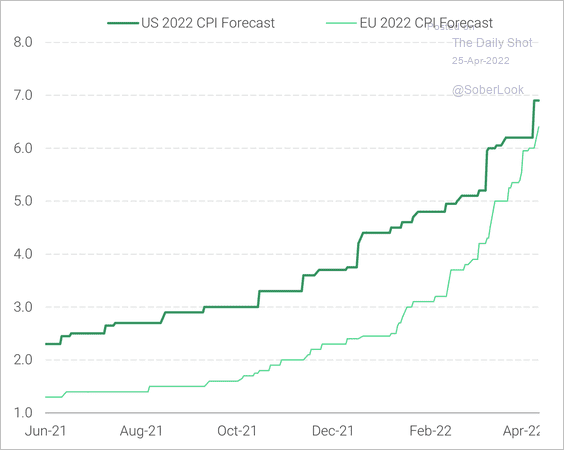 Source: TS Lombard
——————–
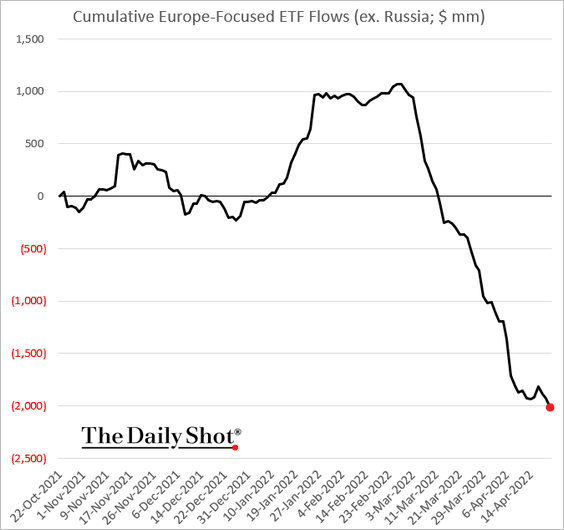
3. Europe-focused equity ETF outflows persist.
Back to Index
China
1. It was a rough week for the renminbi, with further losses on Monday.
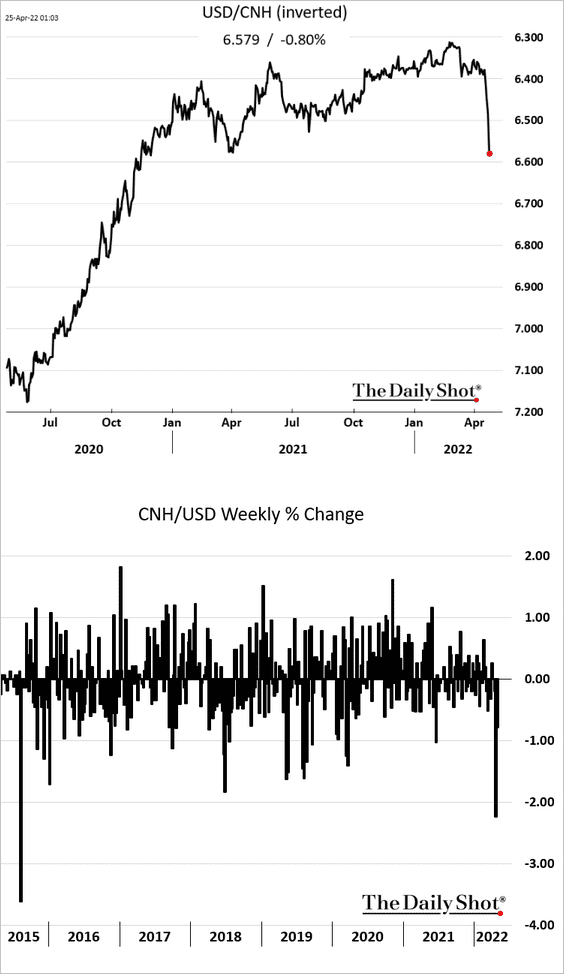
And China’s currency faces additional downside risks (2 charts).
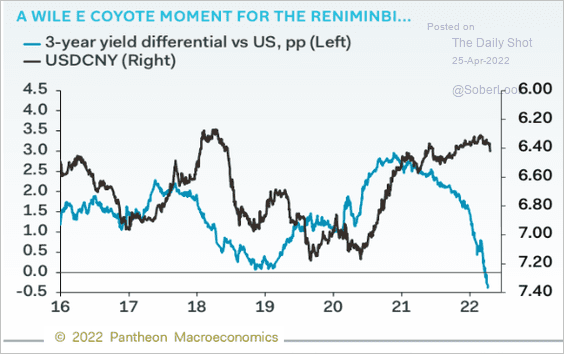 Source: Pantheon Macroeconomics
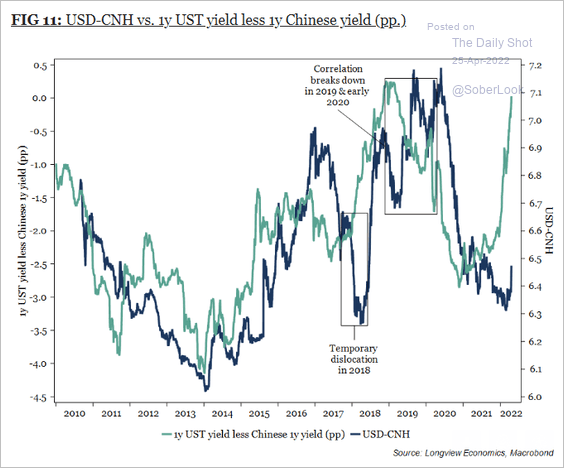 Source: Longview Economics
——————–
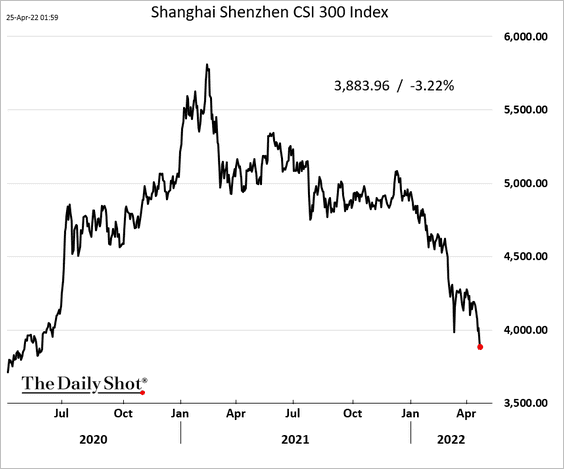
2. The nation’s stock market is facing severe headwinds as the economy slows.
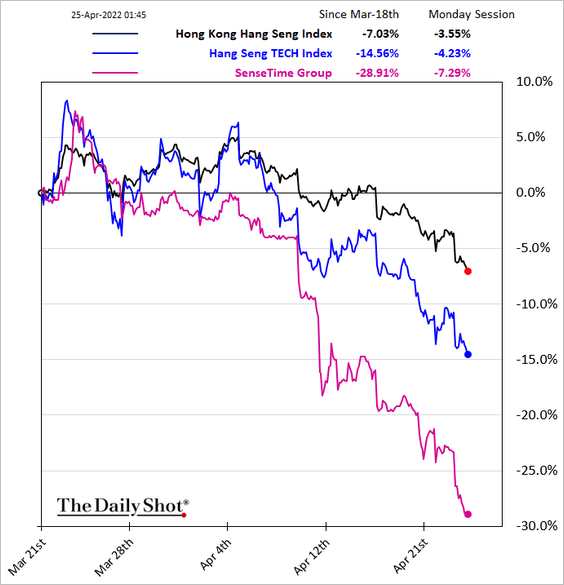
Tech shares in Hong Kong continue to tumble.
——————–
3. Business activity in Shanghai remains depressed.
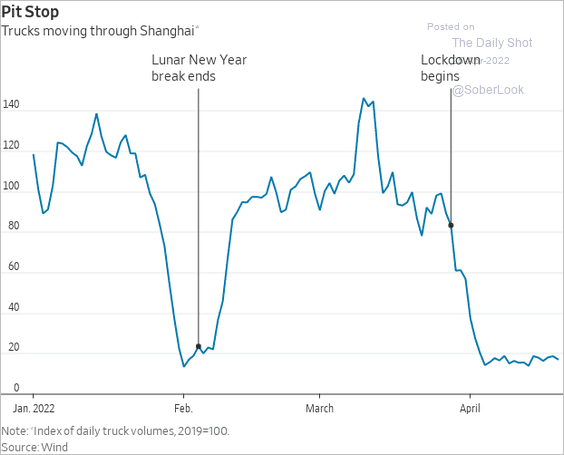 Source: @WSJ Read full article
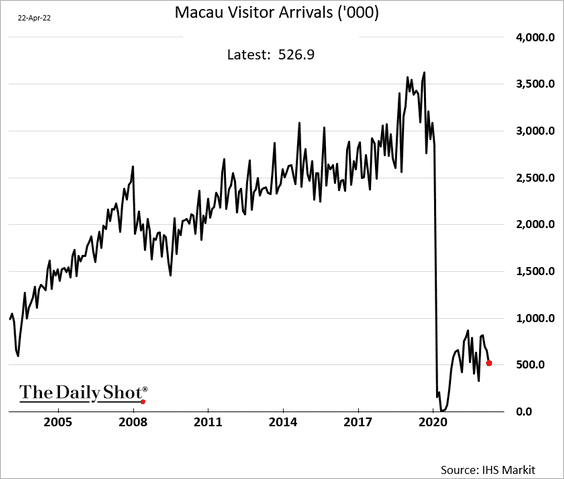
4. This chart shows visitor arrivals in Macau.
Back to Index
Emerging Markets
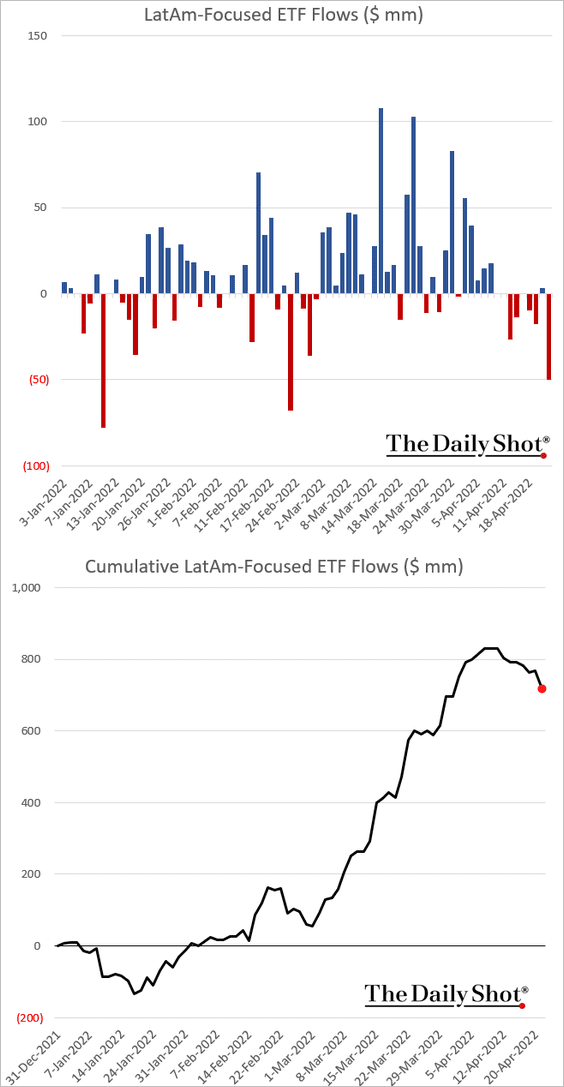
1. LatAm ETF flows are rolling over.
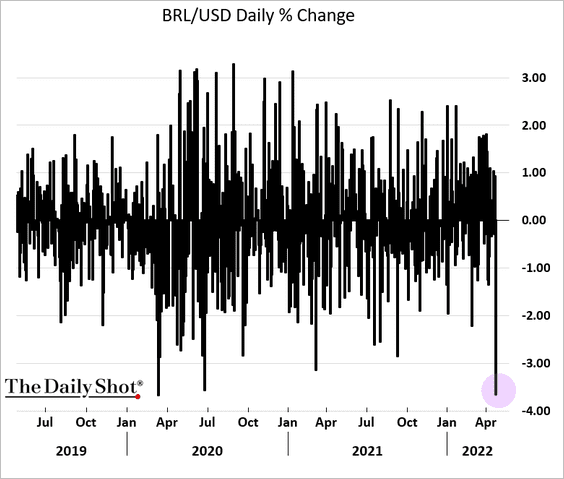
2. The Brazilian real took a hit on Friday.
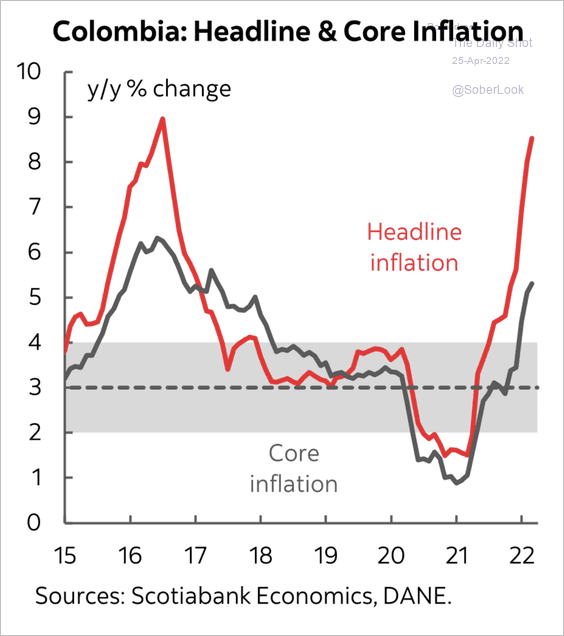
3. Colombia’s headline and core inflation are far above the central bank’s inflation target.
 Source: Scotiabank Economics
Analysts expect Colombia’s central bank to raise rates by 100 basis points this month.
 Source: Nasdaq Read full article
——————–
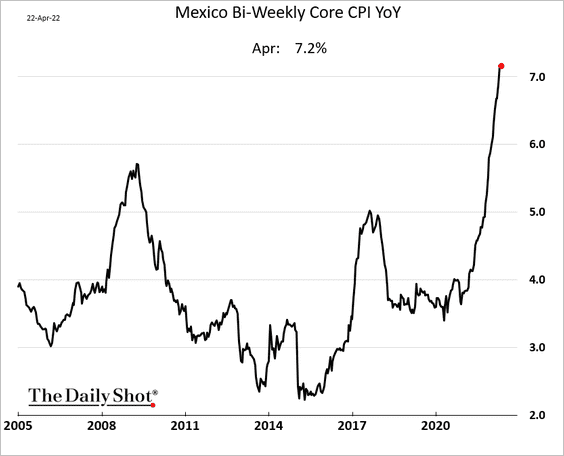
4. Mexican consumer inflation is holding above 7%.
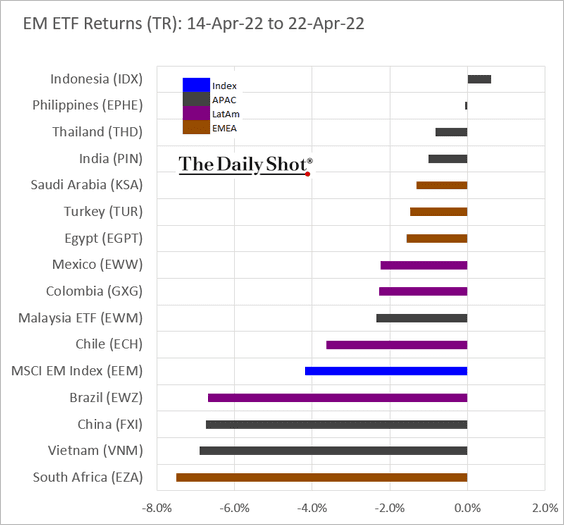
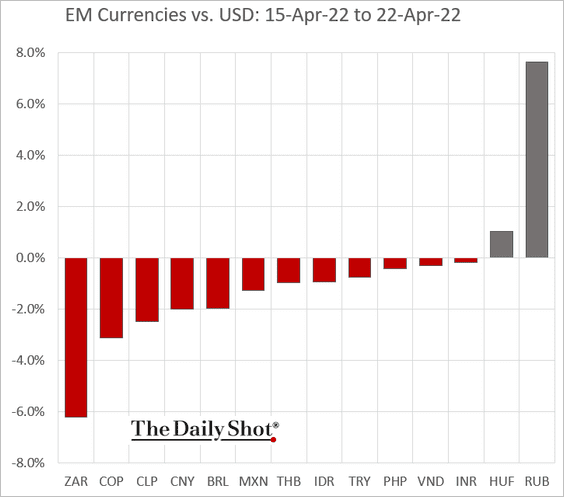
5. Finally, we have last week’s performance across …
• … equity ETFs
• … and EM currencies.
Back to Index
Cryptocurrency
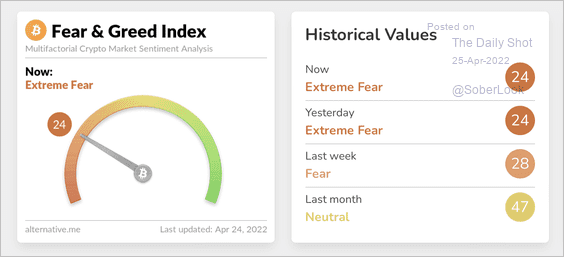
1. Bitcoin’s Fear & Greed index dipped into the “extreme fear” zone.
 Source: Alternative.me
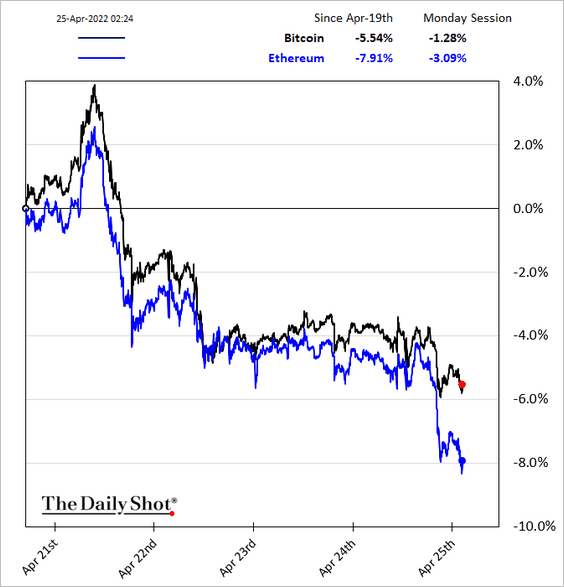
2. Ether is underperforming today.
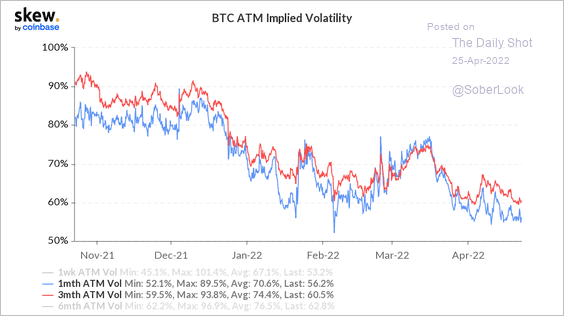
3. Bitcoin’s implied volatility continues to decline.
 Source: Skew Read full article
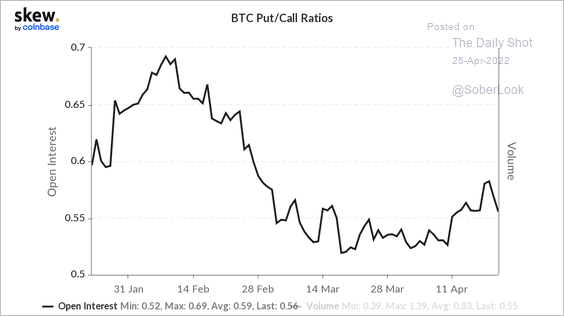
4. Bitcoin’s put/call ratio ticked lower over the past few days.
 Source: Skew Read full article
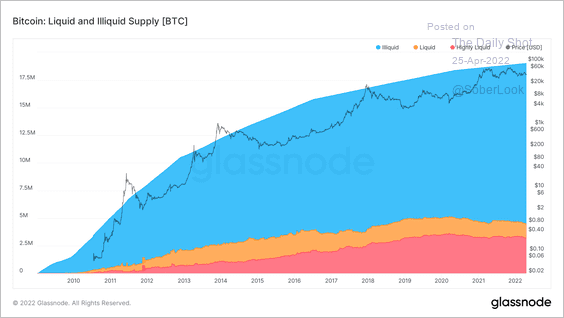
5. There is a growing amount of bitcoin illiquid supply (blue region), which represents that amount of BTC that has not been moved or sold in a while.
 Source: Glassnode Read full article
Back to Index
Commodities
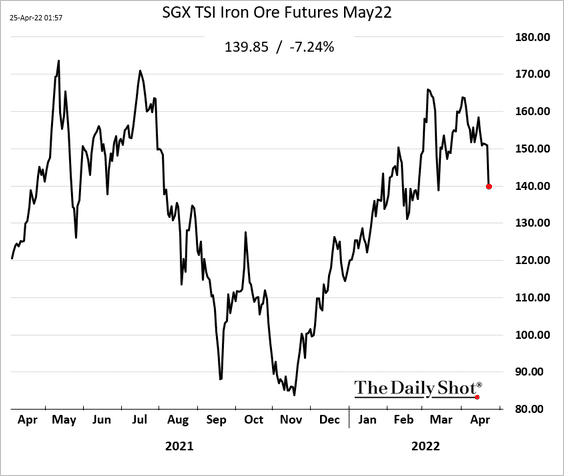
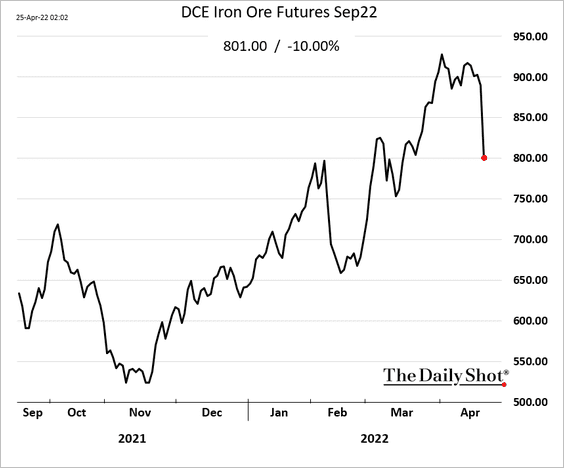
1. Iron ore tumbled today amid concerns about slowing demand from China.
 Source: Bloomberg Read full article
——————–
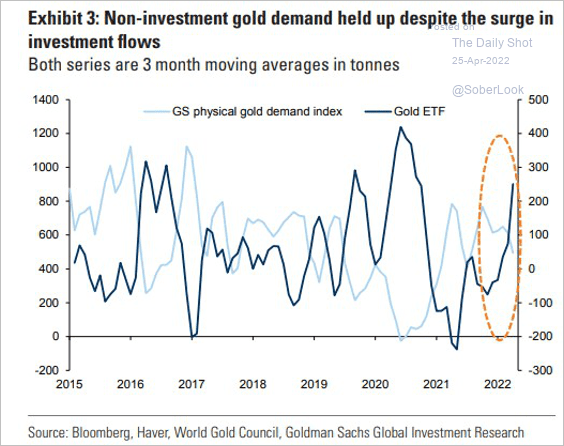
2. Gold physical demand has held up.
 Source: Goldman Sachs
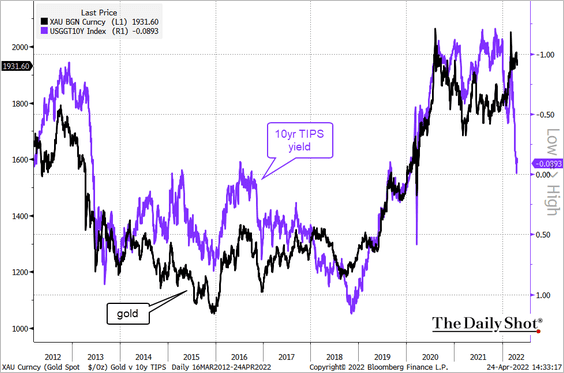
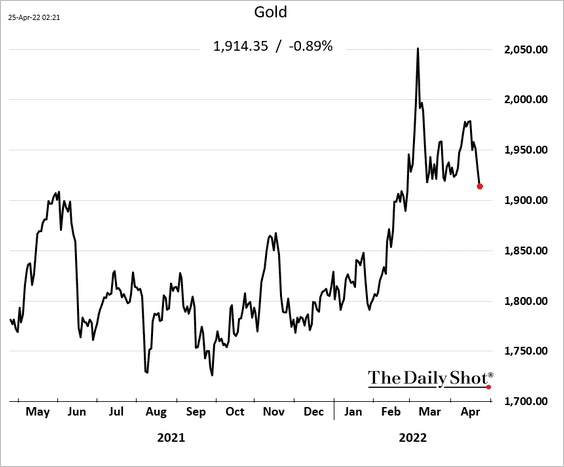
But gold remains vulnerable to downside risks from higher real yields and a stronger US dollar.
 Source: @TheTerminal, Bloomberg Finance L.P.
——————–
3. Indonesia stopped palm oil exports, …
 Source: Reuters Read full article
… which is a tailwind for soybean oil.
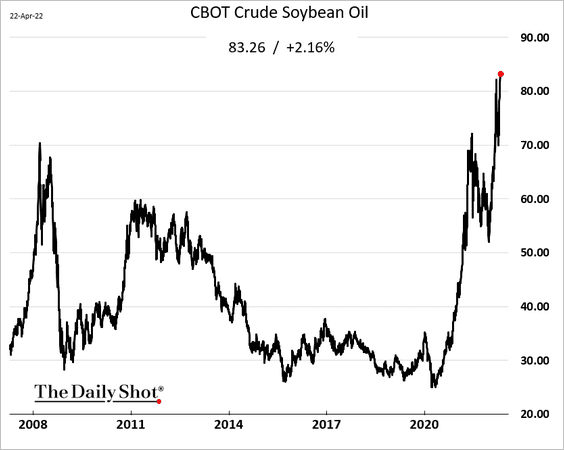
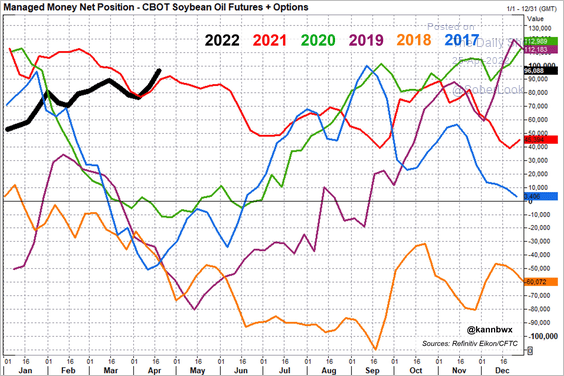
Hedge funds are betting on further strength in soybean oil.
 Source: @kannbwx
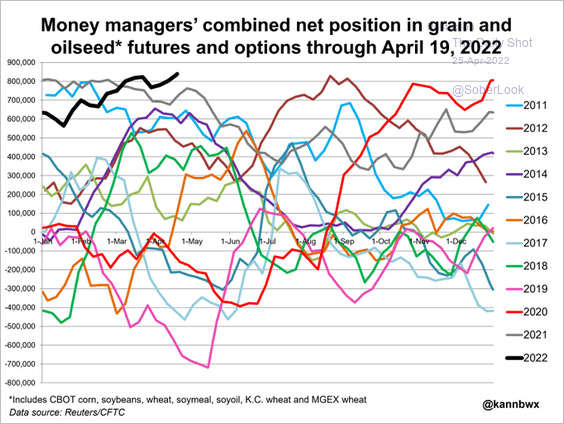
4. This chart shows the combined net position in grain and oilseed futures.
 Source: @kannbwx
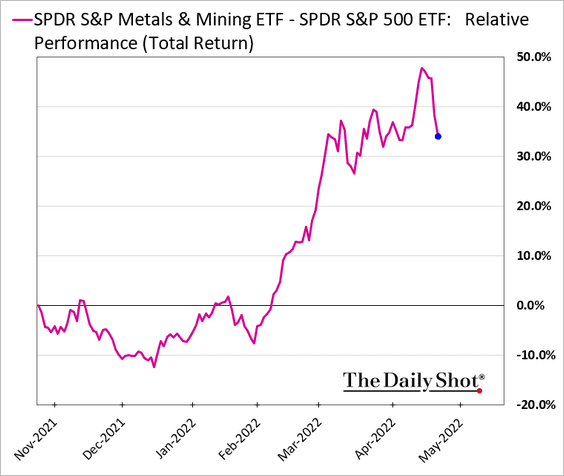
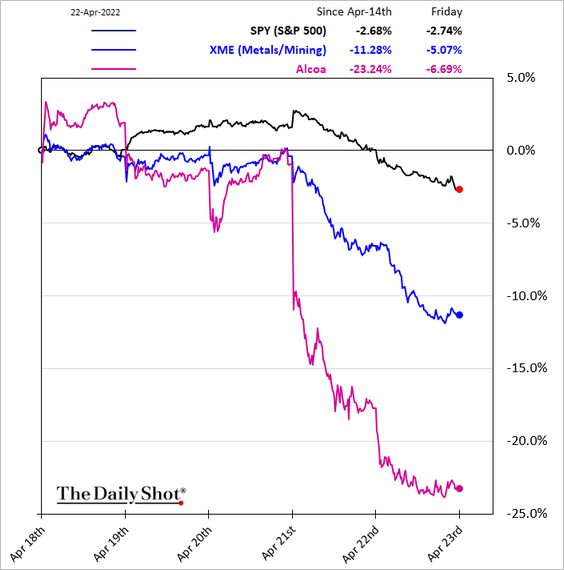
5. The Metals & Mining ETF (relative performance) is rolling over, pointing to concerns about weakening demand.
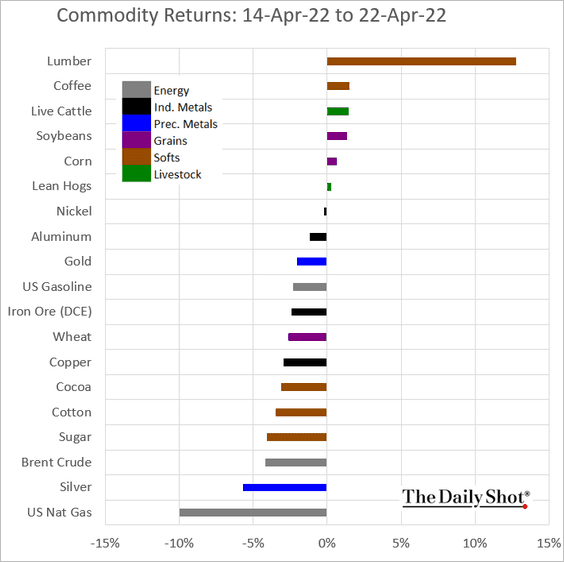
6. This chart shows last week’s performance across various commodity markets.
Back to Index
Equities
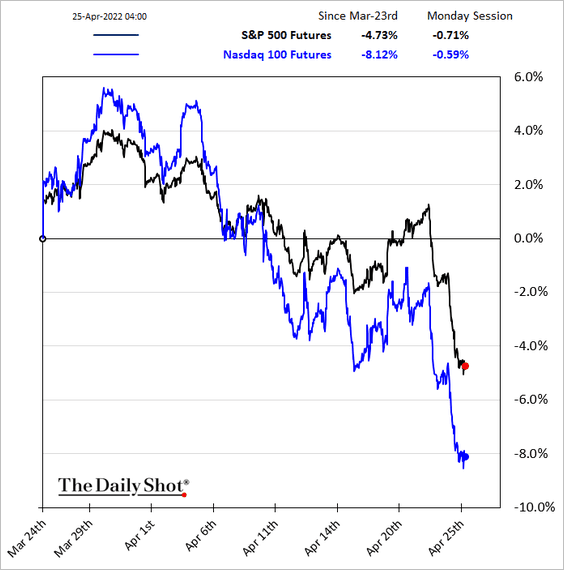
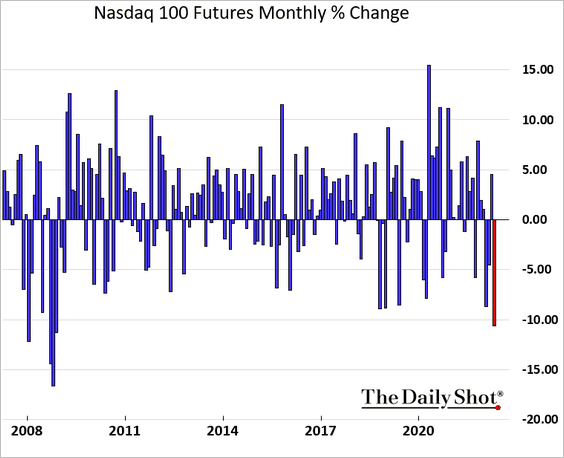
1. Stocks are under pressure from the Fed’s rate hike “front-loading,” as financial conditions tighten.
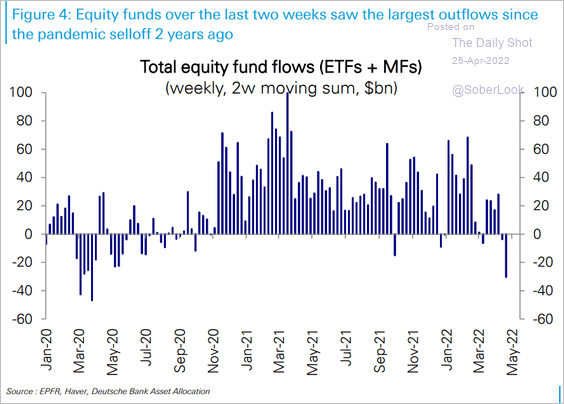
• Equity fund outflows were severe over the past two weeks.
 Source: Deutsche Bank Research
• It’s been a rough month for the Nasdaq 100.
——————–
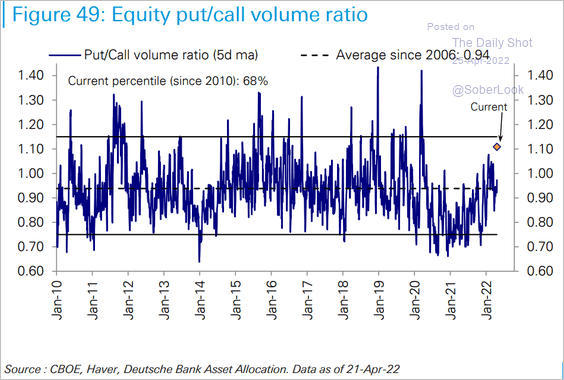
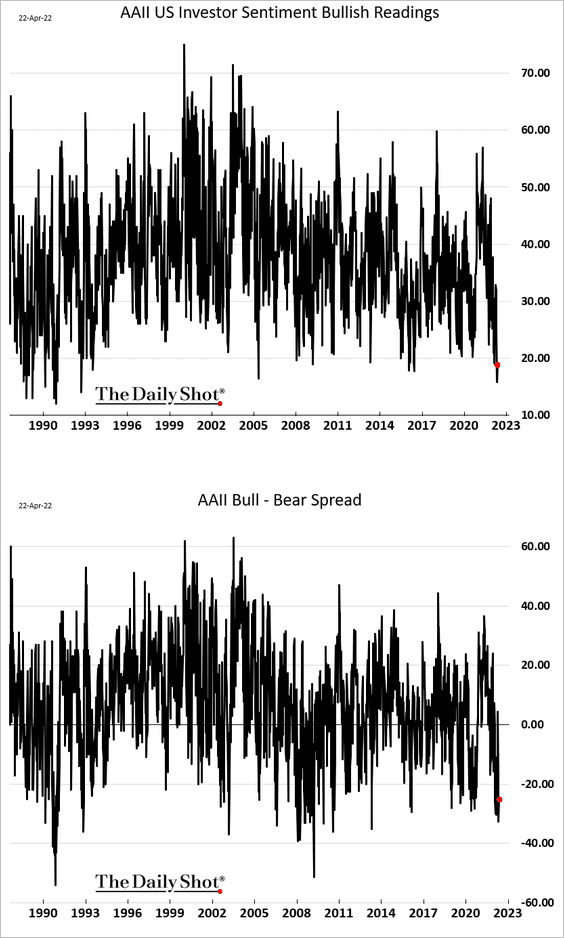
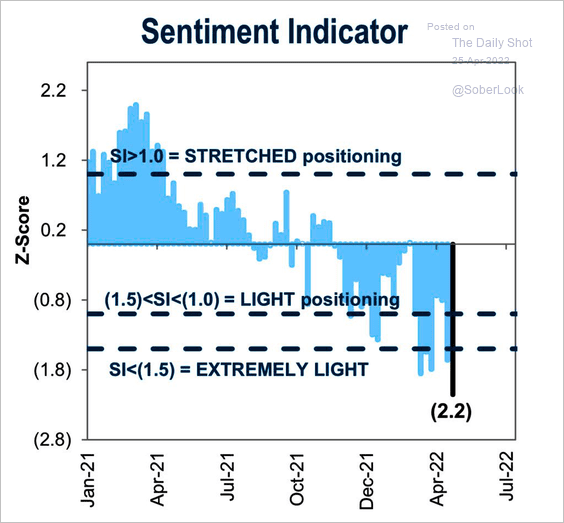
2. Sentiment has deteriorated.
• Put/call ratio:
 Source: Deutsche Bank Research
• AAII:
• Goldman’s sentiment indicator:
 Source: Goldman Sachs; @WallStJesus
Retail investors’ attempt to reload on call options resulted in a painful pullback.
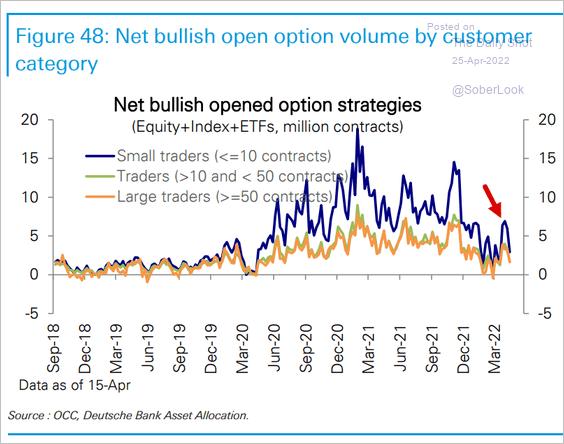 Source: Deutsche Bank Research
——————–
3. Following insider buying activity hasn’t been working well lately.
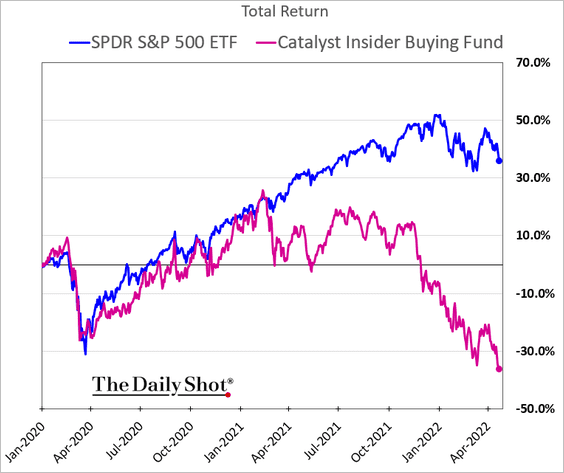 h/t @Callum_Thomas
4. Next, we have last week’s sector performance data.
• Sector returns:
• Banks:
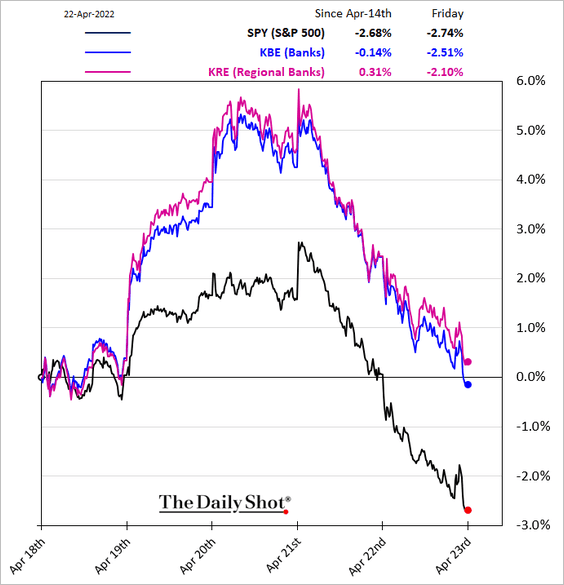
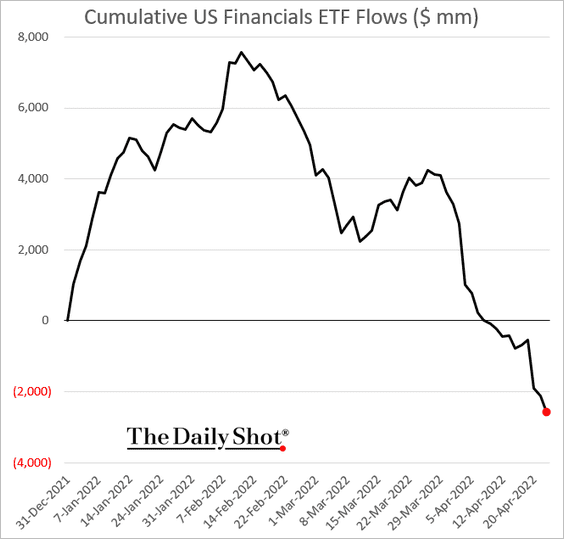
By the way, financials ETF flows remain negative.
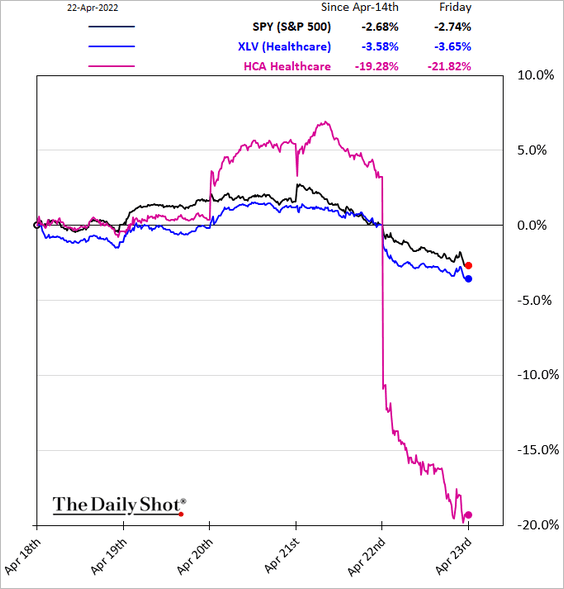
• Healthcare:
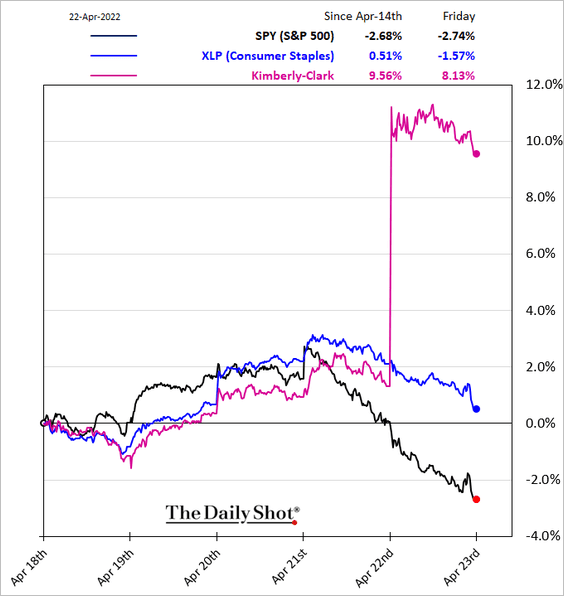
• Consumer Staples:
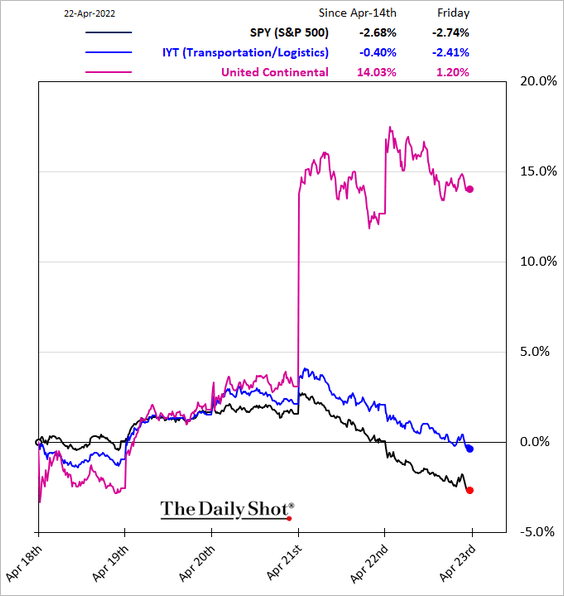
• Transportation:
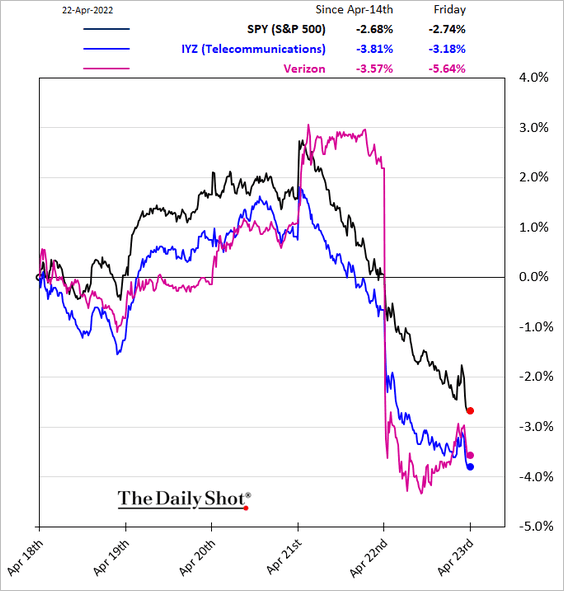
• Telecoms:
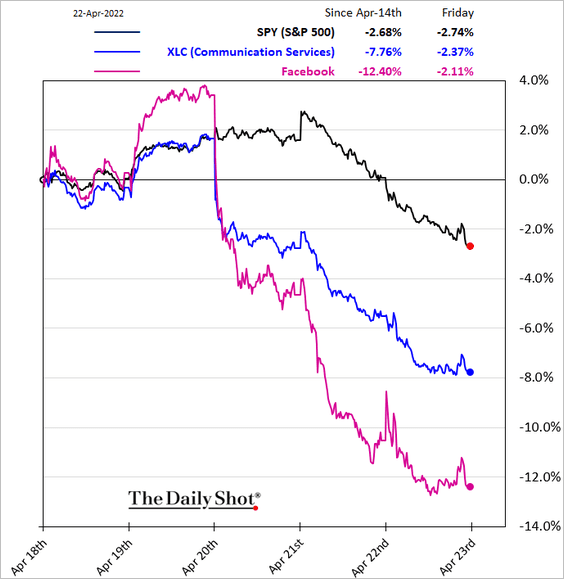
• Communication Services:
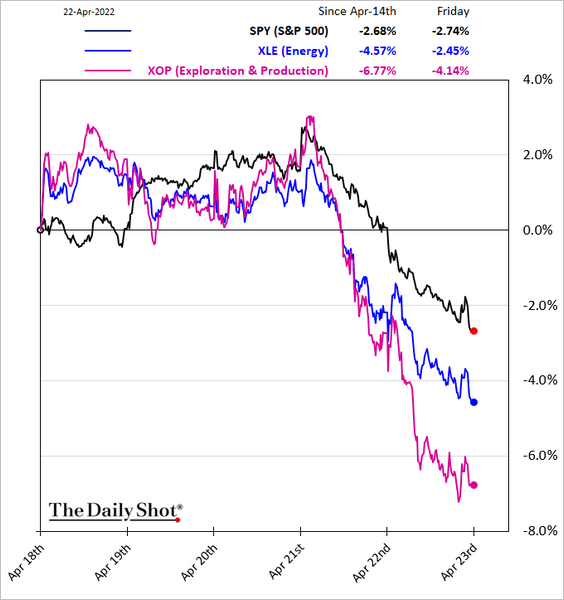
• Energy:
• Metals & Mining:
• REITs:
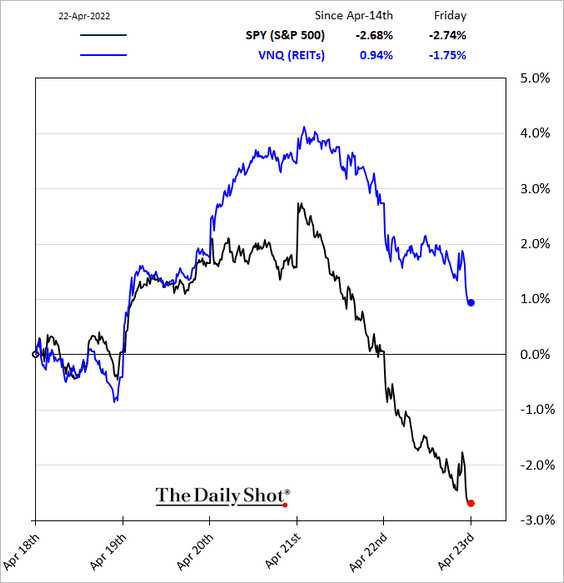
By the way, here is how the REIT industry composition has changed over the past decade.
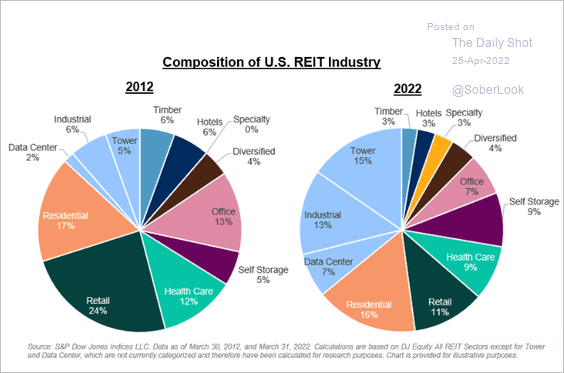 Source: S&P Global Market Intelligence
——————–
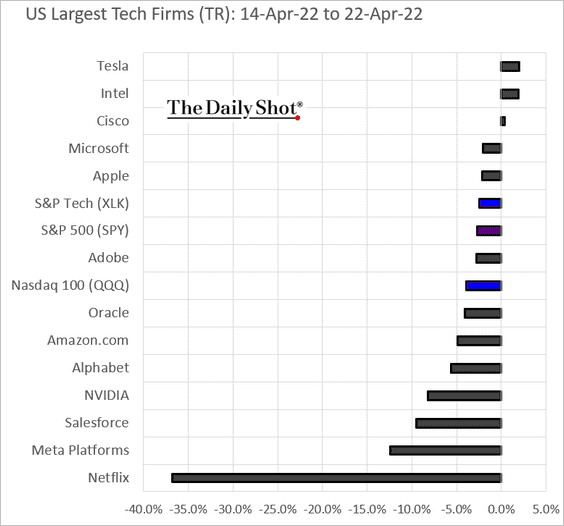
5. Shares of large tech firms continue to struggle.
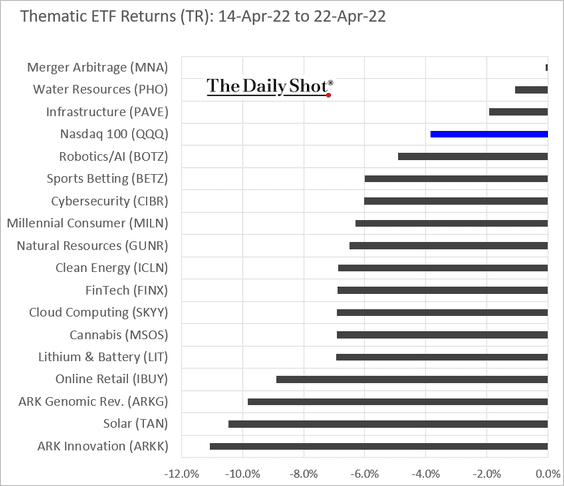
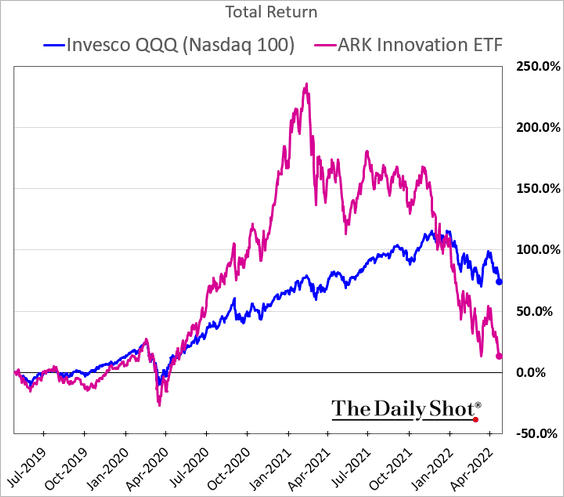
6. Thematic ETFs were in the red across the board last week.
Below is ARK Innovation.
——————–
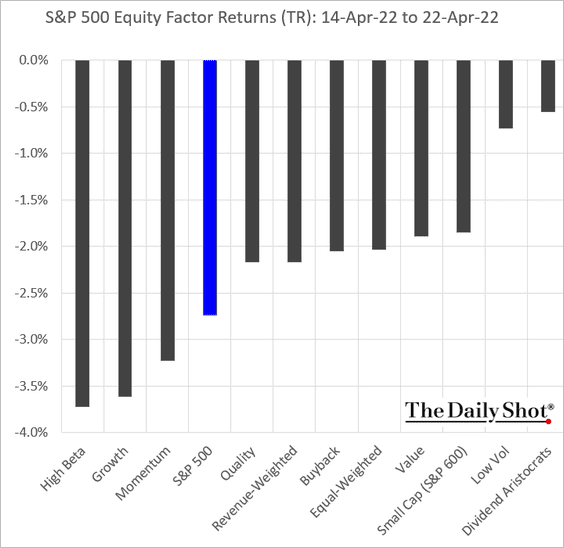
7. Finally, we have last week’s factor performance.
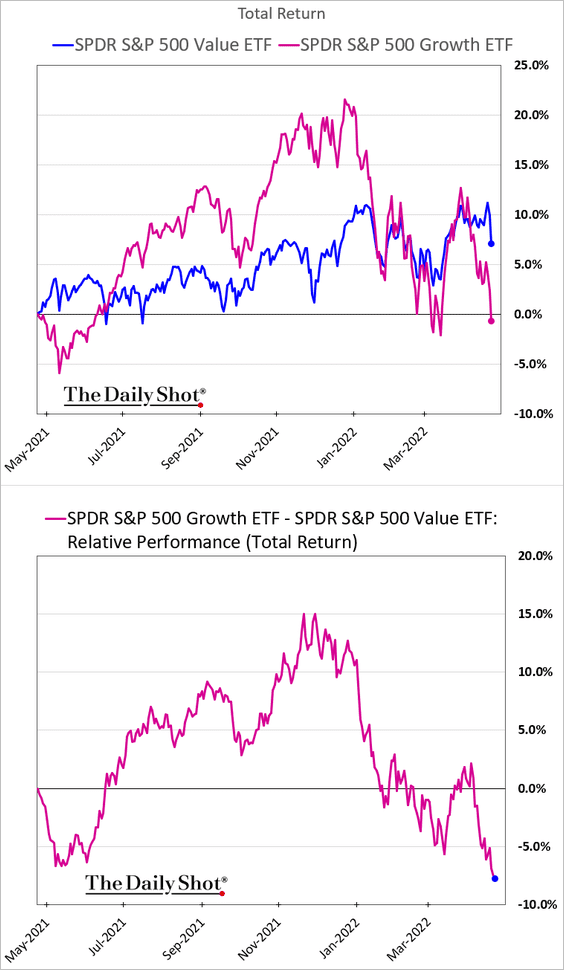
And this is value vs. growth over the past year.
Back to Index
Credit
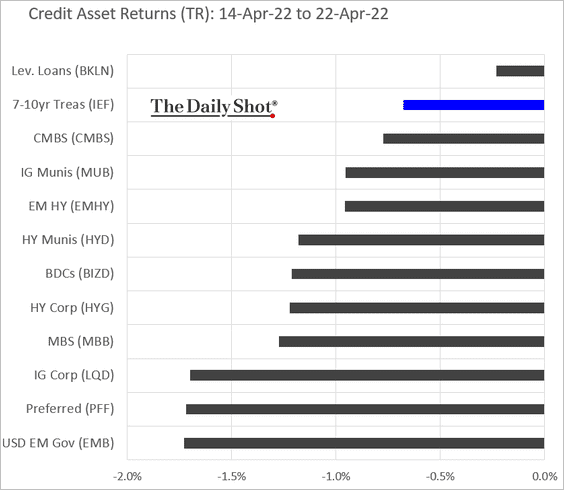
Credit markets were broadly lower last week. Even leveraged loans sold off with equities.
Back to Index
Rates
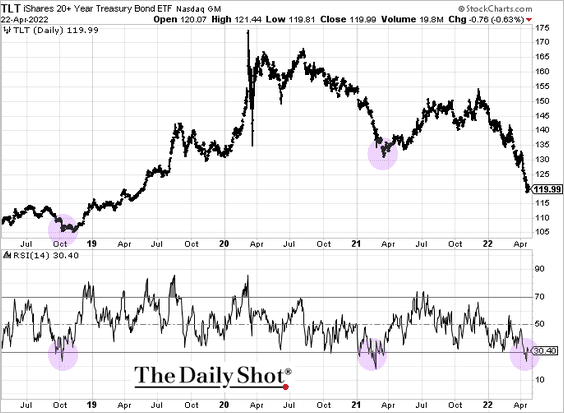
1. Technicals suggest that longer-term Treasuries are due for a bounce (especially if we see signs of softer economic activity).
2. Over the past 35 years, long-duration Treasuries have had an average return of 12% during equity market drawdowns of 20% or more.
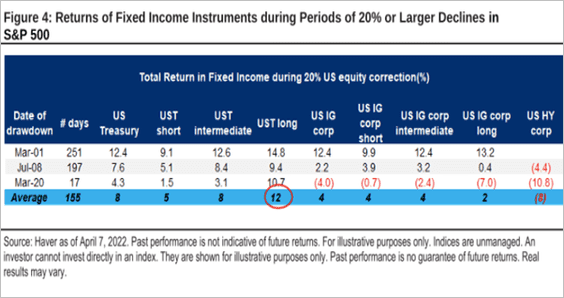 Source: Citi Private Bank
3. It took a year, but the gap between the copper-to-gold ratio and the 10yr Treasury yield has closed.
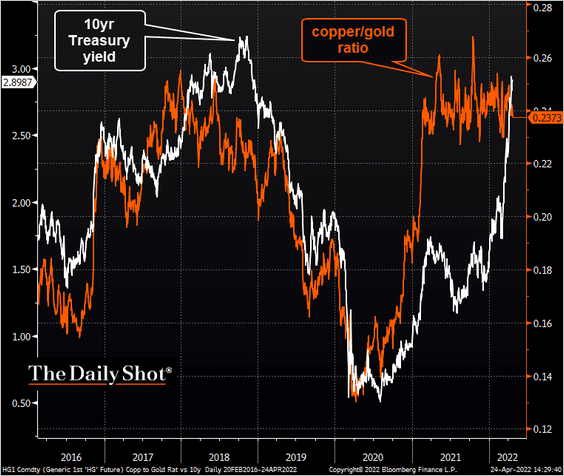 Source: @TheTerminal, Bloomberg Finance L.P.
4. Given the recent surge in longer-term inflation expectations, bond term premium should be higher for both the US and the euro area.
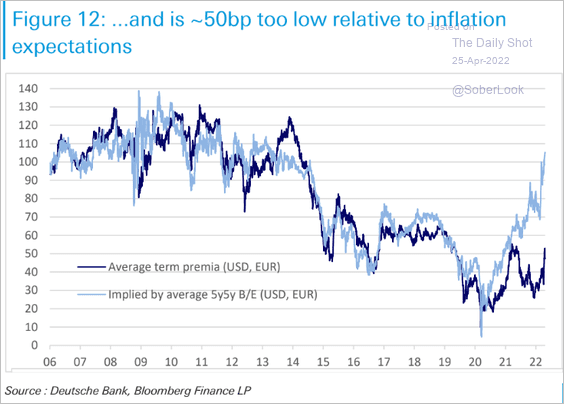 Source: Deutsche Bank Research
Back to Index
Global Developments
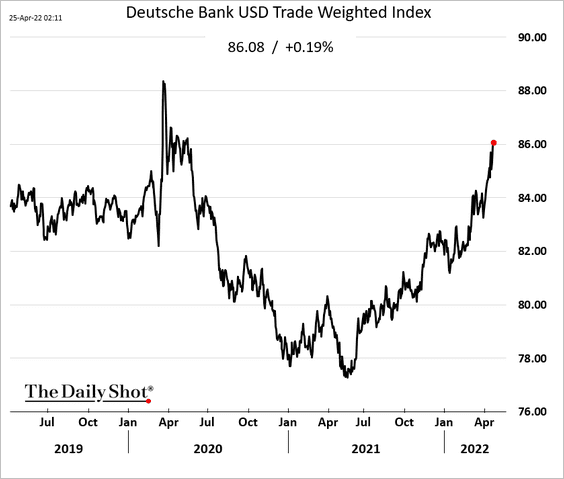
1. The US dollar continues to rally.
Below is the year-over-year performance.
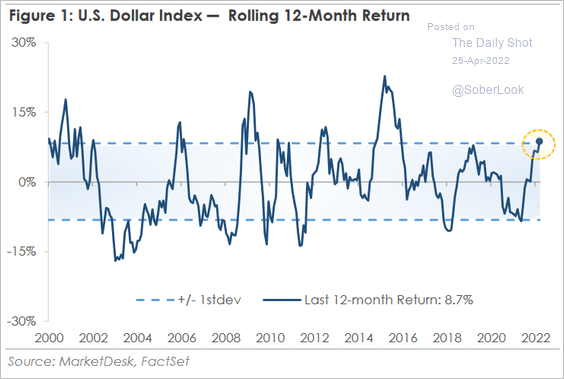 Source: MarketDesk Research
——————–
2. A growing percentage of central banks have been hiking rates.
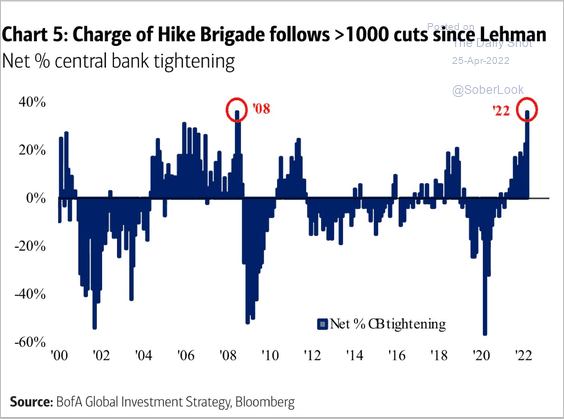 Source: BofA Global Research
3. This chart shows saving rates across advanced economies.
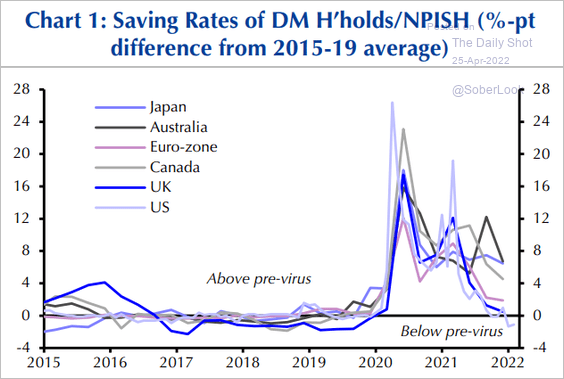 Source: Capital Economics
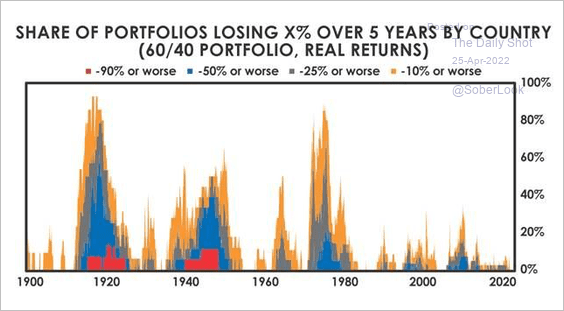
4. It’s been a while since the traditional 60% equity/40% bond portfolio suffered significant losses over a 5-year period (in real terms).
 Source: Bridgewater Associates
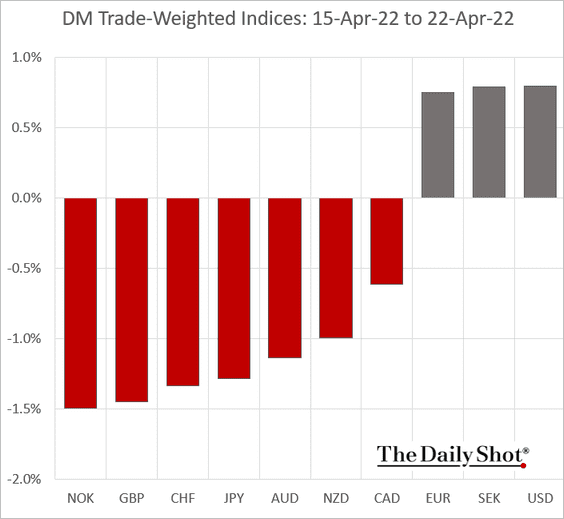
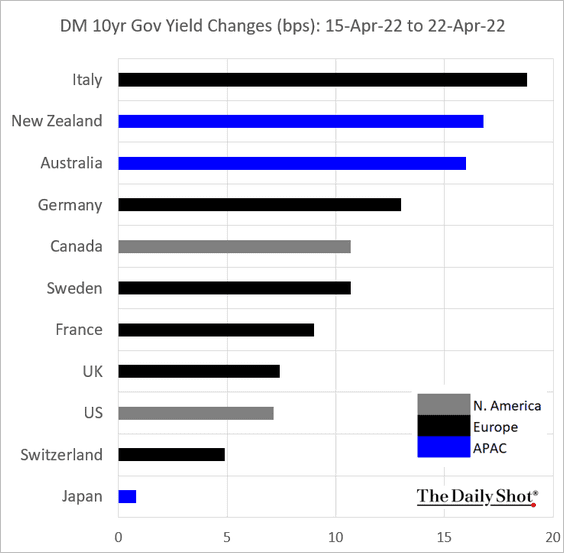
5. Finally, we have some performance data for advanced economies over the past week.
• Trade-weighted currency indices:
• Bond yields:
——————–
Food for Thought
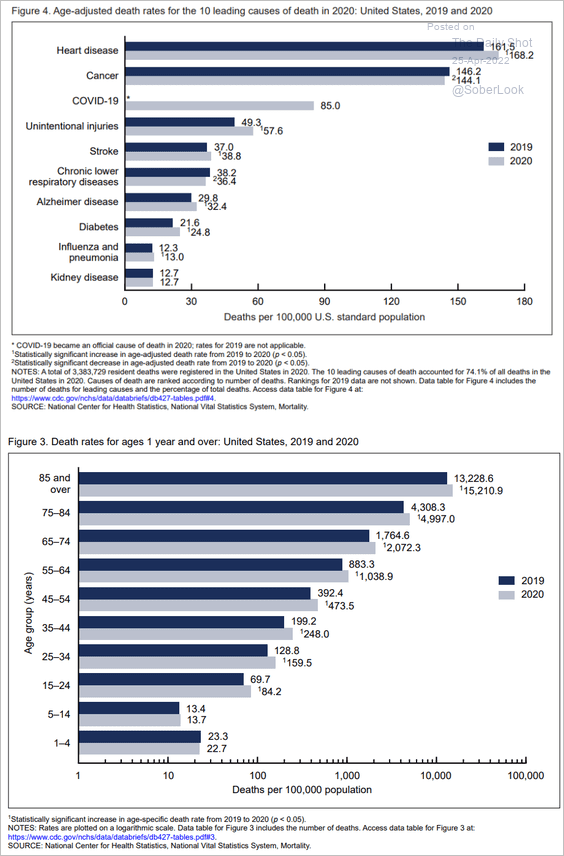
1. US mortality rates in 2019 and 2020:
 Source: NCHS
2. Changes in pedestrian fatalities:
 Source: @axios Read full article
3. Daily or near-daily cannabis consumption among past-month users in Europe:
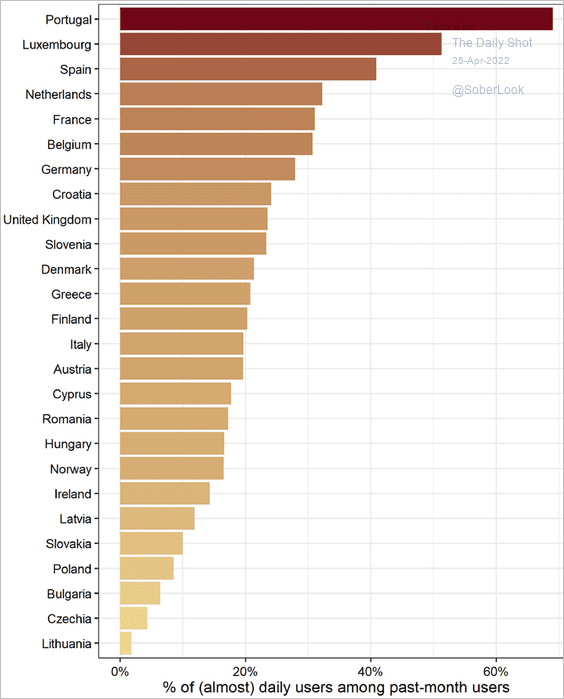 Source: @PotResearch, @ijdrugpolicy Read full article
4. Fake Twitter accounts:
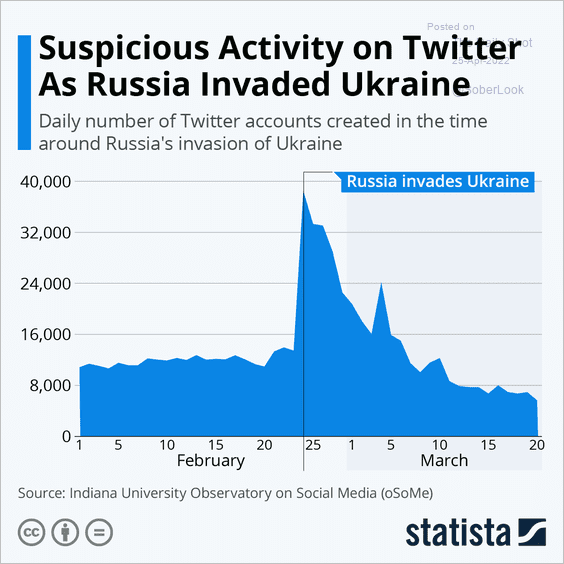 Source: Statista
5. K-12 absenteeism since the start of the pandemic:
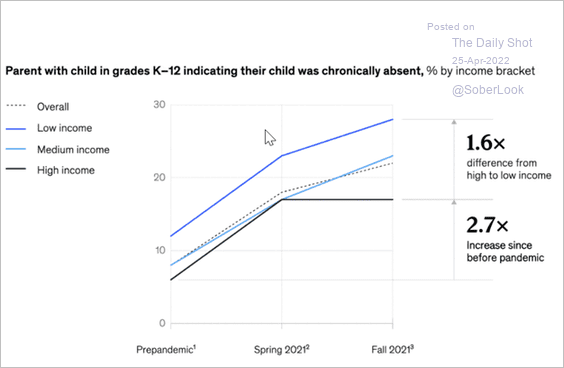 Source: McKinsey & Company Read full article
6. US cities that gained the most workers over the past 12 months:
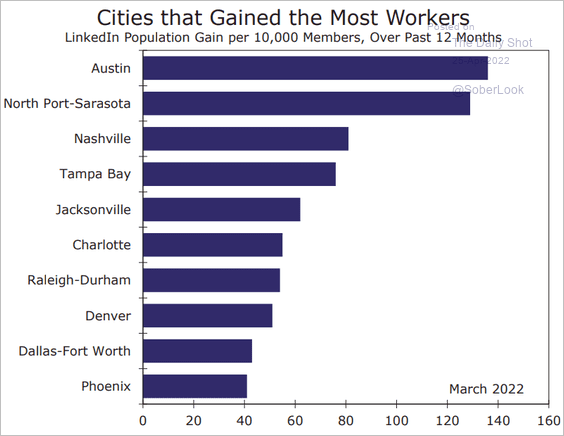 Source: Wells Fargo Securities
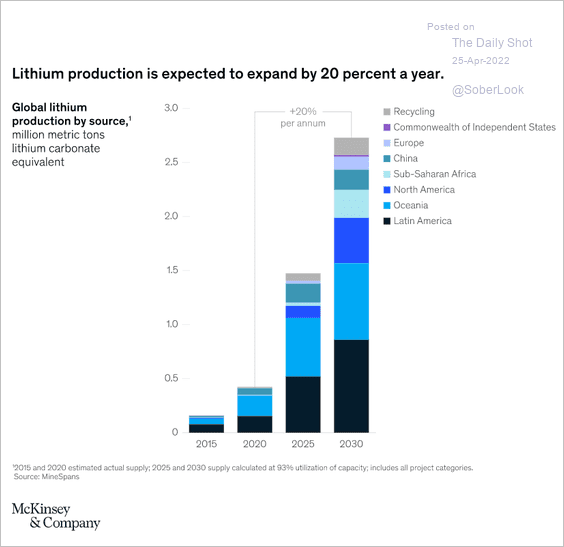
7. Expected global lithium production by source:
 Source: McKinsey & Company Read full article
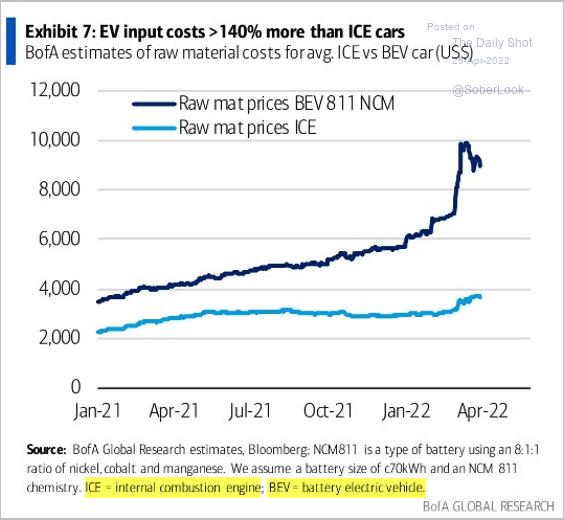
8. Raw materials prices for EVs vs. gasoline/diesel-powered vehicles:
 Source: BofA Global Research; @MichaelAArouet
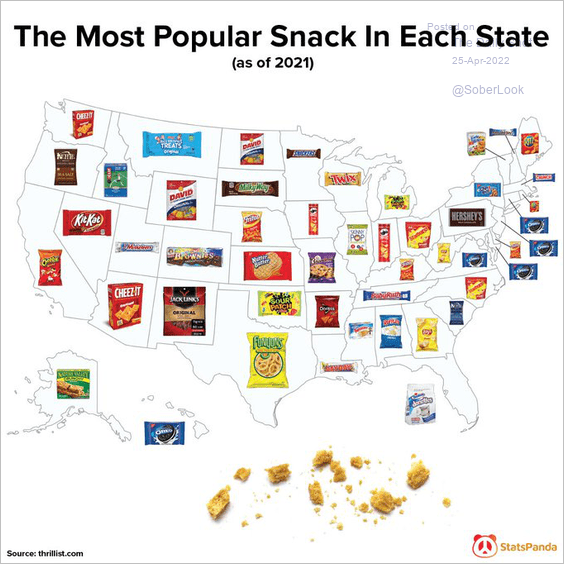
9. The most popular snack in each state:
 Source: @statspanda1 Read full article
——————–
Back to Index
