
The Daily Shot: 28-Apr-22
• The United States
• Canada
• The United Kingdom
• The Eurozone
• Europe
• Japan
• Asia – Pacific
• China
• Emerging Markets
• Cryptocurrency
• Commodities
• Energy
• Equities
• Alternatives
• Credit
• Rates
• Global Developments
• Food for Thought
The United States
1. Let’s begin with the housing market.
• Deteriorating affordability is denting housing demand.
– Redfin’s demand index:
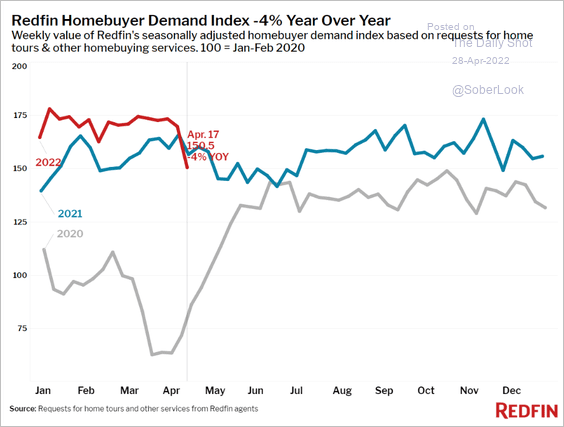 Source: Redfin
– Mortgage applications:
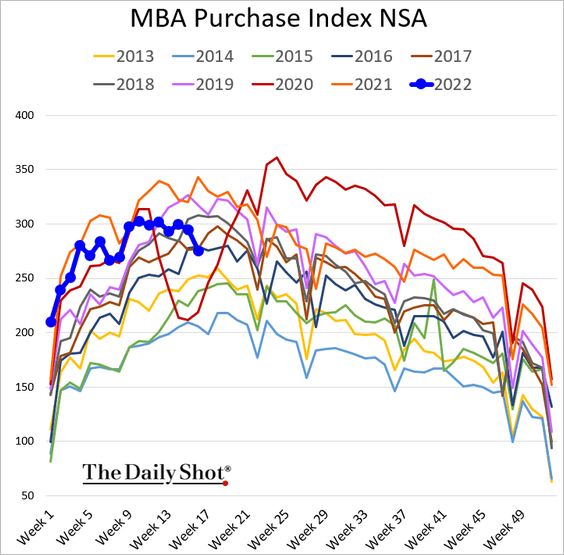
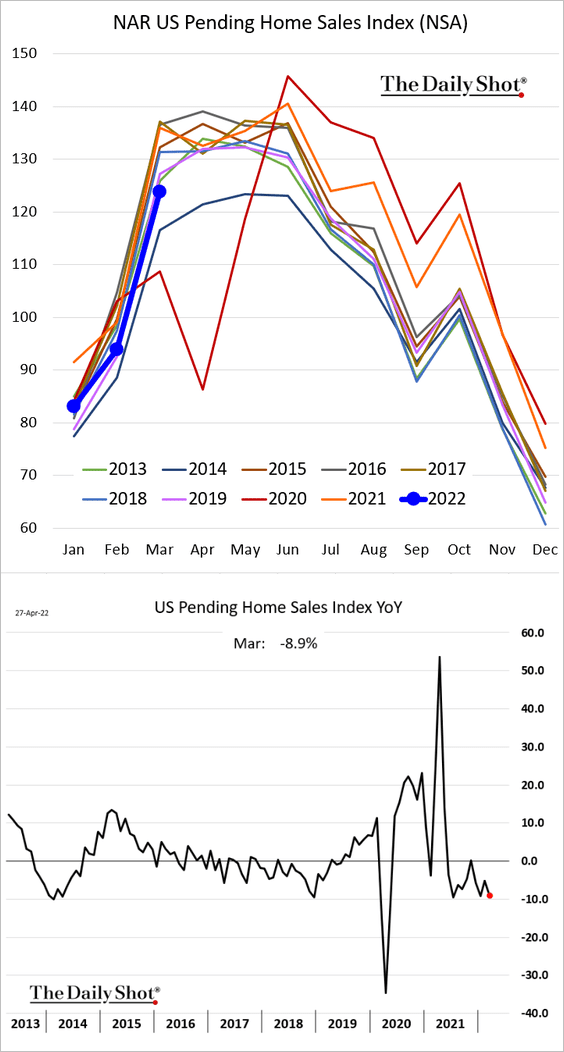
• Pending home sales were softer than expected in March, declining almost 9% from the same time last year.
The dip in mortgage applications points to further weakness in home sales.
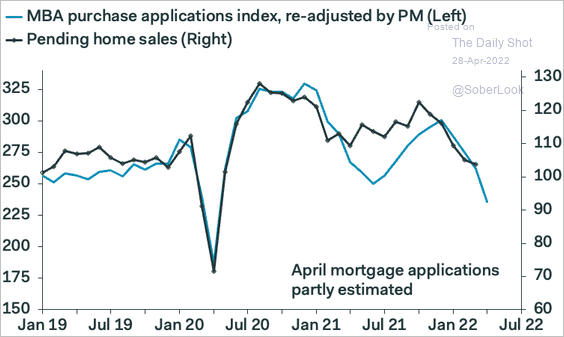 Source: Pantheon Macroeconomics
• Unlike the subprime housing crisis, the current loan-to-value ratio is relatively low.
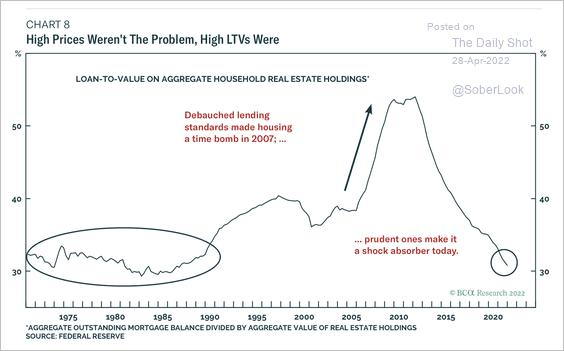 Source: BCA Research
• 76% of residential construction projects were delayed last month.
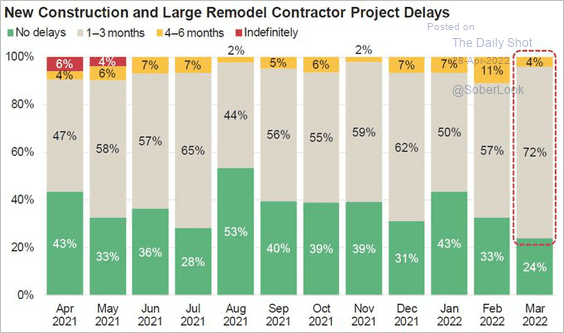 Source: @johnburnsjbrec
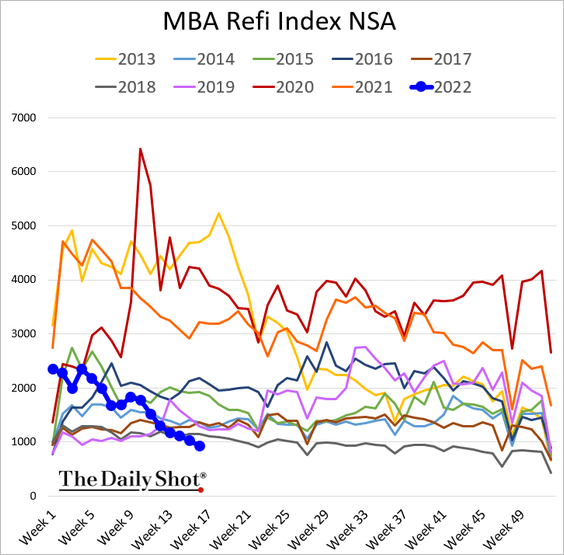
• Refi activity continues to sink.
——————–
2. Next, let’s take a look at consumer spending data, where we continue to see mixed signals.
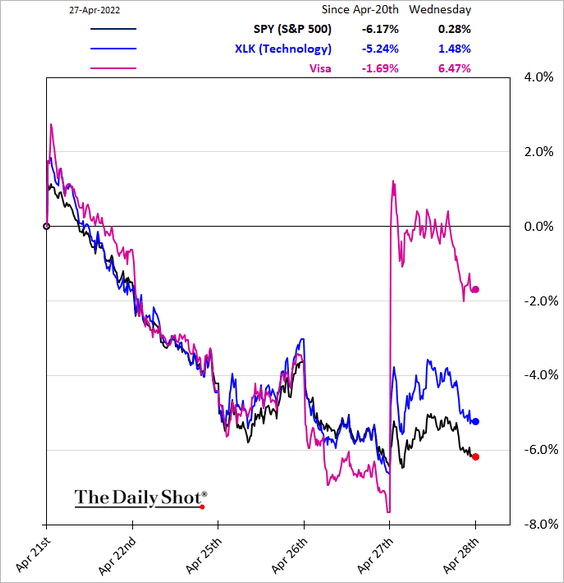
• Credit card companies did not experience a slowdown in spending last quarter.
 Source: MarketWatch Read full article
– Visa’s purchase volume:
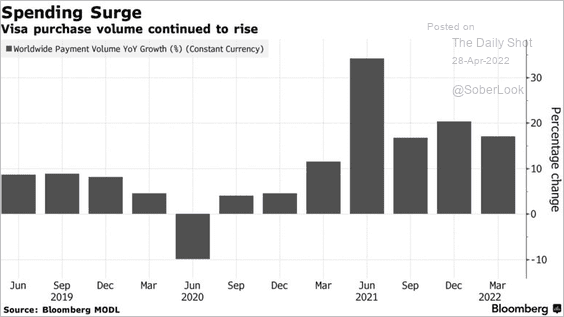 Source: Bloomberg Read full article
– Visa’s stock price:
• The stock market selloff points to weakness in discretionary retail spending going forward.
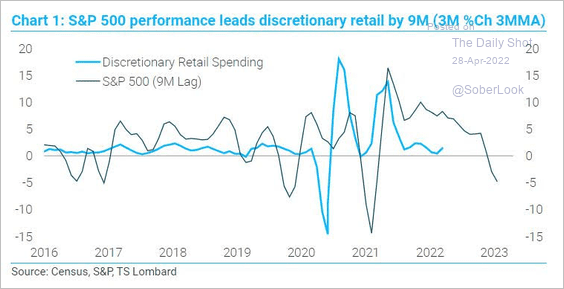 Source: TS Lombard
• According to Morning Consult, discretionary spending declined last month.
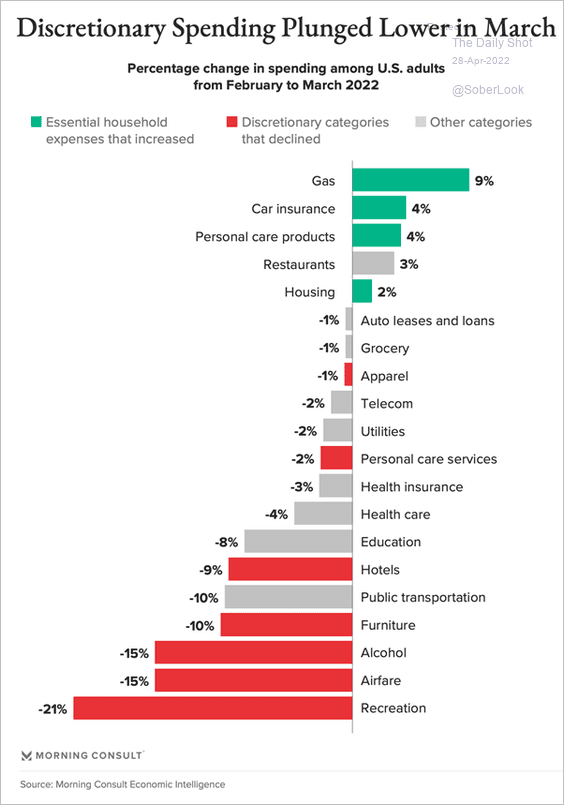 Source: Morning Consult Read full article
• On the other hand, the Evercore ISI airlines survey shows sales strength exceeding pre-COVID levels.
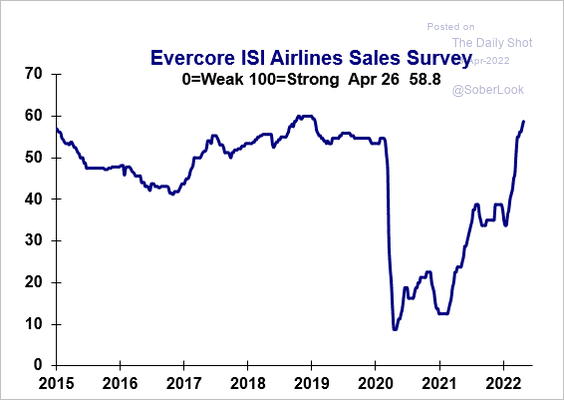 Source: Evercore ISI Research
——————–
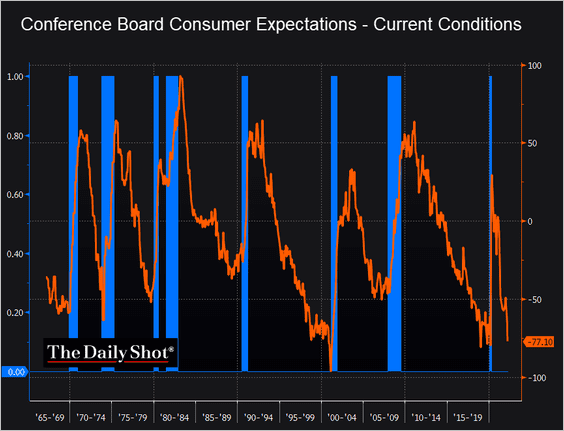
3. The Conference Board’s differential between consumer expectations and current conditions continues to sink. The bottoming of this spread tends to precede recessions.
 Source: @TheTerminal, Bloomberg Finance L.P.
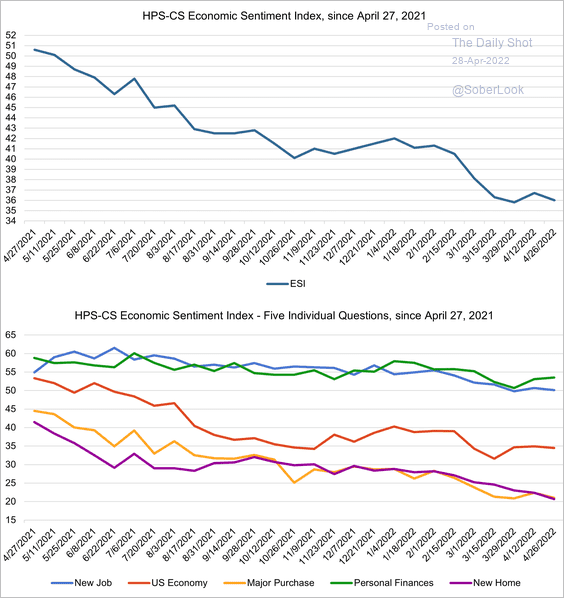
4. The HPS-CivicScience Economic Sentiment Index keeps trending lower.
 Source: @HPS_CS, @HPSInsight, @CivicScience
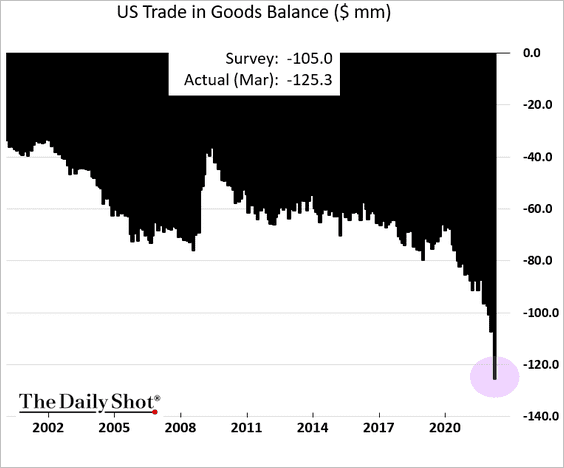
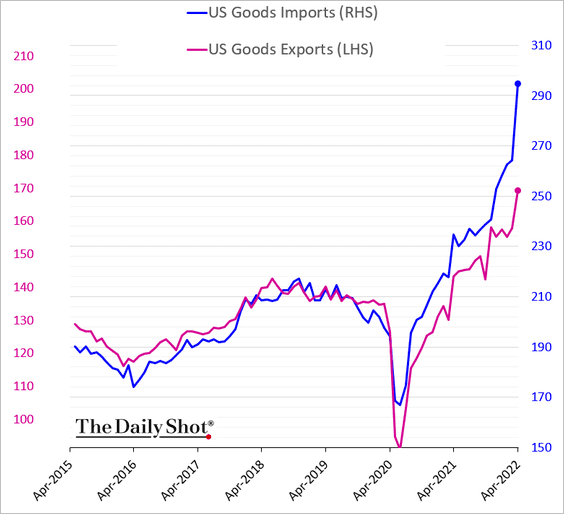
5. The US trade deficit in goods hit a new record, …
 Source: Reuters Read full article
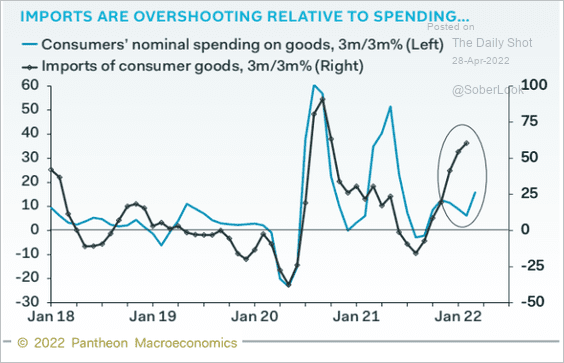
… as imports sharply outpace exports. This result doesn’t bode well for the GDP report today,
Imports have been outpacing consumption, …
 Source: Pantheon Macroeconomics
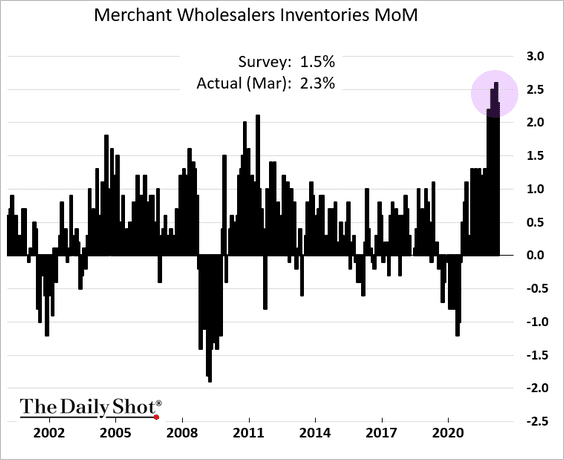
… as companies rapidly build inventories.
——————–
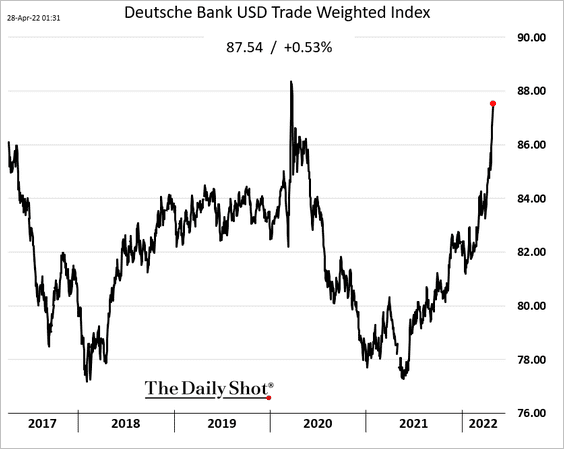
6. The US dollar continues to surge due to the Fed’s hawkish stance relative to other central banks. This trend should help ease inflationary pressures by reducing the cost of imports and weakening commodity prices.
Back to Index
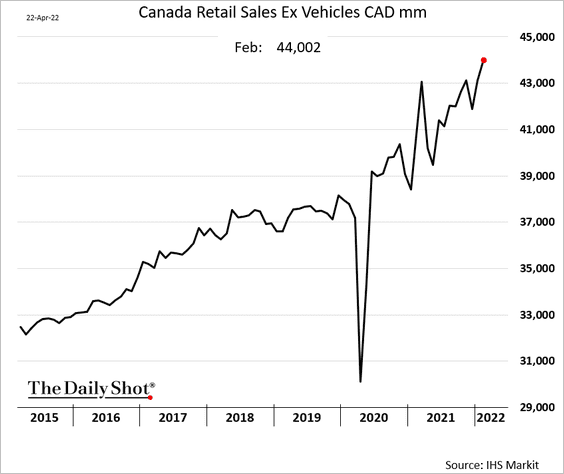
Canada
1. Retail sales kept climbing in February.
2. Will Canadian companies face margin pressures as demand slows.
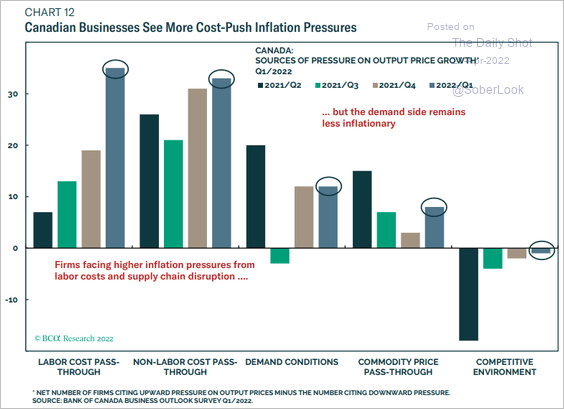 Source: BCA Research
Back to Index
The United Kingdom
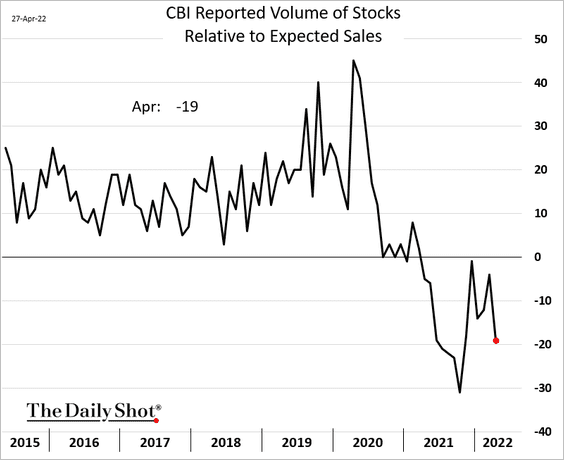
1. Retail sales weakened sharply this month.
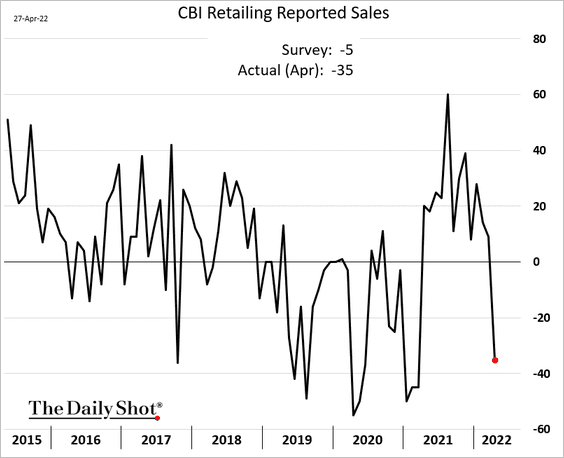
 Source: Reuters Read full article
Inventories remain tight relative to expected sales.
——————–
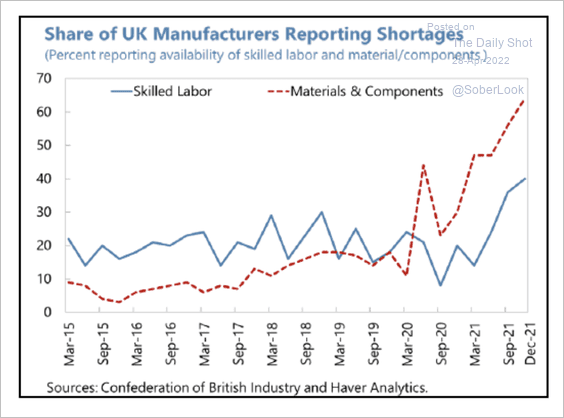
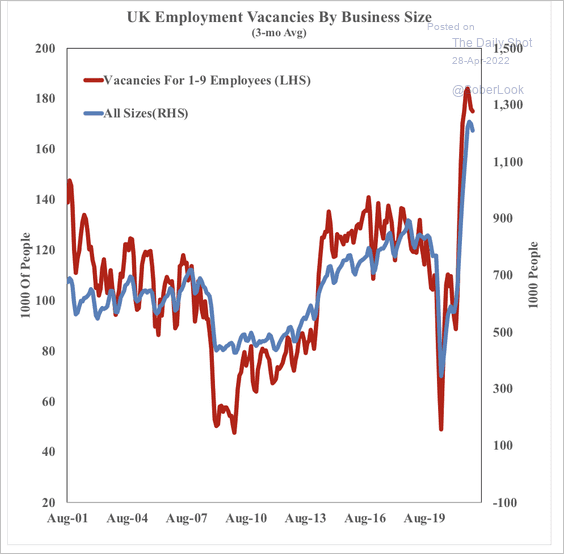
2. More businesses are reporting labor shortages (2 charts).
 Source: SOM Macro Strategies
 Source: SOM Macro Strategies
——————–
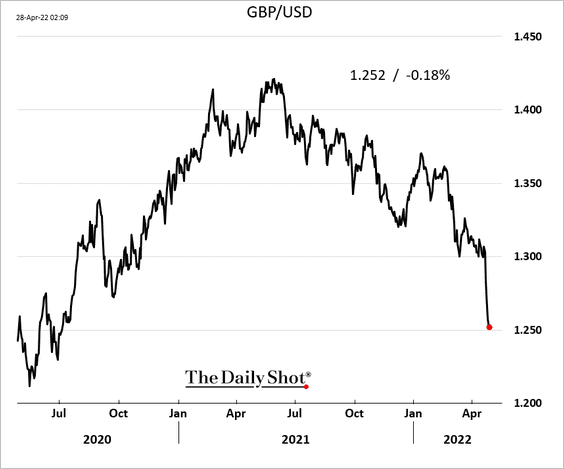
3. The pound keeps moving lower relative to USD.
Back to Index
The Eurozone
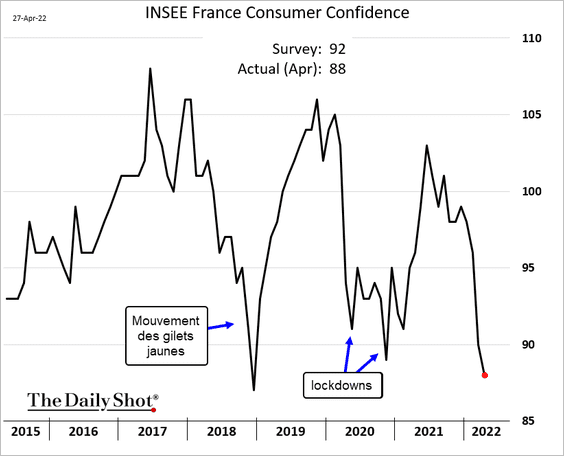
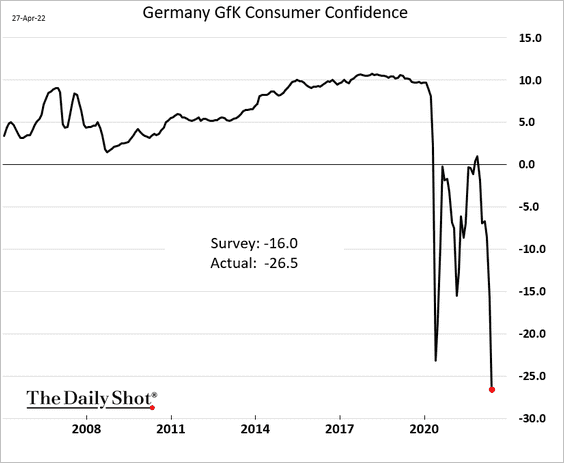
1. Consumer confidence deteriorated this month.
• France:
• Germany (2 charts):
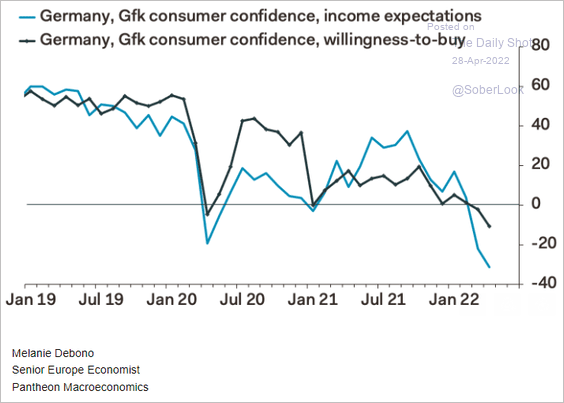 Source: Pantheon Macroeconomics
——————–
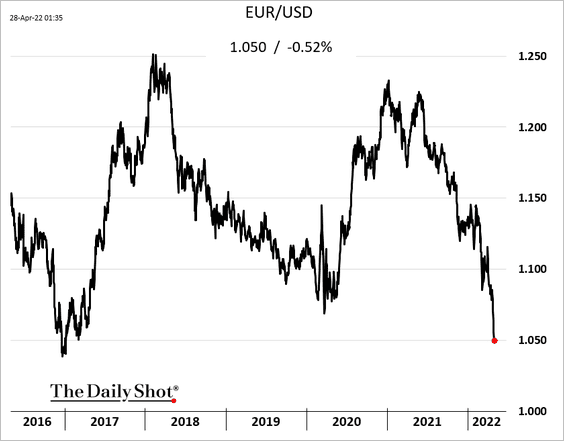
2. The euro hit 1.05 vs. USD for the first time since early 2017.
3. Manufacturing jobs have moved to Eastern Europe from the euro area over the past decade.
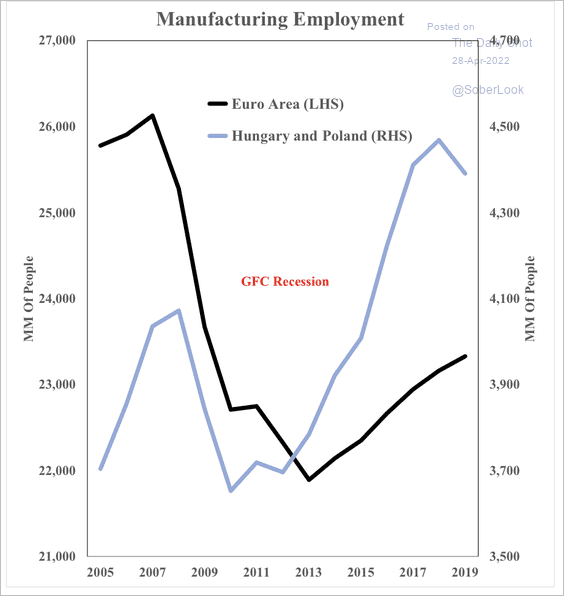 Source: SOM Macro Strategies
Back to Index
Europe
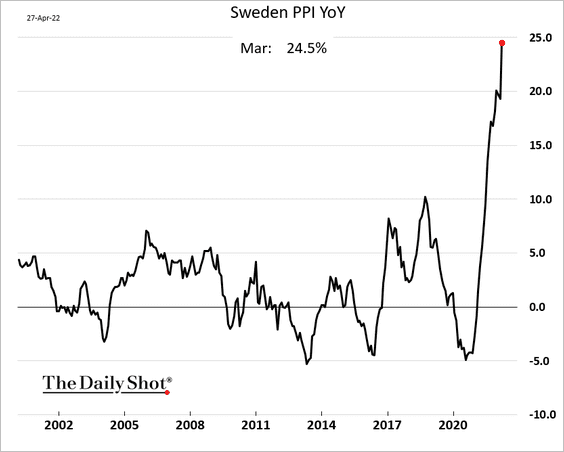
1. Sweden’s PPI is nearing 25%.
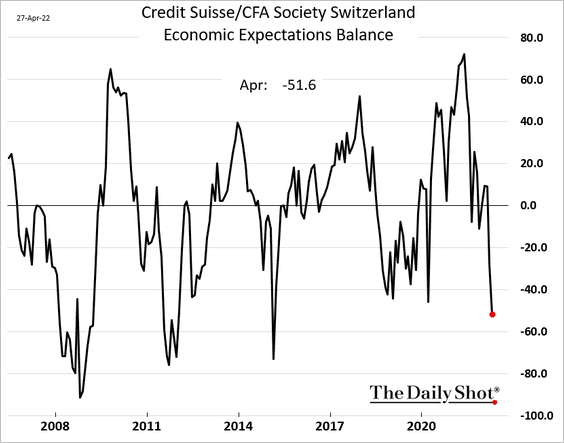
2. Swiss economic sentiment dipped below the levels we saw at the beginning of the pandemic.
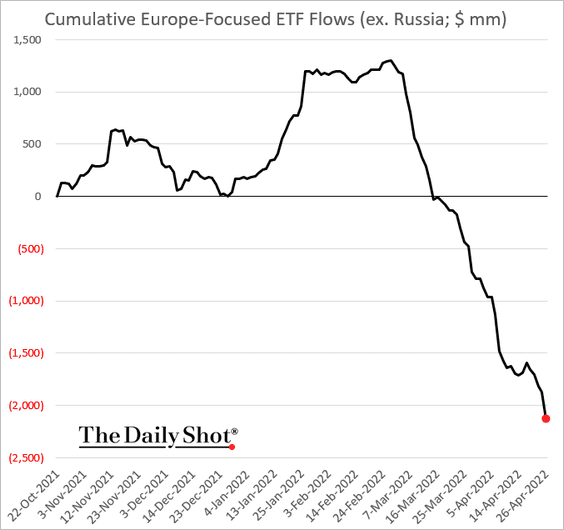
3. Europe-focused equity ETFs continue to see outflows.
Back to Index
Japan
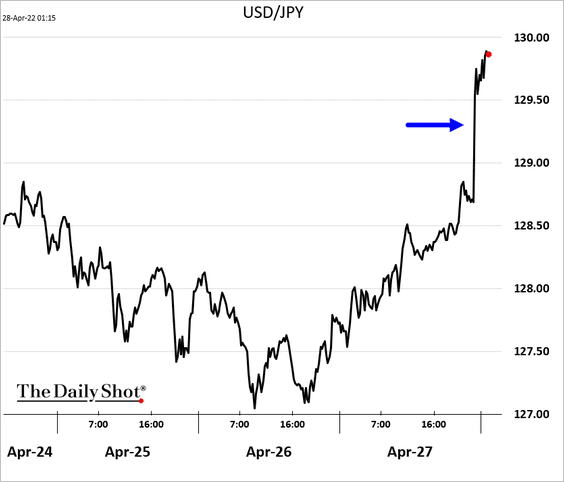
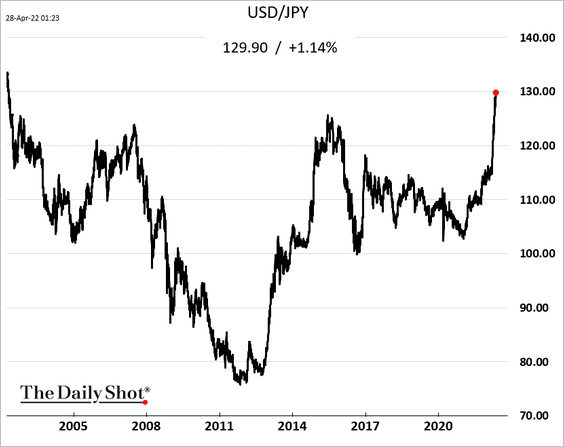
1. The BoJ will maintain its bond-buying program despite firmer inflation.
 Source: Reuters Read full article
The yen tumbled in response to the BoJ’s announcement, hitting the lowest level in two decades vs. USD.
——————–
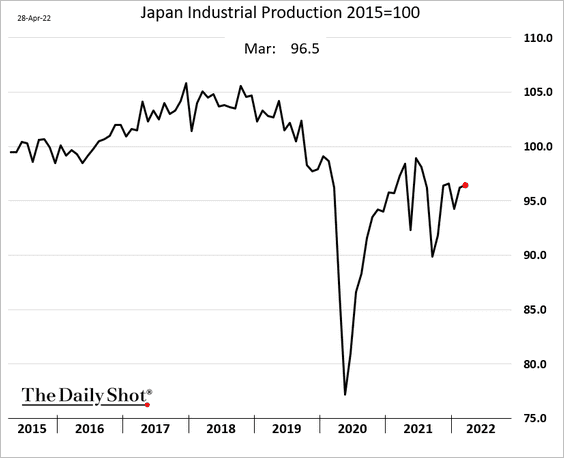
2. Industrial production held steady in March.
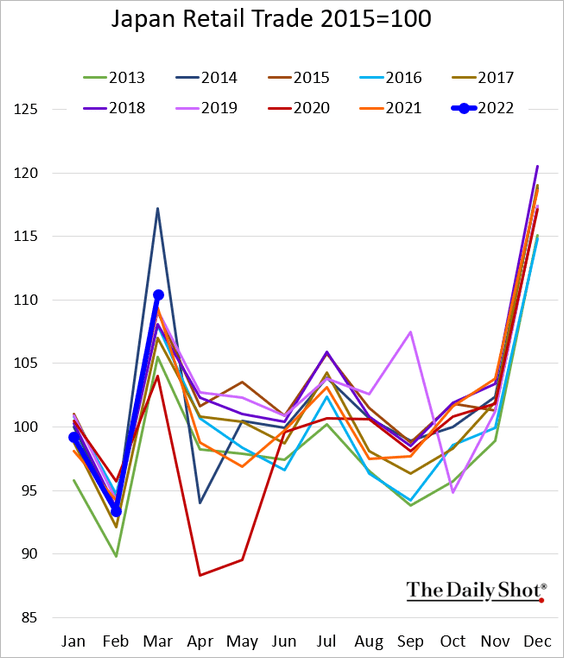
3. Retail sales surprised to the upside.
Back to Index
Asia – Pacific
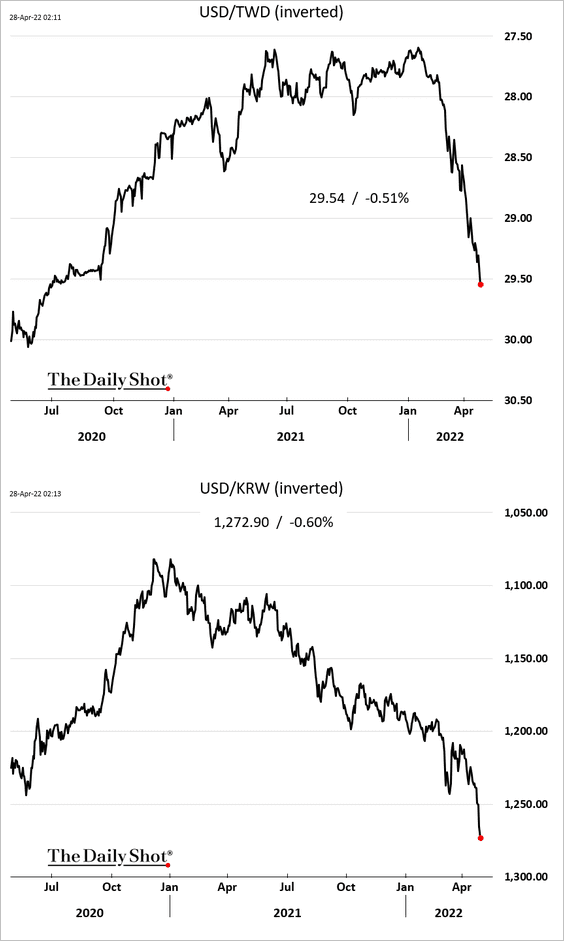
1. Asian currencies are under pressure as the Fed’s hawkish posture stands out among global central banks.
• The Taiwan dollar and the South Korean won:
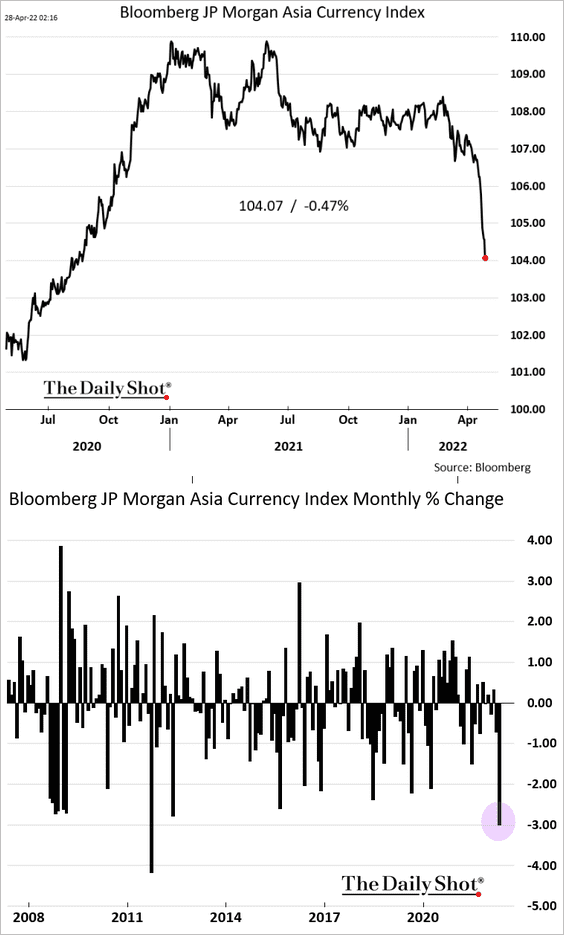
• Bloomberg’s Asia currency index:
——————–
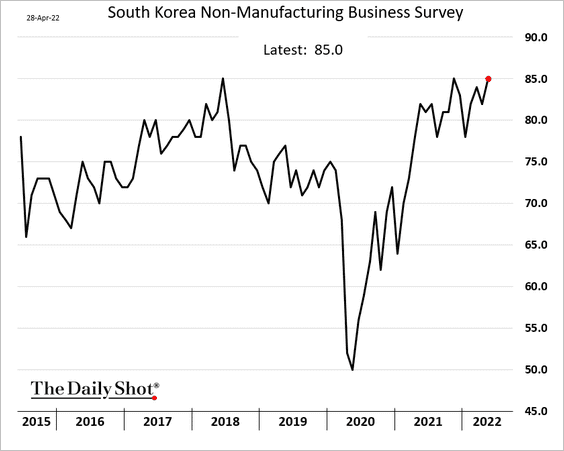
2. South Korea’s business sentiment held up well this month.
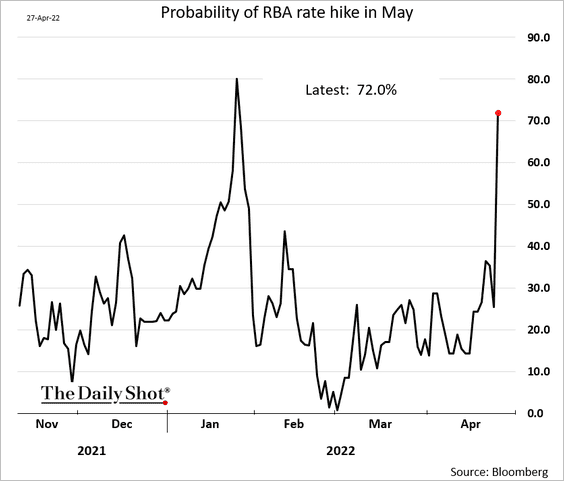
3. The probability of an RBA rate hike in May jumped after Australia’s strong inflation report.
4. New Zealand typically runs a trade surplus this time of the year. But energy prices are keeping the trade balance in deficit.
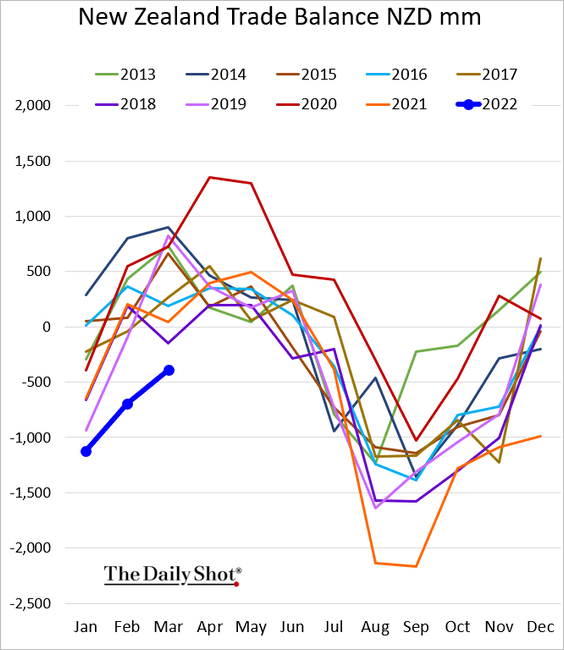
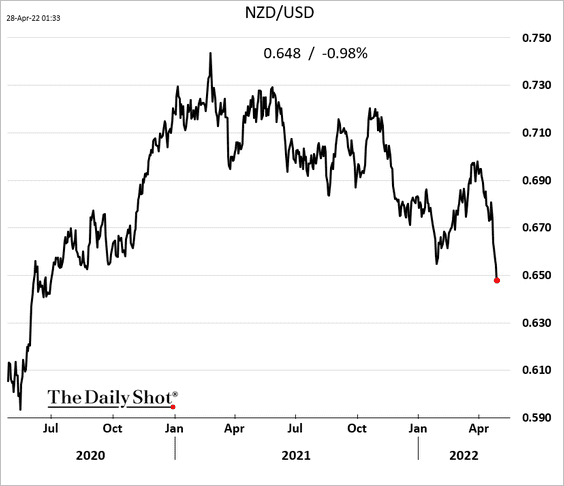
The Kiwi dollar hit the lowest level since 2020.
Back to Index
China
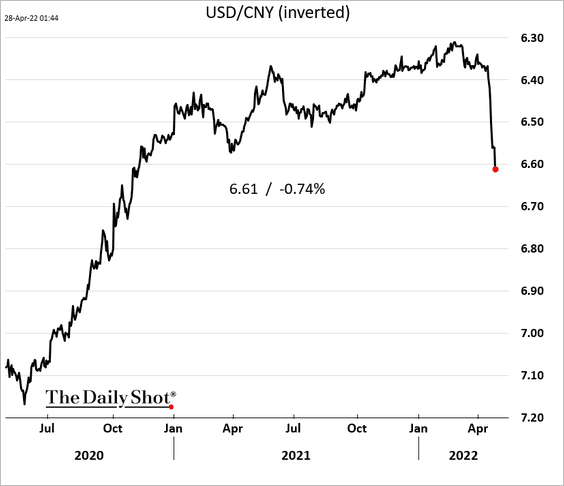
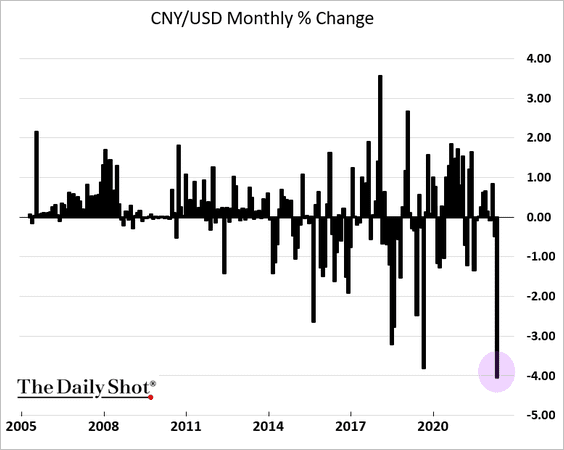
1. This has been the worst month for the renminbi in years.
——————–
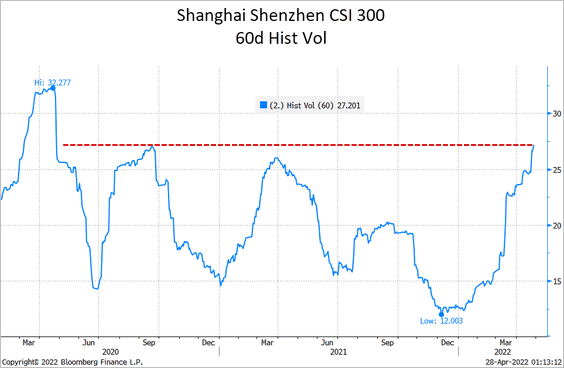
2. Realized stock market volatility hit the highest level since early 2020.
 Source: @TheTerminal, Bloomberg Finance L.P., h/t Charlotte Yang
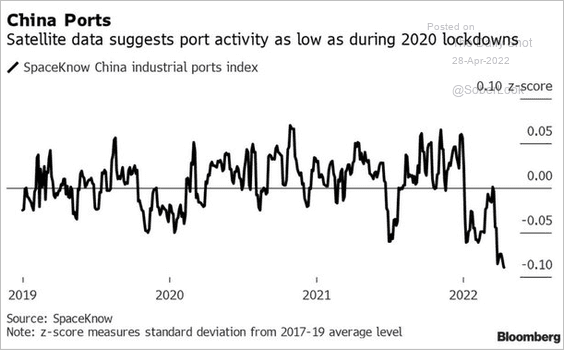
3. China’s port activity remains depressed.
 Source: @hancocktom Read full article
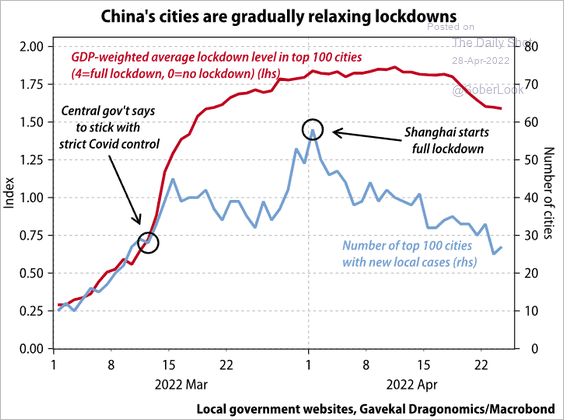
4. Are lockdowns starting to ease?
 Source: Gavekal Research
Back to Index
Emerging Markets
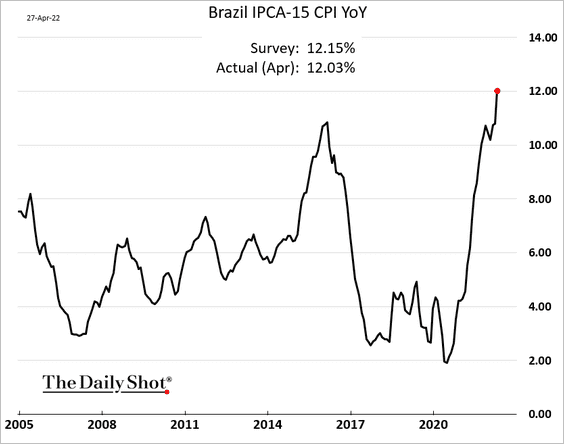
1. Brazil’s inflation is above 12%.
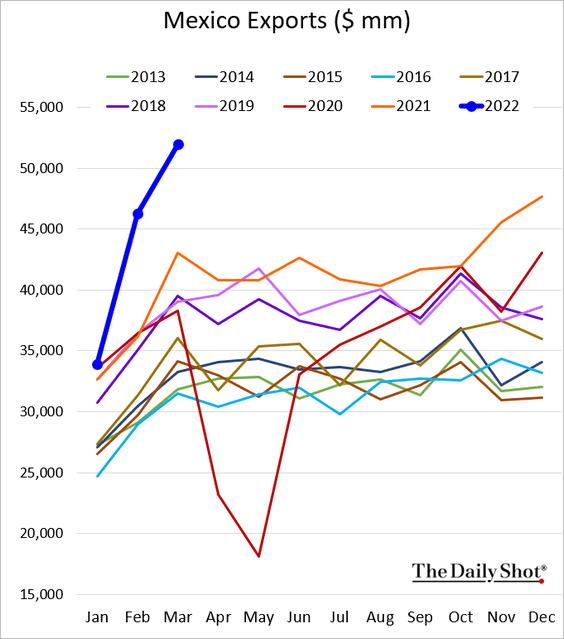
2. Mexican exports have been surging.
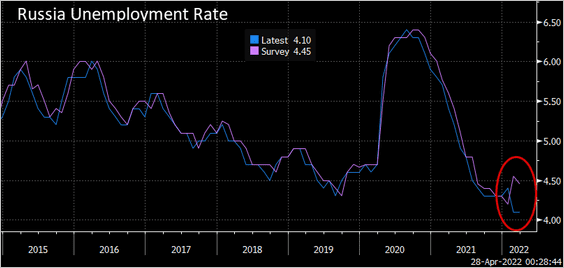
3. Russia reported rosy March economic figures across the board. It appears that Moscow doesn’t want the West to know that the sanctions are having an impact. The Federal Service of State Statistics has lost credibility.
 Source: @TheTerminal, Bloomberg Finance L.P.
Back to Index
Cryptocurrency
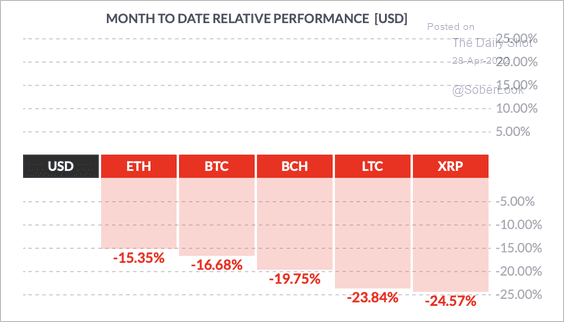
1. It’s been a tough month for cryptos so far.
 Source: FinViz
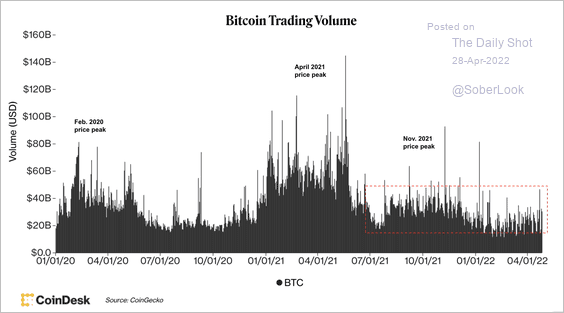
2. Bitcoin’s trading volume has been relatively low. A surge in trading activity typically occurs around price peaks.
 Source: CoinDesk Read full article
3. The Ethereum network is the largest smart contract chain with significant stablecoin usage.
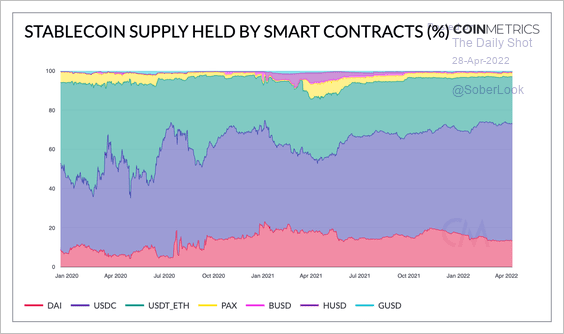 Source: @coinmetrics
4. DAI and Gemini’s GUSD have traded the furthest away from their dollar peg compared with other stablecoins.
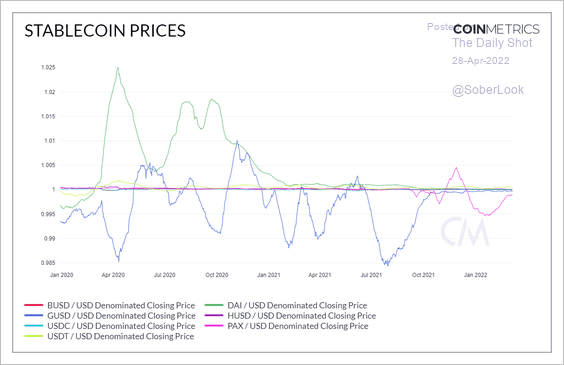 Source: @coinmetrics
Back to Index
Commodities
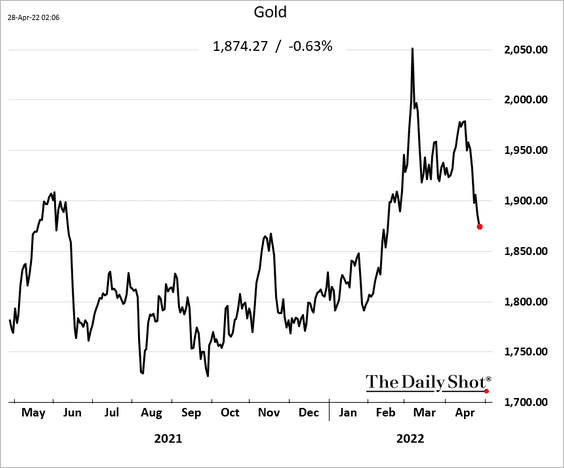
1. Gold is finally succumbing to the US dollar rally.
2. Prior to the war, the EU was reliant on Russia for a substantial portion of its copper supplies.
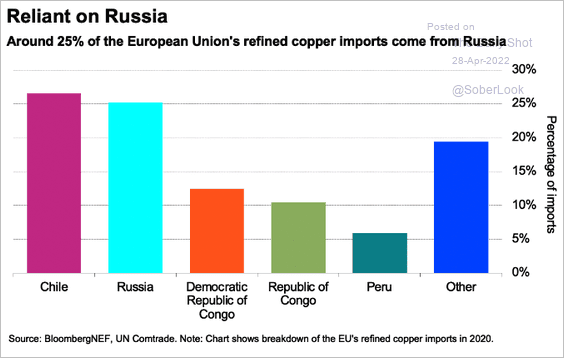 Source: @BloombergNEF Read full article
4. Momentum in copper futures turned negative.
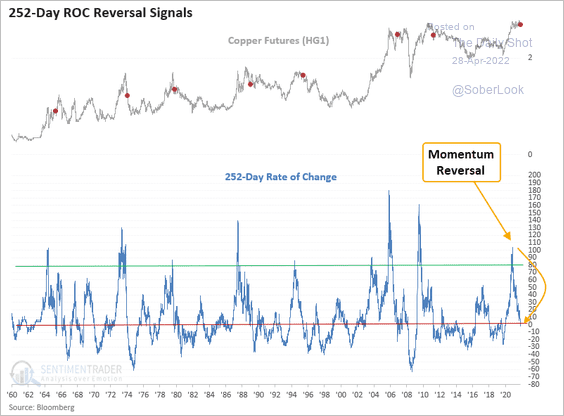 Source: SentimenTrader
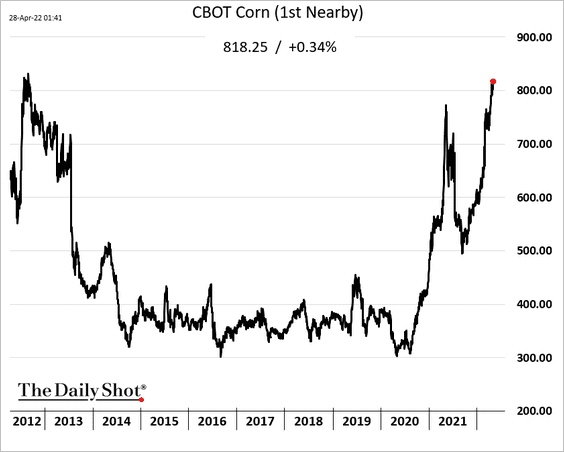
5. Soybean oil and corn are surging.
 Source: Reuters Read full article
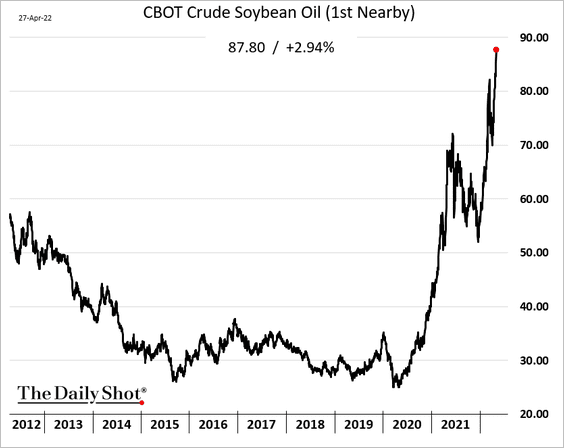
With soybean oil hitting record highs, the soybean crush spread is widening rapidly.
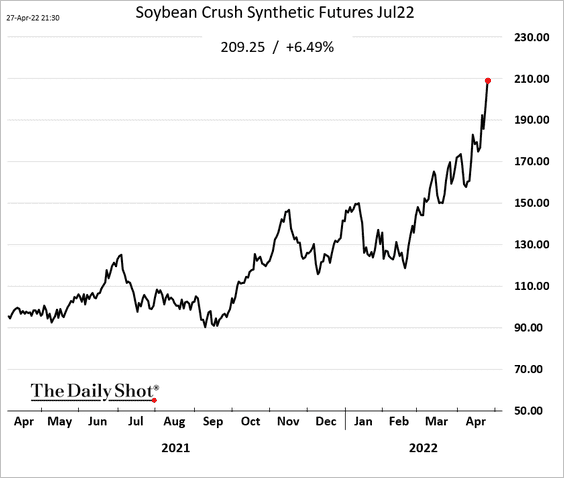 h/t Tom
——————–
6. The World Bank projects that major commodity prices will peak in 2022, but also remain elevated in 2023 and 2024.
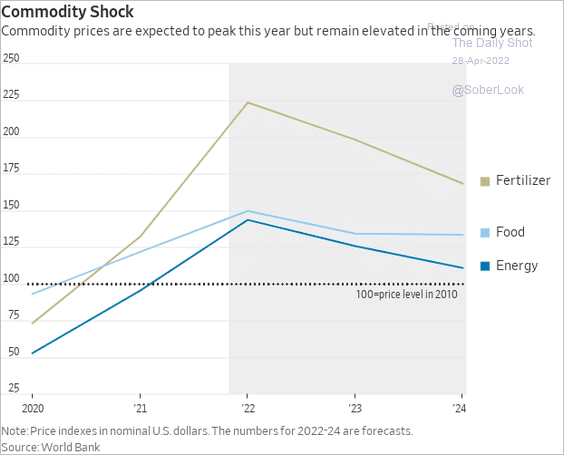 Source: @WSJ Read full article
Back to Index
Energy
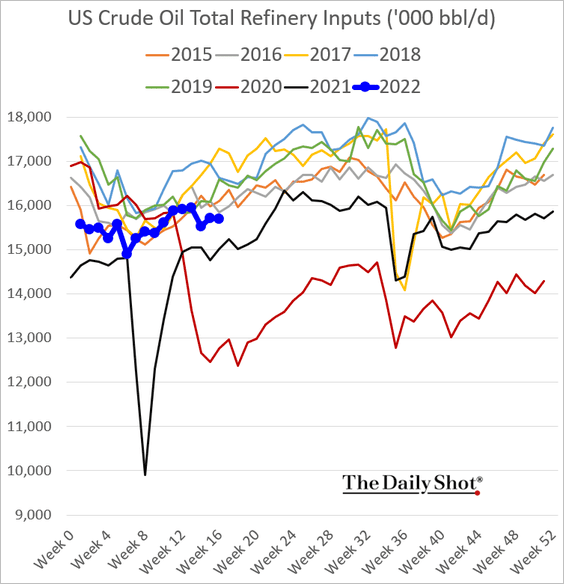
1. Crack spreads are hitting multi-year highs, boosting refinery margins around the world.
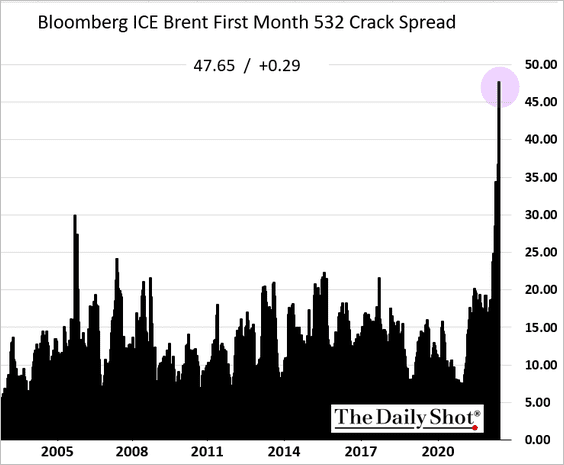
Part of the reason is relatively low US refinery runs (in part due to maintenance).
——————–
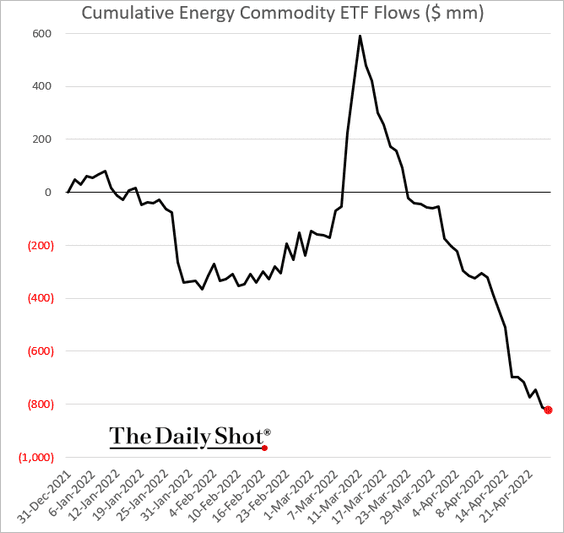
2. Investors continue to exit energy commodity ETFs.
3. US crude oil inventories remain depressed.
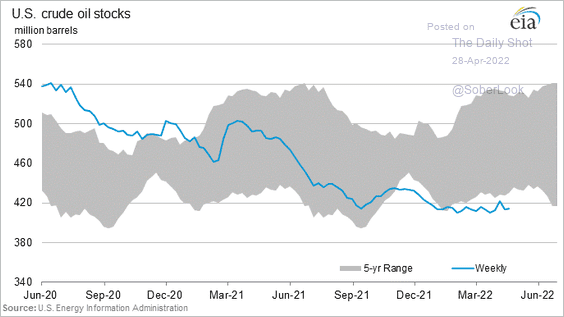 Source: @EIAgov
4. This chart shows falling distillate inventories on the East Coast. As we saw yesterday, NY Harbor diesel prices have been soaring.
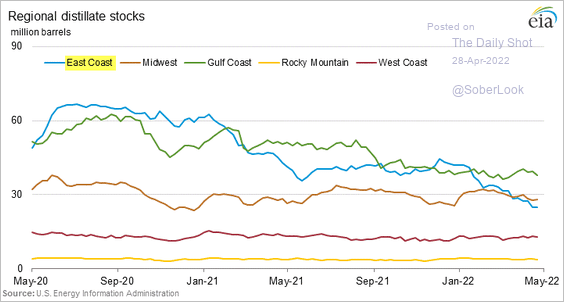 Source: @EIAgov
5. The current energy price shock is larger than previous price spikes on a proportional basis, other than the 1973 oil embargo.
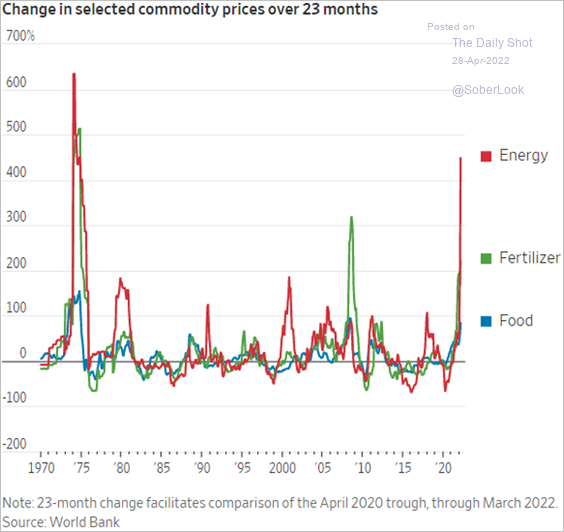 Source: @WSJ Read full article
Back to Index
Equities
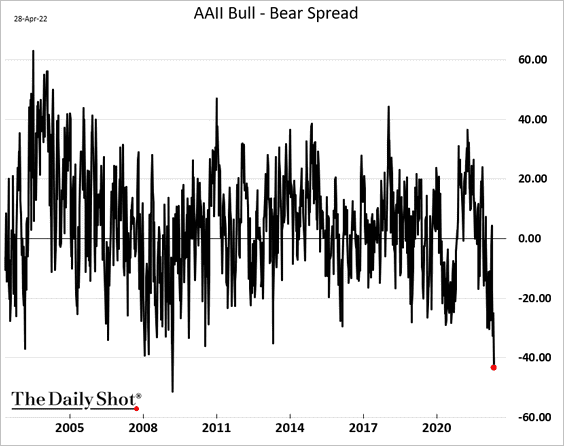
1. The AAII bull-bear spread shows that investors are most gloomy about stocks since the financial crisis selloff. It’s a bullish sign for equities.
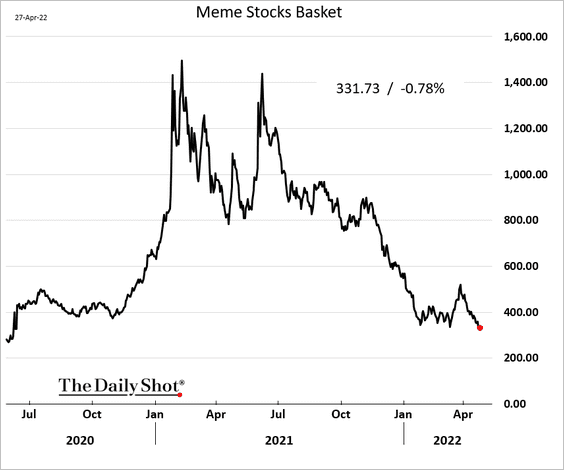
2. A basket of meme stocks is at the lowest level since June of 2020. The bubble continues to deflate.
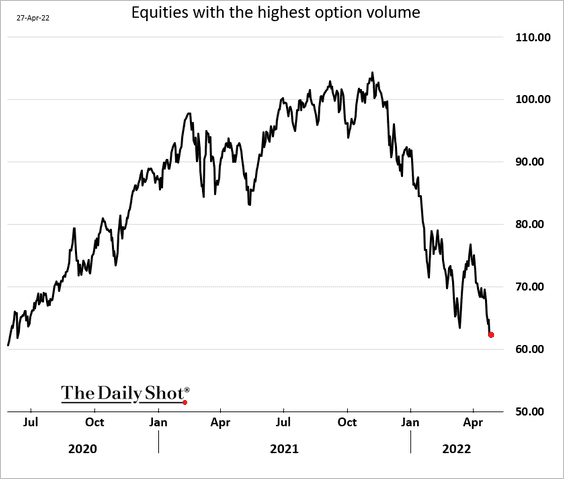
Related to the above, here is a basket of stocks with the highest options volume.
——————–
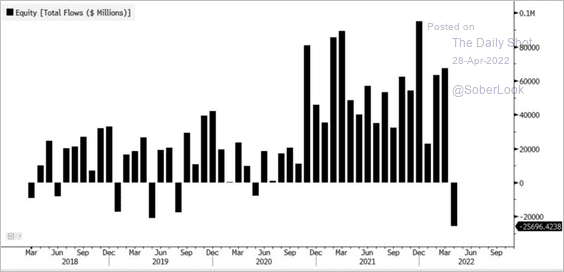
3. Equity fund outflows have been severe.
 Source: Bloomberg Read full article
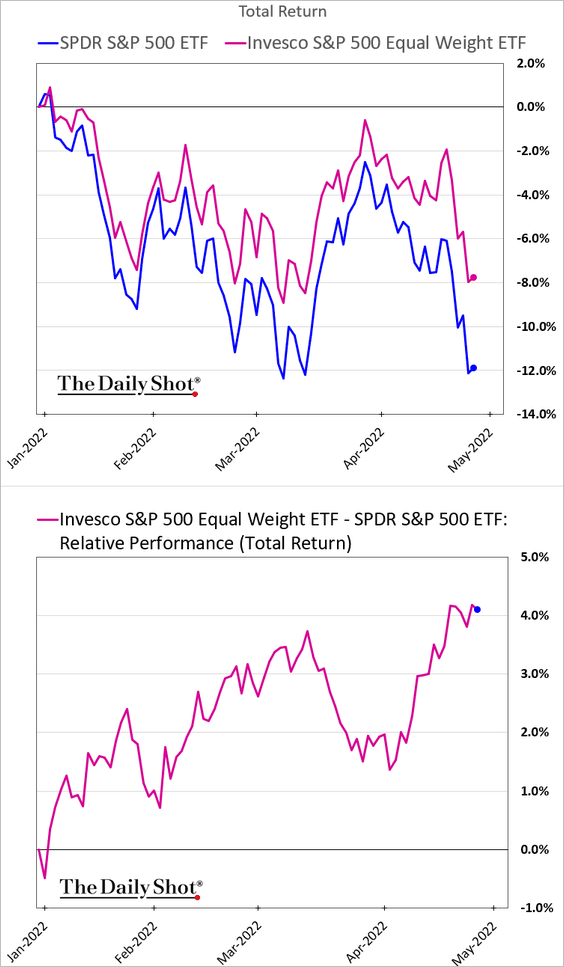
4. The equal-weight S&P 500 index has outperformed as mega-caps stumble.
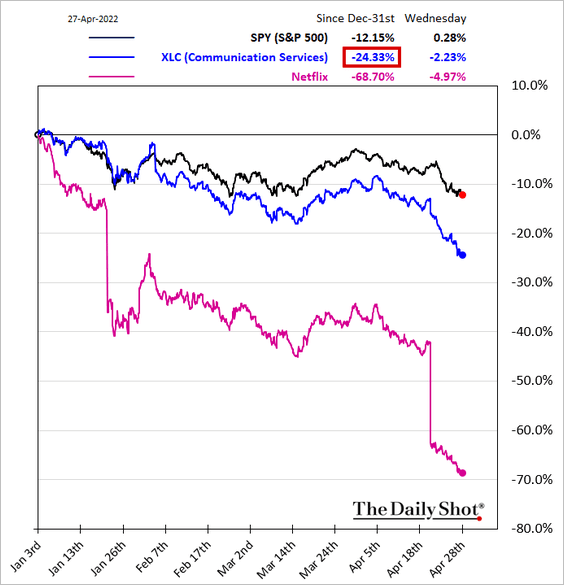
5. Communication Services has been the worst-performing sector year-to-date, dented by Meta and Netflix.
——————–
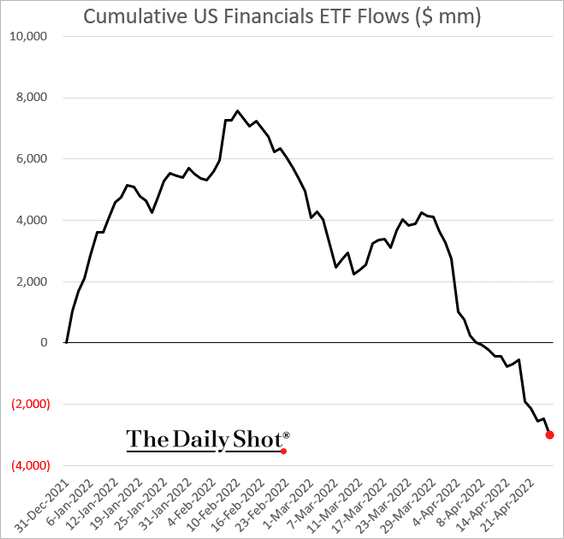
6. Financials ETFs continue to see outflows.
Back to Index
Alternatives
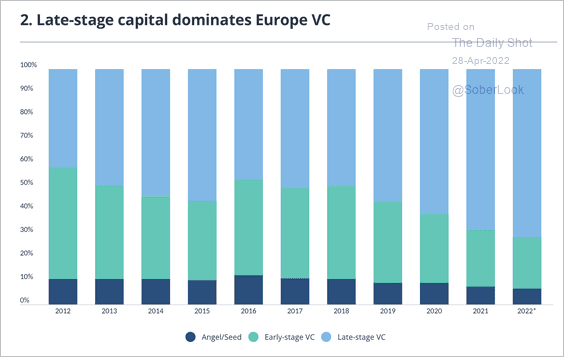
1. European venture capital activity is off to a strong start this year, driven by late-stage deals (2 charts).
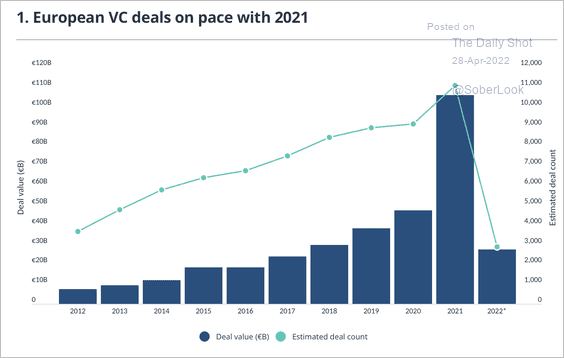 Source: PitchBook Read full article
 Source: PitchBook Read full article
——————–
2. Alternative funds remain in demand while equity and bond markets falter.
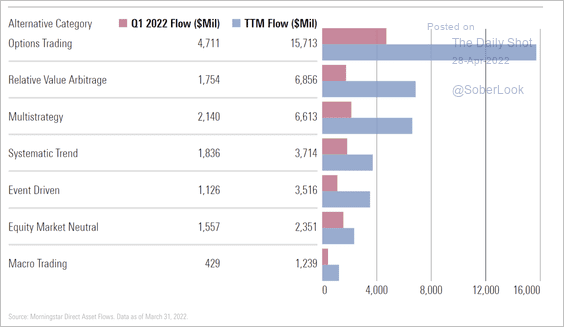 Source: Morningstar
3. Africa’s venture capital activity continues to grow, with Kenya and Egypt accounting for more than half of the total capital raised by the continent’s startups this year, according to PitchBook.
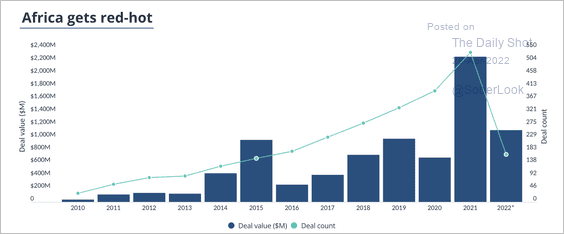 Source: PitchBook Read full article
Back to Index
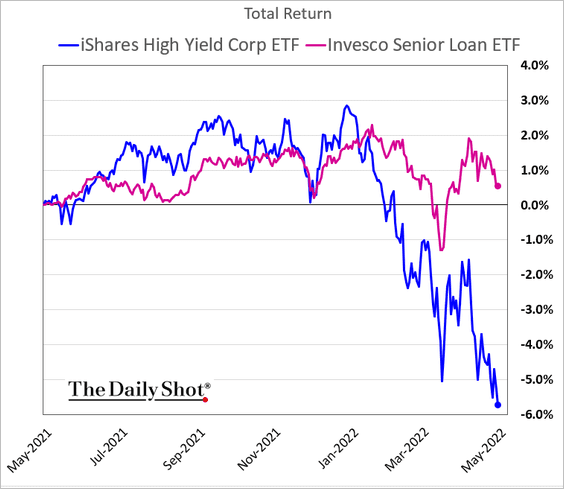
Credit
The performance gap between high-yield bonds and leveraged loans continues to widen.
Back to Index
Rates
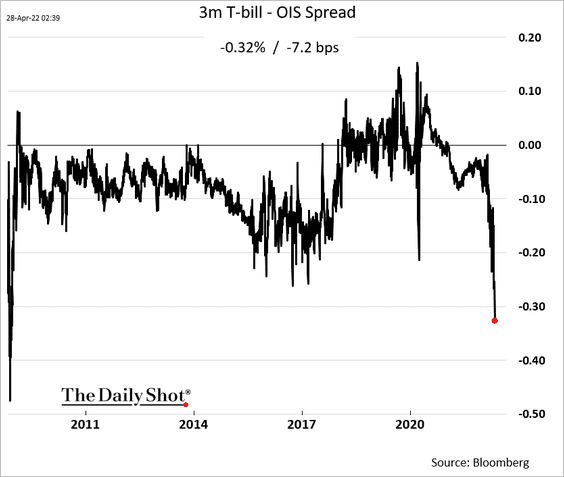
1. Treasury bill demand keeps climbing as investors move into cash. It’s a bullish sign for stocks.
2. Given the historic spread between Fed monetary policy and the prevailing inflation forecasts, the 40-year downtrend in Treasury yields is ending.
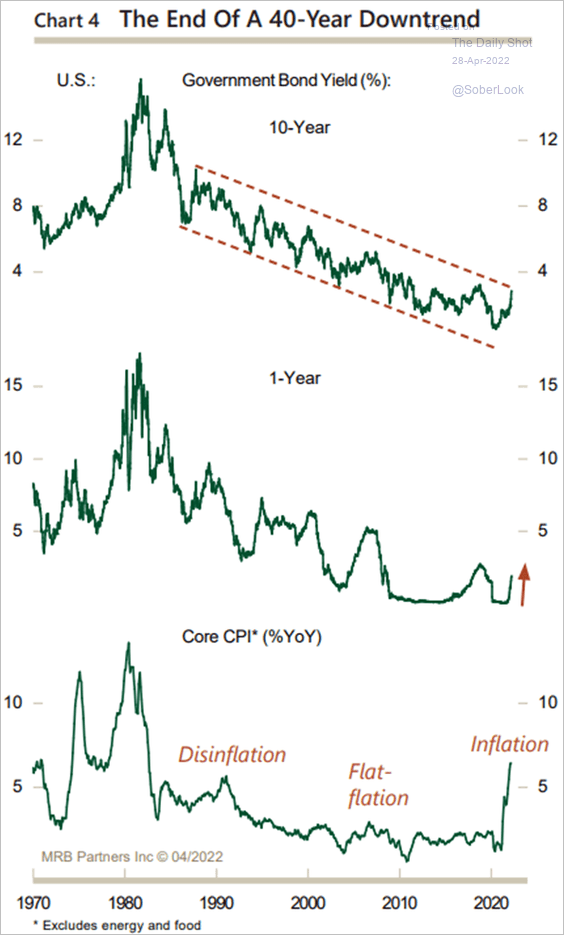 Source: MRB Partners
3. This chart shows the Fed’s “Misery Index,” the combination of inflation and unemployment relative to long-run projections.
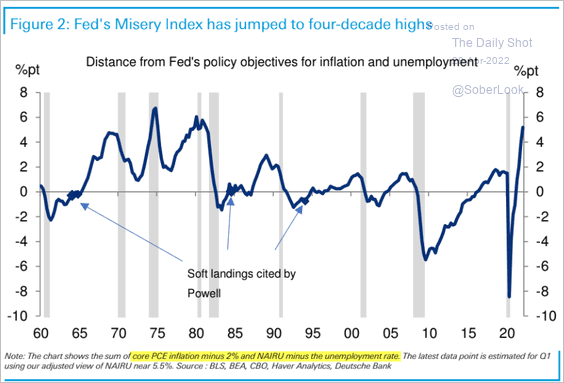 Source: Deutsche Bank Research
4. In most cases, the 10-year Treasury yield has peaked either close to, or above, the upper bound of the Fed funds target range.
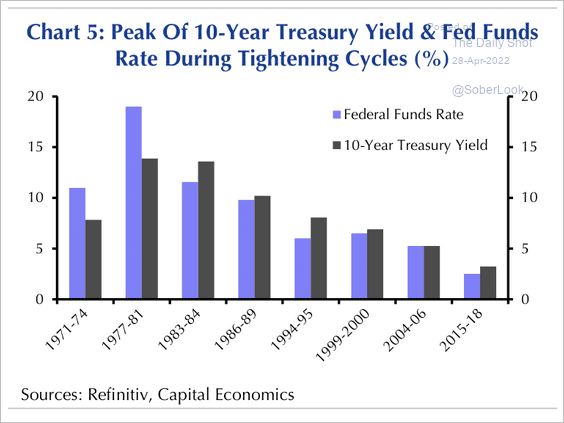 Source: Capital Economics
• The size of trough-to-peak increases in the 10-year Treasury yield has been smaller in the most recent tightening cycles compared with earlier ones.
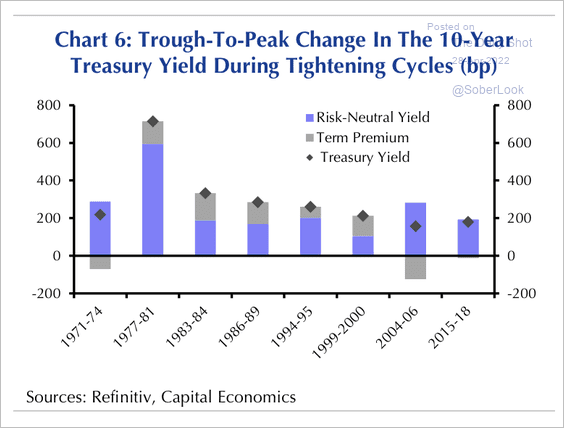 Source: Capital Economics
Back to Index
Global Developments
1. G10 central banks are all projected to tighten monetary policy over the coming twelve months, with the Fed and RBA leading the way.
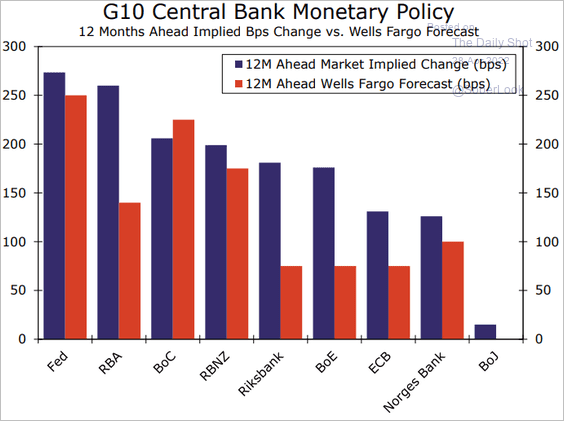 Source: Wells Fargo Securities
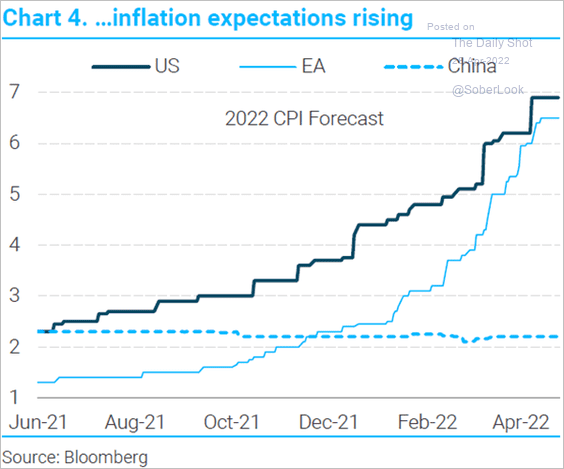
2. Global growth expectations are falling at the same time that inflation forecasts are rising. This is an unusual trend (2 charts).
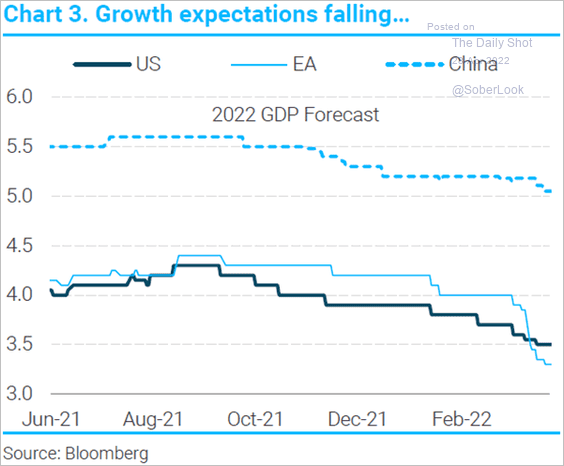 Source: TS Lombard
 Source: TS Lombard
3. During the start of the pandemic recovery, inflation was procyclical as economic activity accelerated. This year, however, activity is slowing while producer prices accelerate.
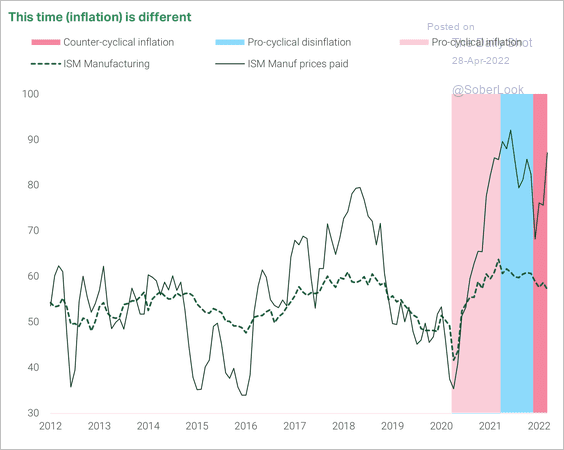 Source: TS Lombard
4. The urgency for G10 central banks to combat inflation is gaining with falling real wages across the G10.
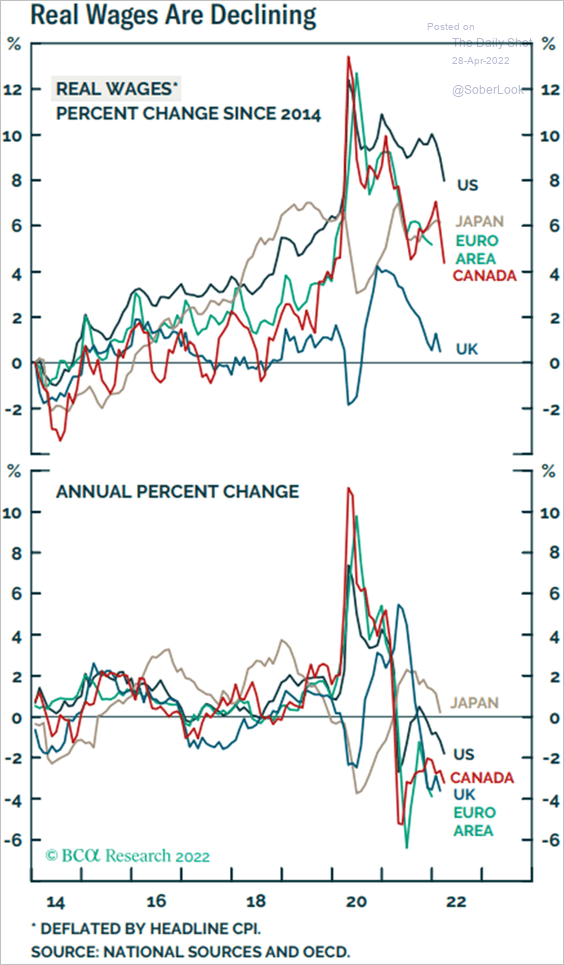 Source: BCA Research
Back to Index
Food for Thought
1. Retired Americans reentering the workforce:
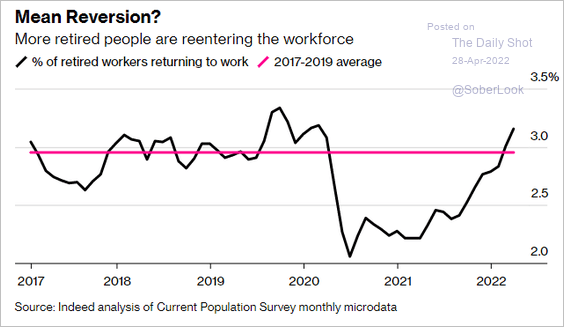 Source: @business Read full article
2. Labor share since 1990:
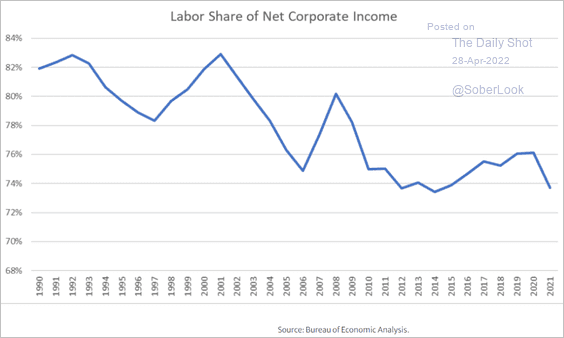 Source: CEPR Read full article
3. Streaming services saturation:
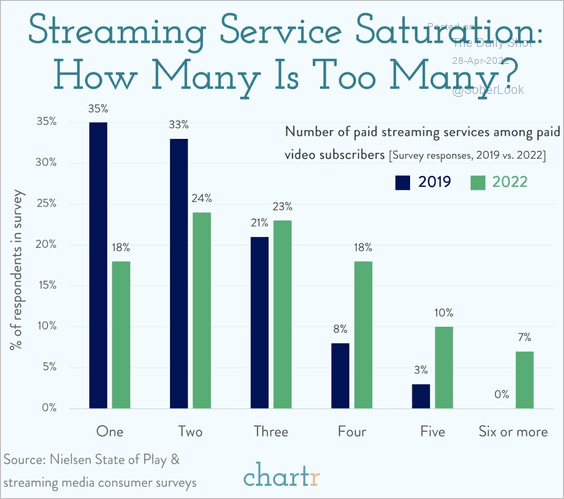 Source: @chartrdaily
4. Spam messages:
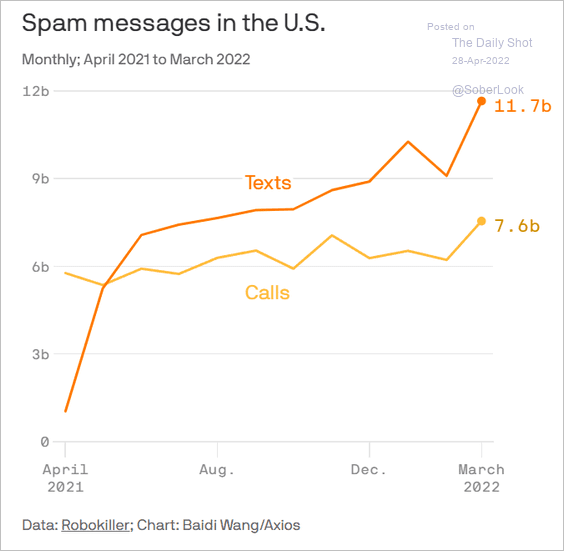 Source: @axios Read full article
5. Modern slavery:
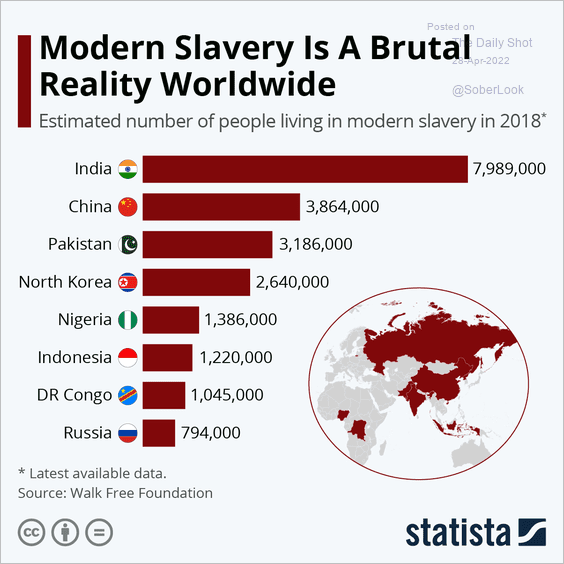 Source: Statista
6. Moderating demand for internal combustion engine components:
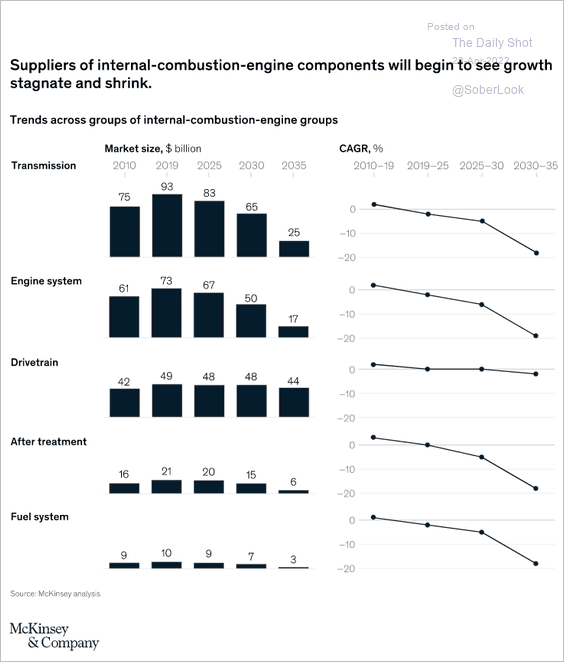 Source: McKinsey & Company Read full article
7. US political party affiliation:
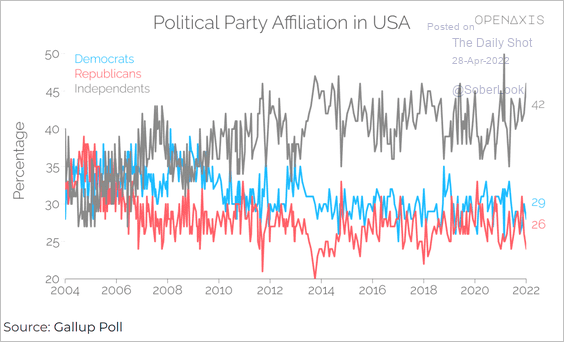 Source: OpenAxis
8. Russian exports of nuclear technology to the EU:
![]() Source: Bruegel Read full article
Source: Bruegel Read full article
9. Convenience store chains with the most locations in each state:
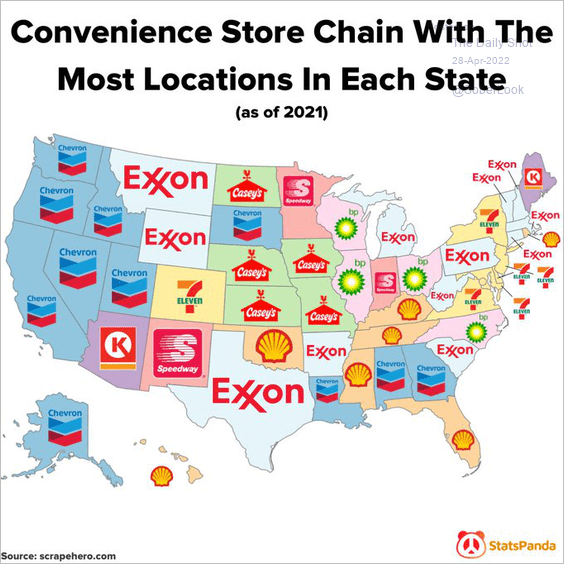 Source: @statspanda1 Read full article
——————–
Back to Index