
The Daily Shot: 02-May-22
• Equities
• Credit
• Rates
• Commodities
• Cryptocurrency
• Emerging Markets
• China
• Asia – Pacific
• The Eurozone
• The United States
• Global Developments
• Food for Thought
Equities
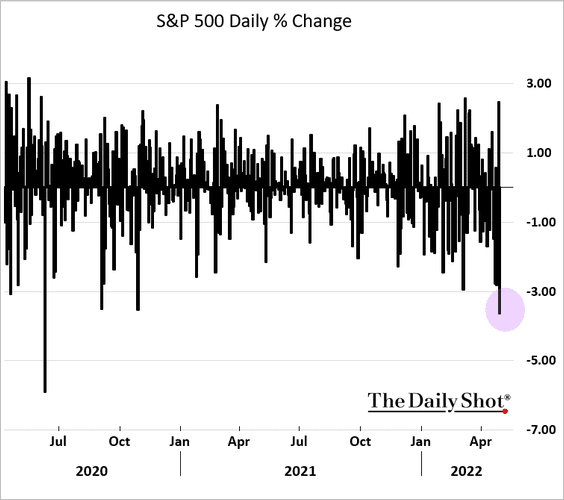
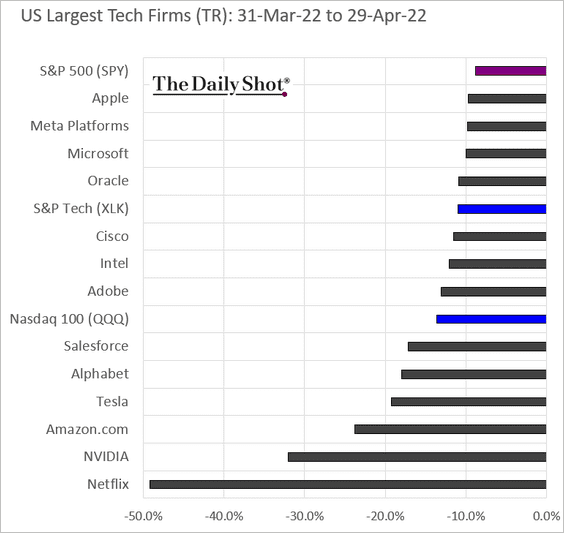
1. Friday marked a really bad ending to an extremely challenging month in the market.
The Nasdaq 100 and the Nasdaq Composite saw the worst month since the financial crisis.
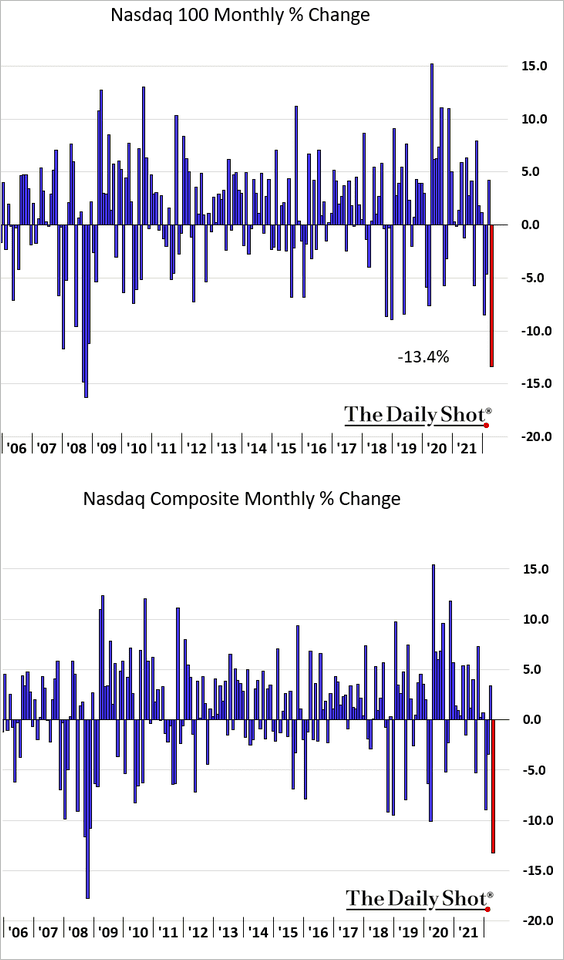
Let’s take a look at some performance data for April.
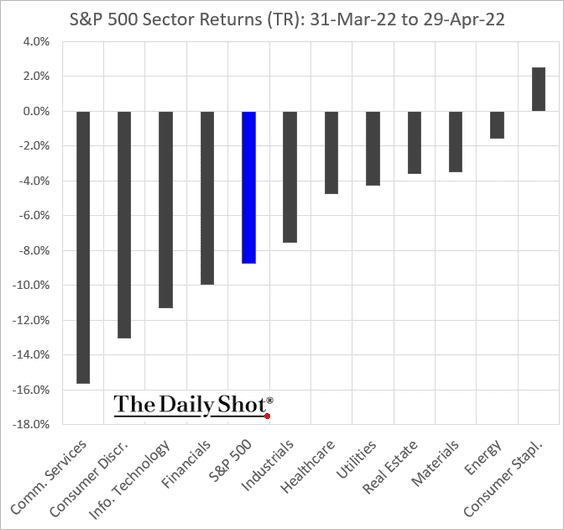
• Sector performance:
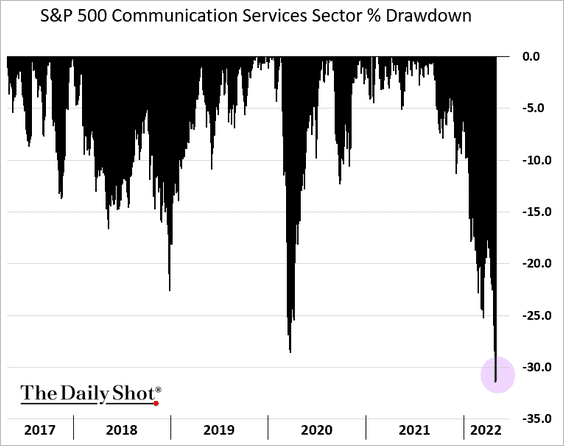
The drawdown in Communication Services has exceeded 30%.
• The largest US tech firms:
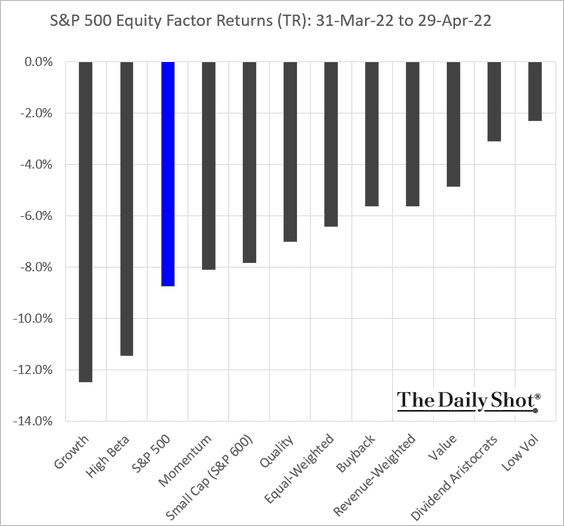
• Equity factors:
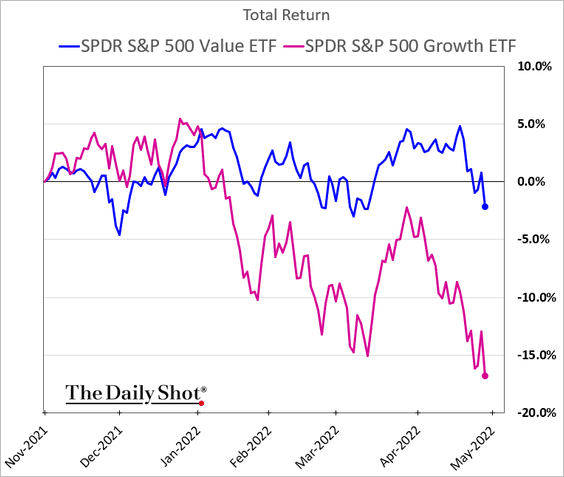
Here is value vs. growth over the past six months.
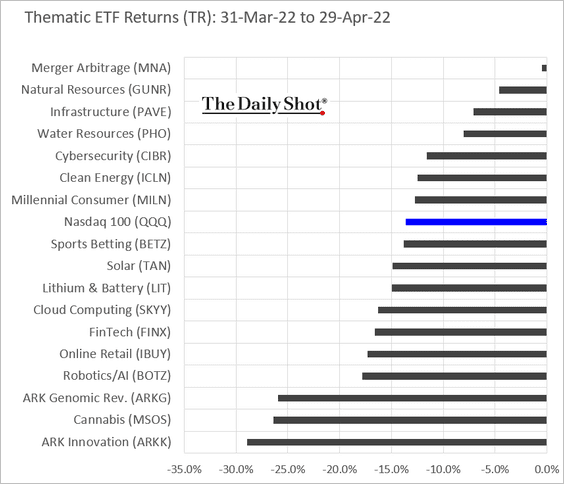
• Thematic ETFs:
——————–
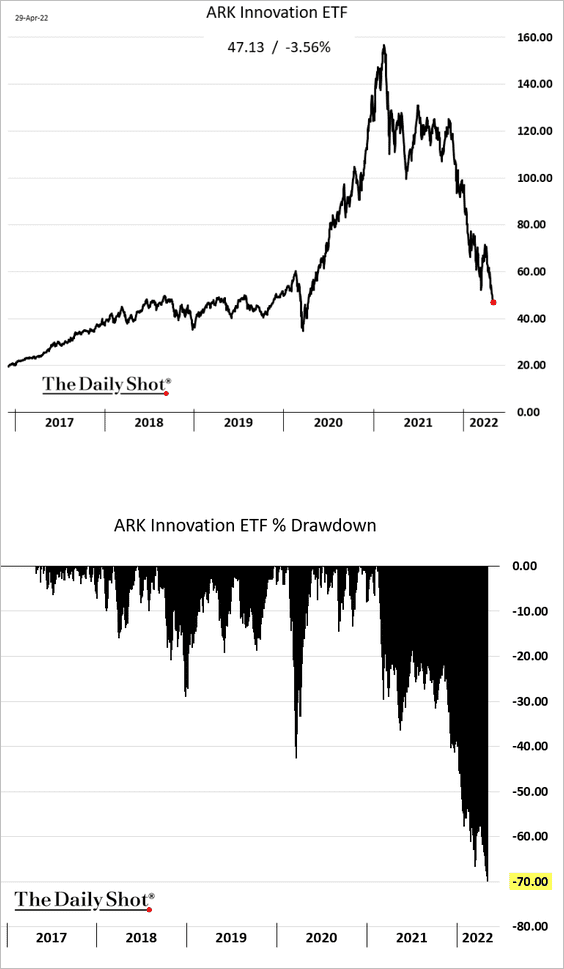
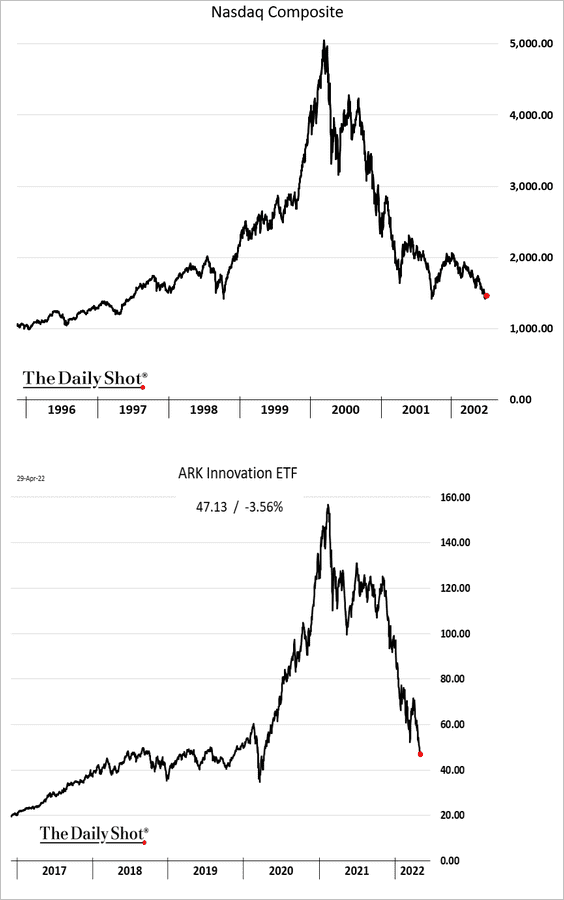
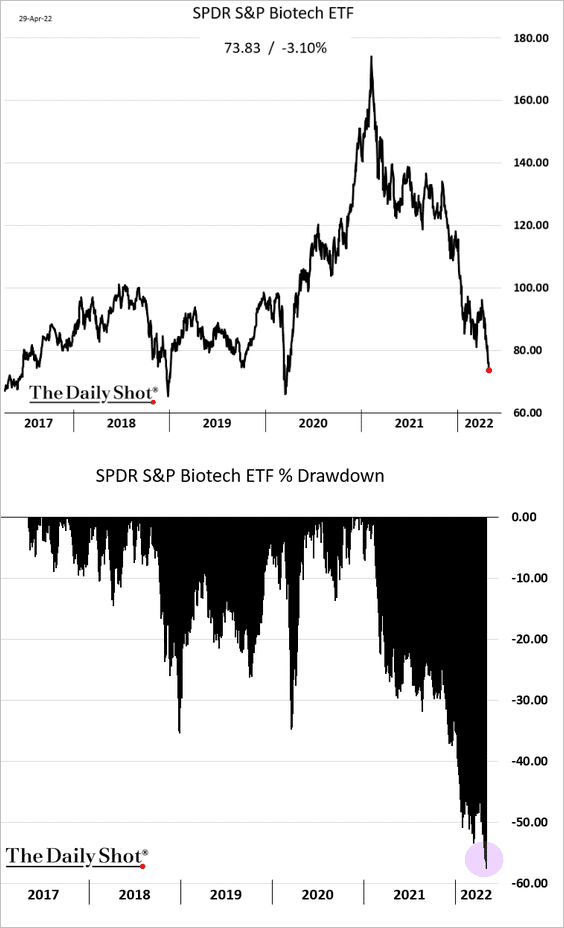
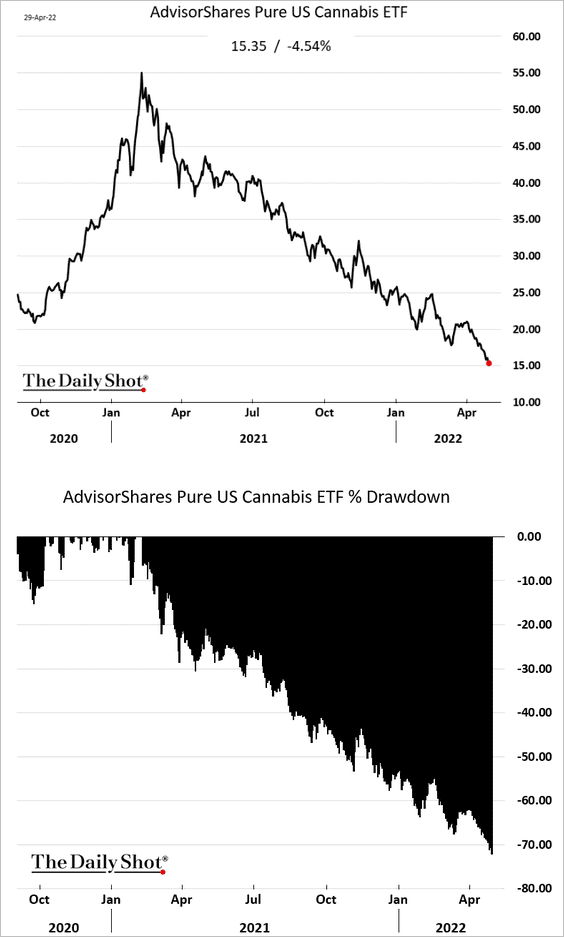
2. The bubbles are deflating rapidly.
• ARK Innovation:
By the way, here is a comparison to the dot-com bubble.
• Biotech:
• Cannabis stocks:
——————–
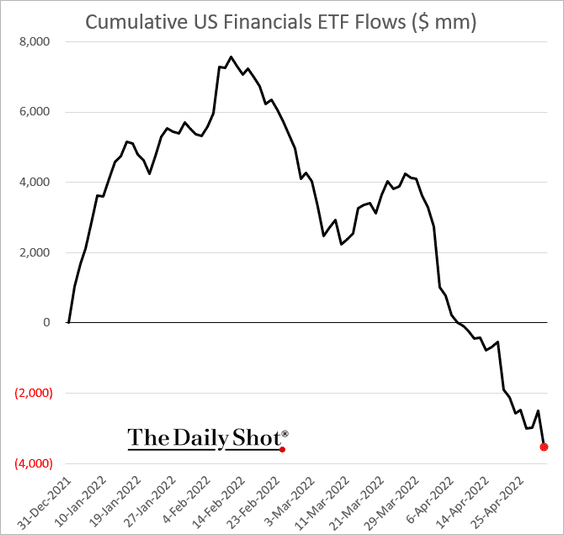
3. Tech sector ETFs saw inflows in April as some allocators seem to be moving in.
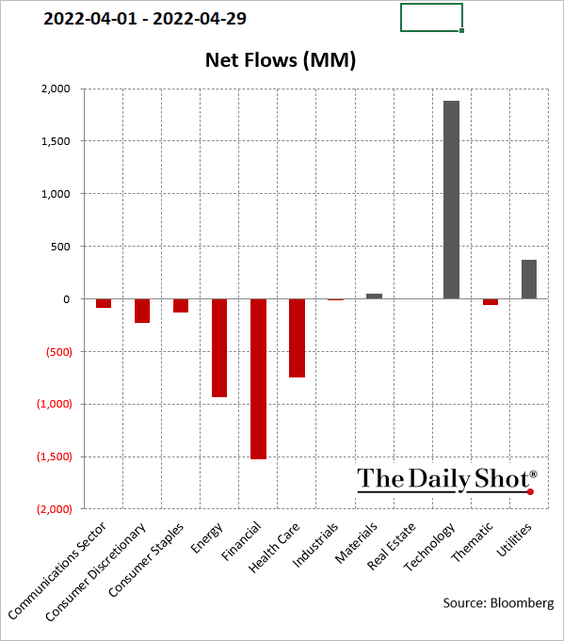
Financial ETFs continue to see outflows.
——————–
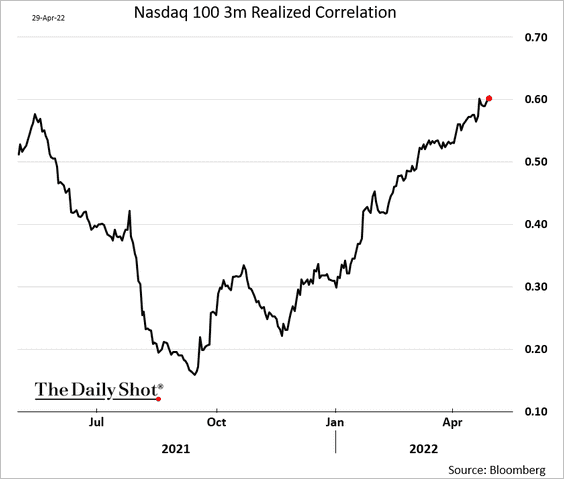
4. The correlation among Nasdaq 100 members has been climbing.
5. Here is the percentage of Nasdaq 100 shares trading above their 200-day moving average. Time for a rebound.
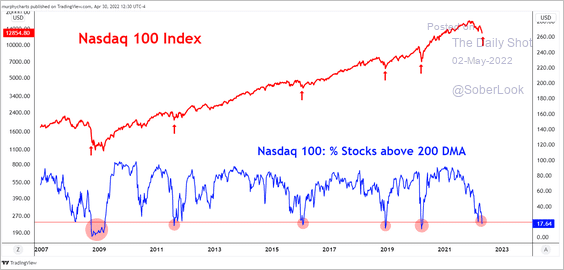 Source: @murphycharts
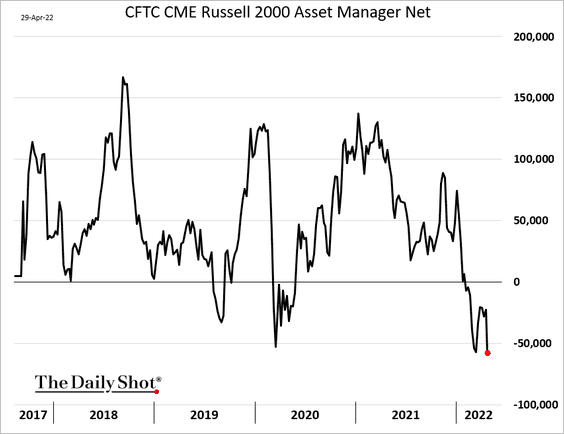
6. Asset managers are pressing their bets against the Russell 2000 (small-cap) futures.
7. The overall equity positioning hit the lowest level since early 2020, according to Deutsche Bank’s indicator.
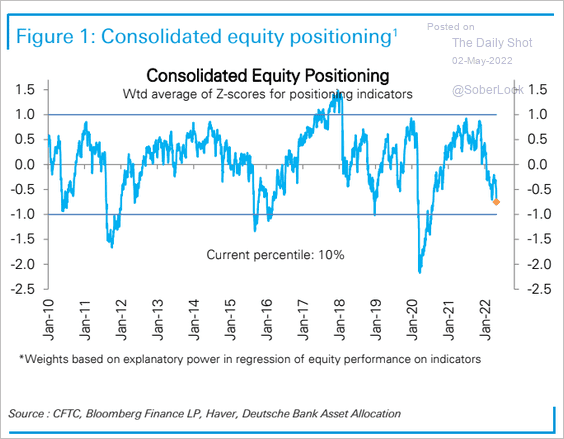 Source: Deutsche Bank Research
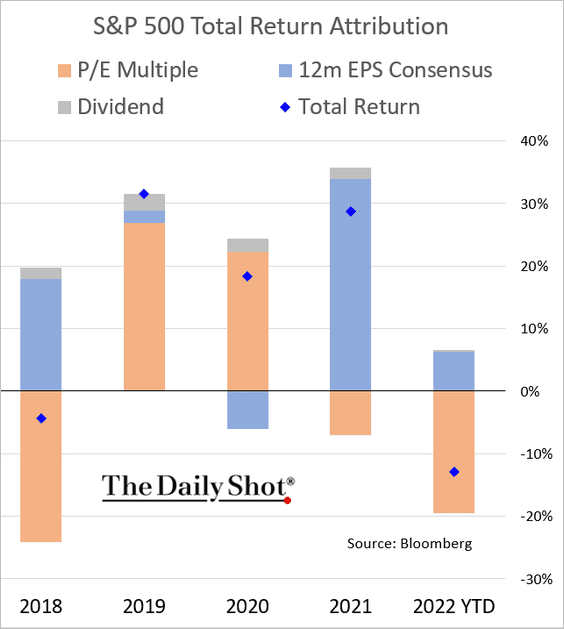
8. Next, we have the updated attribution charts.
• S&P 500:
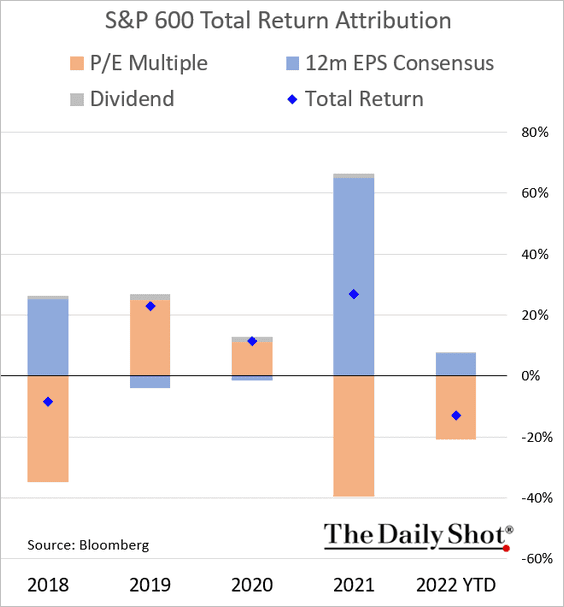
• S&P 600:
Back to Index
Credit
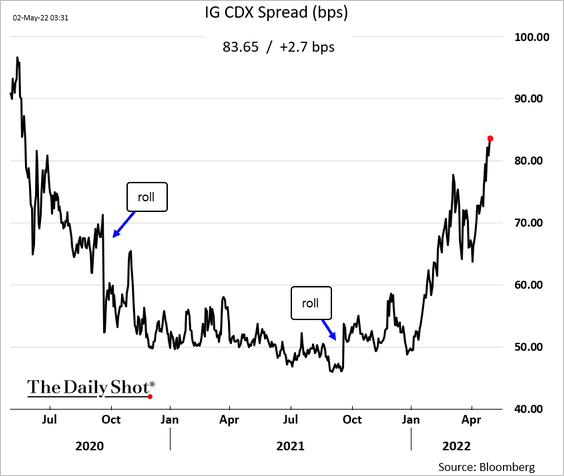
1. Investment-grade CDX spreads keep widening (managers are piling into macro hedges).
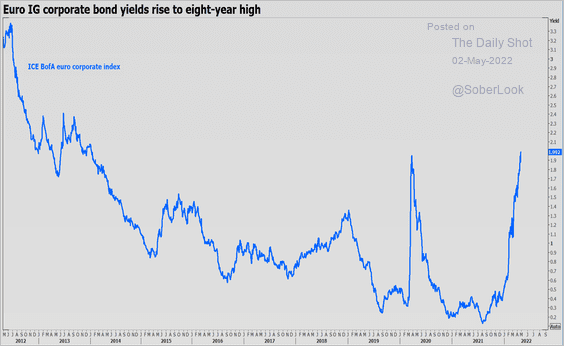
2. No more negative investment-grade yields in the Eurozone.
 Source: Reuters Read full article
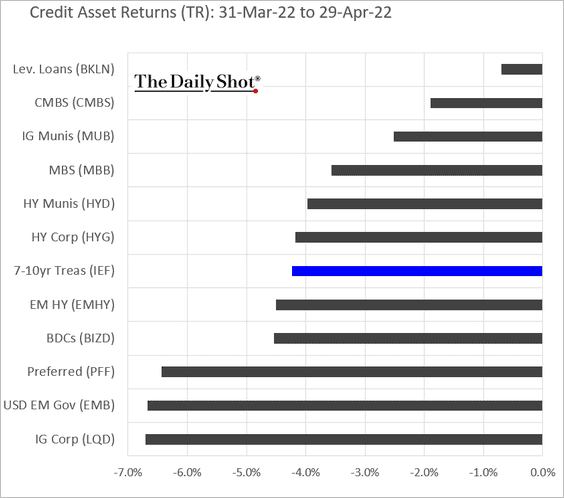
3. Here is last month’s performance across asset classes.
Back to Index
Rates
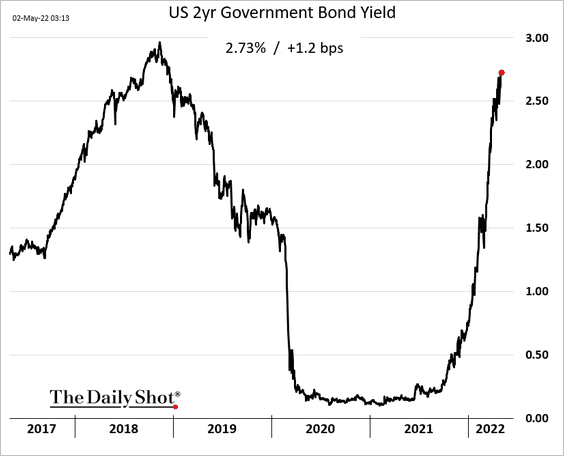
1. The 2-year Treasury yield keeps climbing as more aggressive Fed rate hikes get priced in.
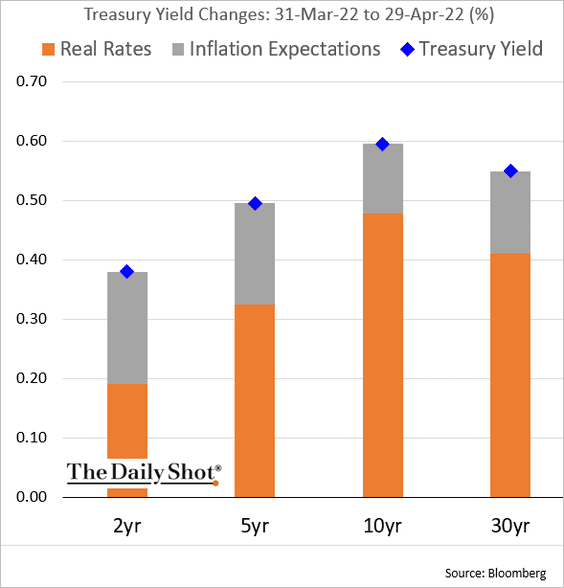
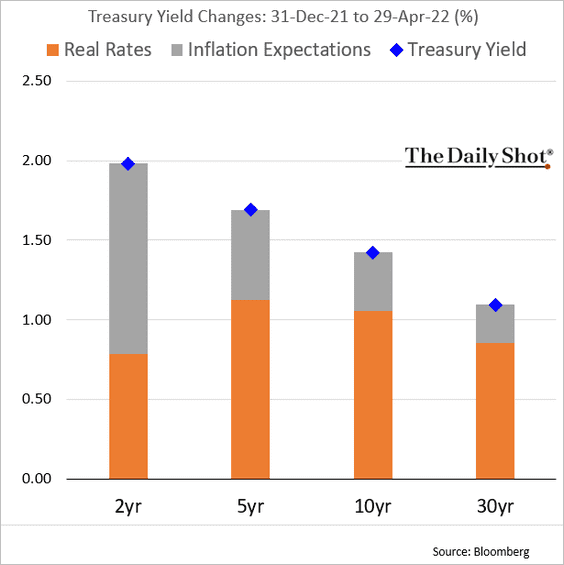
2. Next, let’s take a look at Treasury yield change attribution.
• April:
• Year-to-date:
——————–
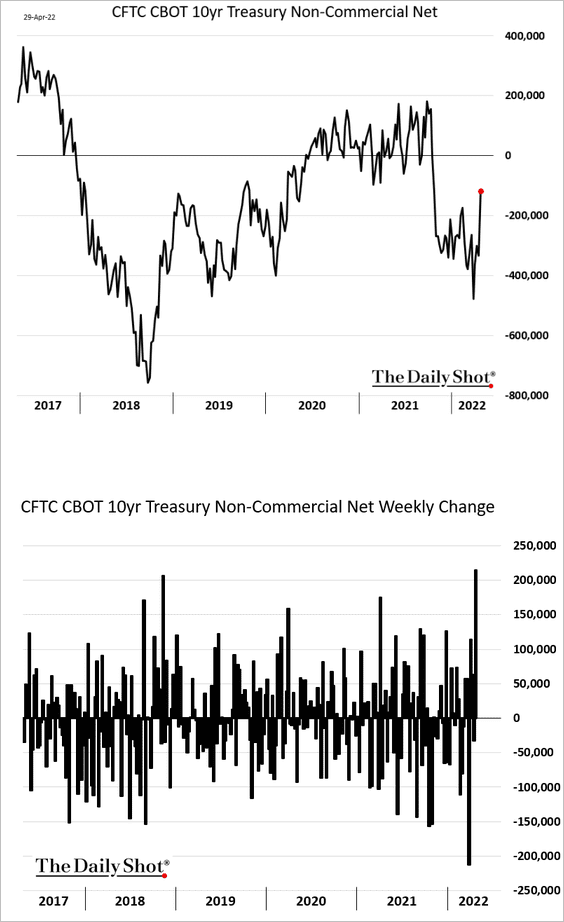
3. Speculative accounts covered a good portion of their bets against the 10-year note last week.
4. Are bond fund outflows about to end?
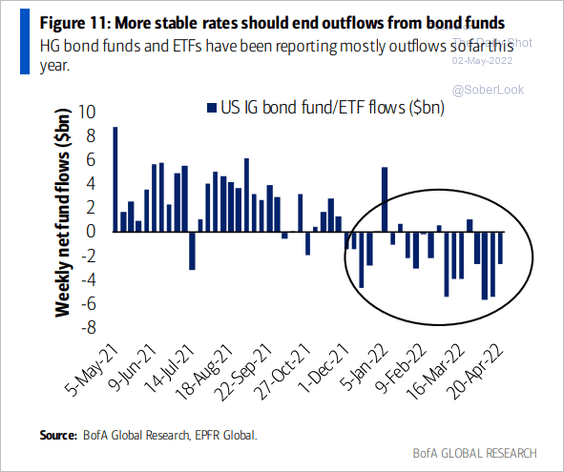 Source: BofA Global Research
5. The 30-year Treasury bond is entering a strong seasonal period.
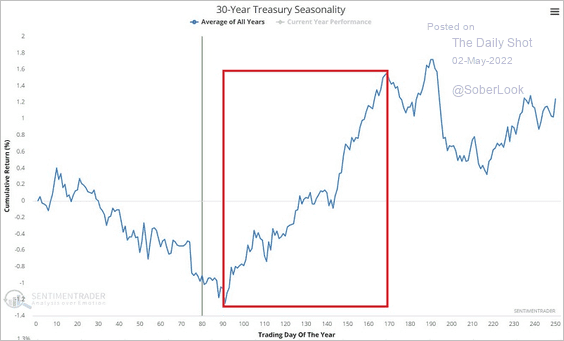 Source: SentimenTrader
Back to Index
Commodities
1. Industrial metals have taken a hit lately as the dollar surges. Here is copper.
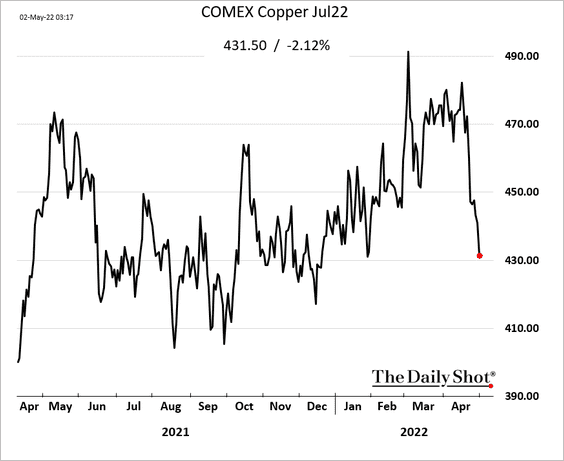
European steel rebar has been an exception.
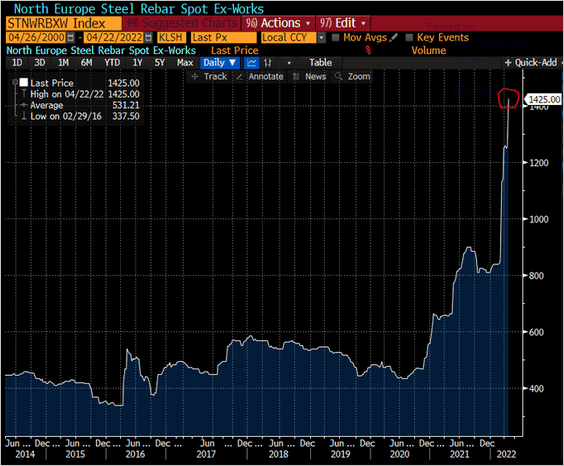 Source: @JavierBlas
——————–
2. Fertilizer prices are up massively over the past few months.
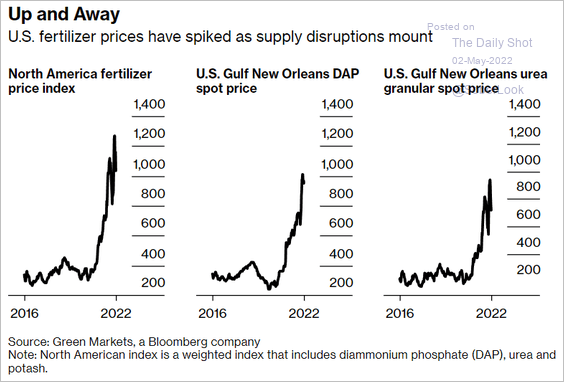 Source: @business Read full article
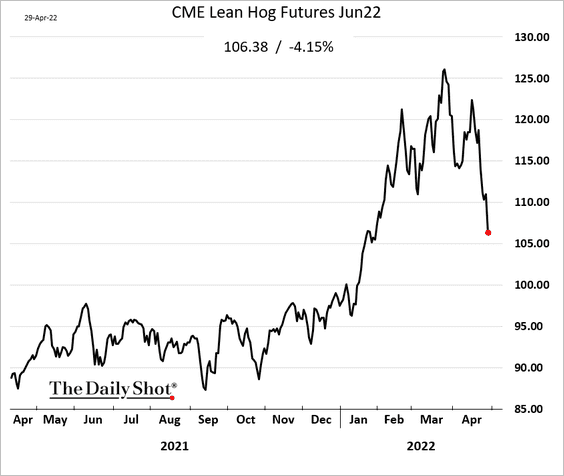
3. US hog futures have rolled over.
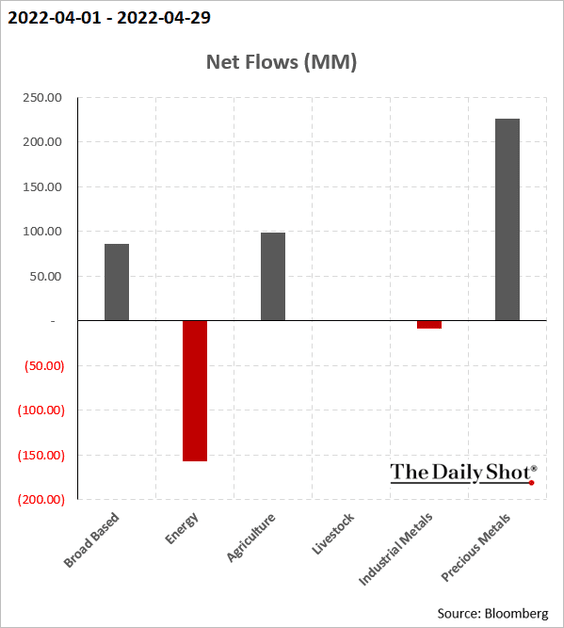
4. This chart shows commodity ETF flows last month.
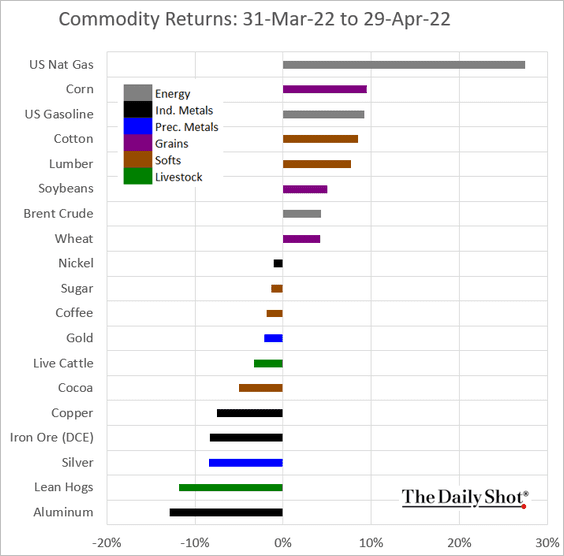
5. Finally, there is last month’s performance across key commodity markets.
Back to Index
Cryptocurrency
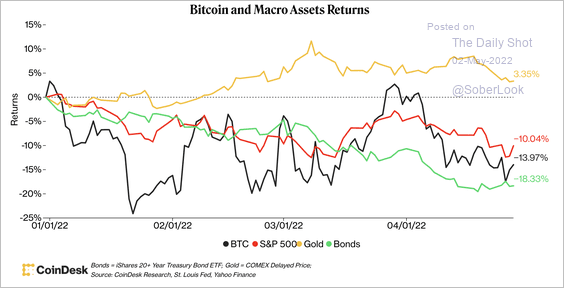
1. Bitcoin is underperforming gold and the S&P 500 so far this year.
 Source: CoinDesk Read full article
2. Most major cryptos ended April in the red.
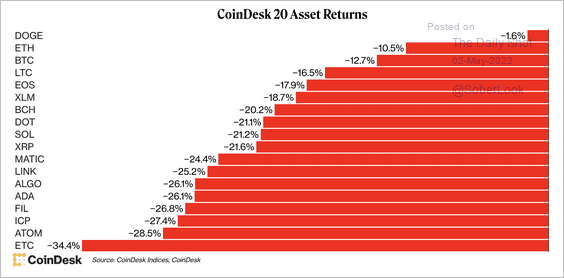 Source: CoinDesk Read full article
3. Some Layer-1 tokens outperformed last month.
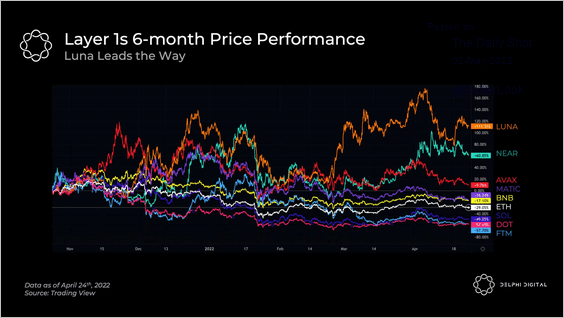 Source: @Delphi_Digital
4. Historically, bitcoin produces positive returns in May.
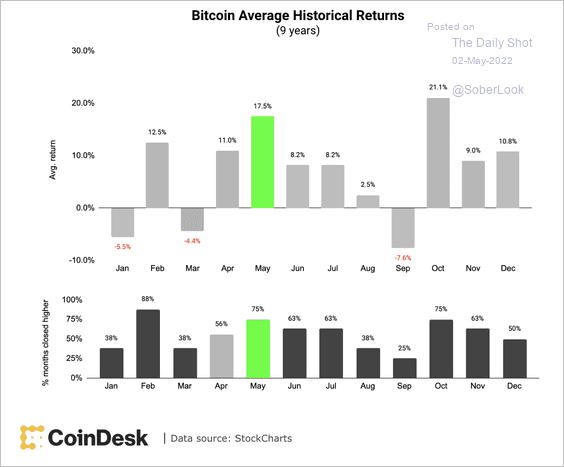 Source: CoinDesk Read full article
Back to Index
Emerging Markets
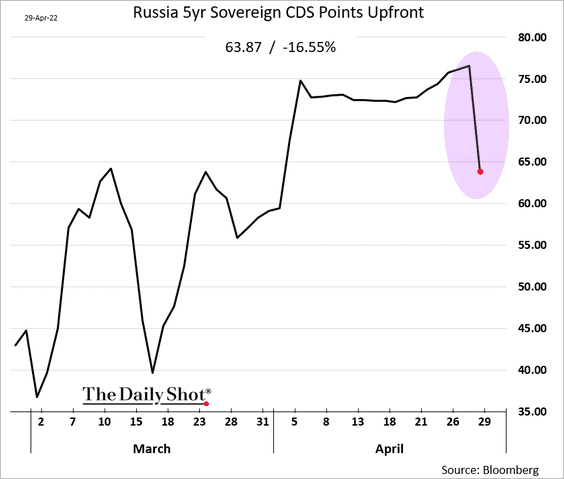
1. Russia’s central bank cut rates by 300 bps to ease pressure on the economy.
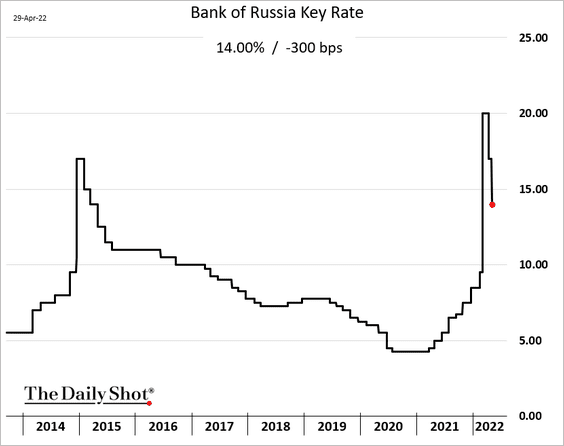
Russia also surprised the markets by avoiding default (for now).
 Source: @axios Read full article
Russian sovereign CDS points upfront dropped sharply.
——————–
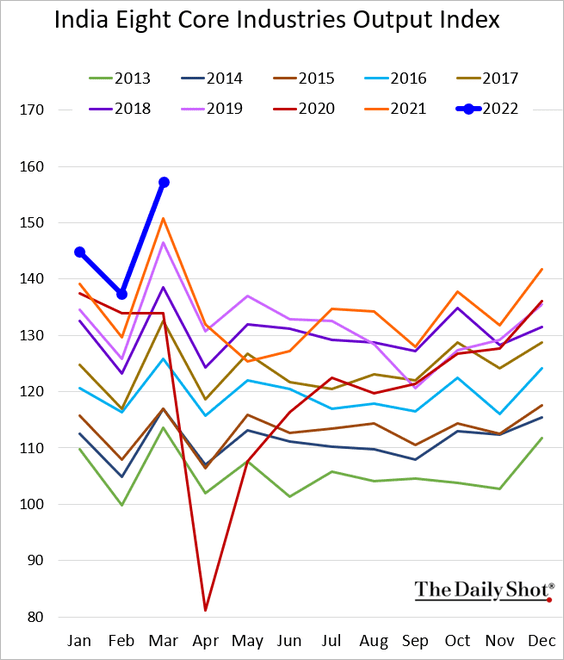
2. India’s industrial activity was robust in March.
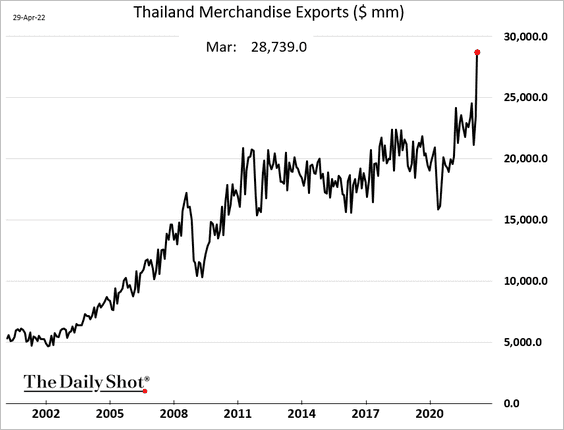
3. Thailand’s exports hit a record high.
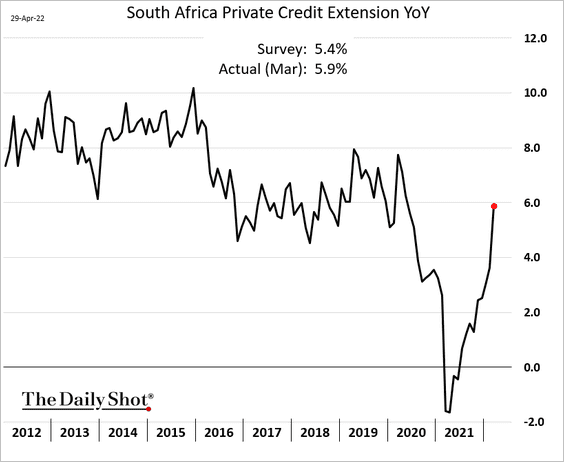
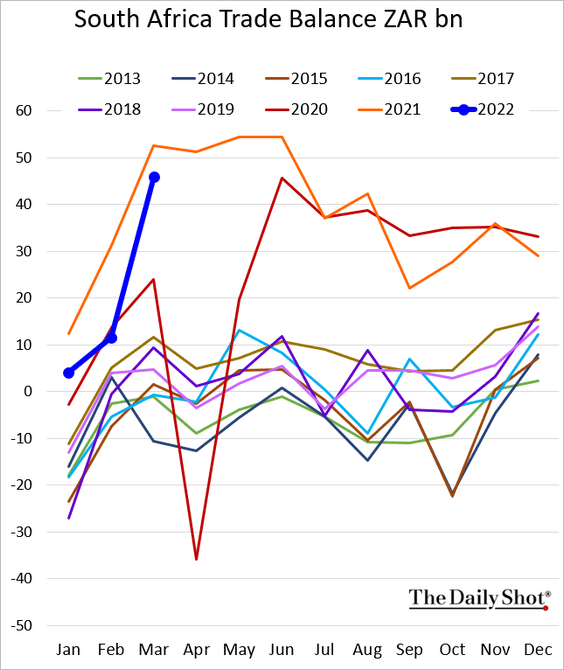
4. South Africa’s credit growth continues to accelerate.
Trade surplus surged in March.
——————–
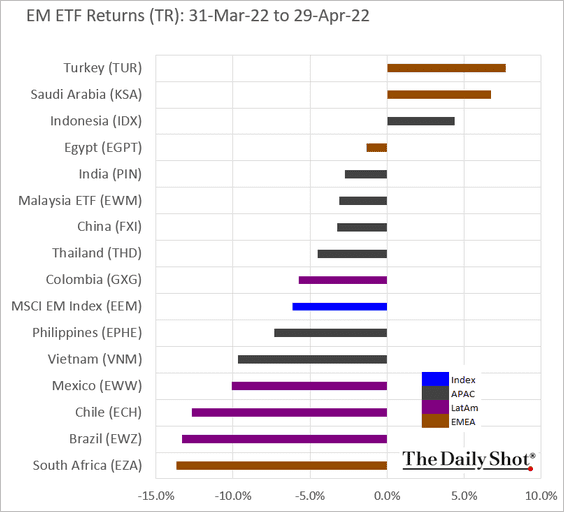
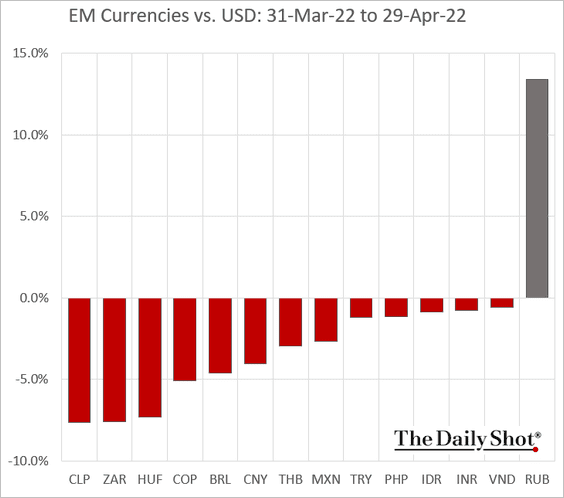
5. Next, let’s take a look at a couple of performance charts for April.
• EM equity ETFs:
• EM currencies:
Back to Index
China
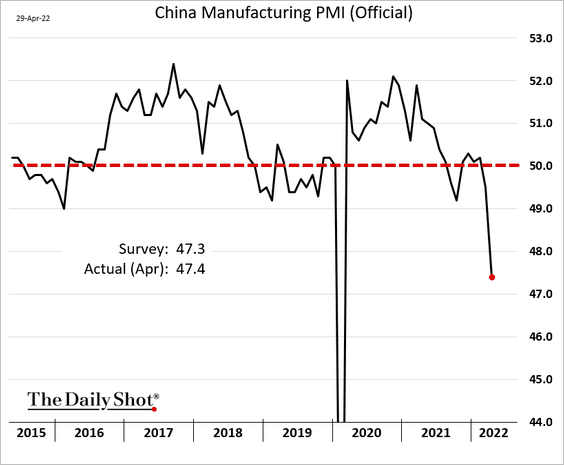
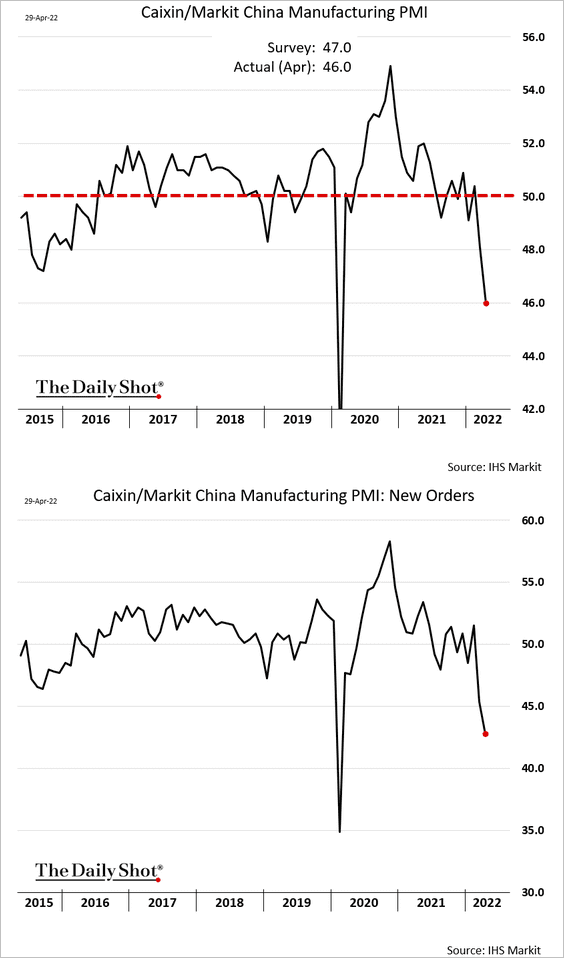
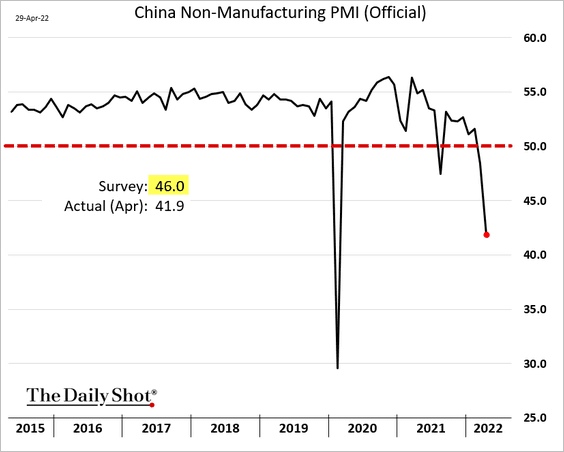
1. As expected, the PMI indicators (business activity) plunged in April as the lockdowns took their toll.
• Official manufacturing PMI:
• Markit manufacturing PMI:
• Official non-manufacturing PMI:
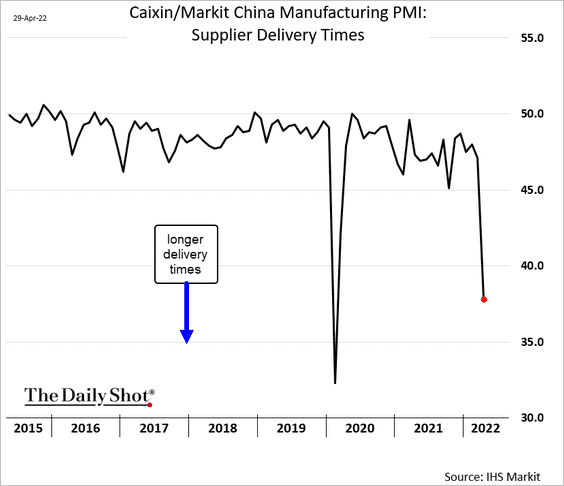
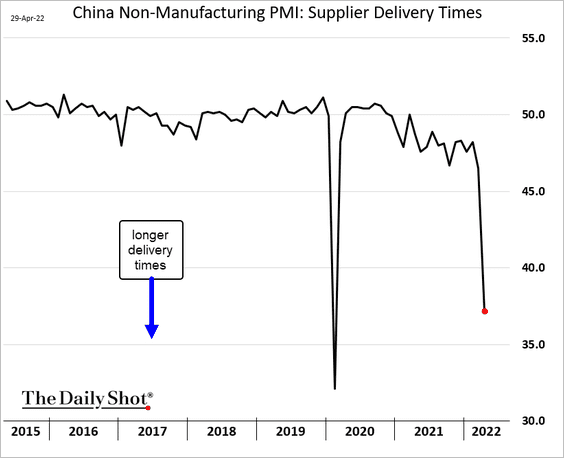
Supply chains are logjammed.
• Manufacturing supplier delivery times:
• Non-manufacturing supplier delivery times:
——————–
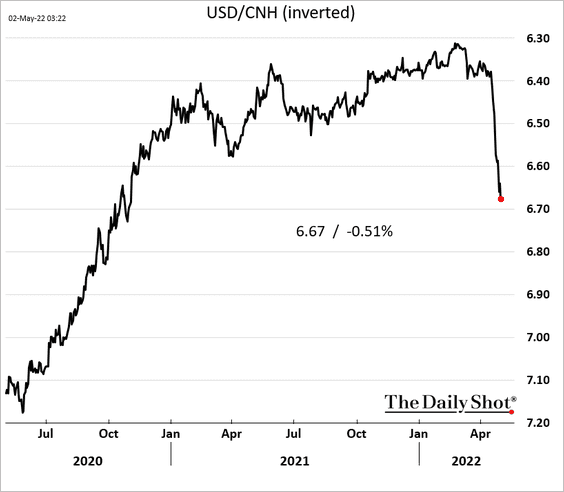
2. The renminbi remains under pressure vs. USD.
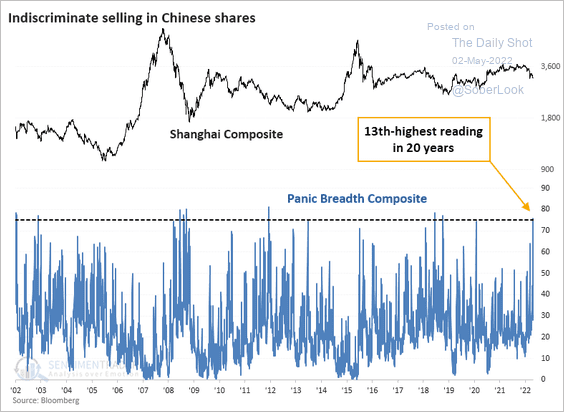
3. Stocks in the Shanghai Composite appear to be heavily oversold.
 Source: SentimenTrader
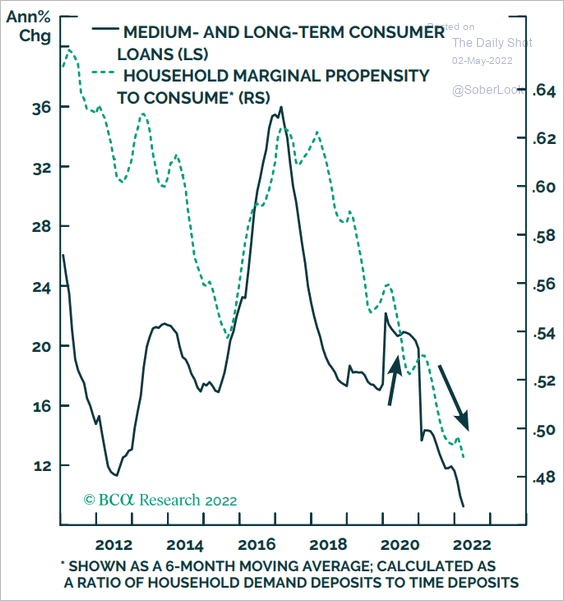
4. Growth in consumer loans has been slowing.
 Source: BCA Research
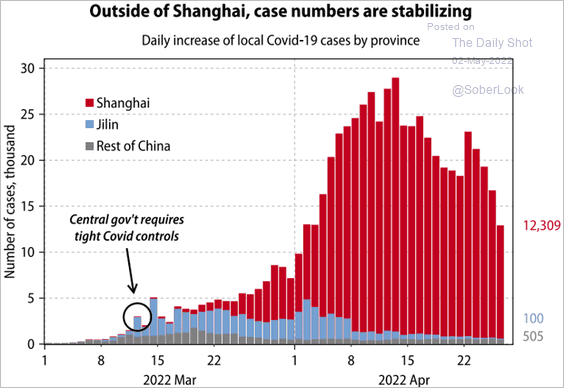
5. The COVID situation may be stabilizing as case counts come down and the geographic spreads narrow (two charts).
 Source: Gavekal Research
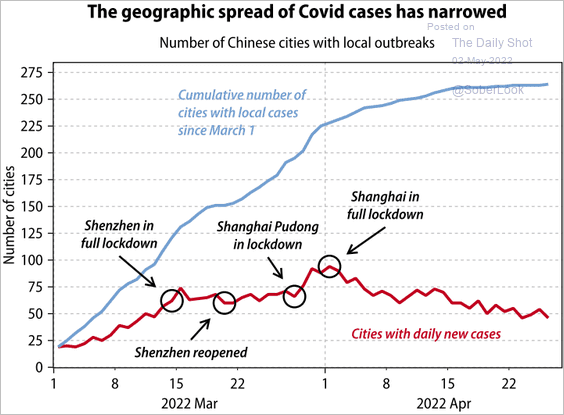 Source: Gavekal Research
In response to the improving data above, we are beginning to see the overall intensity of lockdowns ease across the top 100 cities in China.
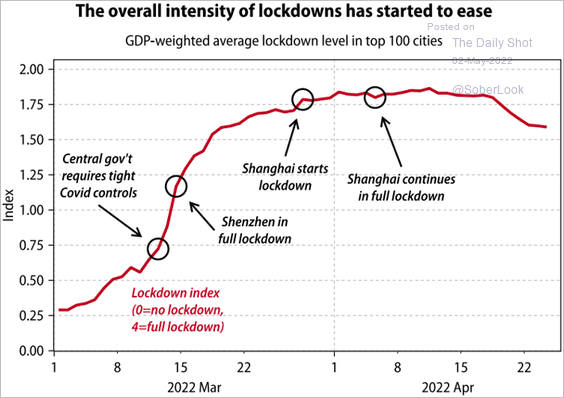 Source: Gavekal Research
——————–
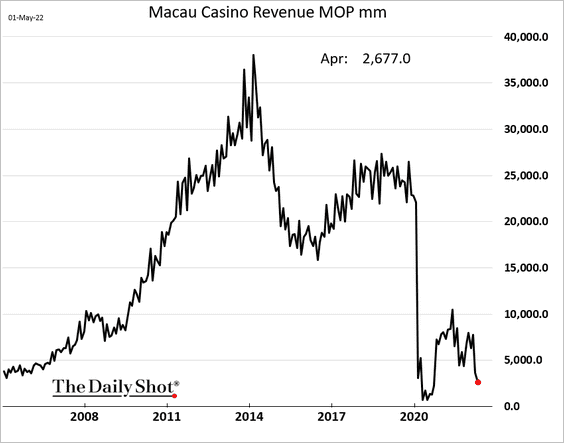
6. Macau casino revenue has collapsed again.
Back to Index
Asia – Pacific
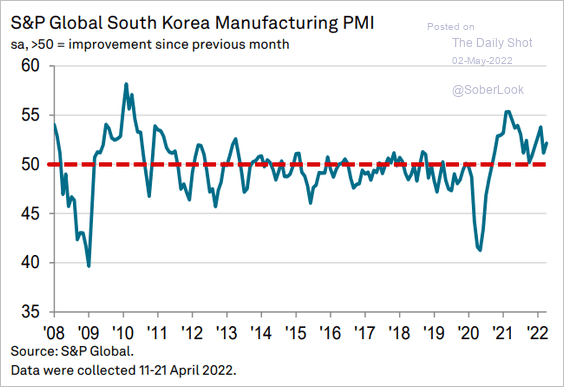
1. South Korea’s exports were lower than expected last month (but still a record high for this time of the year).
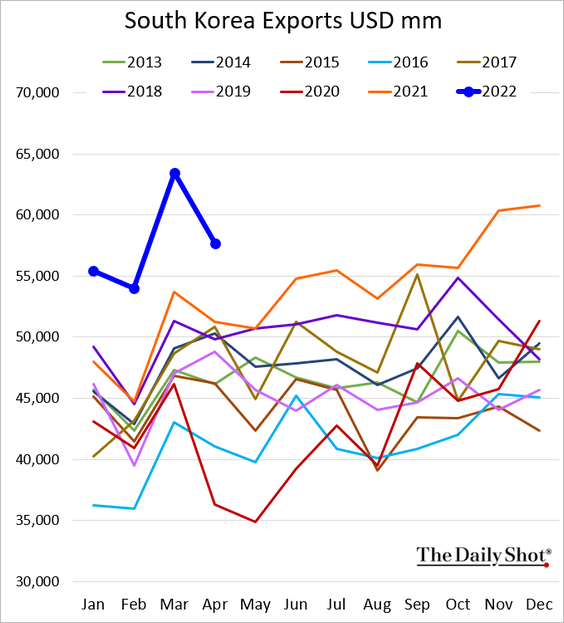
Manufacturing activity held up well in April.
 Source: IHS Markit
——————–
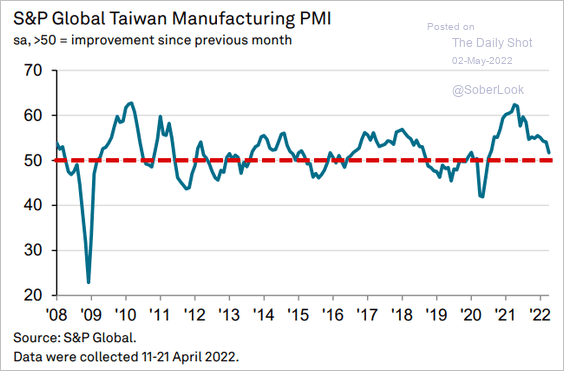
2. Taiwan’s manufacturing growth is stalling.
 Source: IHS Markit
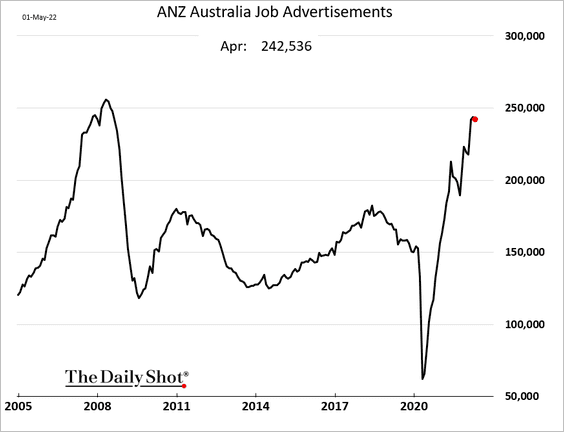
3. Australia’s job openings remain near multi-year highs.
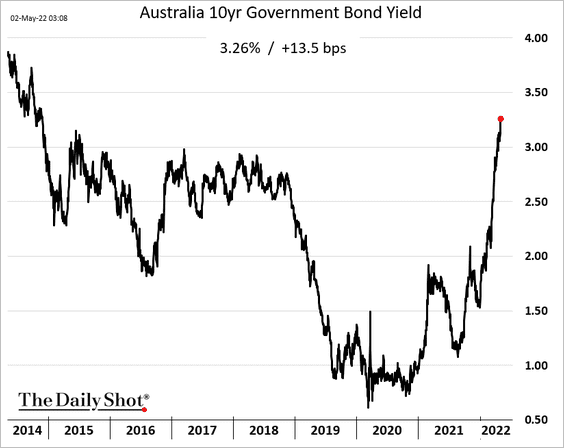
Bond yields continue to surge.
Back to Index
The Eurozone
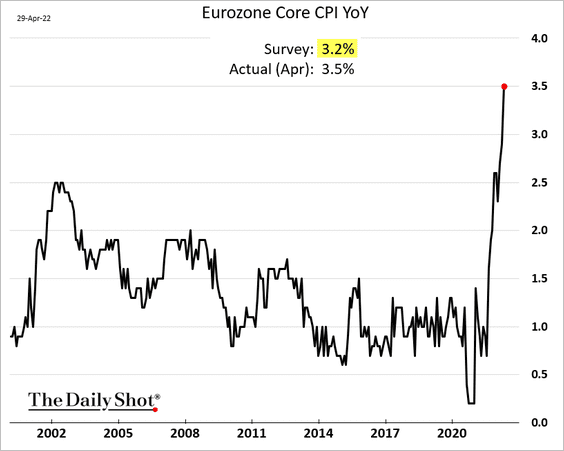
1. The euro-area core CPI surprised to the upside.
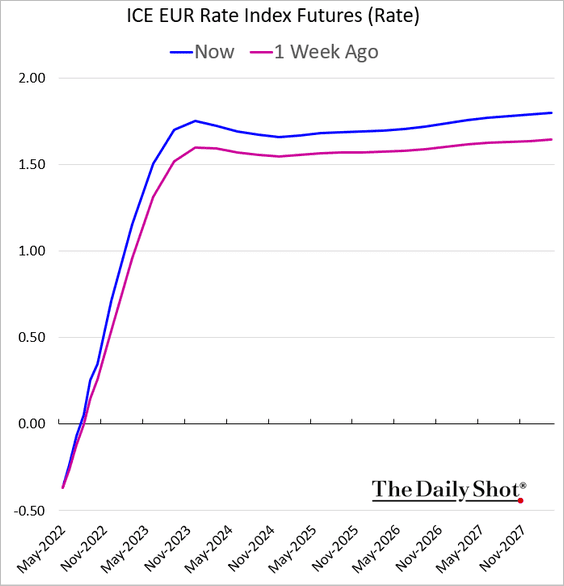
• Here is the market-implied trajectory for short-term rates.
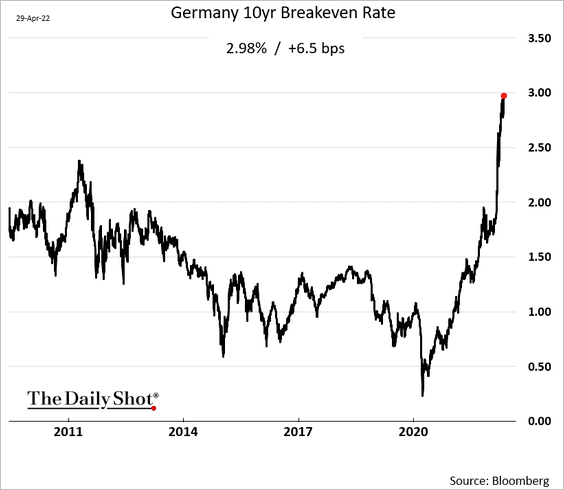
• Inflation expectations continue to surge.
Below is the euro inflation swap curve vs. the US.
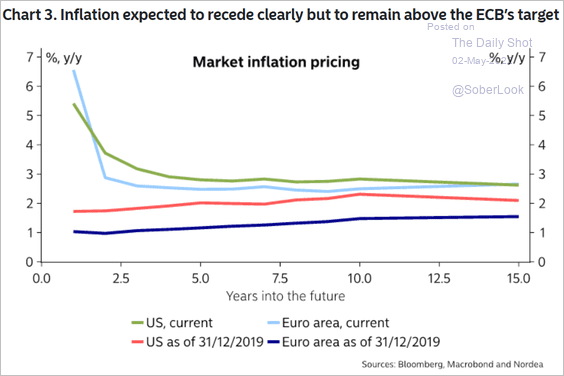 Source: Nordea Markets
• The Russia/Ukraine war has been a source of downside risk to growth and upside risk to inflation, which has kept the ECB cautious, according to BCA Research.
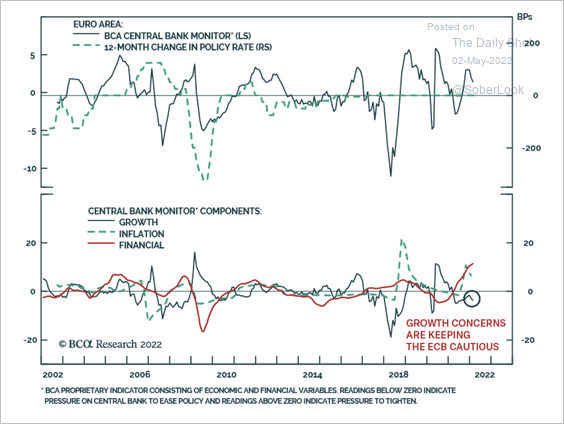 Source: BCA Research
2. Next we have a few additional inflation trends.
• French CPI:

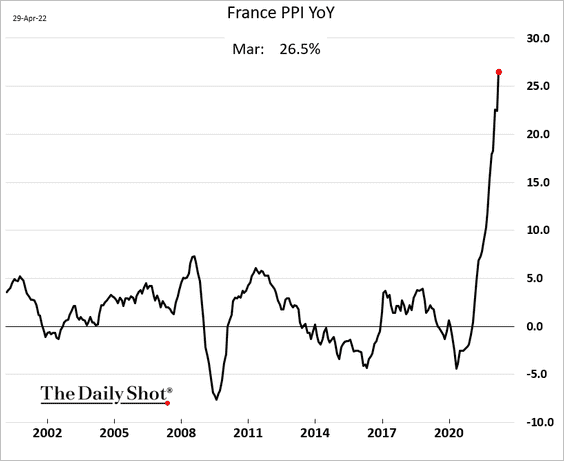
• French PPI:
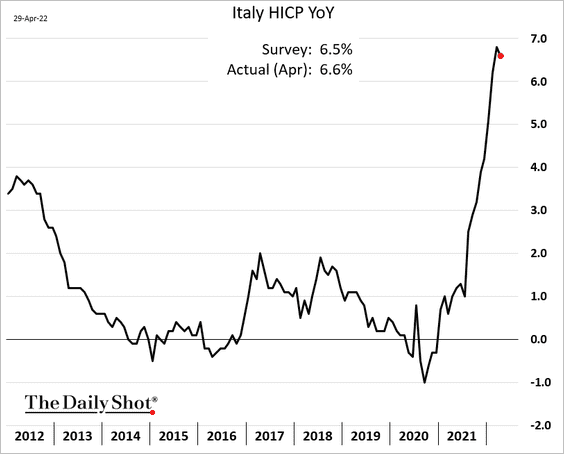
• Italian CPI:
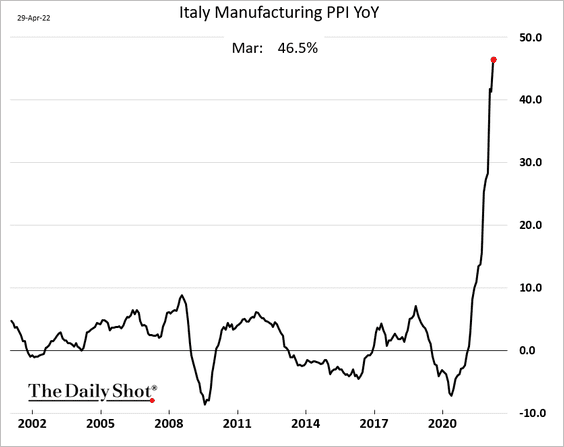
• Italian PPI:
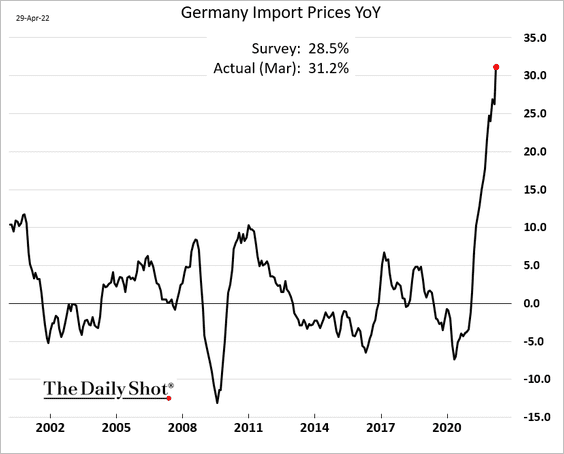
• German import prices:
——————–
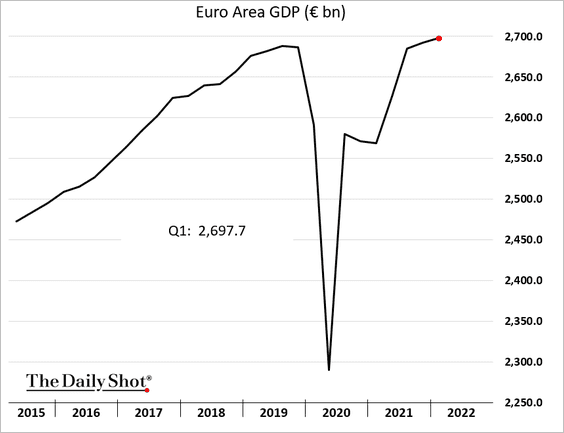
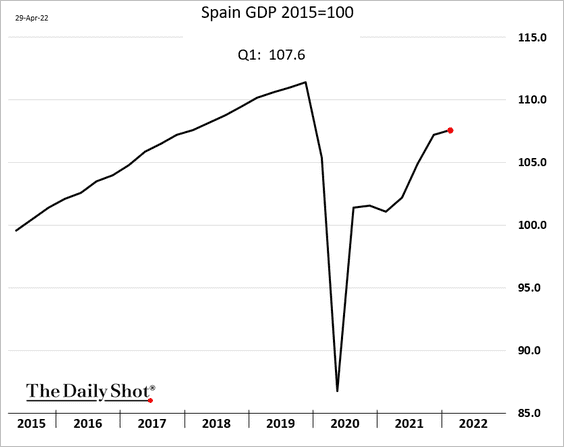
3. The GDP reports were mixed.
• Eurozone (in line with forecasts):
• France (weaker than expected):
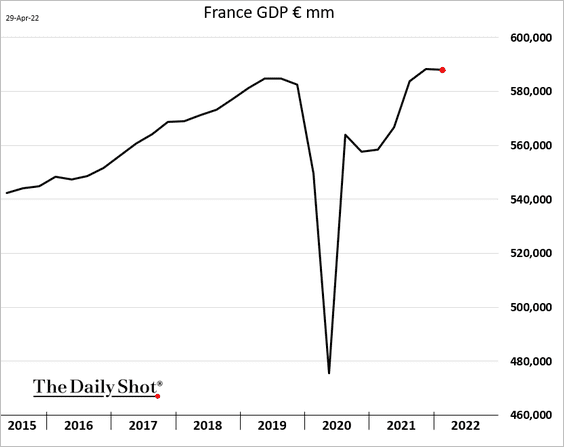
 Source: Pantheon Macroeconomics
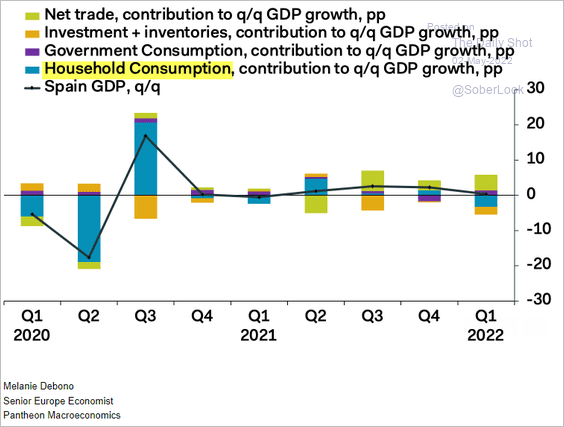
• Spain (weaker than expected):
• Germany (in line):
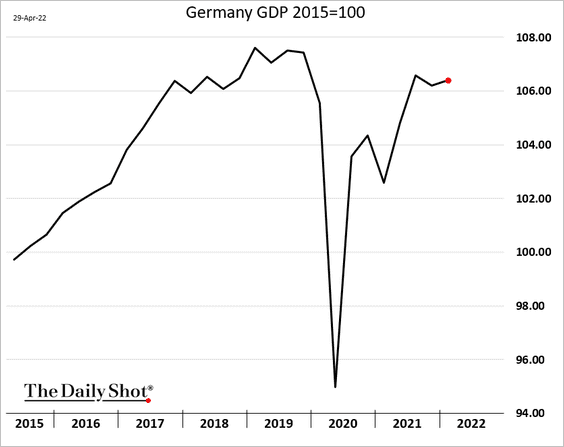
Weak survey results, however, point to downside risks for Germany’s GDP.
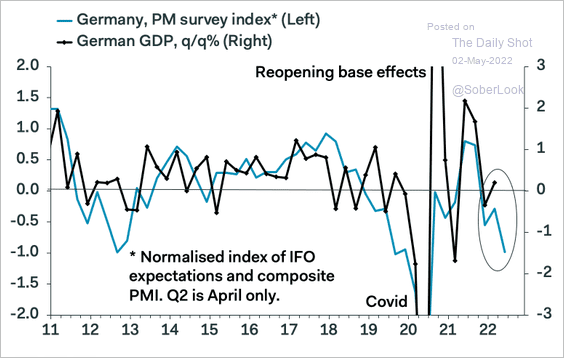 Source: Pantheon Macroeconomics
Back to Index
The United States
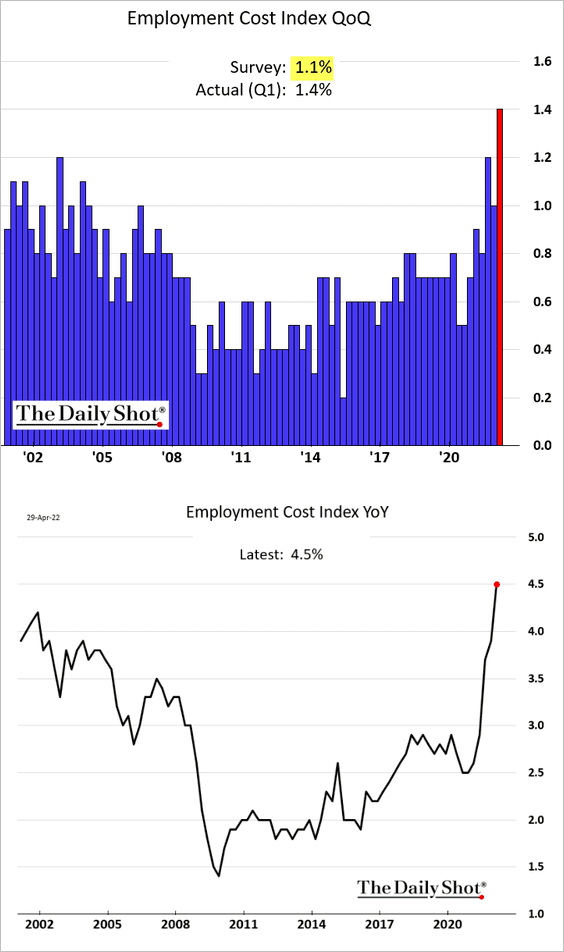
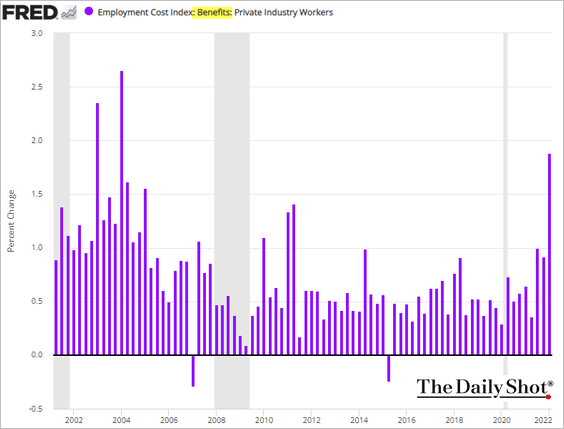
1. The employment cost index came in well above forecasts, spooking the markets. The concern has been the wage-price spiral.
![]()
Benefits costs surged.
——————–
2. Consumer spending was robust in March, exceeding forecasts.
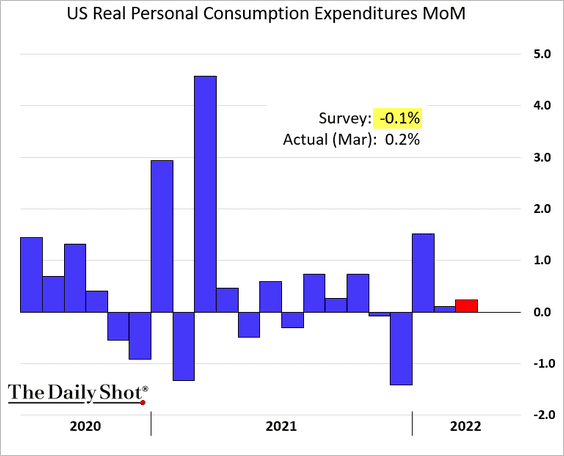
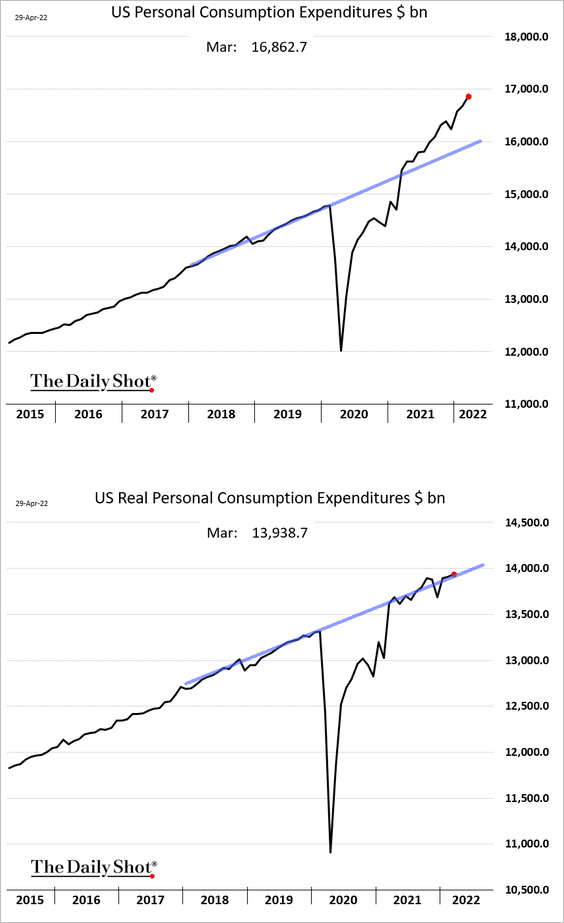
Here are the trends by sector.
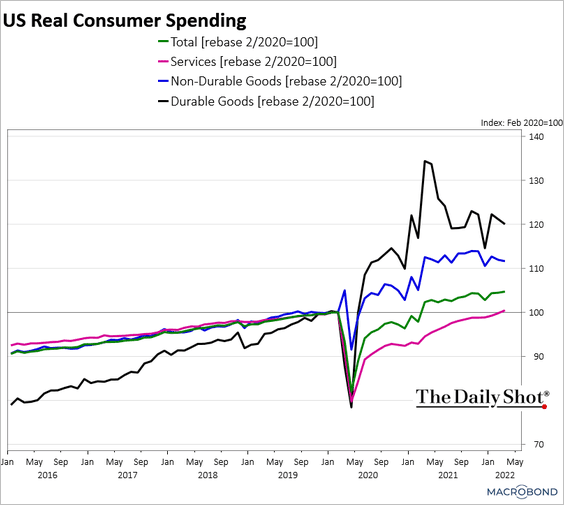 Source: Chart and data provided by Macrobond
By the way, households’ greater exposure to equities poses downside risks for spending.
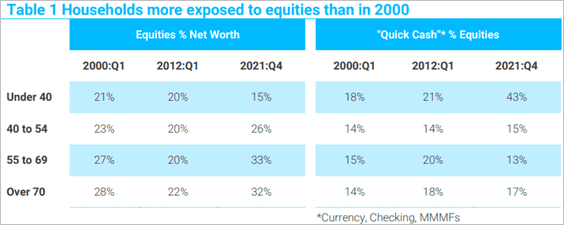 Source: TS Lombard
——————–
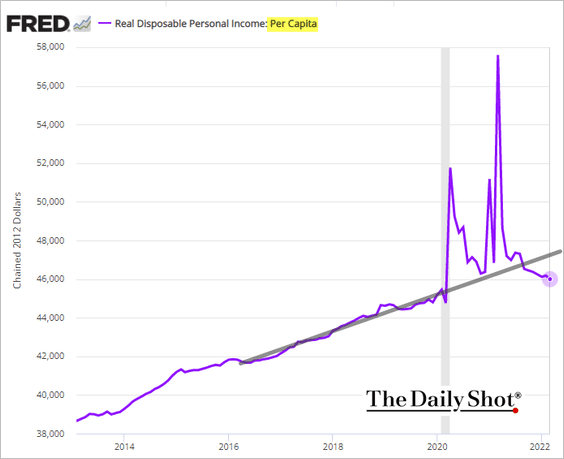
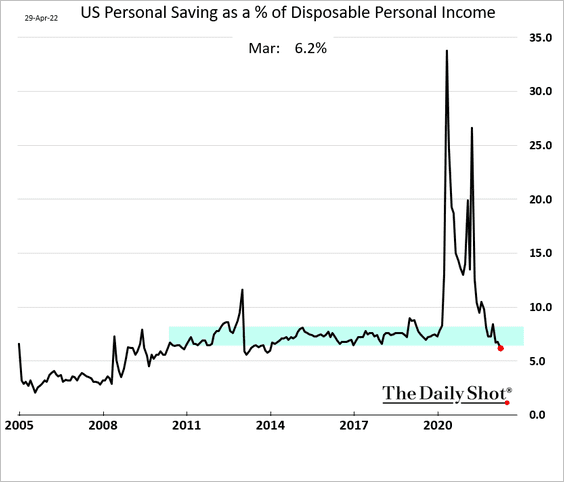
3. Real disposable income continues to trend lower, diverging from the pre-COVID trend.

Saving is now below the pre-COVID range.
——————–
4. The Chicago PMI was weaker than expected.
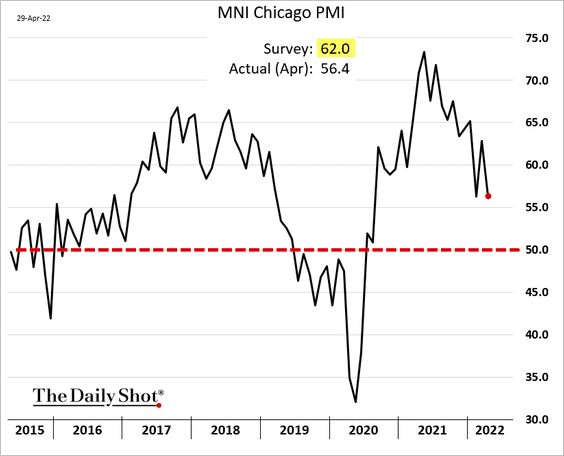
The risks to the ISM PMI at the national level are skewed to the downside.
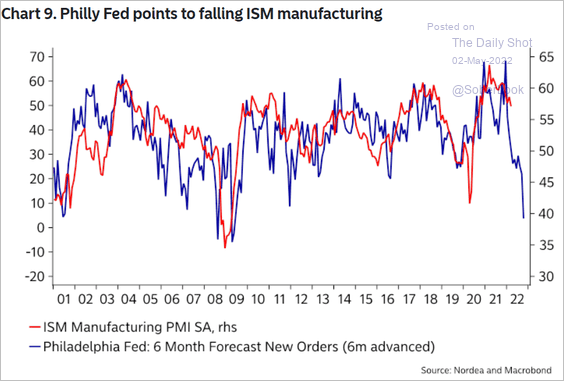 Source: Nordea Markets
——————–
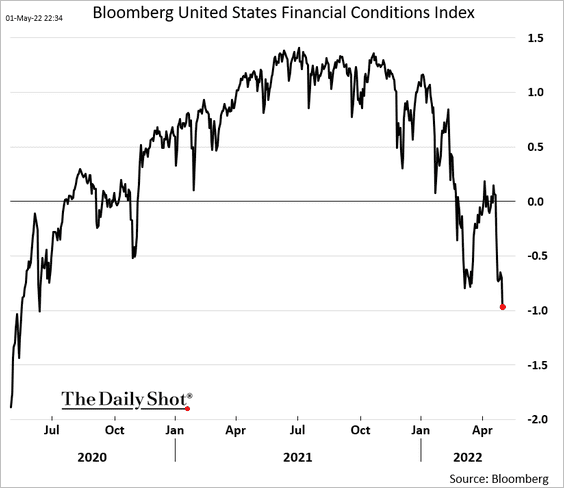
5. US financial conditions continue to tighten. The Fed’s hawkish guidance has been quite effective.
Back to Index
Global Developments
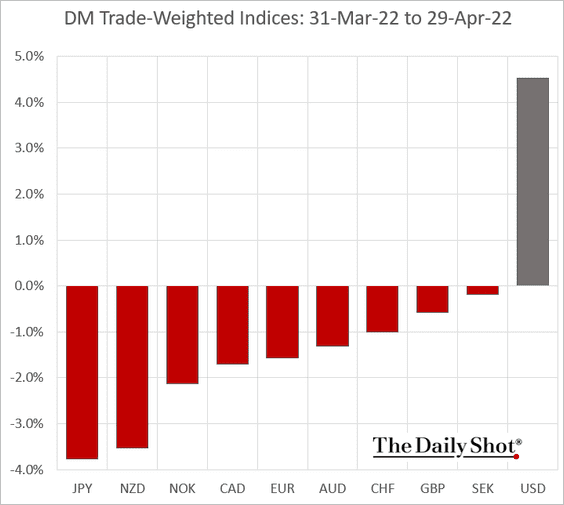
1. Let’s take a look at a couple of performance charts for April.
• Trade-weighted currency indices (going one way):
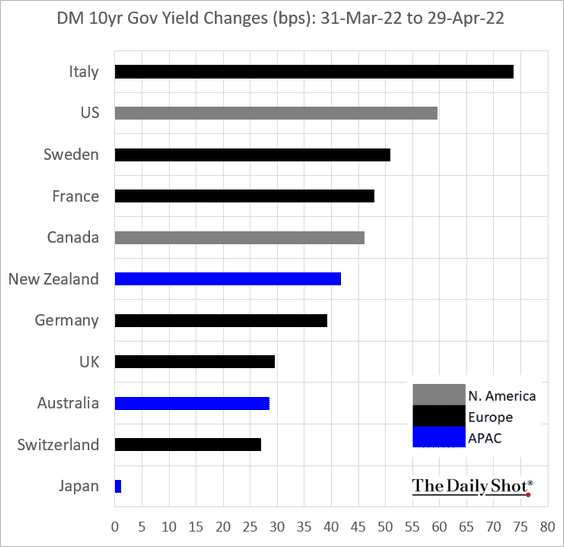
• Bond yields:
——————–
2. Margins are at peak levels as companies were able to pass on higher input costs to customers. But will the real income squeeze lower demand and impact profitability? (2 charts)
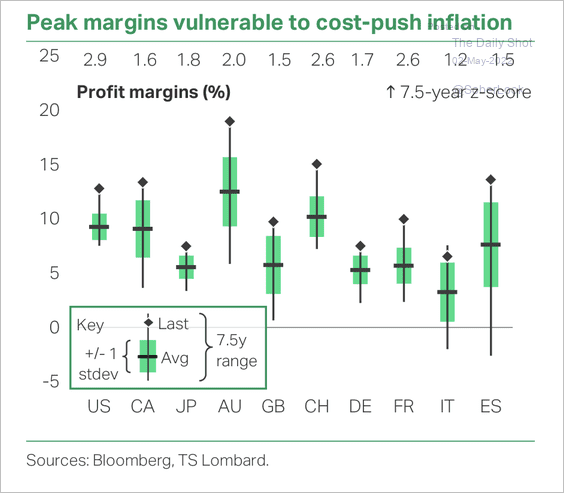 Source: TS Lombard
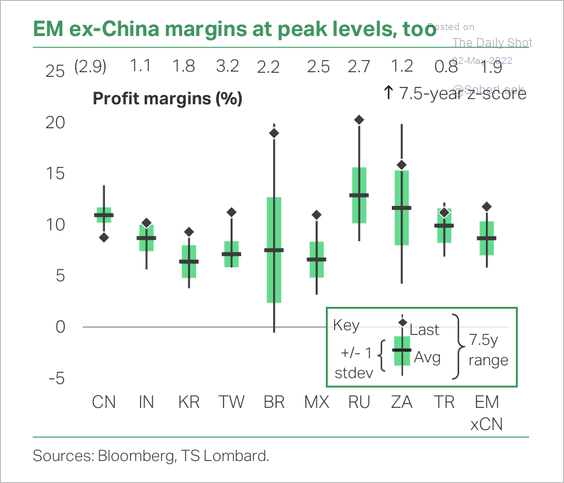 Source: TS Lombard
——————–
3. Leading indicators point to slowing economies in the Eurozone and the US.
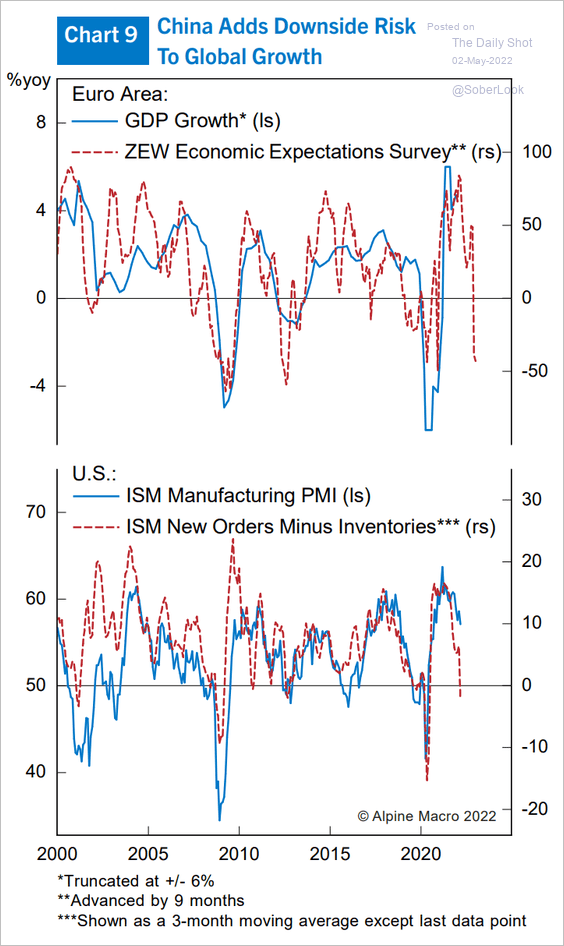 Source: Alpine Macro
——————–
Food for Thought
1. Data on Buy Now, Pay Later financing:
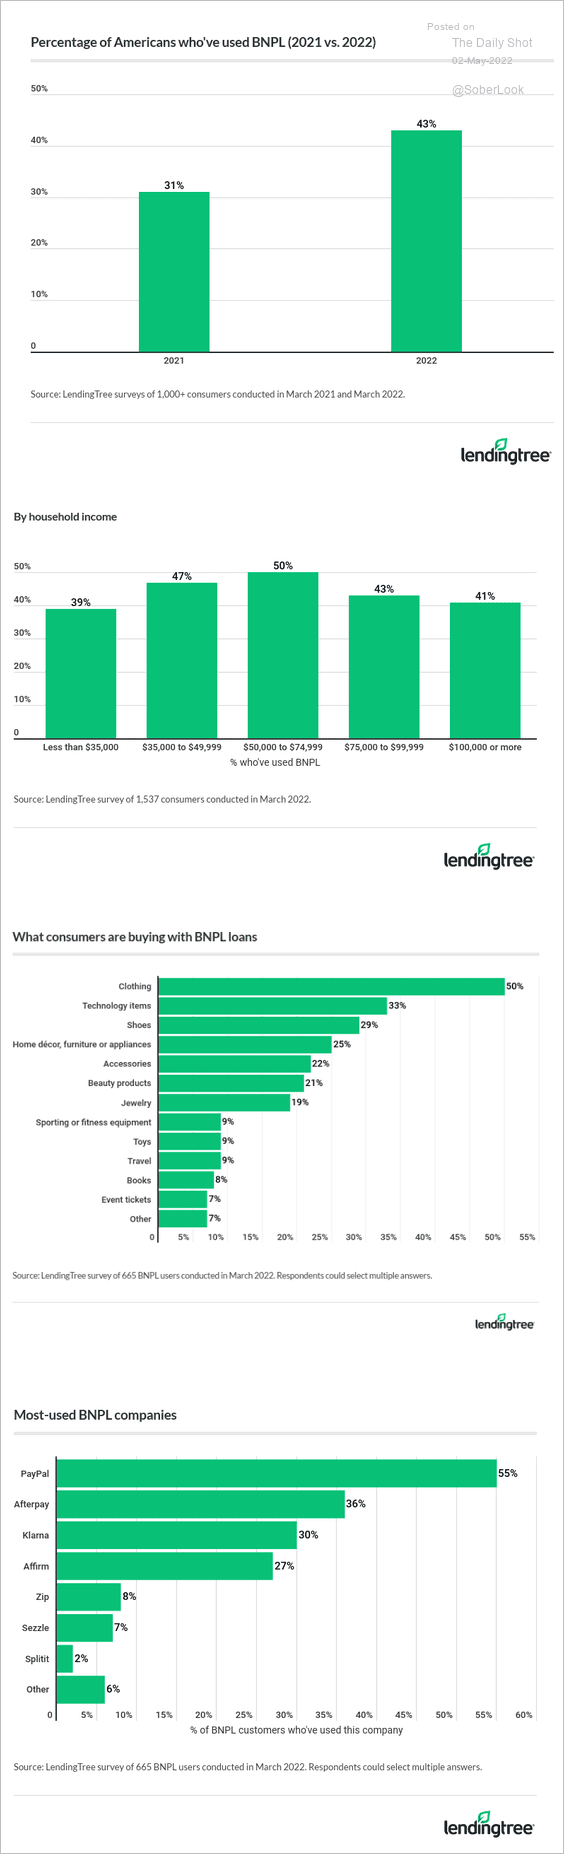 Source: LendingTree Read full article
2. Mortgage lending by fintech firms:
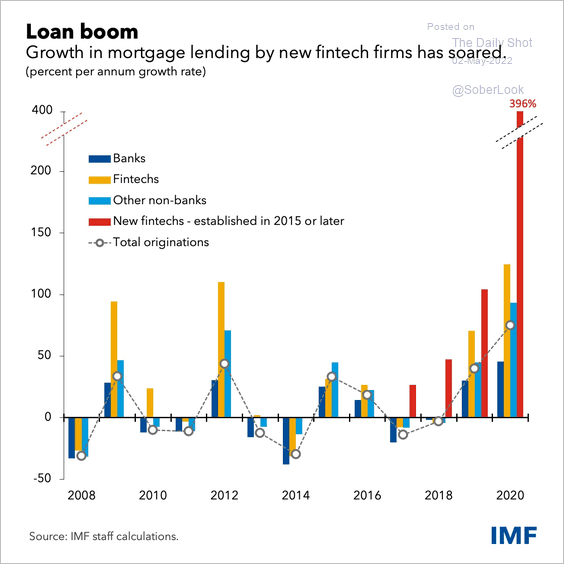 Source: IMF Read full article
3. Private equity involvement in sports:
 Source: PitchBook
4. Top 10 auto manufacturers by sales:
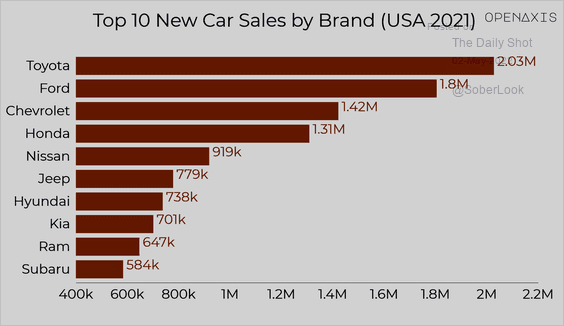 Source: OpenAxis
5. Top coffee producers:
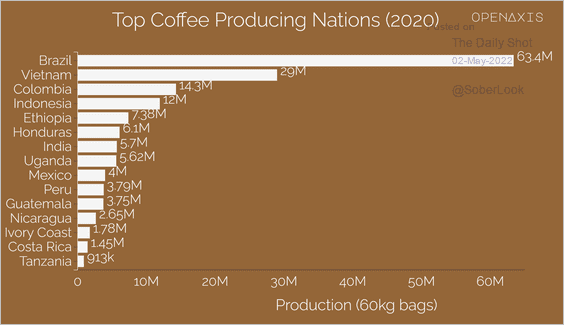 Source: OpenAxis
6. Living arrangements of 25-34-year-olds in the US:
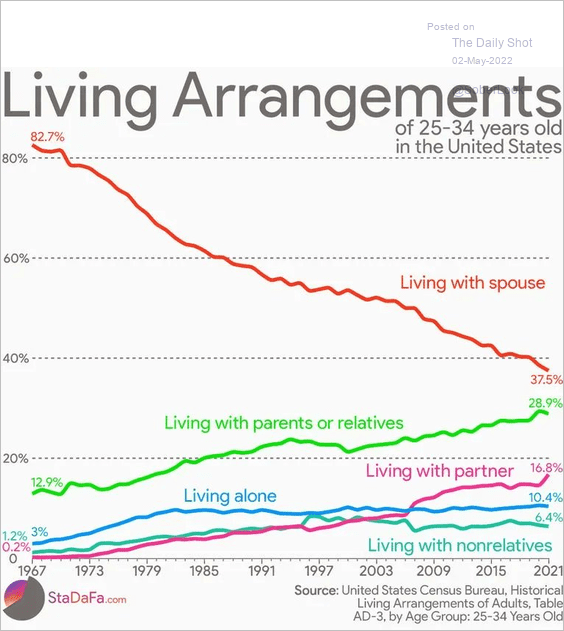 Source: StaSaFa.com; @simongerman600
7. Conditions for lifting sanctions on Russia:
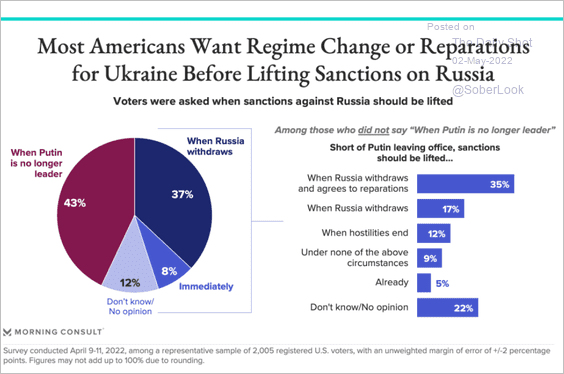 Source: Morning Consult Read full article
8. Marijuana legal status by state:
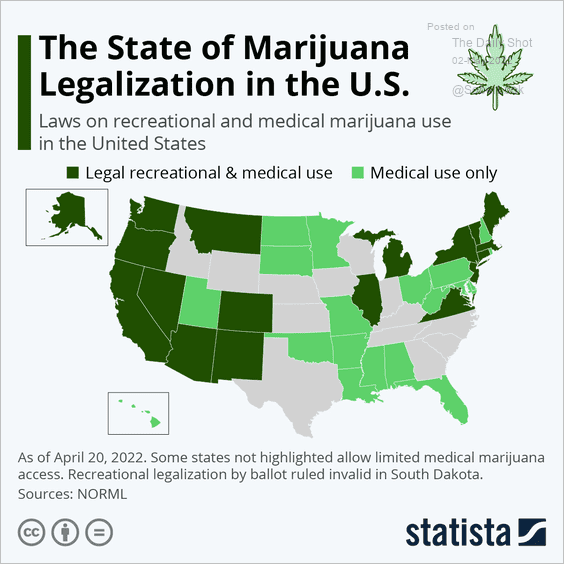 Source: Statista
9. The deadliest animals:
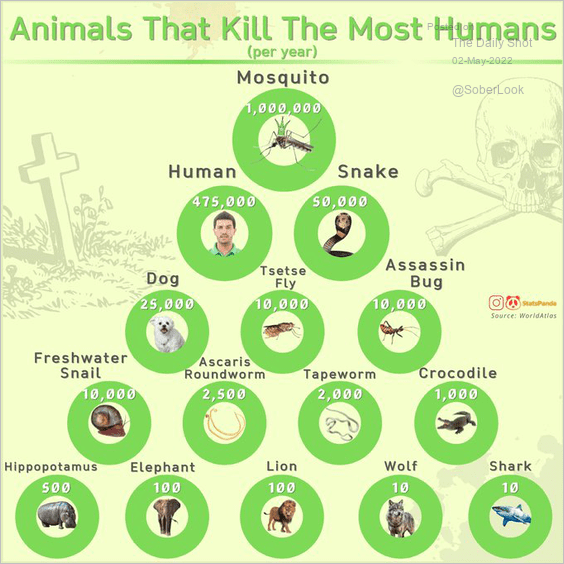 Source: @statspanda1 Read full article
——————–
Back to Index