
The Daily Shot: 03-May-22
• The United States
• Canada
• The United Kingdom
• The Eurozone
• Europe
• Asia – Pacific
• China
• Emerging Markets
• Energy
• Equities
• Credit
• Global Developments
• Food for Thought
The United States
1. The April ISM Manufacturing PMI surprised to the downside.
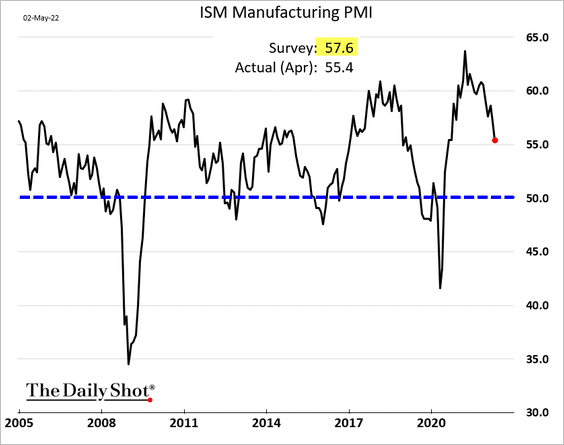
At this point, the index is mostly supported (artificially) by slow supplier delivery times.
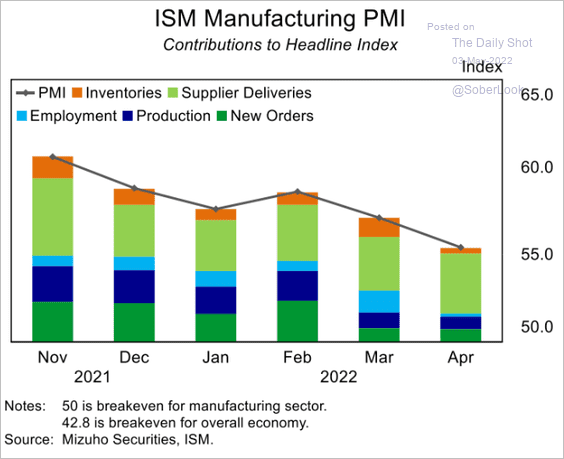 Source: Mizuho Securities USA
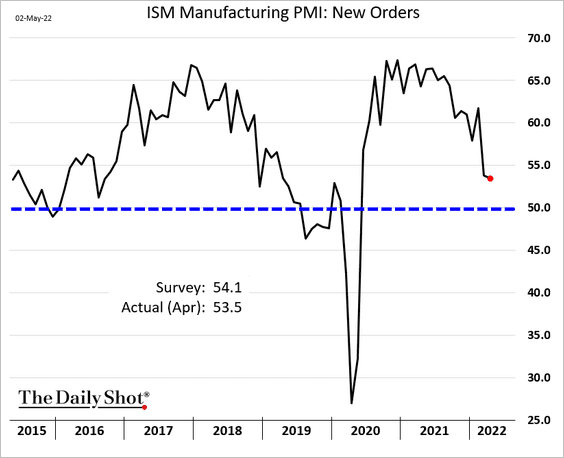
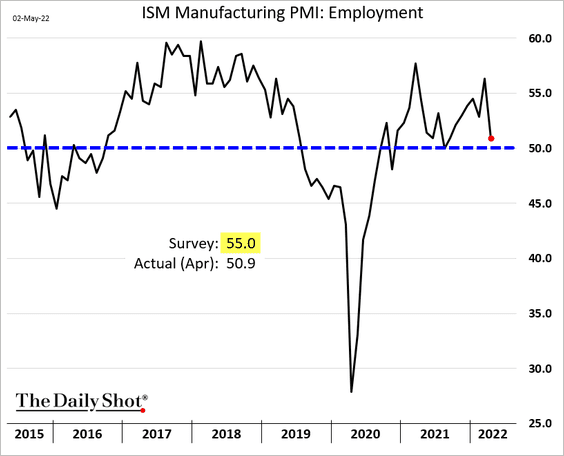
Demand measures have been moderating. Is the nation’s economic growth slowing faster than expected?
– New orders:
– Hiring:
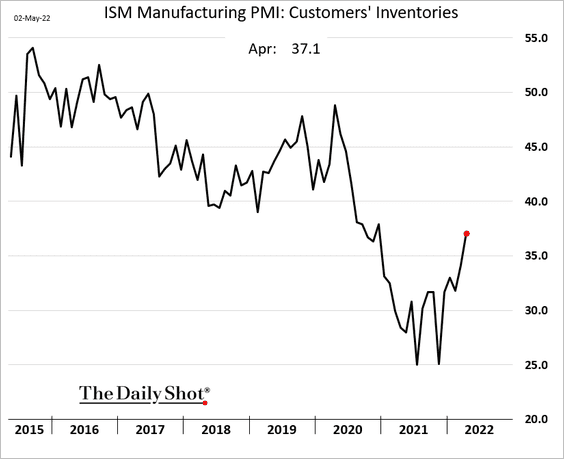
• Manufacturers see customers’ inventories starting to normalize.
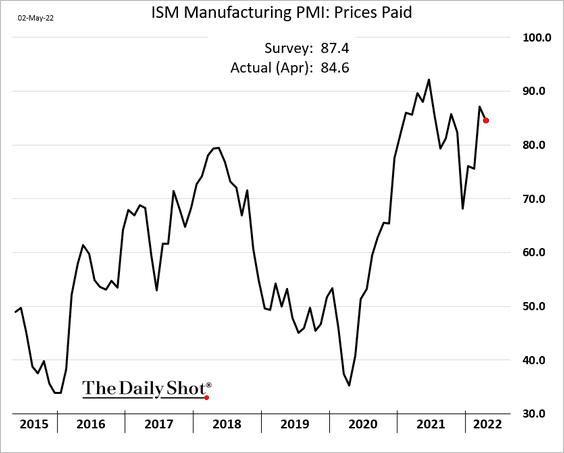
• Price pressures persist.
• Is the weakness in China’s factory activity going to show up in the US in the months ahead.
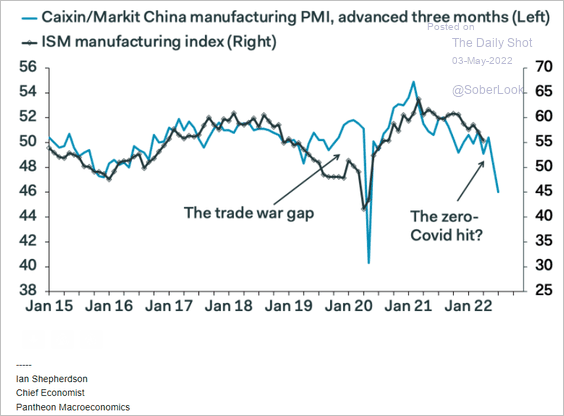 Source: Pantheon Macroeconomics
——————–
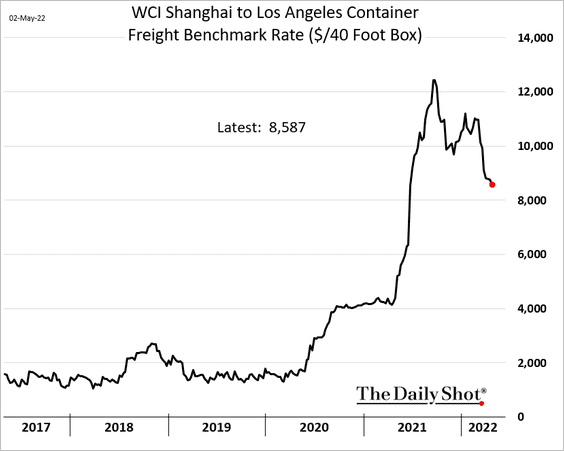
2. International container freight rates are off the highs, but we are unlikely to ever see pre-COVID levels again.
3. Is the massive inventory build coming to an end (2 charts)?
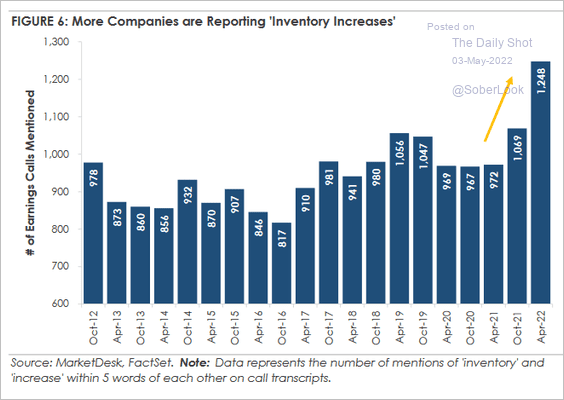 Source: MarketDesk Research
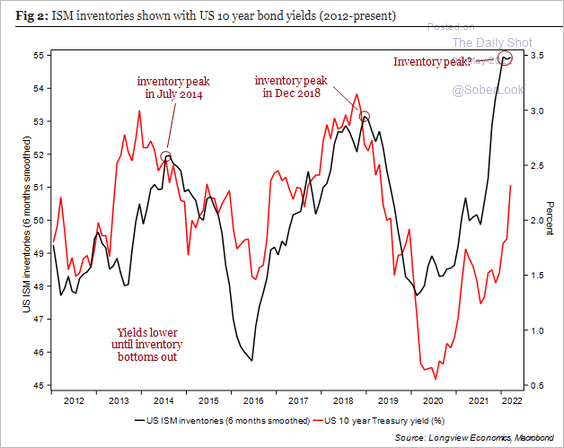 Source: Longview Economics
——————–
4. Nearly all auto dealers continue to report low inventories.
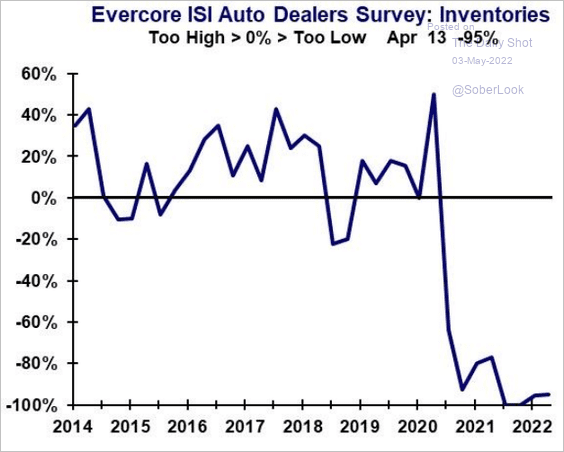 Source: Evercore ISI Research
With the recent surge in automobile prices, demand for parts has been tremendous. Consumers are forced to repair rather than buy cars.
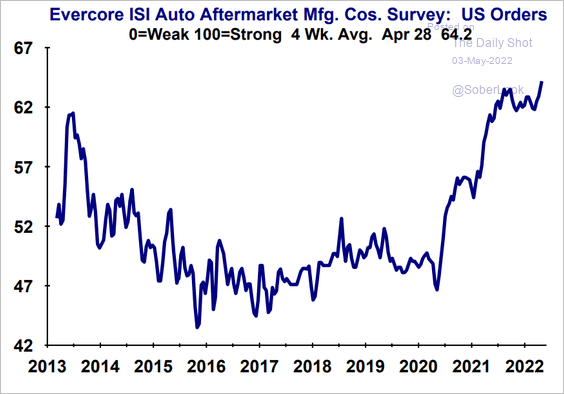 Source: Evercore ISI Research
——————–
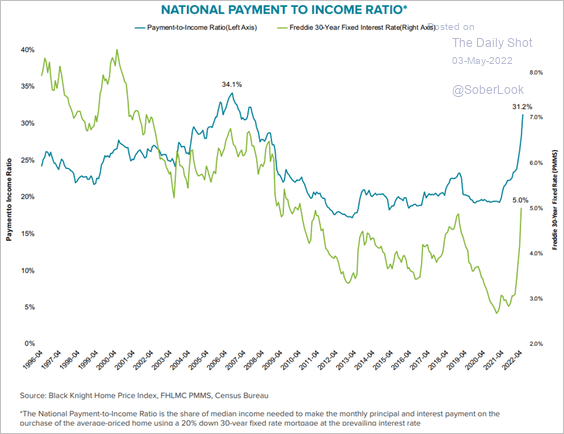
5. Next, we have some updates on the housing market.
• The payment-to-income ratio, a measure of housing market valuation, is nearing the 2006 (housing bubble) peak.
 Source: Black Knight
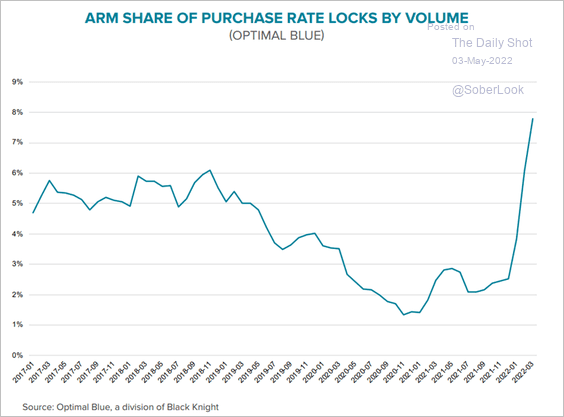
• The spike in mortgage rates is forcing some buyers into ARM financing.
 Source: Black Knight
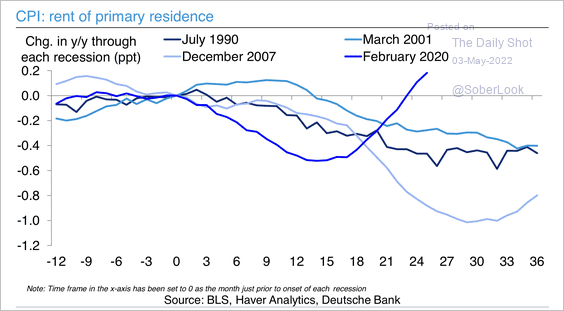
• Rent inflation has fallen faster and has recovered faster than in previous recessions.
 Source: Deutsche Bank Research
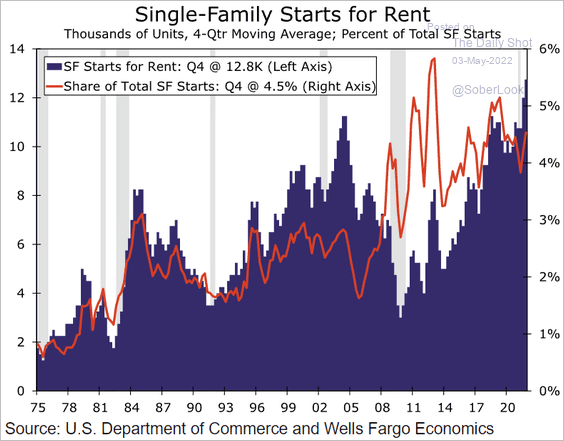
• Construction of single-family homes for rent is becoming a larger part of the residential market.
 Source: Wells Fargo Securities
• Housing wealth gains since the start of the pandemic have exceeded $6 trillion.
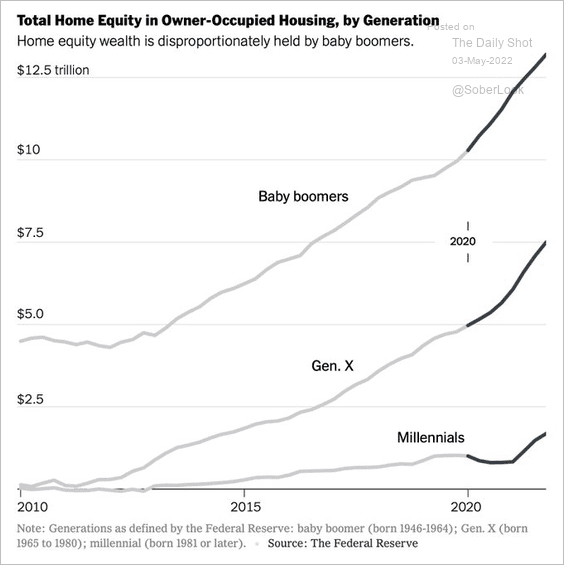 Source: @jessefelder; The NY Times Read full article
• Residential construction spending continues to outpace private nonresidential activity.
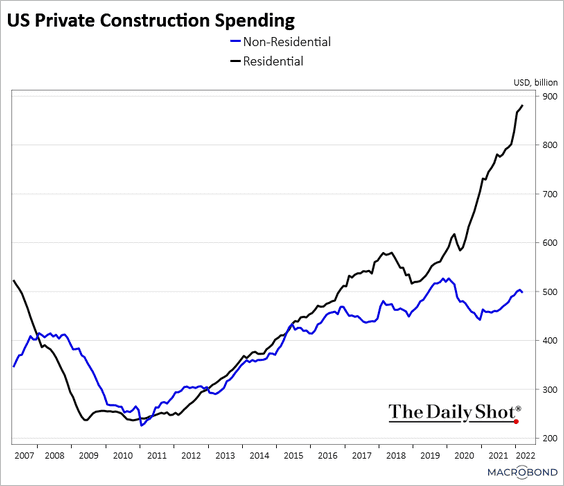 Source: Chart and data provided by Macrobond
——————–
6. Airport traffic remains strong.
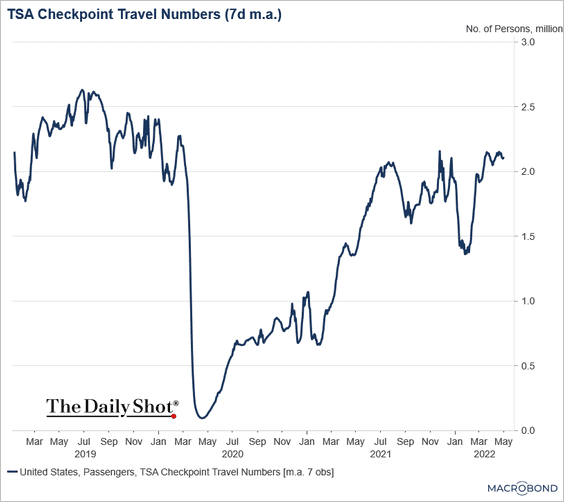 Source: Chart and data provided by Macrobond
7. Projections for Fed rate hikes currently rival the most aggressive rate hiking cycles that we have experienced since the 1990s. But at what rate will the Fed stop?
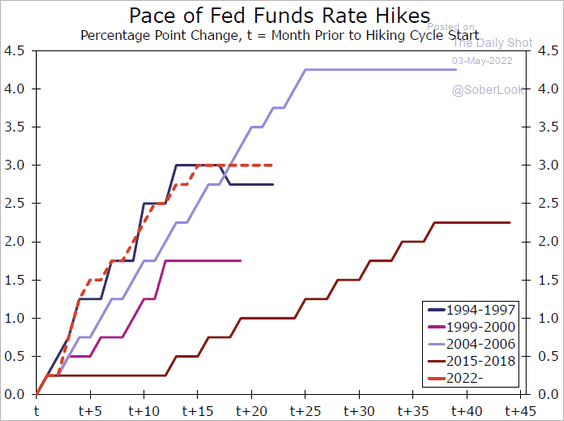 Source: Wells Fargo Securities
• Here is a survey from Evercore ISI.
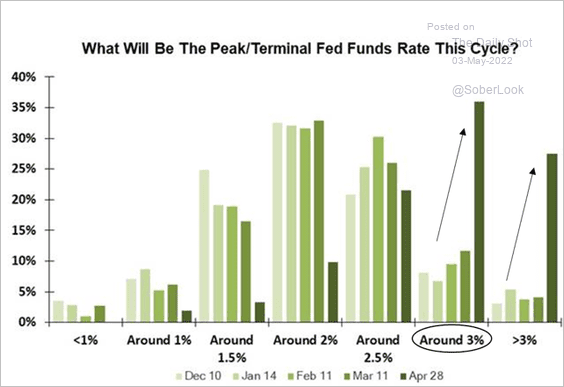 Source: Evercore ISI Research
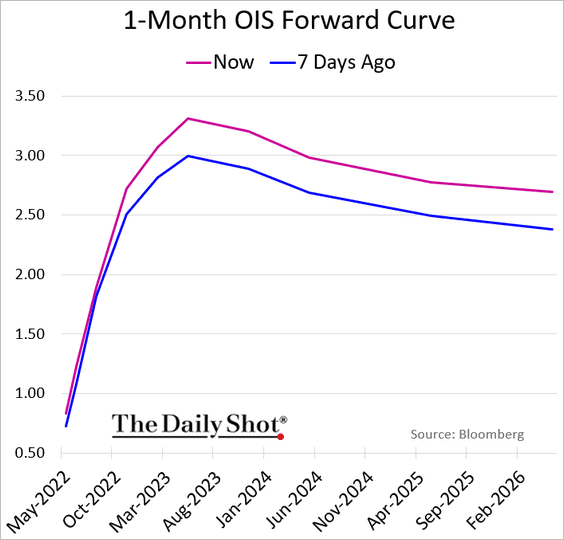
• The market now sees the “terminal” fed funds rate above 3.3%.
——————–
8. The 10-year Treasury yield hit 3% on Monday.
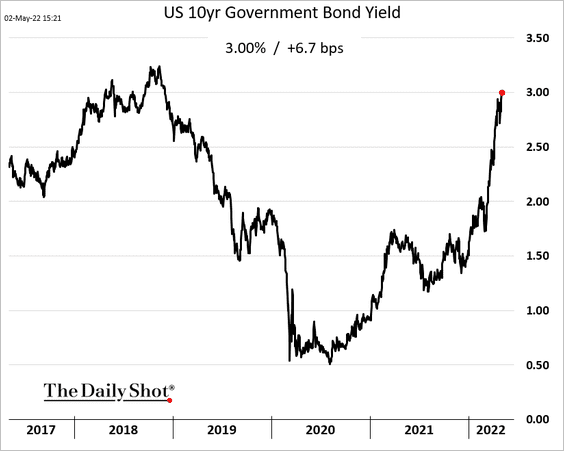
Back to Index
Canada
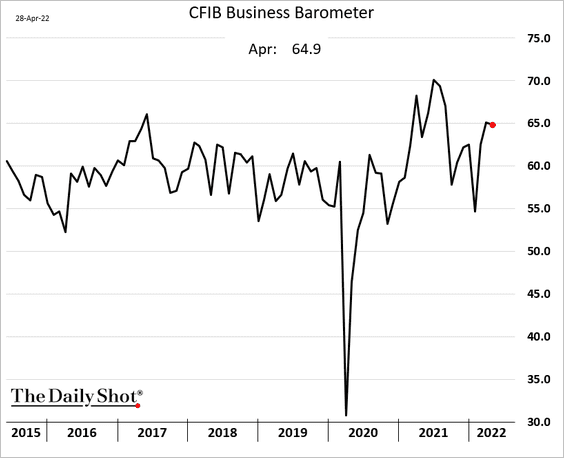
1. The CFIB index of mid/small-size businesses held up well last month.
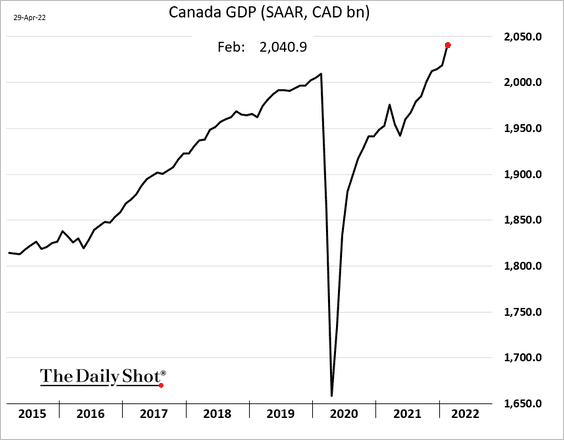
2. Economic growth was robust in February.
3. The manufacturing PMI moved lower in April.
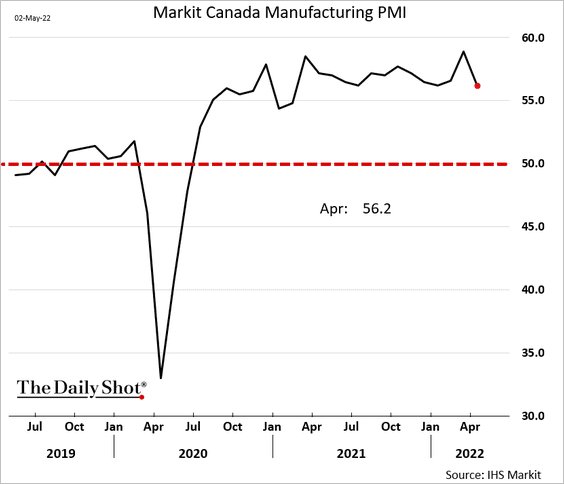
 Source: Reuters Read full article
Back to Index
The United Kingdom
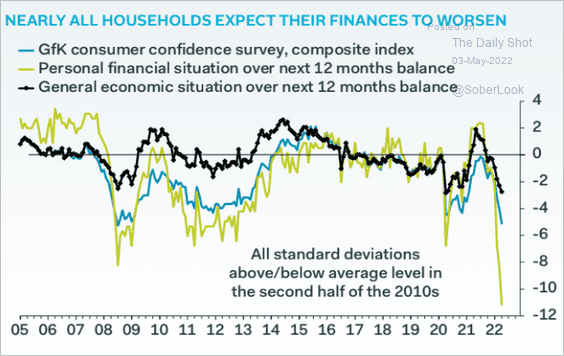
1. Home prices appreciation pulled back from the highs in April.
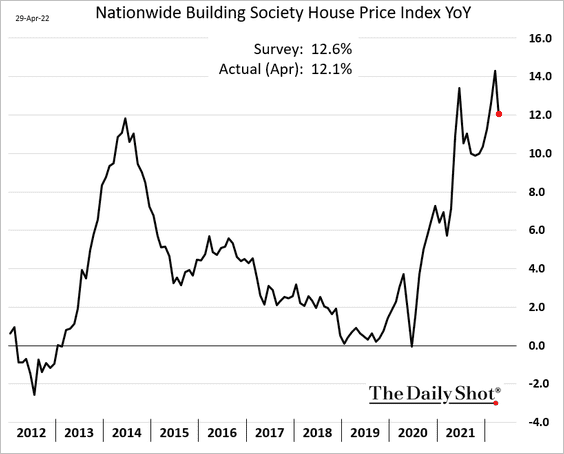
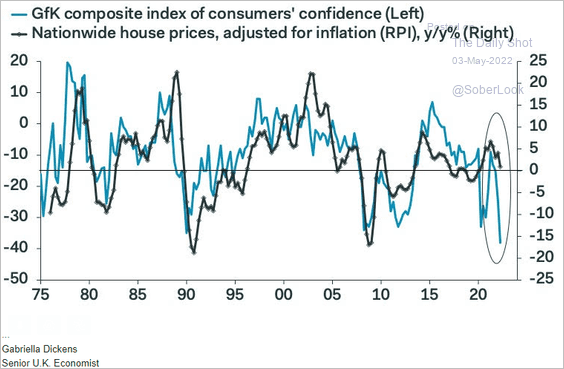
Weak consumer confidence will be a drag on housing going forward.
 Source: Pantheon Macroeconomics
 Source: Pantheon Macroeconomics
——————–
2. Out-of-pocket healthcare spending has been rising.
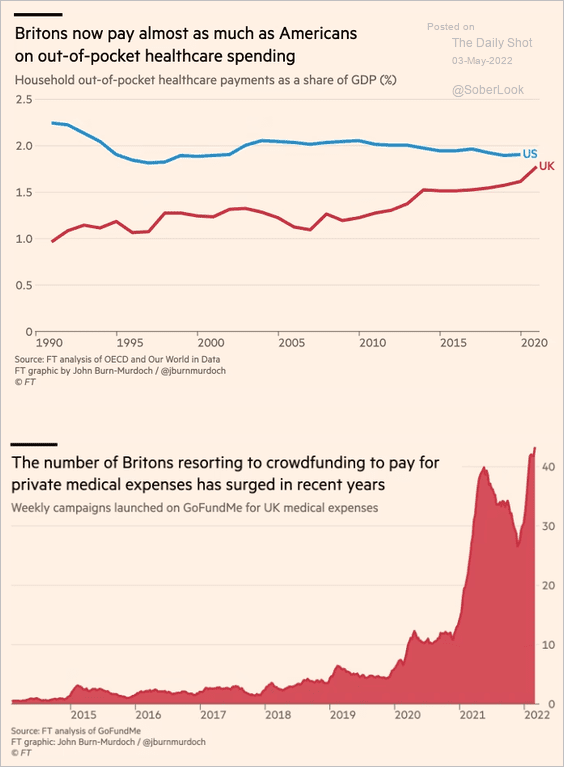 Source: @financialtimes Read full article
Back to Index
The Eurozone
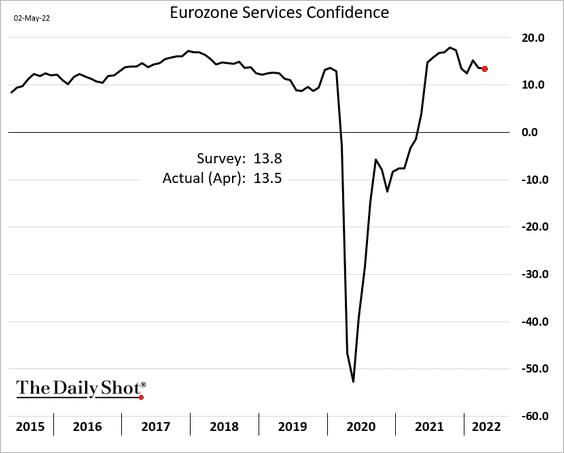
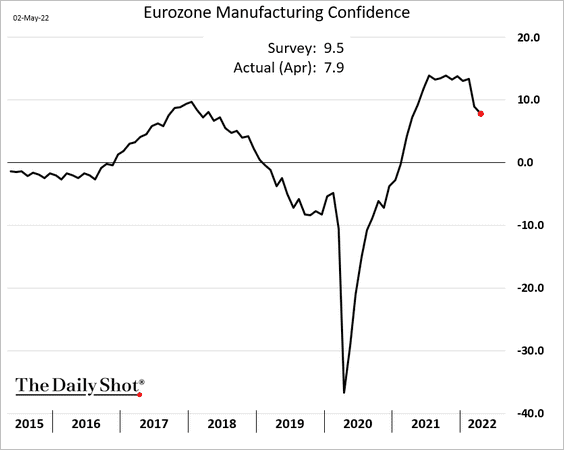
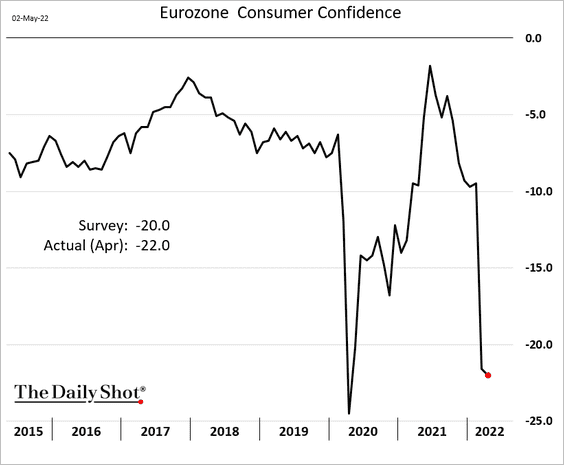
1. Confidence indicators moved lower last month, with consumer sentiment remaining under pressure.
• Services (still resilient):
• Manufacturing:
• Consumer:
——————–
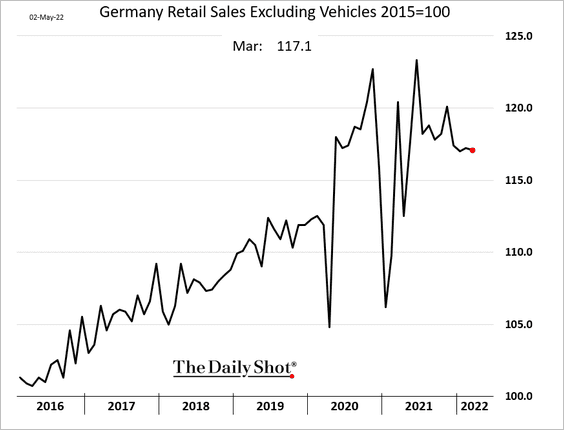
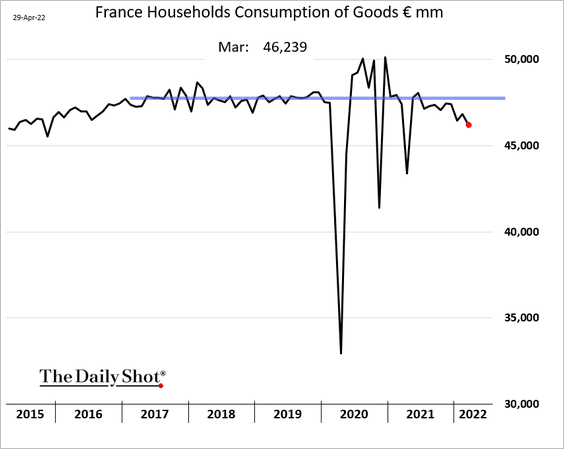
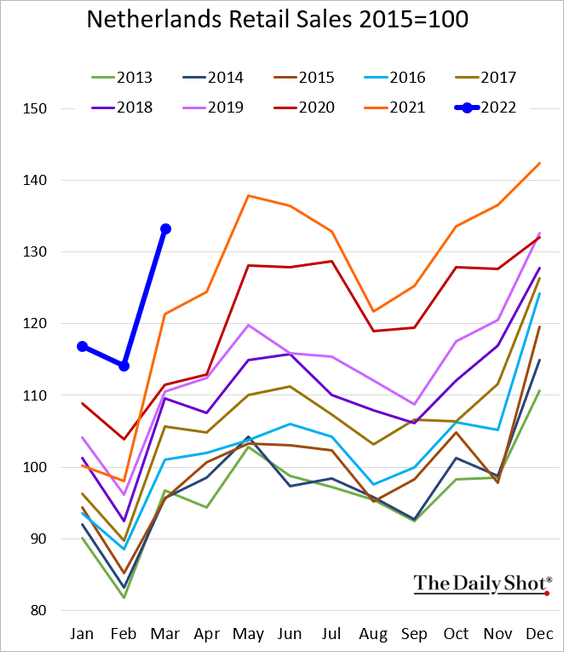
2. Retail sales were mixed in March:
• Germany:
• France (deteriorating):
• The Netherlands (very strong):
——————–
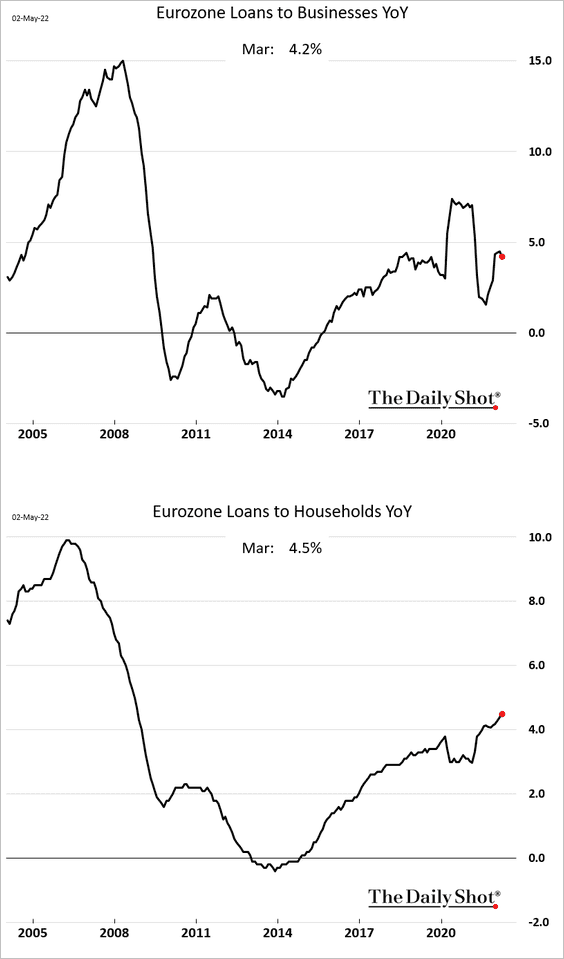
3. The broad money supply growth has been moderating.
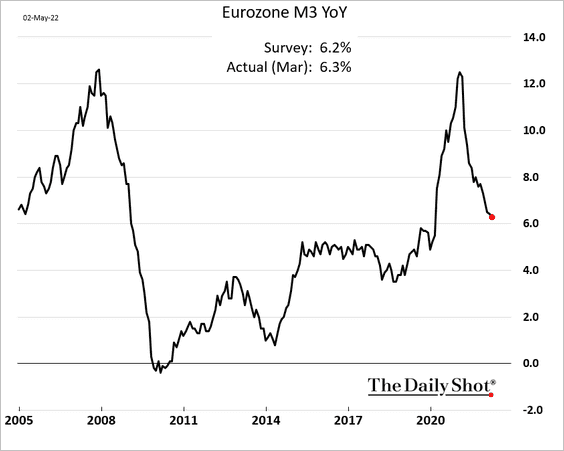
Loan growth was mixed in March, with business loans edging lower but household credit continuing to expand faster.
——————–
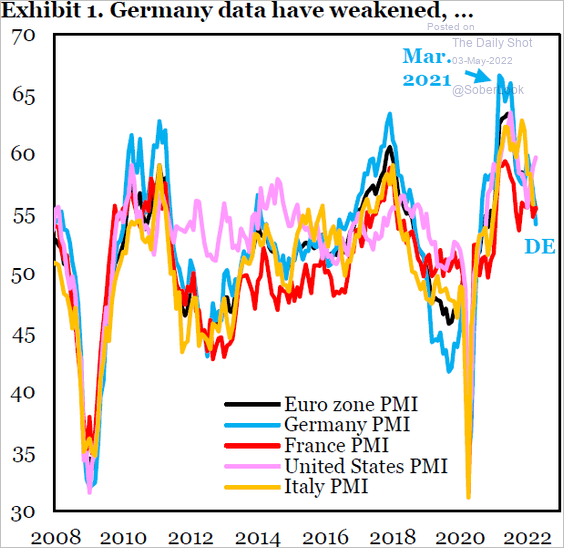
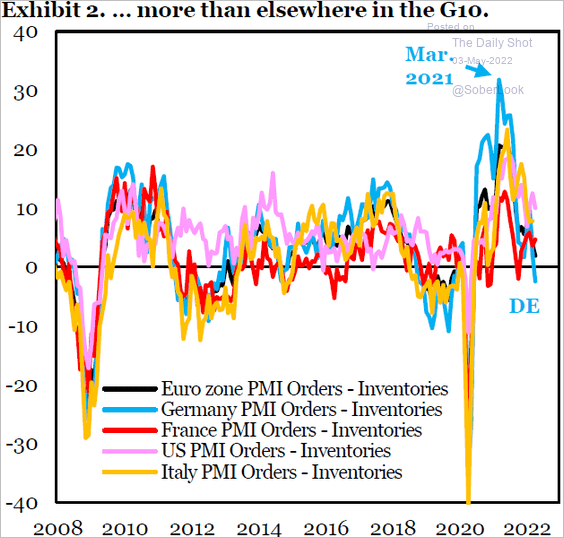
4. PMIs and PMI orders less Inventories point to an increased probability of a recession later this year (two charts).
 Source: IIF
 Source: IIF
Here is the PMI output index at the Eurozone level (growth has stalled).
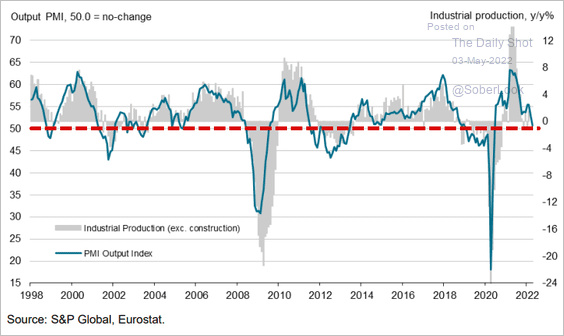 Source: IHS Markit
——————–
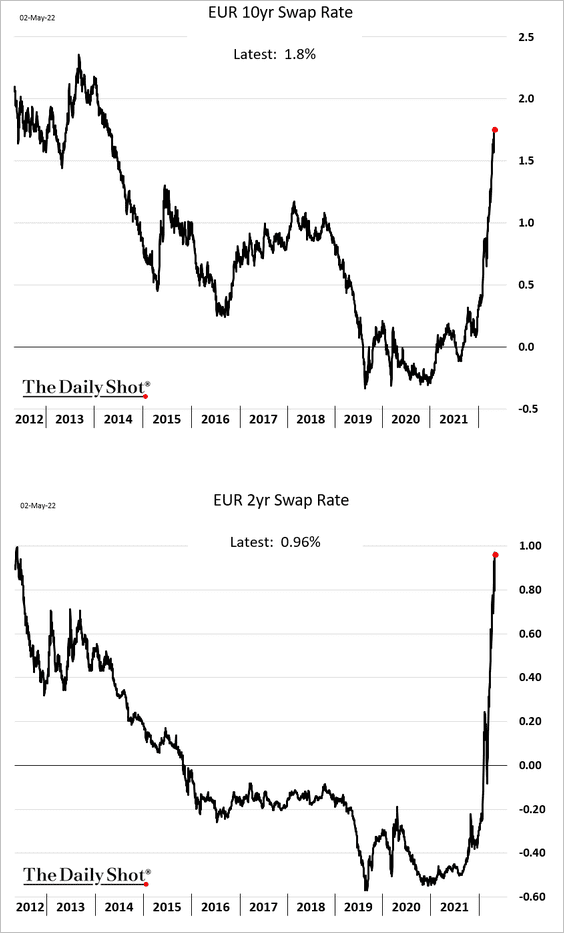
5. Market rates continue to climb.
6. Are euro-area earnings estimates too optimistic?
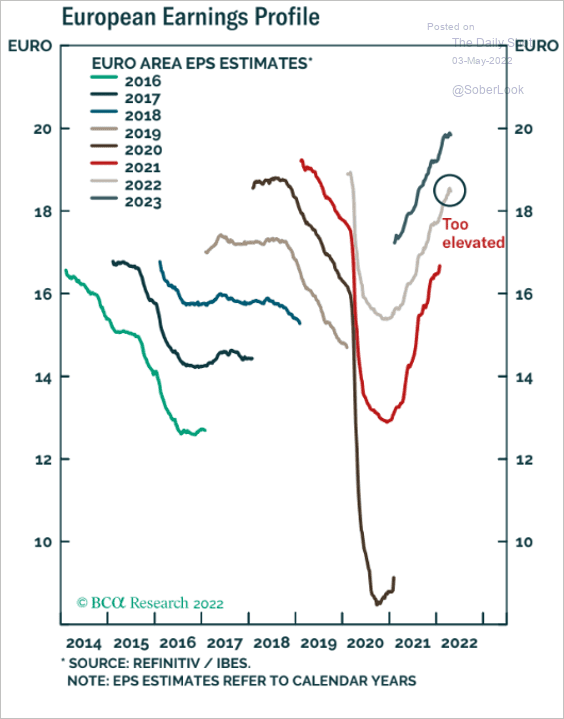 Source: BCA Research
Margin pressures are a headwind.
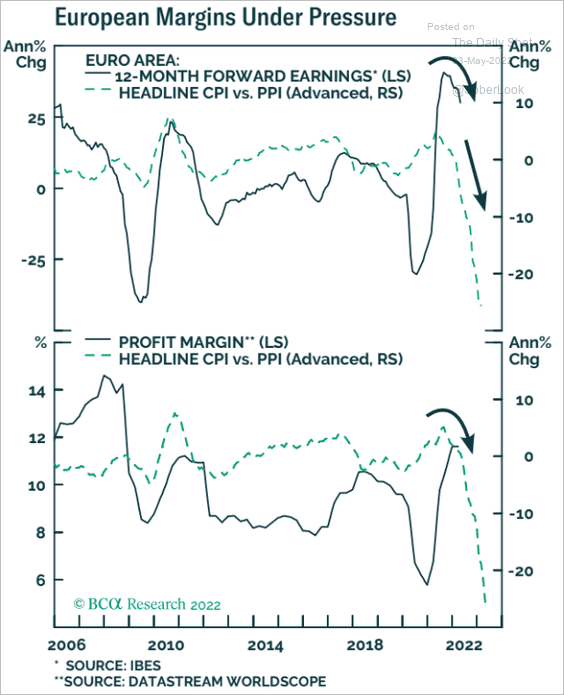 Source: BCA Research
Back to Index
Europe
1. What was that?
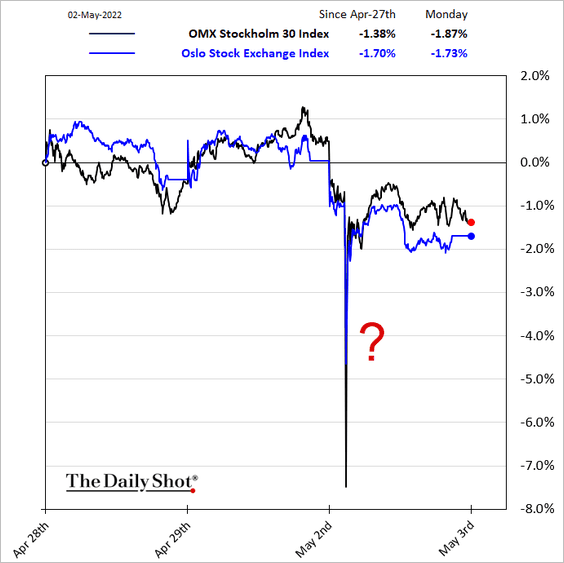
 Source: @WSJ Read full article
——————–
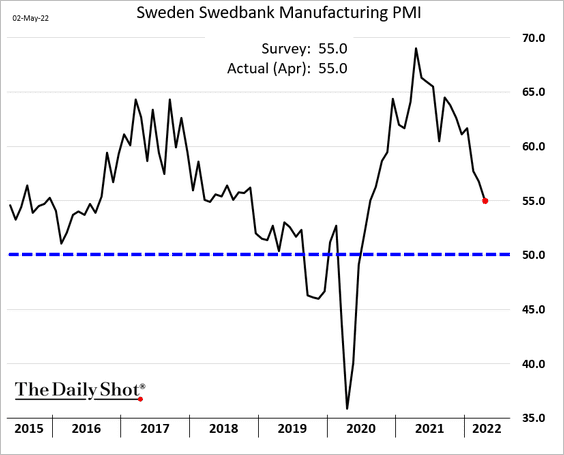
2. Sweden’s business activity is moderating.
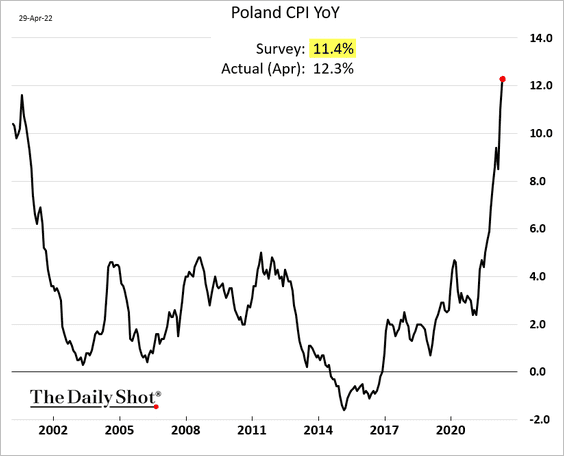
3. Poland’s inflation climbed past 12%.
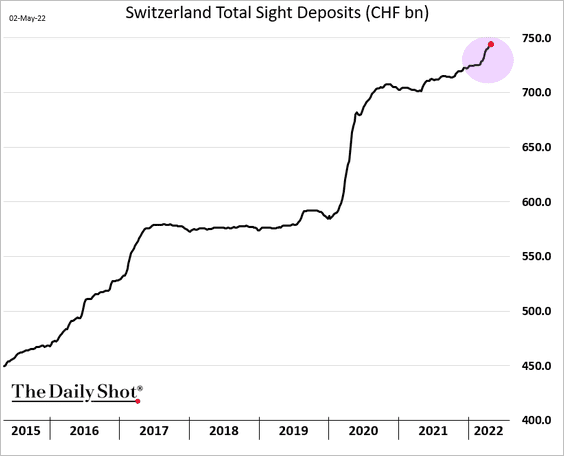
4. The Swiss central bank appears to be intervening in the currency markets.
5. A weaker euro is not helping European shares any longer.
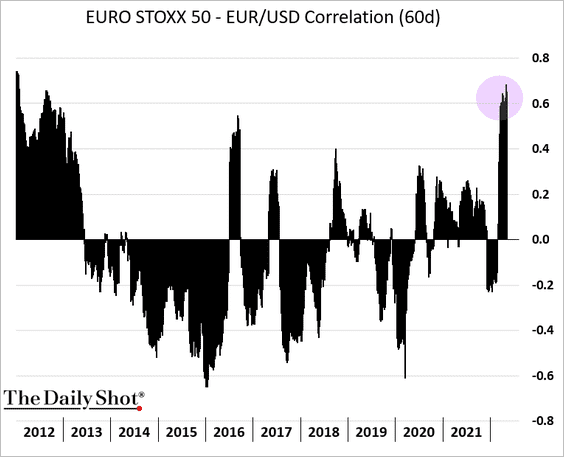 h/t @mikamsika
6. Banks’ relative performance and bond yields continue to move in opposite directions.
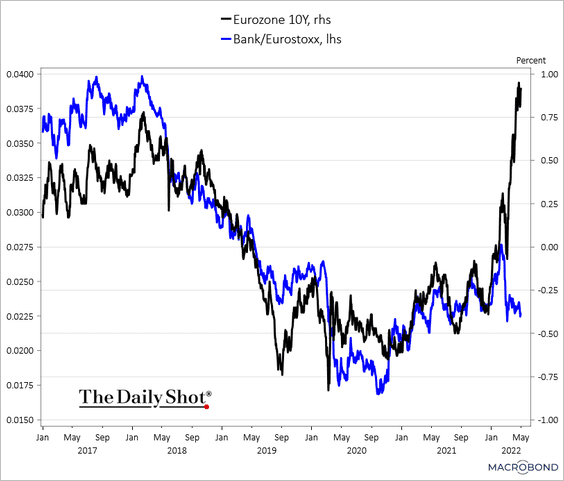 Source: Chart and data provided by Macrobond
Back to Index
Asia – Pacific
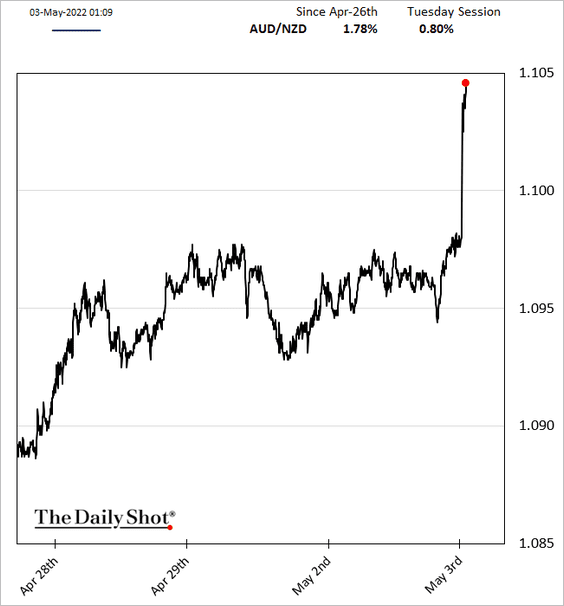
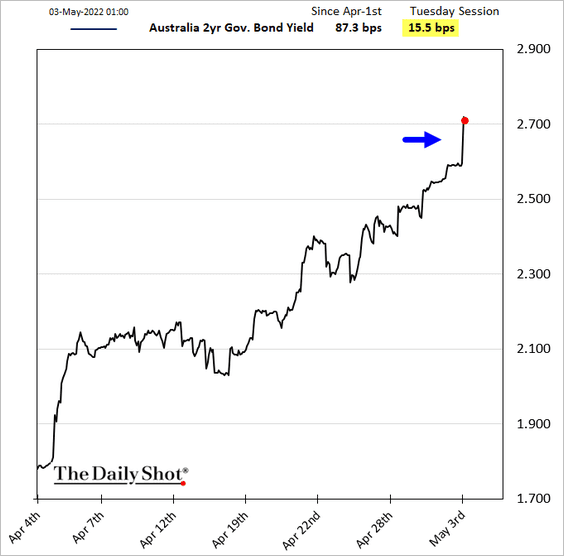
1. We got liftoff in Australia. And the RBA has more where that came from.
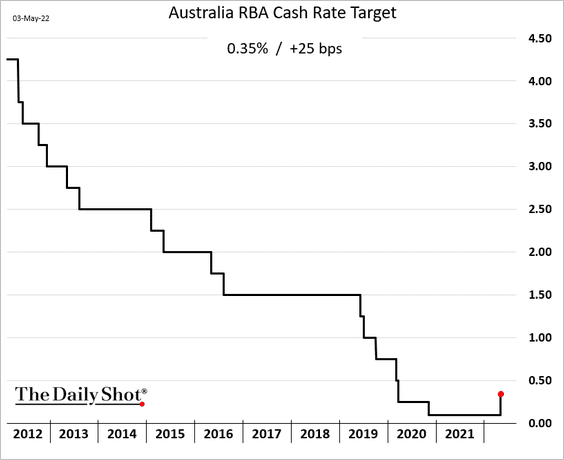
Bond yields and the Aussie dollar jumped.
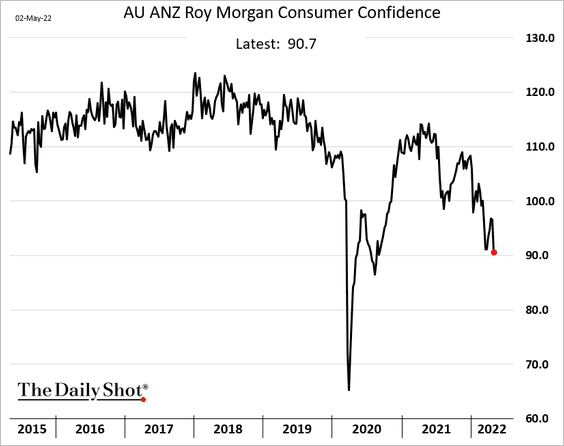
Separately, Australian consumer confidence tumbled to lows not seen since 2020.
——————–
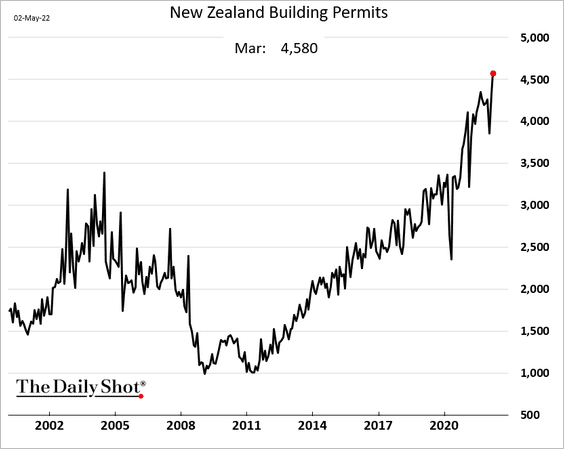
2. New Zealand’s building permits surged in March.
The RBNZ rate is expected to approach 4% over the next 12 months.
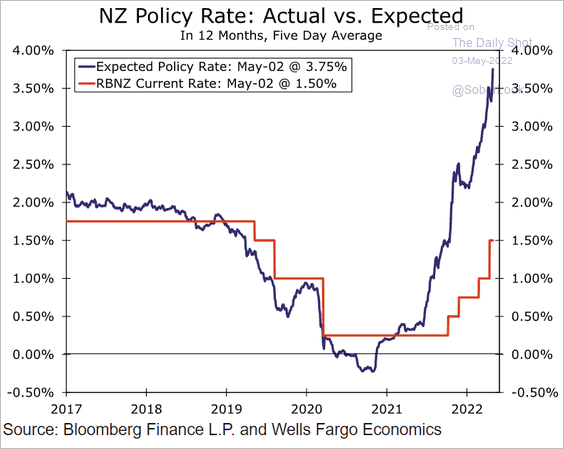 Source: Wells Fargo Securities
——————–
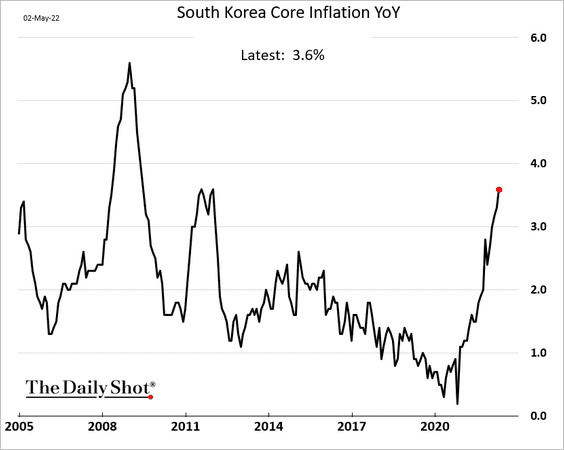
3. South Korea’s inflation continues to climb,
Back to Index
China
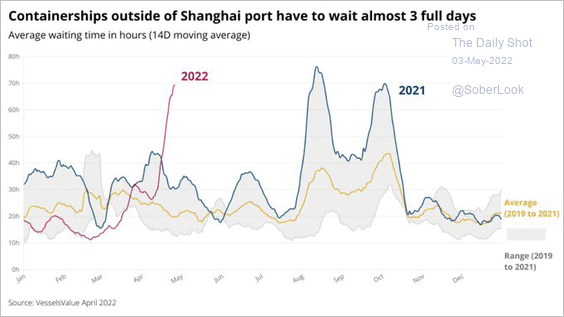
1. The freight logjam remains extreme.
 Source: @Marcomadness2
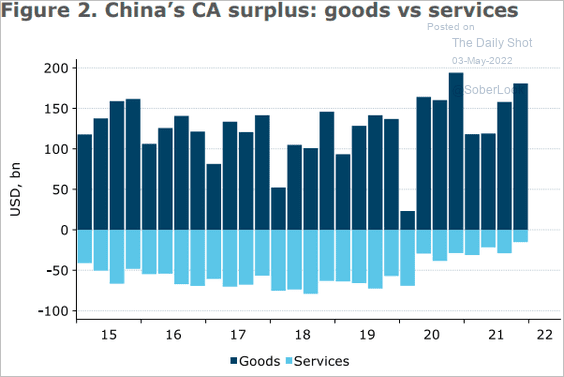
2. China’s current account surplus reflects continued strong goods exports and weak services imports due to depressed levels of Chinese citizens’ travel abroad.
 Source: @ANZ_Research
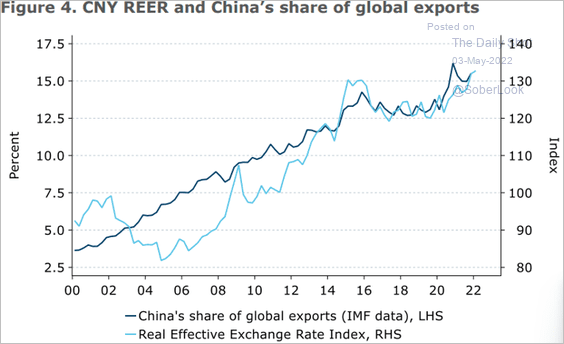
China’s share of global exports has grown to 15%, even with a strengthening CNY Real Effective Exchange Rate (REER).
 Source: @ANZ_Research
Back to Index
Emerging Markets
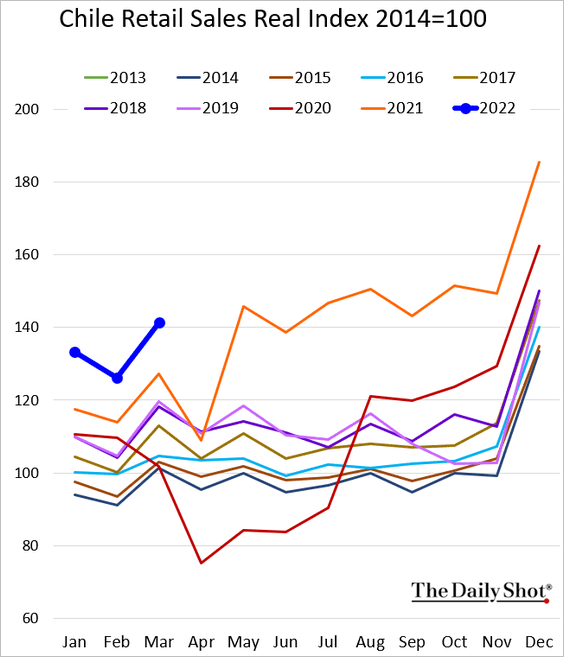
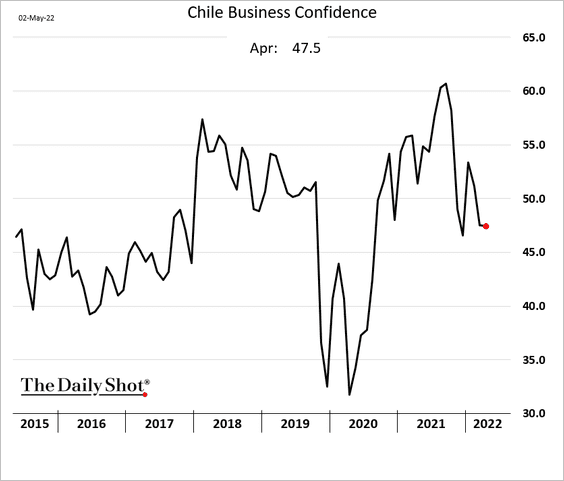
1. Let’s begin with Chile.
• Economic growth surprised to the upside.
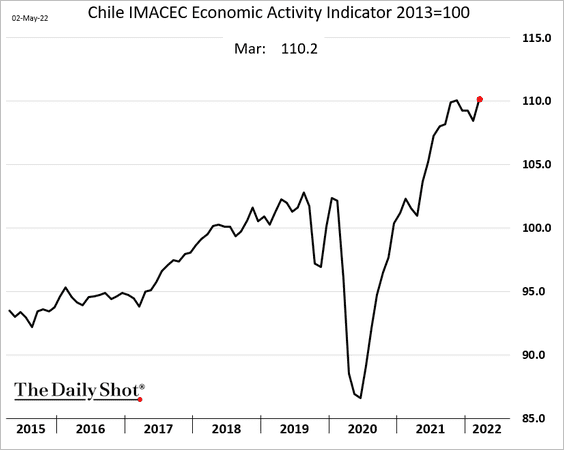
 Source: Reuters Read full article
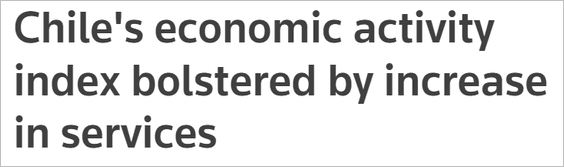
• Manufacturing output is surging.
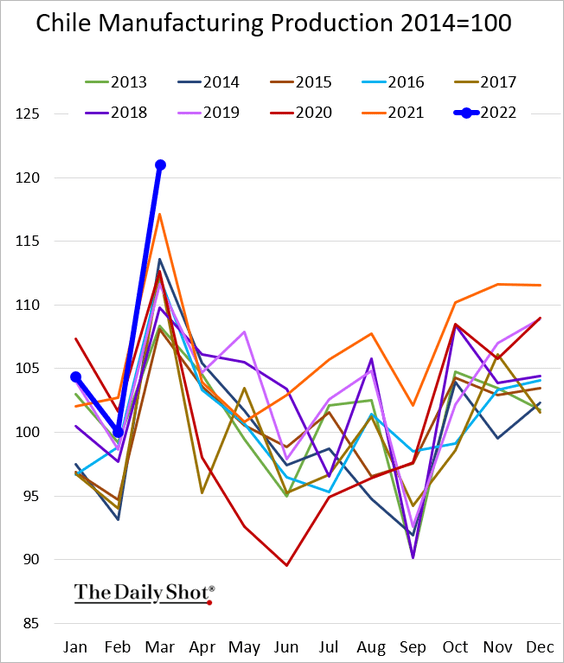
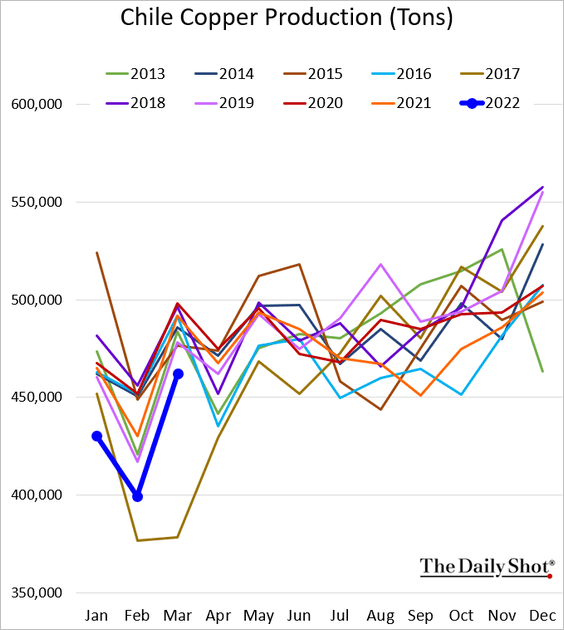
• Copper production (volume) is still relatively soft.
• Retail sales remain robust.
• Business confidence held steady last month.
——————–
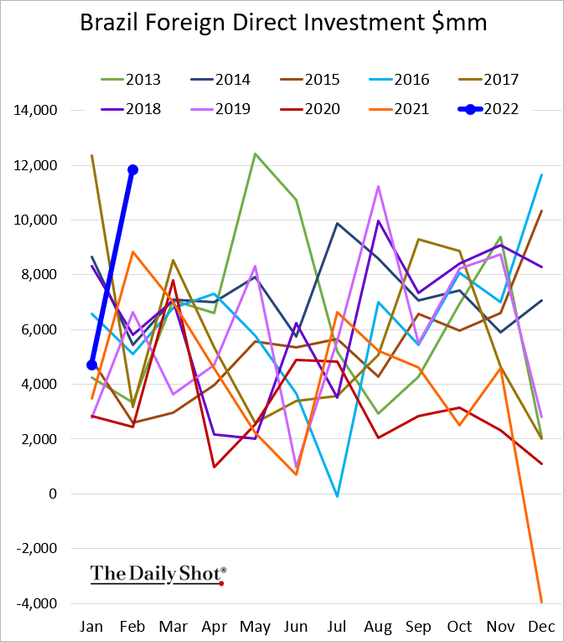
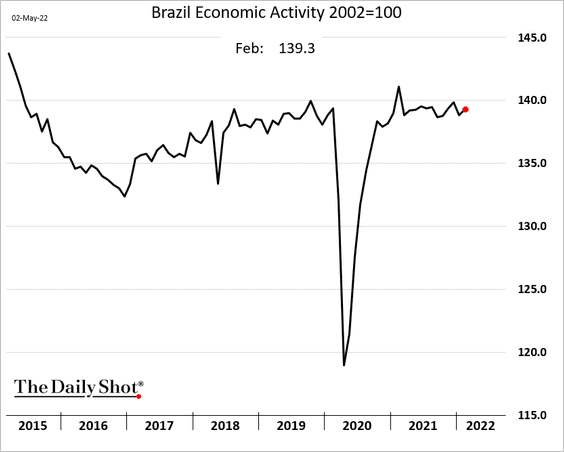
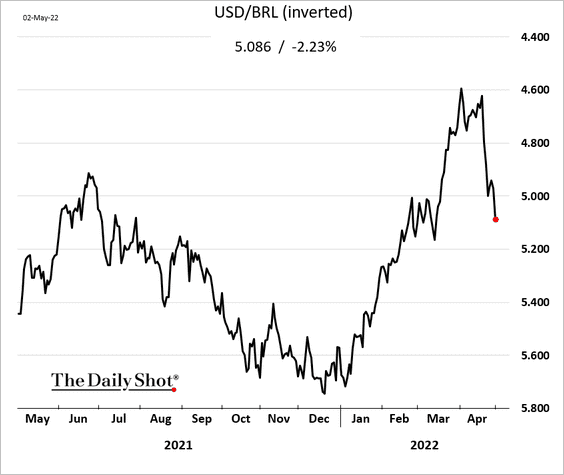
2. Next, we have some updates on Brazil.
• FDI (very strong in Feb):
• Economic activity:
• April manufacturing PMI (steady):
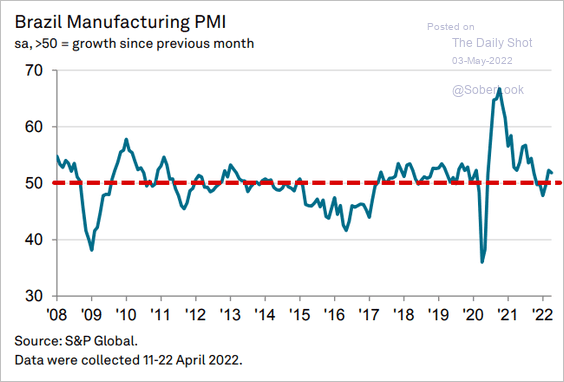 Source: IHS Markit
• The real (under pressure):
——————–
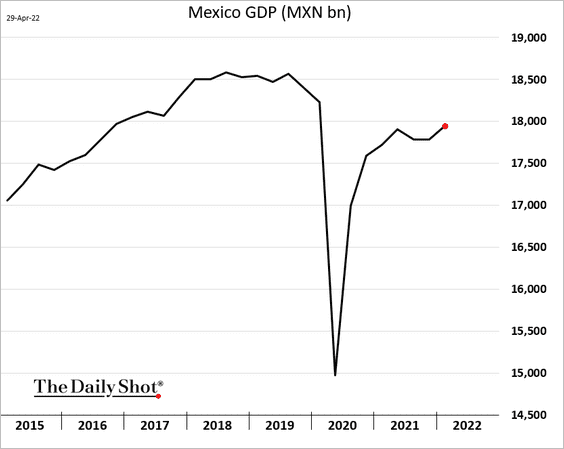
3. Mexican GDP improved in Q1.
Manufacturing activity remains lackluster.
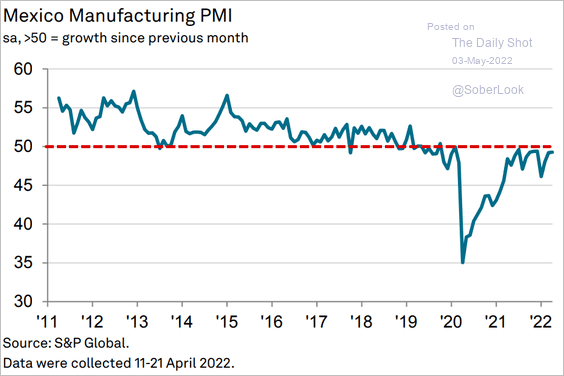 Source: IHS Markit
——————–
4. How sensitive are Asian inflation rates to currency depreciation?
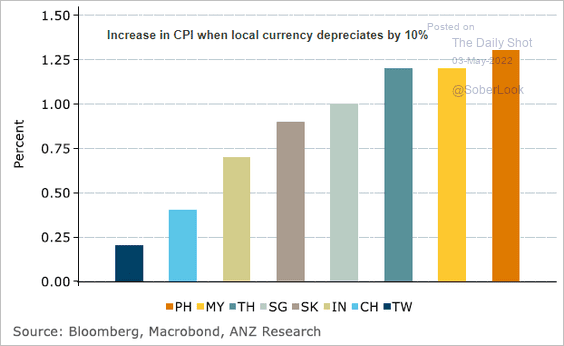 Source: @ANZ_Research
Back to Index
Energy
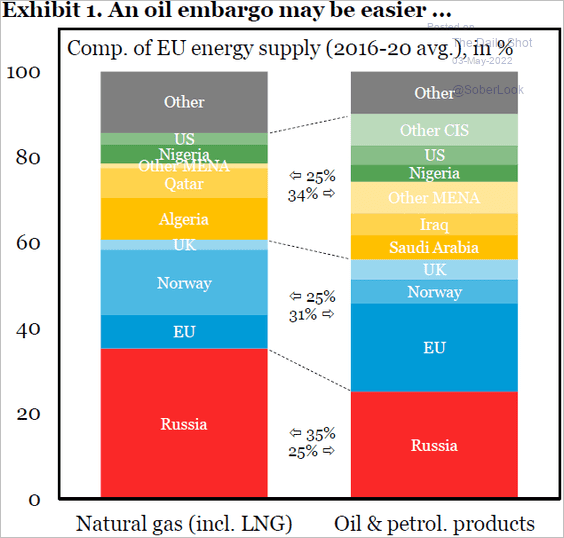
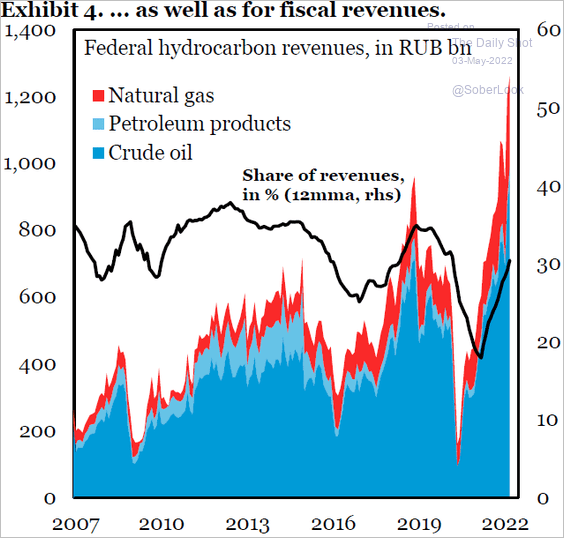
1. The EU is getting ready to ban Russian oil.
 Source: Reuters Read full article
 Source: IIF
• Oil is very important for Russia’s economy.
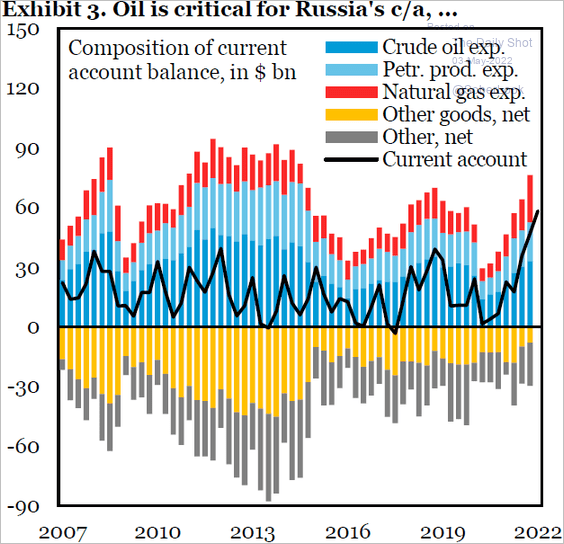 Source: IIF
 Source: IIF
• Profits from refining Russian oil have surged.
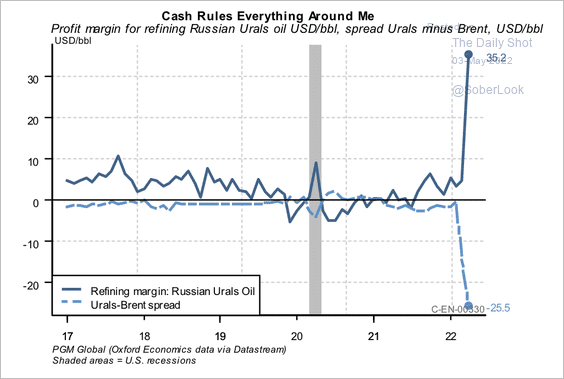 Source: PGM Global
• By the way, who are the largest importers of fossil fuels from Russia?
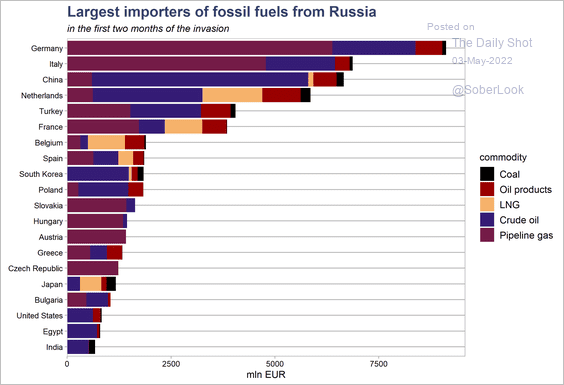 Source: @CREACleanAir
——————–
2. The US 12-month Oil Fund ETF (USL), which includes futures with expiries later in 2022 and 2023 has outperformed the US Oil Fund ETF (USO), which is more heavily weighted toward near-term futures contracts.
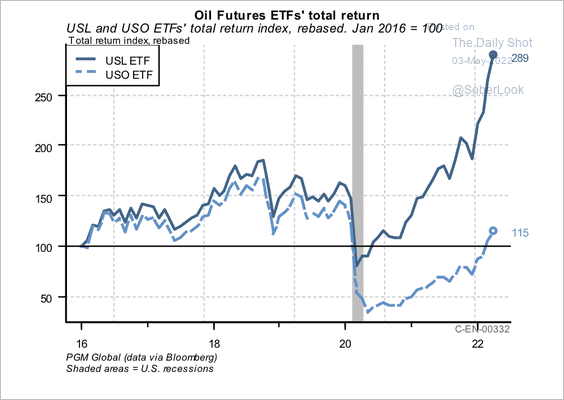 Source: PGM Global
3. US retial diesel prices hit a new high.
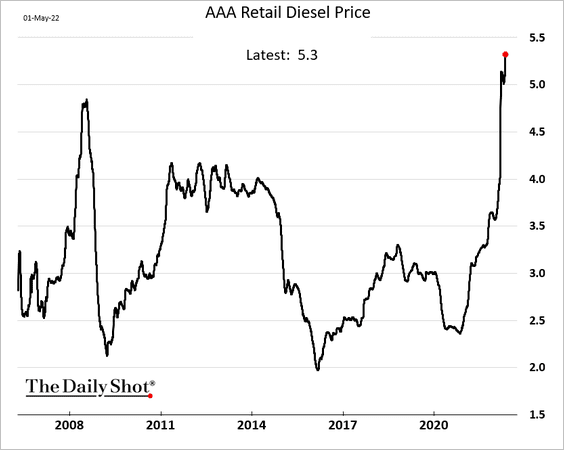 h/t Chunzi Xu
Back to Index
Equities
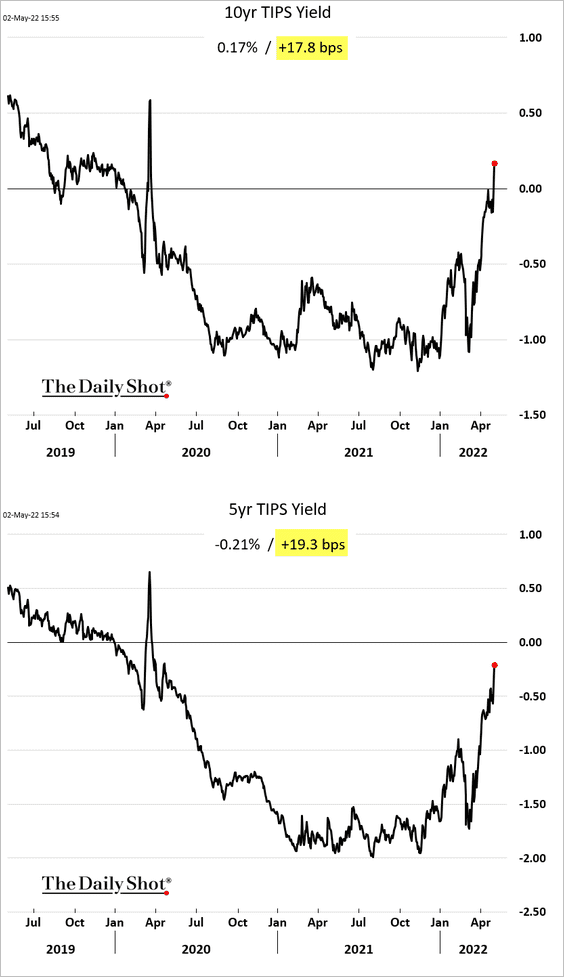
1. Real rates remain a headwind for growth stocks as the 10-year TIPS yield moves into positive territory for the first time since early 2020.
2. The S&P 500 P/E ratio is at 17.5x (below pre-COVID levels).
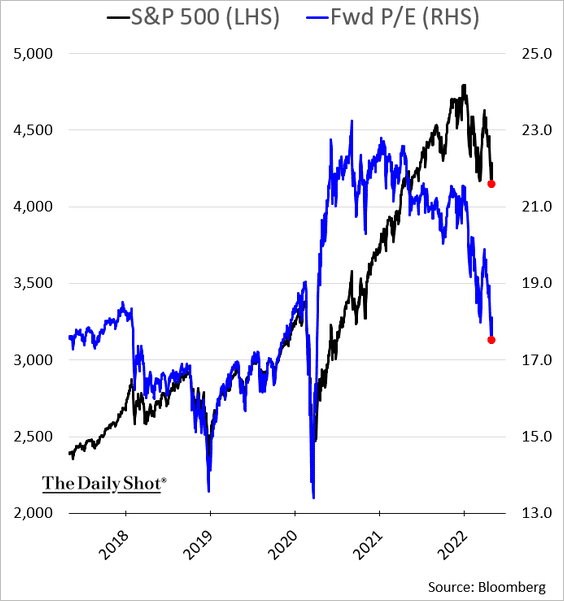
Even after the selloff, the mega-cap valuations look rich.
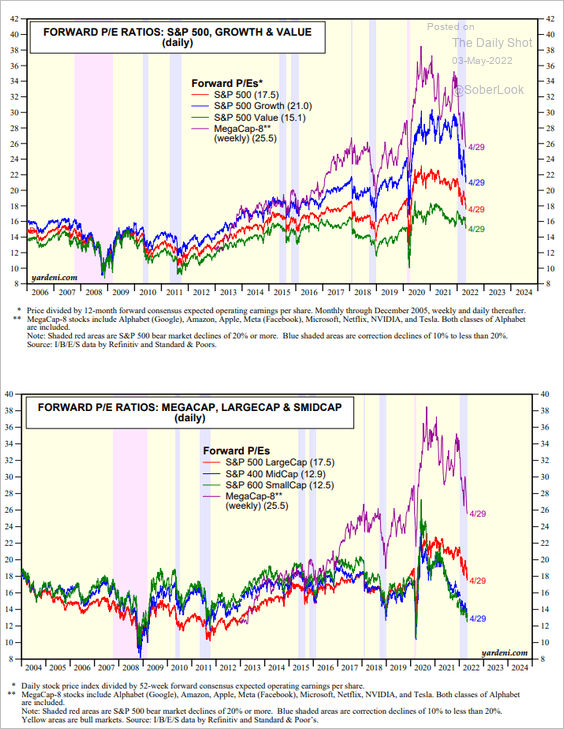 Source: Yardeni Research
——————–
3. Corporate sentiment points to weakness ahead for earnings growth.
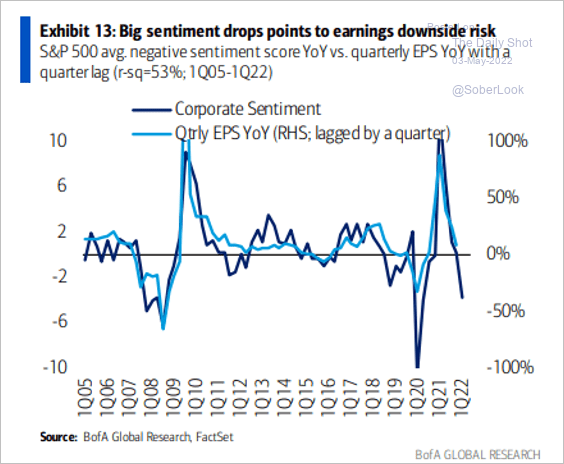 Source: BofA Global Research
• Are earnings estimates too optimistic?
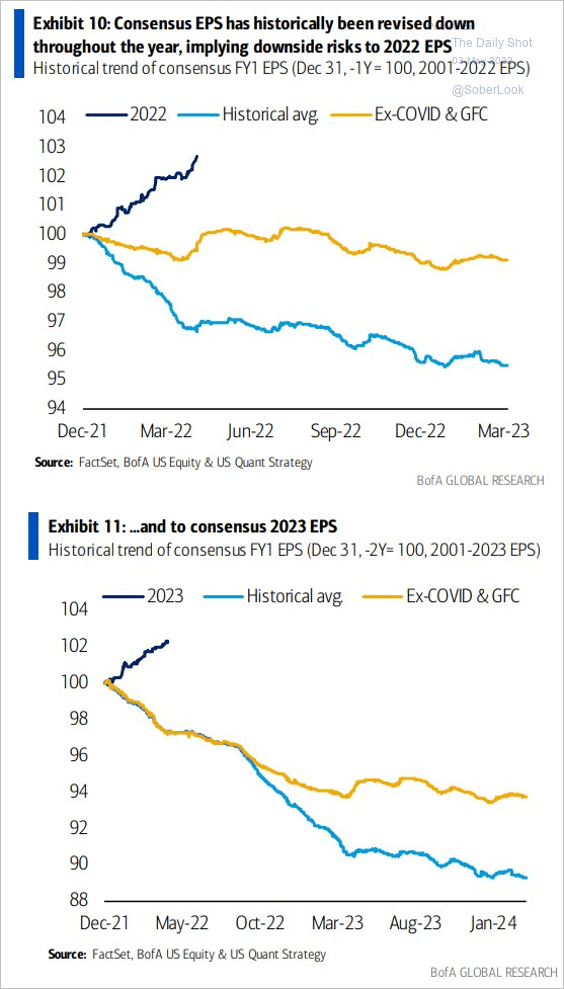 Source: BofA Global Research
• This chart shows Nasdaq 100 earnings as a share of the S&P 500 earnings.
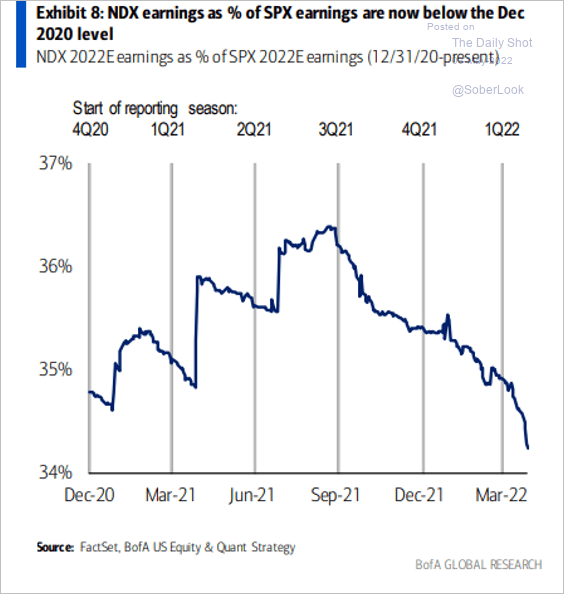 Source: BofA Global Research
——————–
4. Equity funds led ETF outflows in April, ending a record-setting 34-month streak of inflows.
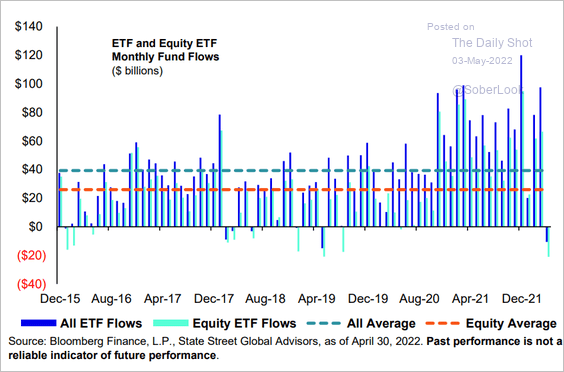 Source: SPDR Americas Research, @mattbartolini
5. Inverse ETF trading activity has been surging.
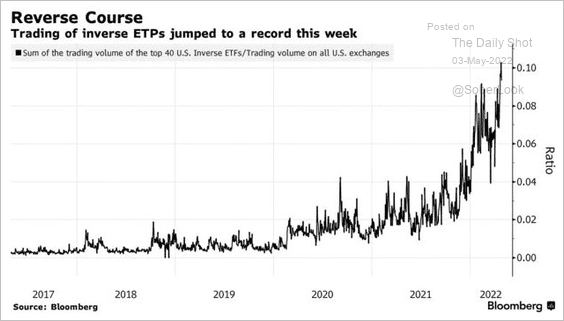 Source: @jessefelder, @markets Read full article
6. 2022 has been a rough year for real equity returns.
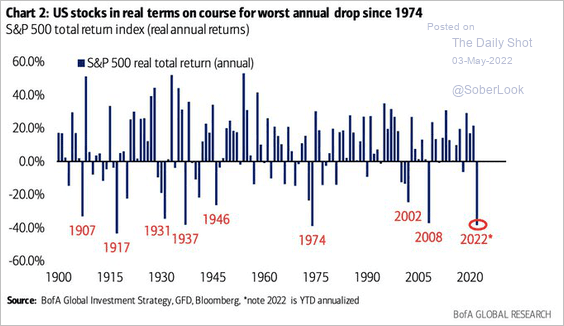 Source: BofA Global Research; @PMack1224
7. This chart shows April large-cap index returns globally.
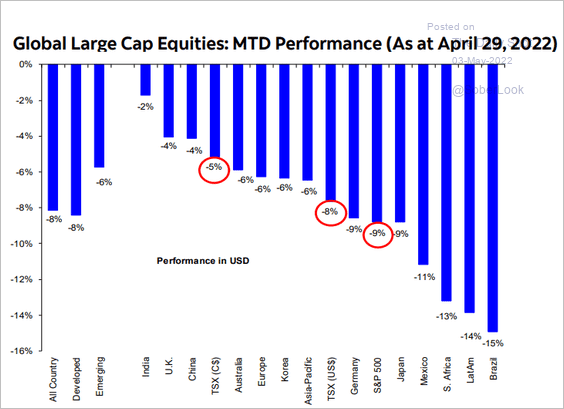 Source: Hugo Ste-Marie, Portfolio & Quantitative Strategy Global Equity Research, Scotia Capital
8. This scatterplot shows monthly equity and bond returns since 1973. Investors are having a tough time trying to diversify in this environment.
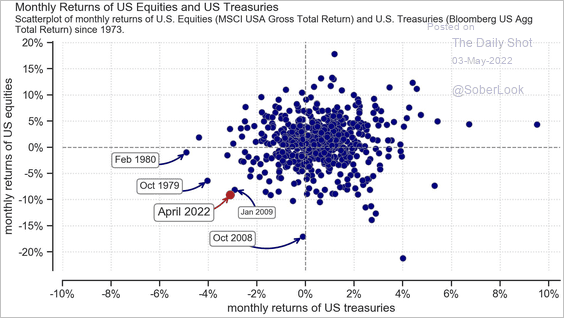 Source: Allianz Global Investors
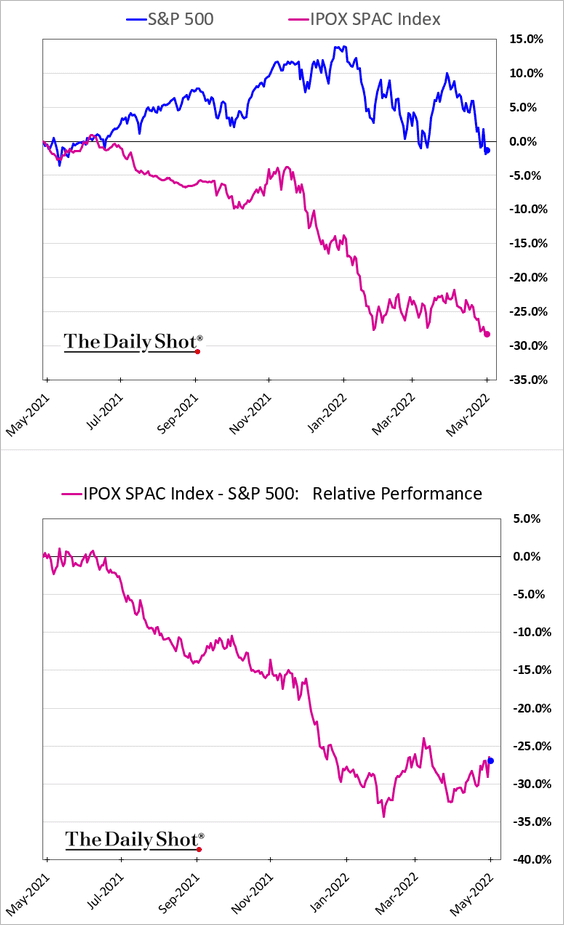
9. Are SPACs stabilizing relative to the broader market?
Back to Index
Credit
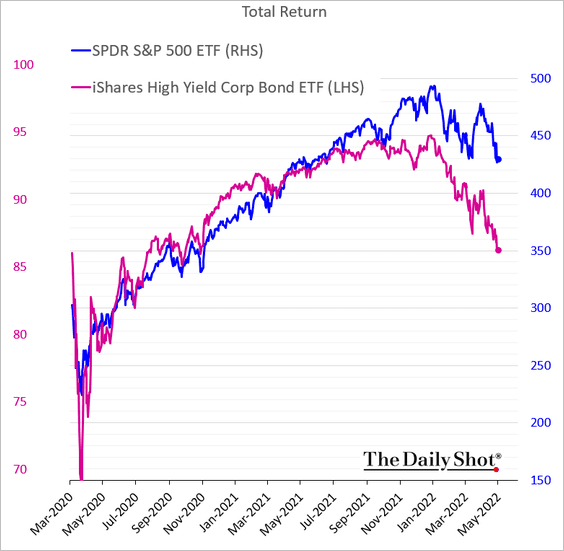
1. High-yield bonds have diverged from equities.
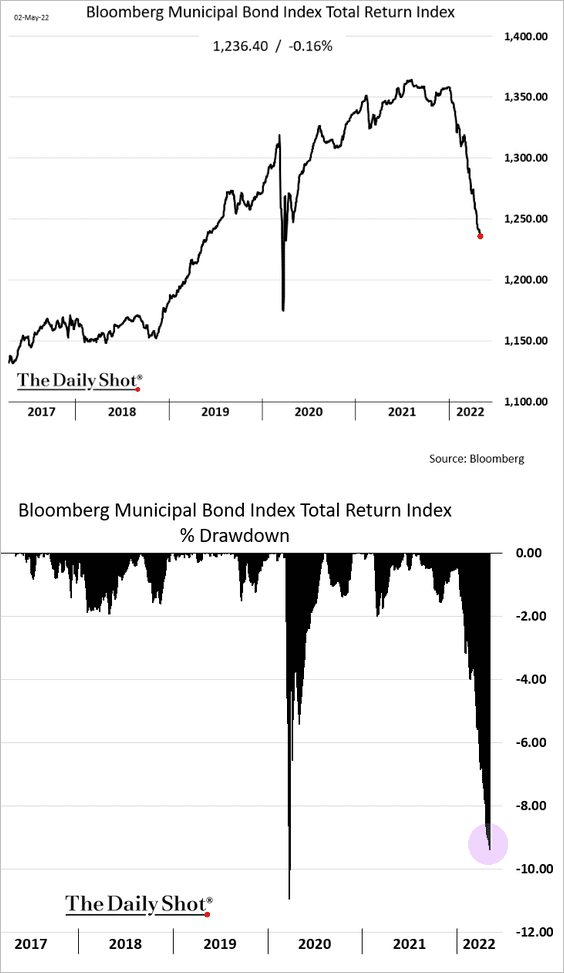
2. The drawdown in munis is approaching the COVID selloff.
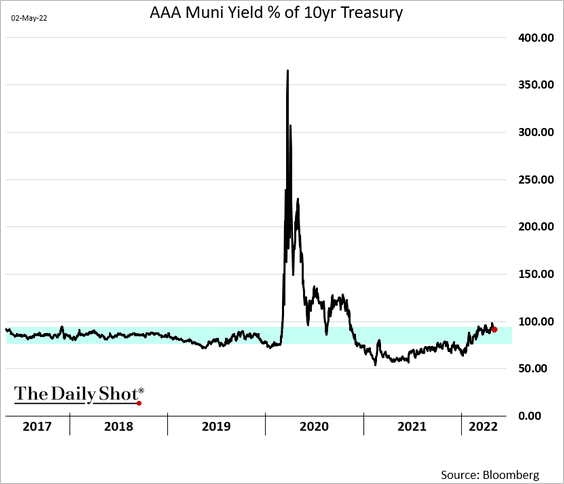
The ratio to Treasury yields is elevated but not extreme.
Back to Index
Global Developments
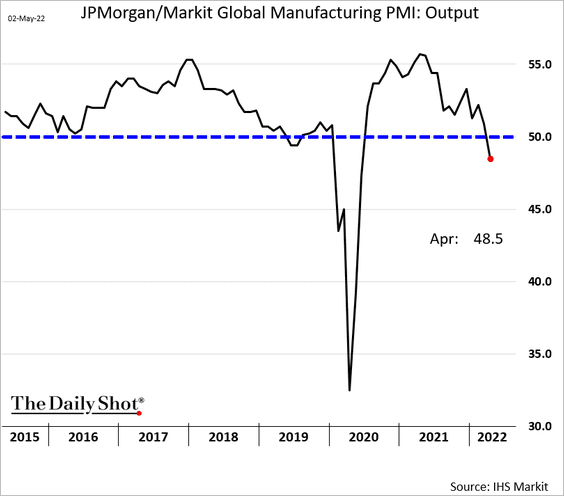
1. Global factory output is contracting.
2. It’s been a long time since bonds had a year like 2022.
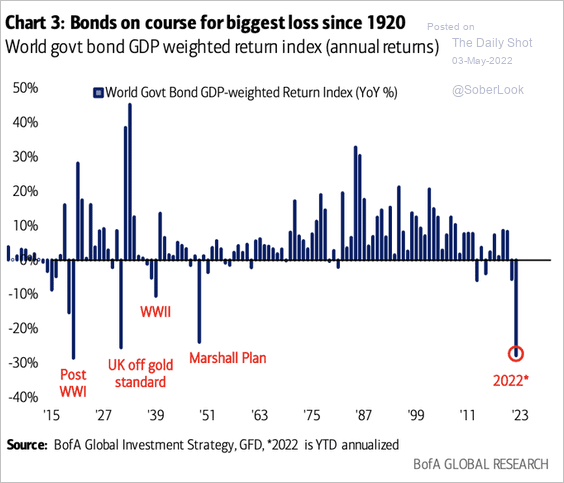 Source: BofA Global Research; @PMack1224
3. This chart shows the year-to-date returns by asset class.
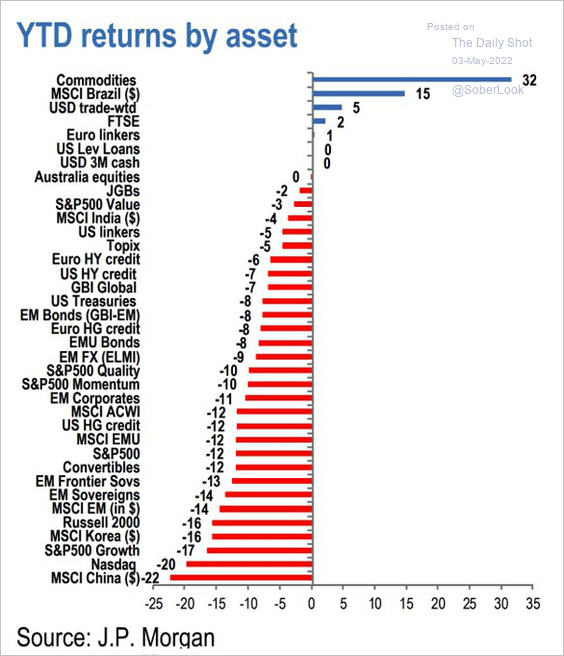 Source: JP Morgan Research; @WallStJesus
——————–
Food for Thought
1. Border security funding:
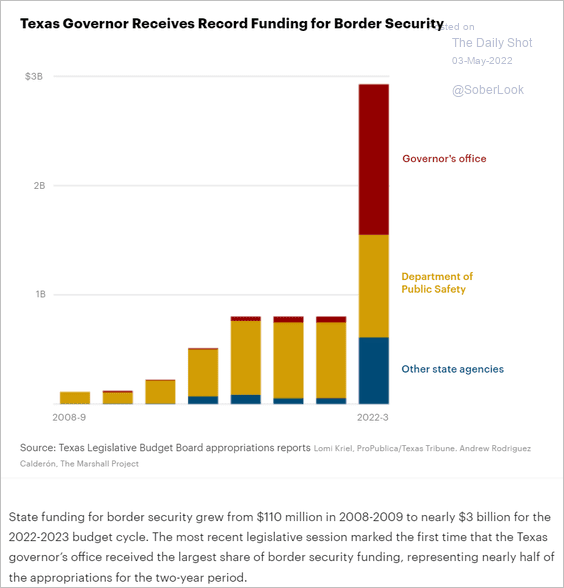 Source: @ProPublica Read full article
2. US solar panel imports:
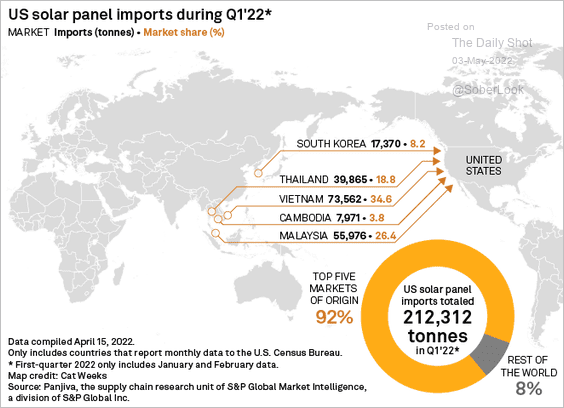 Source: S&P Global Market Intelligence
3. Microgrid installations:
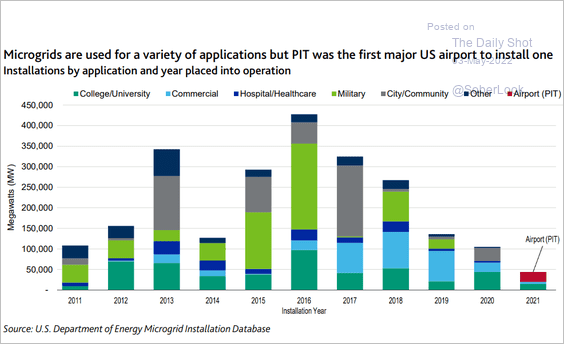 Source: Moody’s Investors Service
4. Russia’s revenue from energy exports:
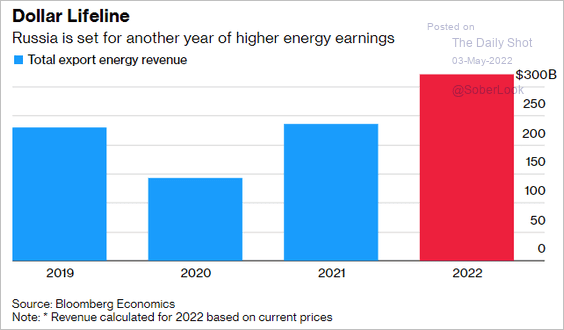 Source: Bloomberg Read full article
5. ElIte universities’ legacy admissions:
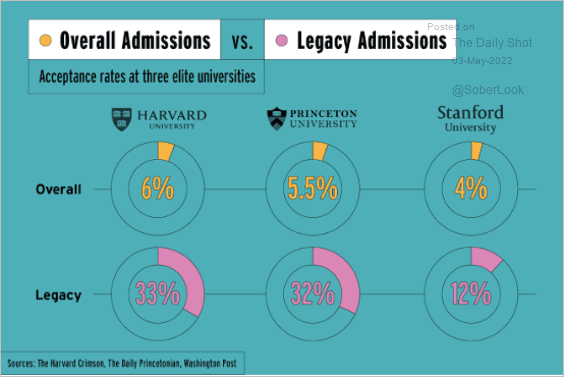 Source: Scott Galloway
6. The Phillips curve in Google search activity:
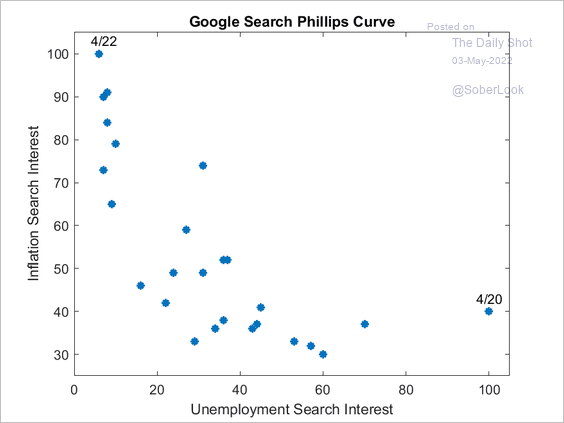 Source: @Bellmanequation
7. Preference for domestic-made goods:
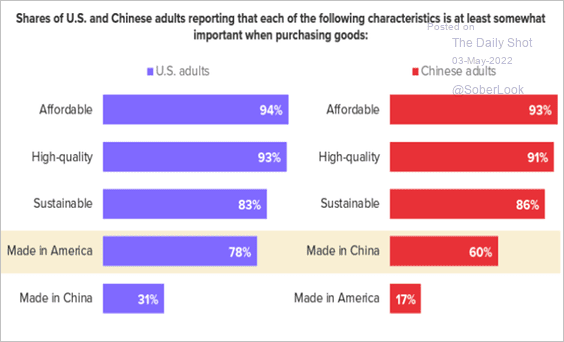 Source: Morning Consult
8. US pleasure boat buying:
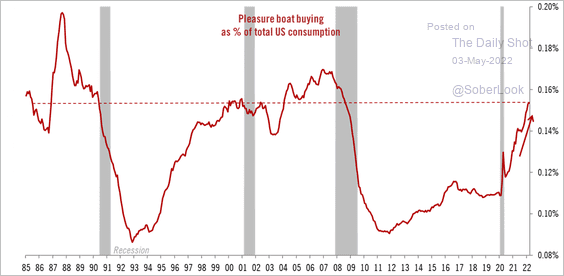 Source: @TCosterg
——————–
Back to Index