
The Daily Shot: 04-May-22
• The United States
• The United Kingdom
• The Eurozone
• Asia – Pacific
• China
• Emerging Markets
• Cryptocurrency
• Commodities
• Energy
• Equities
• Rates
• Food for Thought
The United States
1. The March job openings report topped forecasts as the number of vacancies hits a record high.
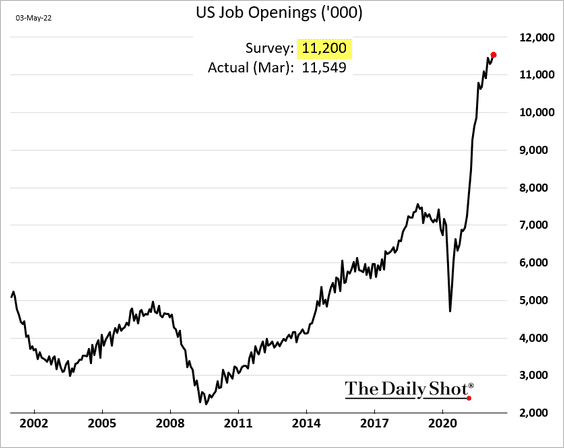
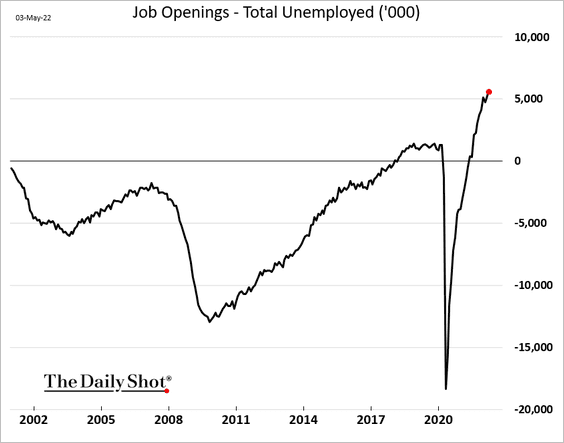
There are now over five million more job openings than unemployed workers. The labor market remains tight, giving the FOMC plenty of room to tighten monetary policy.
We can also see the robust demand for labor in the Evercore ISI’s employment company survey (both permanent and temp placement firms).
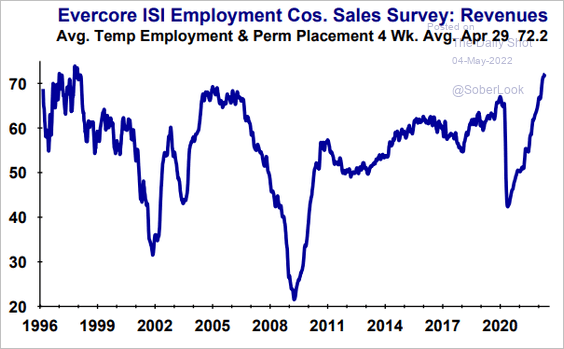 Source: Evercore ISI Research
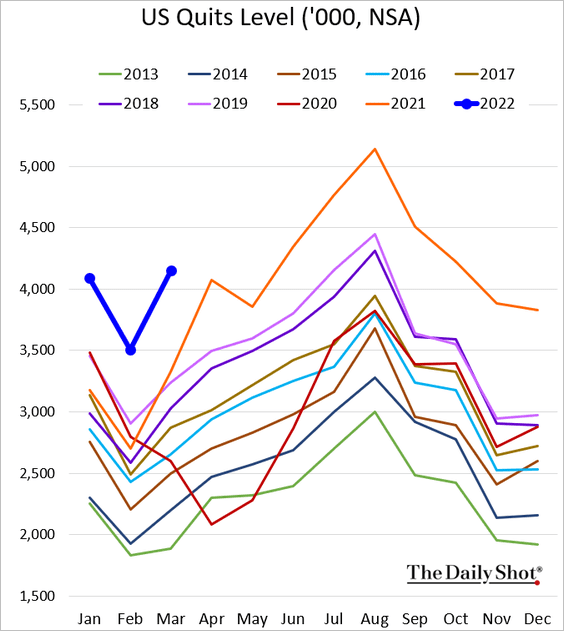
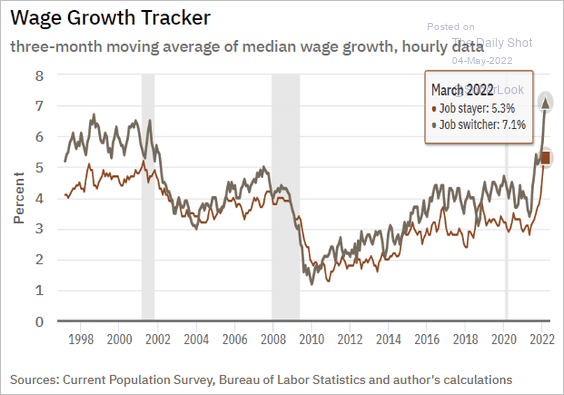
• Voluntary resignations (quits) remain elevated. Job switching has been lucrative (2nd chart).
 Source: @AtlantaFed
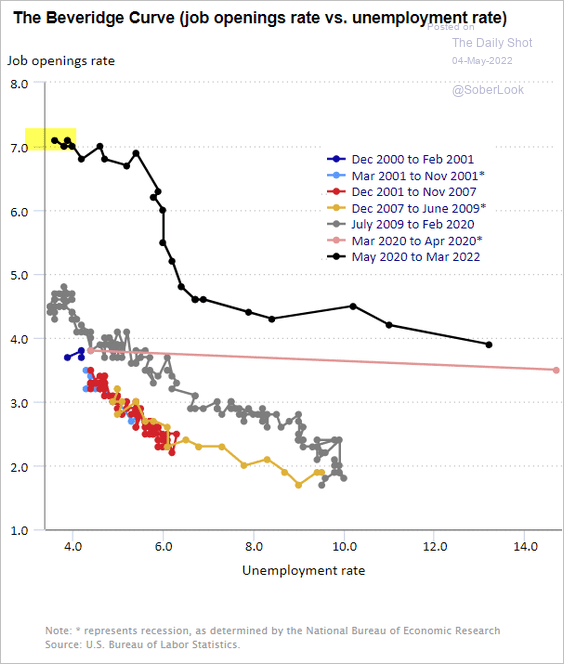
• Here is the Beveridge Curve.
 Source: BLS
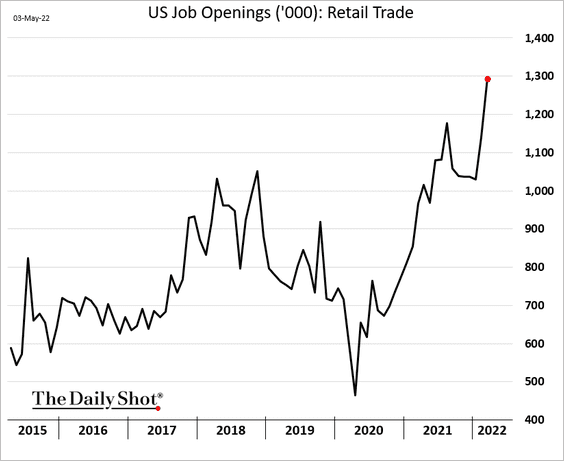
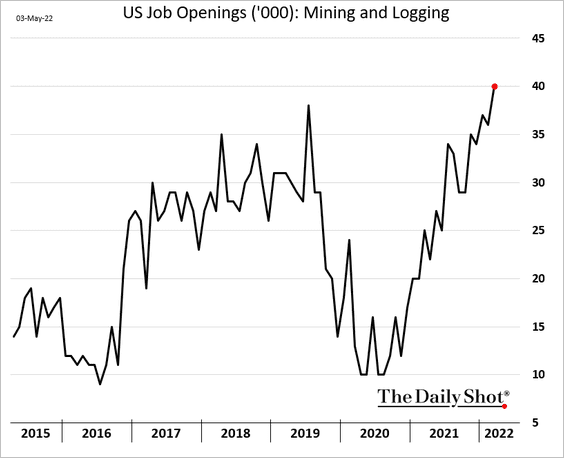
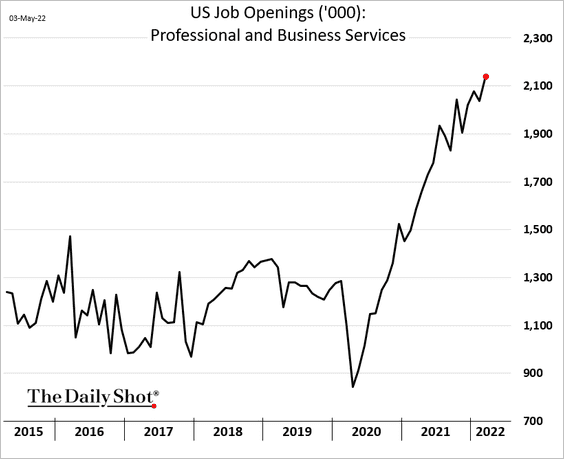
Many sectors saw strong gains in job openings.
– Retail:
– Mining:
– Professional and business services:
——————–
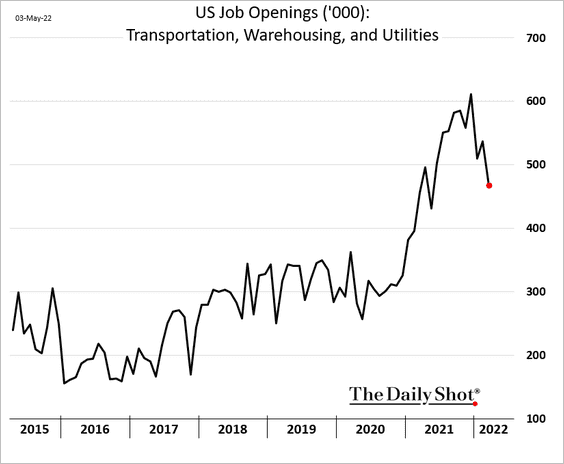
However, we continue to see a pullback in logistics worker demand, suggesting that supply chain issues are starting to ease.
The economic signal from Amazon’s Q1 earnings report was that the firm now has too much warehouse capacity.
 Source: Business Insider Read full article
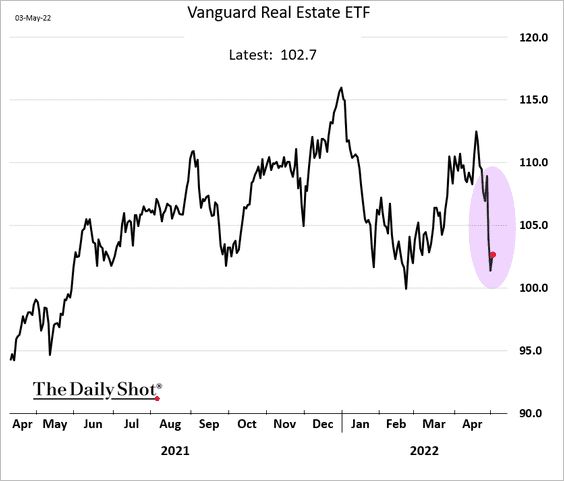
As a result, industrial REITs (warehouse property operators) took a hit in the equity market, pulling down the whole REIT sector. Capacity constraints are easing.
——————–
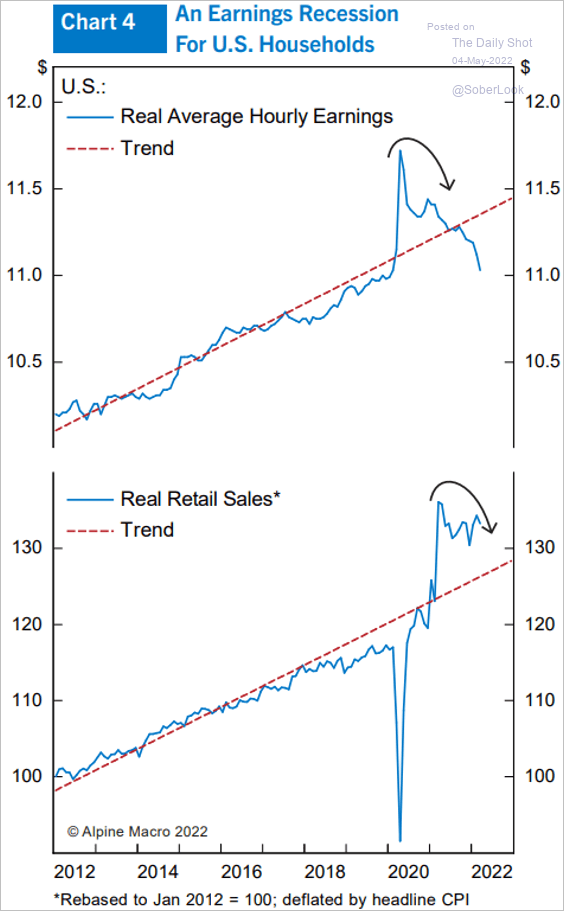
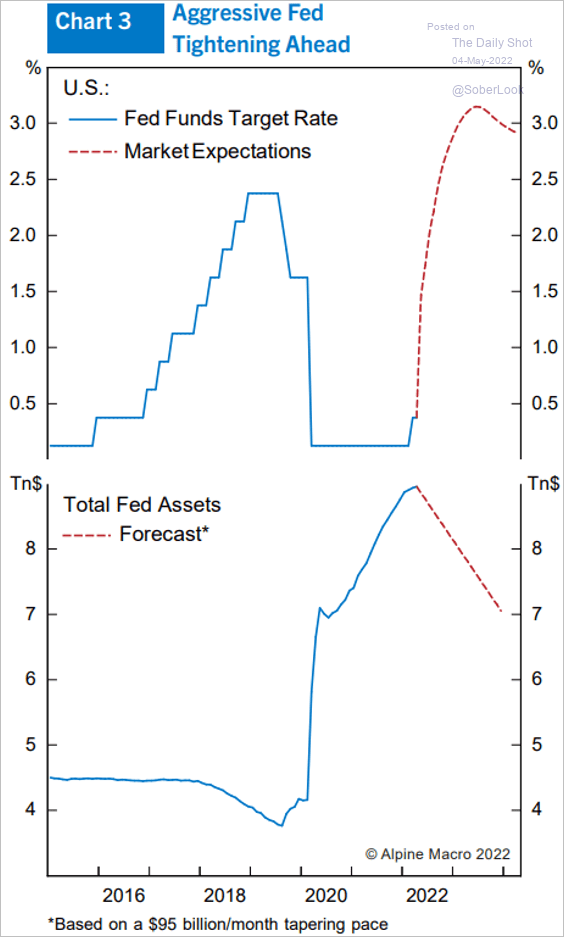
2. The Fed’s aggressive tightening of monetary policy will be accompanied by falling real earnings for US households and in turn, falling real retail sales.
 Source: Alpine Macro
3. Next, we have some updates on inflation
• Capital Economics expects cyclical inflationary pressures to gradually ease, which could encourage the Fed to switch back to 25 basis point rate hikes from September onwards (50 bps is now expected in May and June).
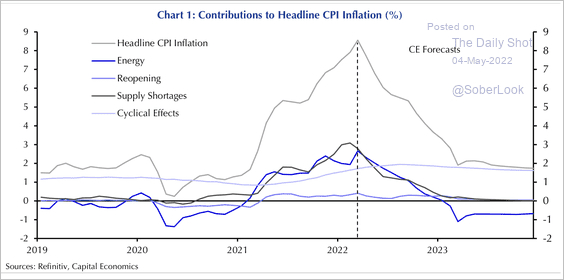 Source: Capital Economics
• Used cars and trucks alone are over a percentage point of core CPI, which should begin to unwind.
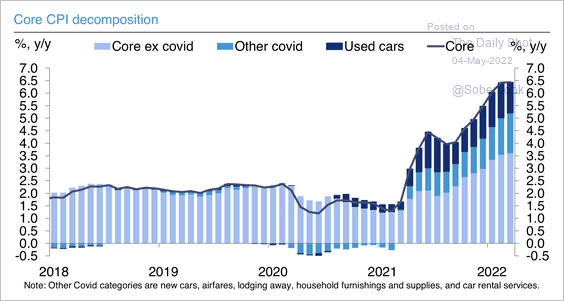 Source: Deutsche Bank Research
The effect of used cars on core PCE, however, is smaller given the lower weight.
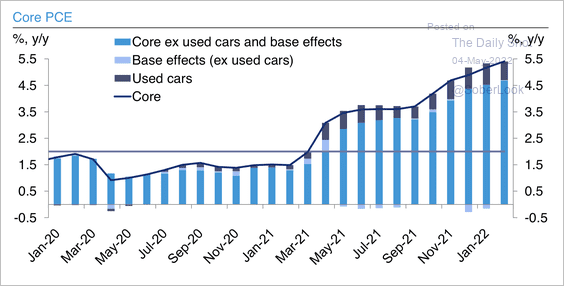 Source: Deutsche Bank Research
• A steeper Phillips Curve?
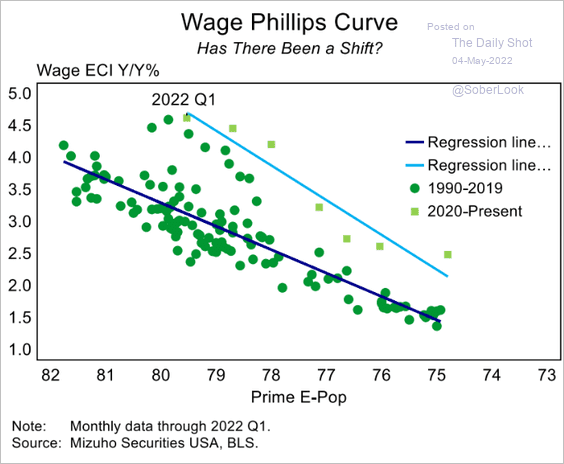 Source: Mizuho Securities USA
——————–
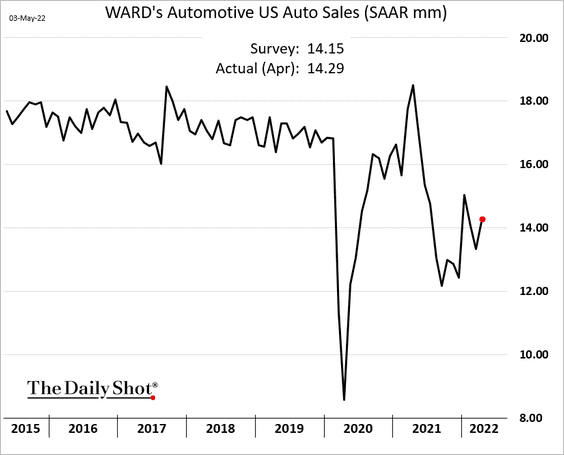
4. Auto sales improved last month.
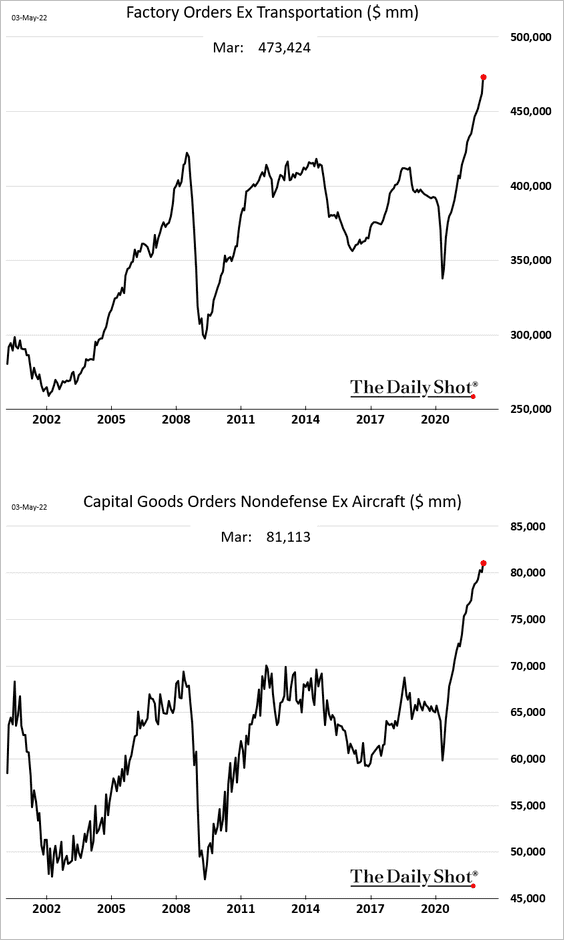
5. Factory orders have been very strong, pointing to robust business investment.
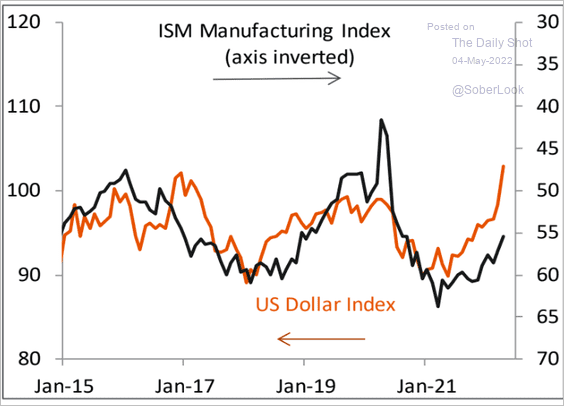
6. The US dollar’s recent strength could put additional pressure on manufacturing activity.
 Source: Piper Sandler
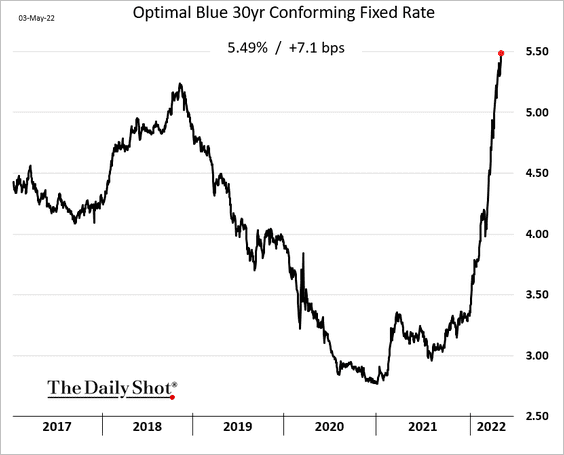
7. The 30-year mortgage rate is approaching 5.5%.
Back to Index
The United Kingdom
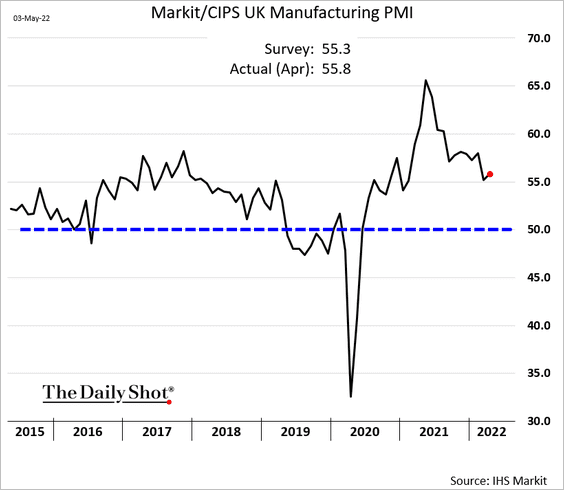
1. The updated April manufacturing PMI figures were stronger than the earlier report.
• But export orders are deteriorating, …
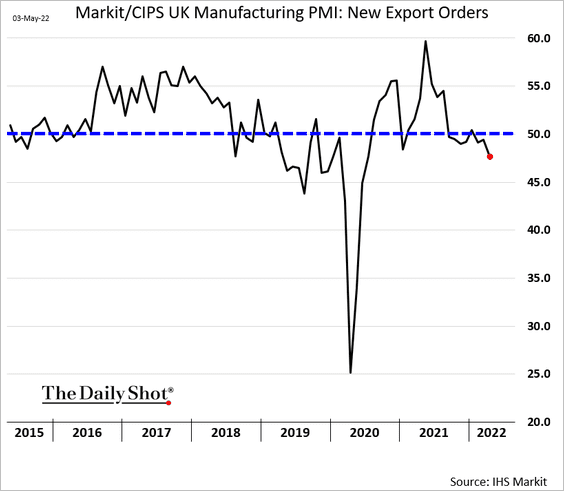
… lagging the Eurozone.
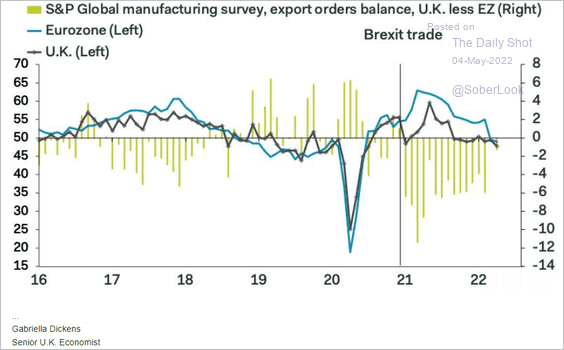 Source: Pantheon Macroeconomics
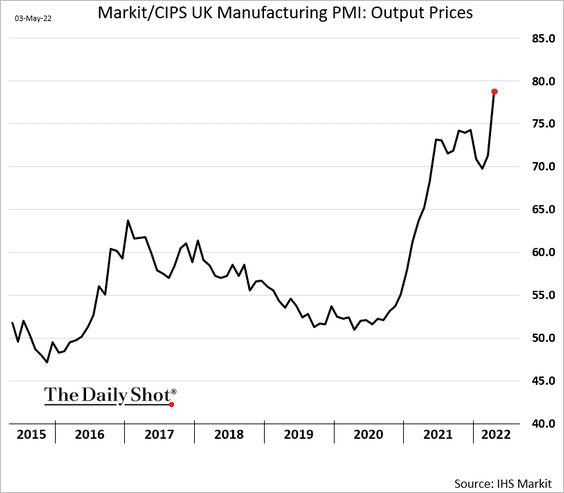
• Factories are rapidly boosting prices.
——————–
2. Inflation has taken a toll on consumer sentiment.
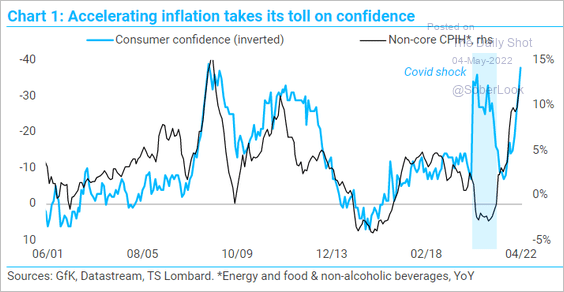 Source: TS Lombard
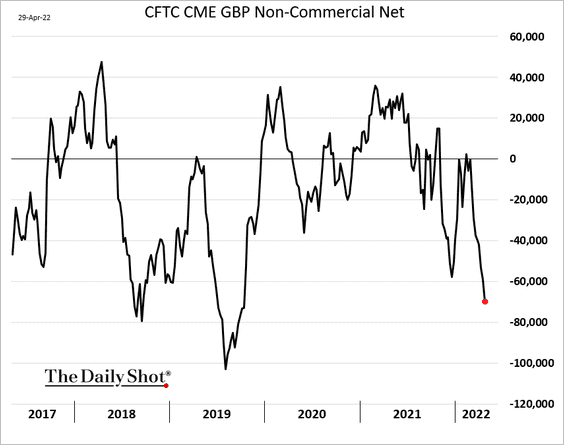
3. Speculative accounts have been boosting their bets against the pound.
Back to Index
The Eurozone
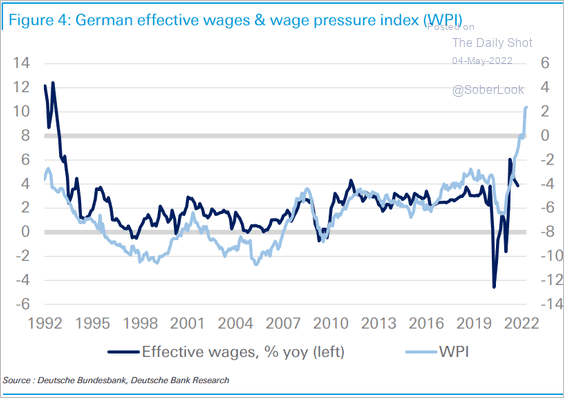
1. German unemployment remains near the lows.
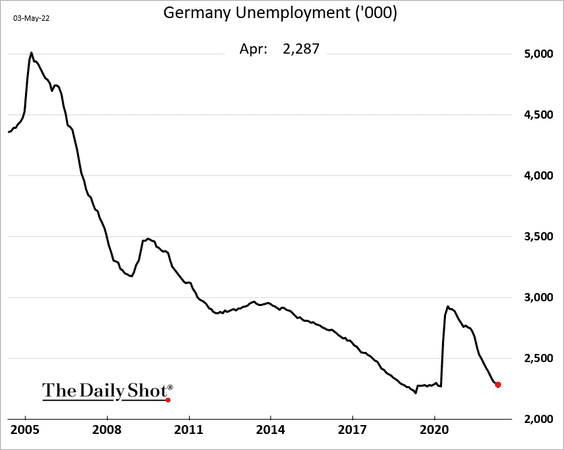
Wage pressures are building.
 Source: Deutsche Bank Research
——————–
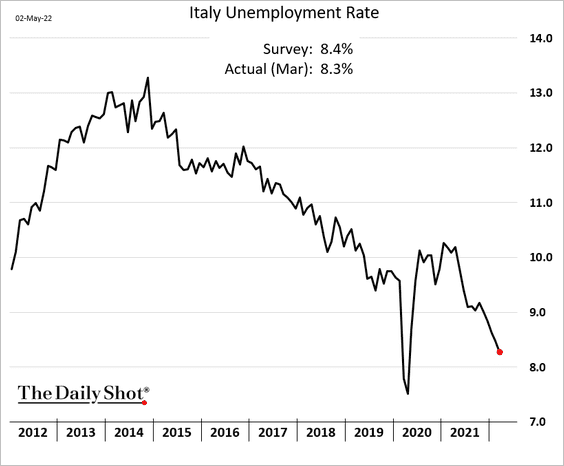
2. Italian unemployment is dropping quickly as well.
3. Euro-area consumer inflation is nearing a peak.
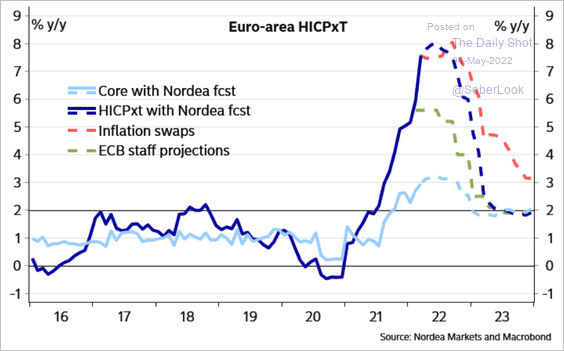 Source: Nordea Markets
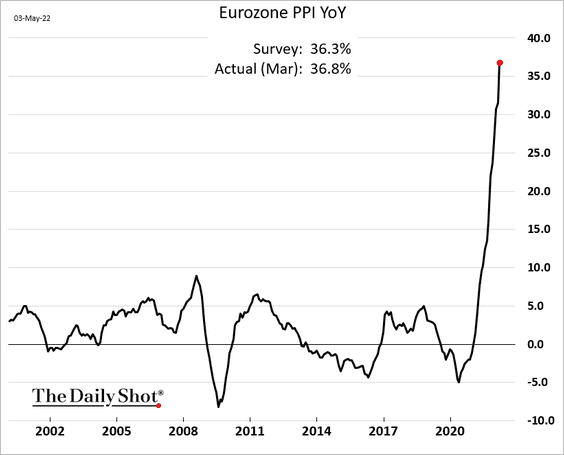
The March PPI broke through 36%.
——————–
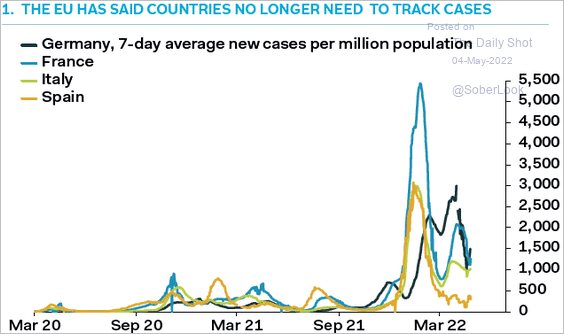
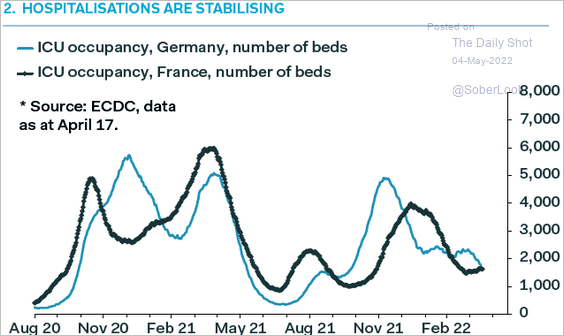
4. Covid19 recovery across the Eurozone proceeds on track, with cases and hospitalizations both trending lower (two charts).
 Source: Pantheon Macroeconomics
 Source: Pantheon Macroeconomics
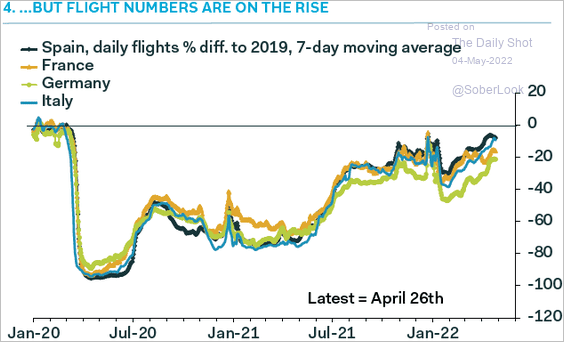
Complementing the falling Covid19 cases, daily flights across the Eurozone are trending back to pre-pandemic levels.
 Source: Pantheon Macroeconomics
——————–
5. As the EU continues to debate sanctions on Russian energy imports, Barclays’ European economists estimate that an embargo of all Russian energy imports could reduce euro area GDP by 5%.
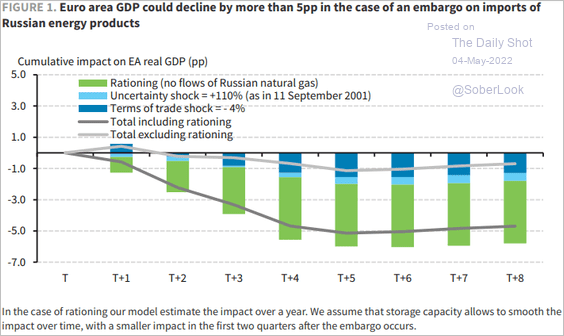 Source: Barclays Research
Because the Eurozone imports its natural gas and crude oil requirements, a 200% shock to European natural gas prices and a 40% shock to crude oil prices would result in a 4% deterioration in the Eurozone’s terms of trade.
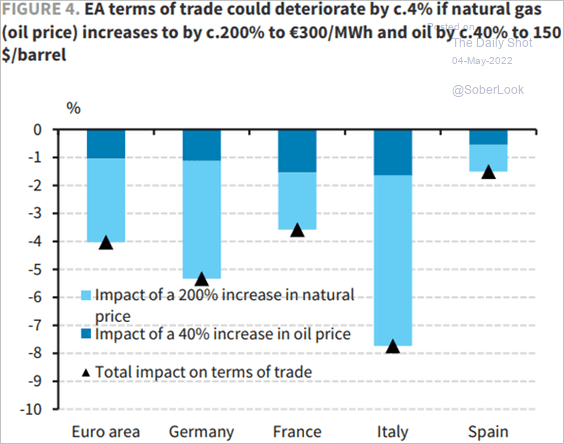 Source: Barclays Research
——————–
6. Euro-area sovereign bond yields are proportional to the debt-to-GDP ratio.
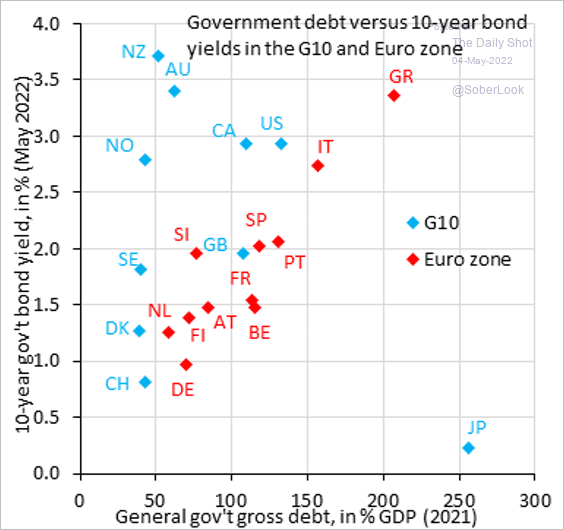 Source: @RobinBrooksIIF
7. Next, we have some data on the French elections.
• Voter flows from the first to the second round:
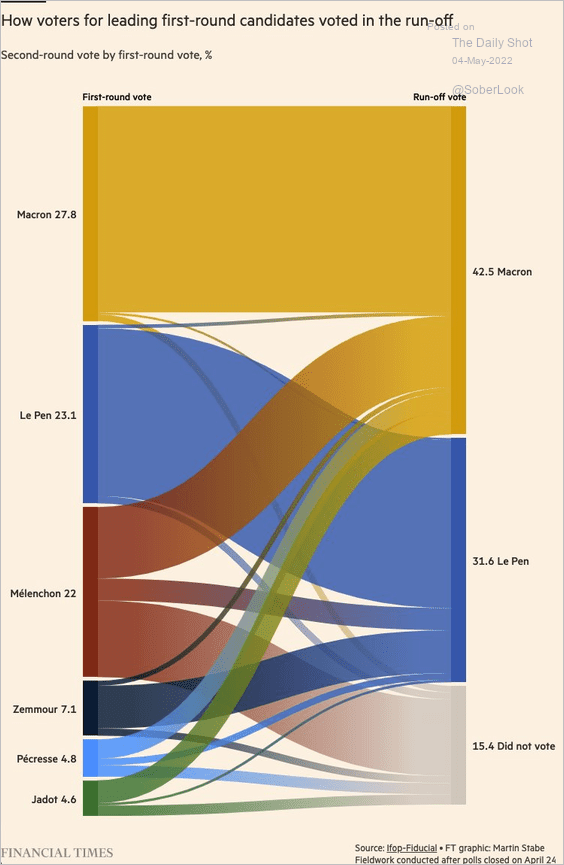 Source: @financialtimes Read full article
• Le Pen/Macron performance by region:
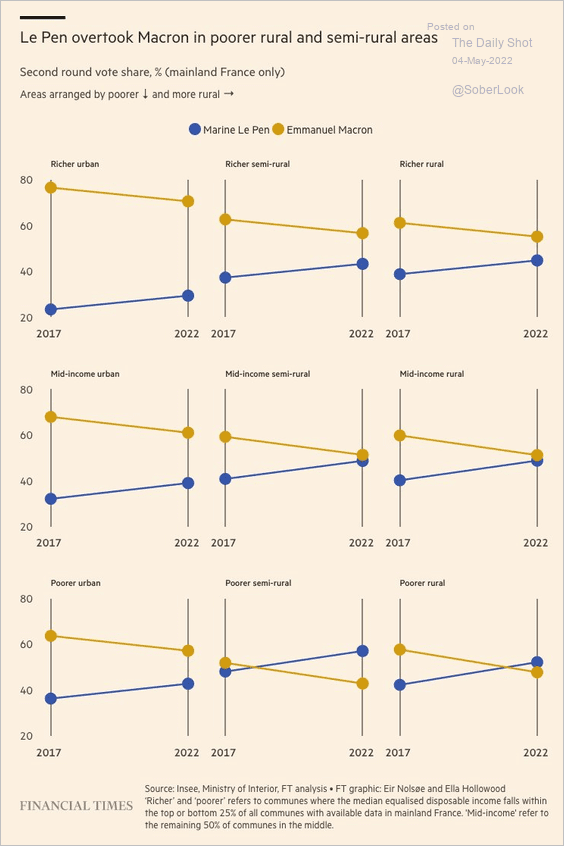 Source: @financialtimes Read full article
Back to Index
Asia – Pacific
1. This past fiscal year was the first time since 2013 that Japan has been both a net seller of foreign bonds (black) and foreign stocks (red), although there has been less selling of foreign stocks as of late.
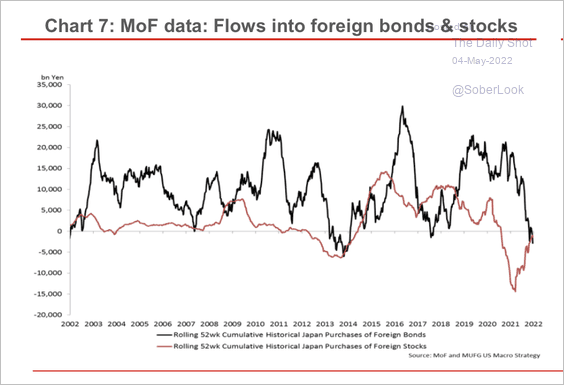 Source: MUFG Securities
2. Liquidity concerns have triggered downgrades across China and Asia-Pacific homebuilders.
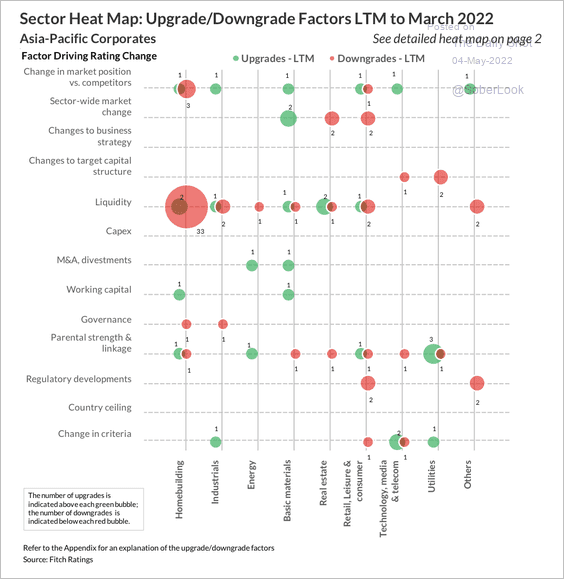 Source: Fitch Ratings
3. Markets repriced the RBA rate trajectory sharply higher.
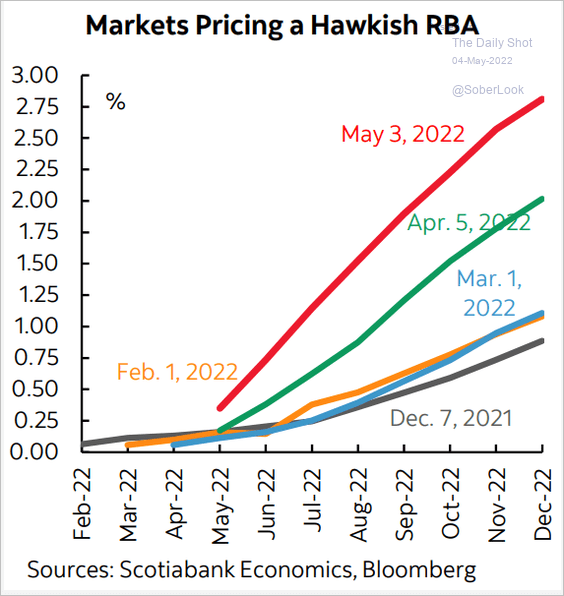 Source: Scotiabank Economics
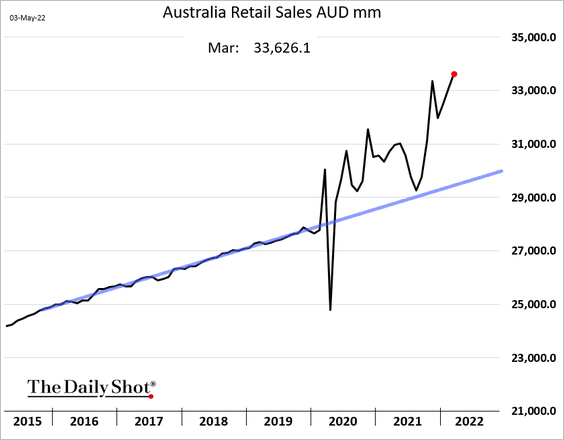
Australian retail sales surged further in March.
——————–
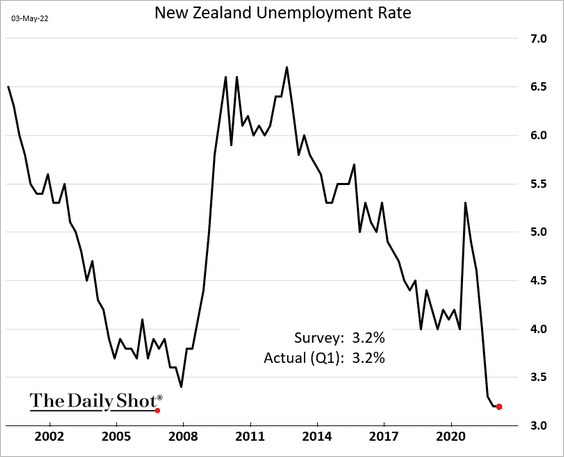
4. New Zealand’s unemployment rate is near record lows.
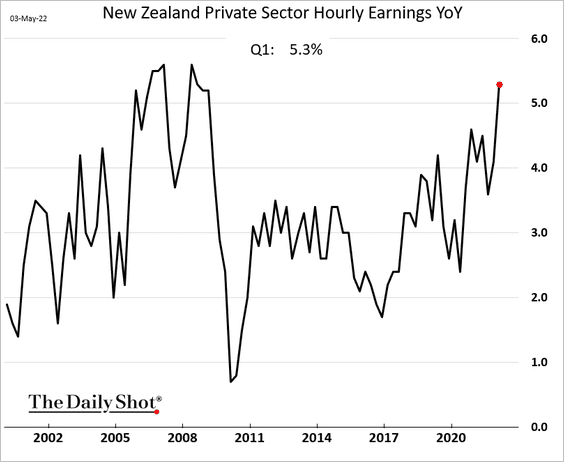
Wage growth is accelerating.
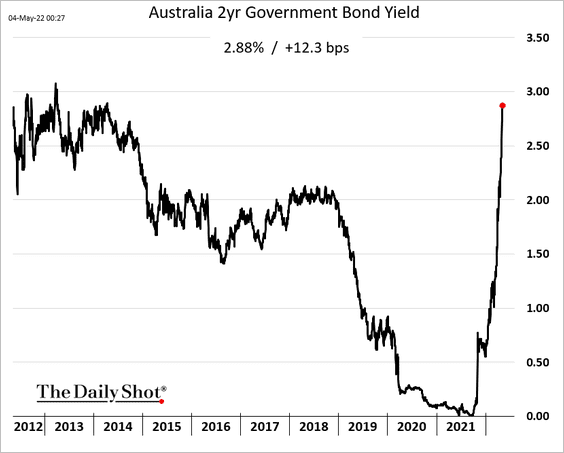
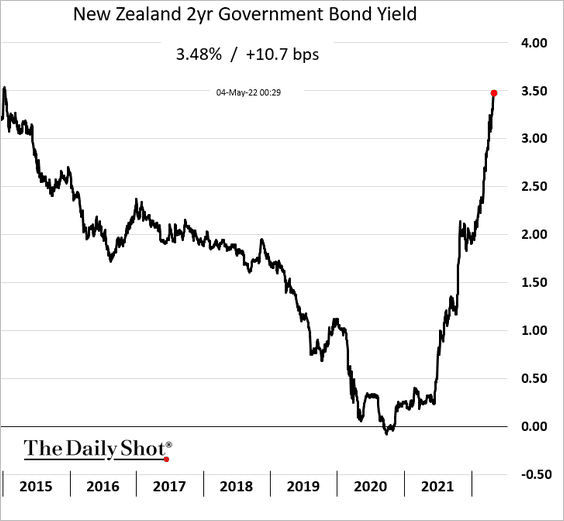
The 2yr yield is nearing the 2015 peak.
Back to Index
China
1. The authorities do not appear to be making much progress in mitigating the spread of Covid.
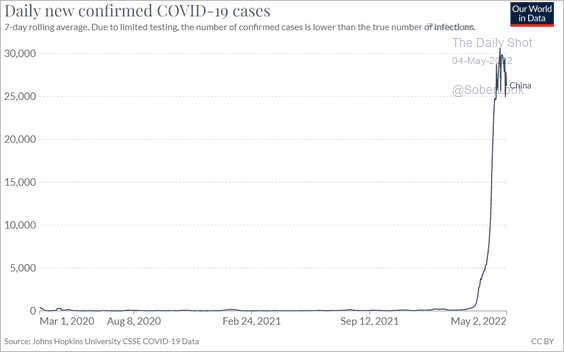 Source: Our World in Data
Domestic air travel has collapsed.
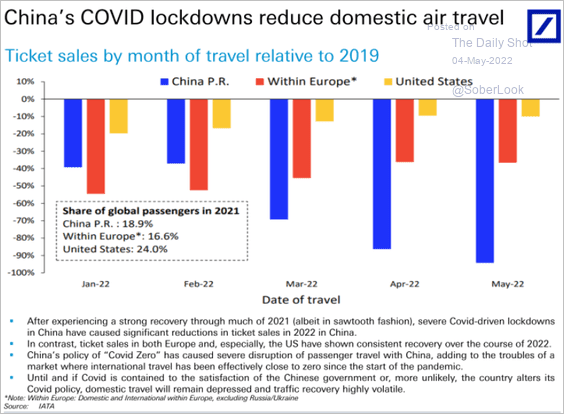 Source: Deutsche Bank Research
Aggregate mobility indices in some areas have remained depressed.
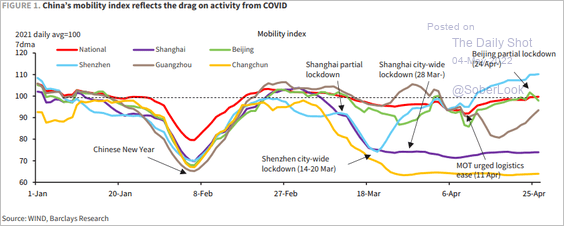 Source: Barclays Research
——————–
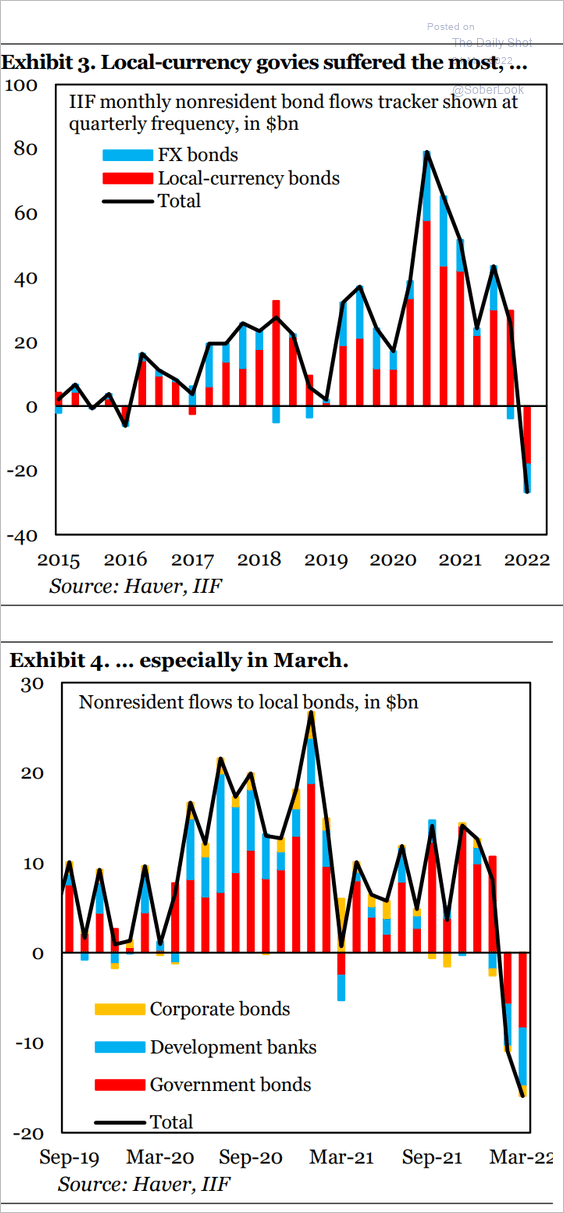
2. Bond outflows were severe last quarter.
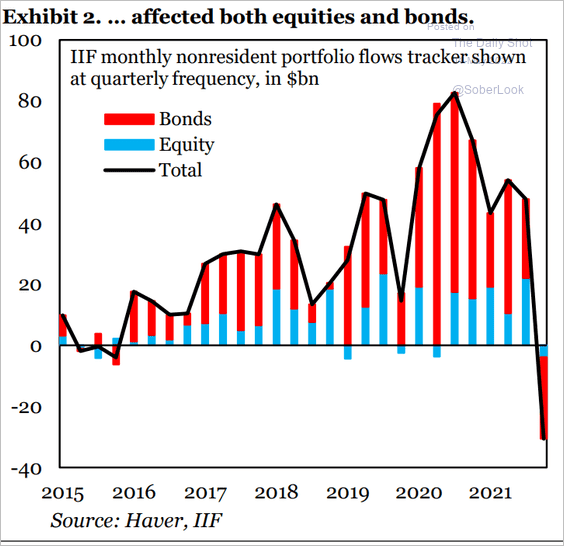 Source: IIF
 Source: IIF
——————–
3. Economic forecasts have been weaker than the official target (which is unusual).
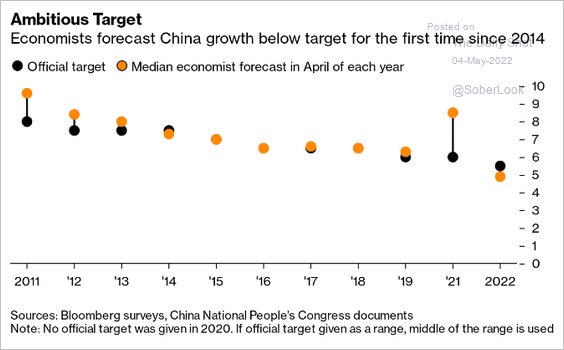 Source: @hancocktom Read full article
Here is the Capital Economics China Activity Proxy vs. the official GDP.
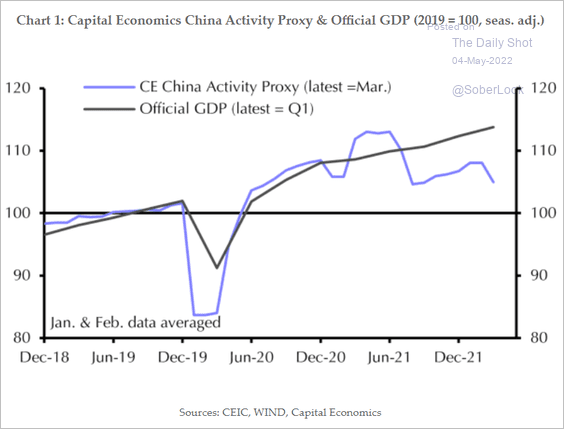 Source: Capital Economics
——————–
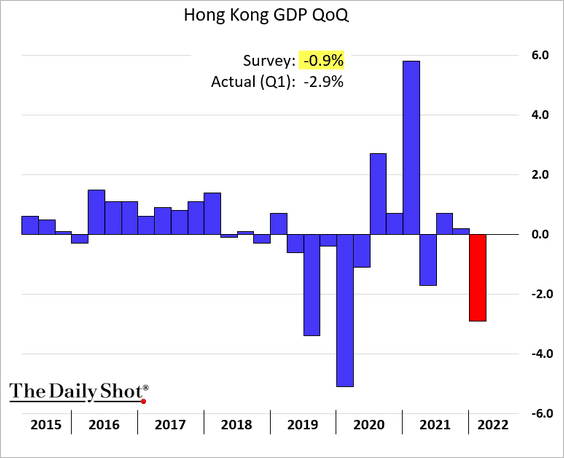
4. Hong Kong’s GDP tumbled last quarter.
Back to Index
Emerging Markets
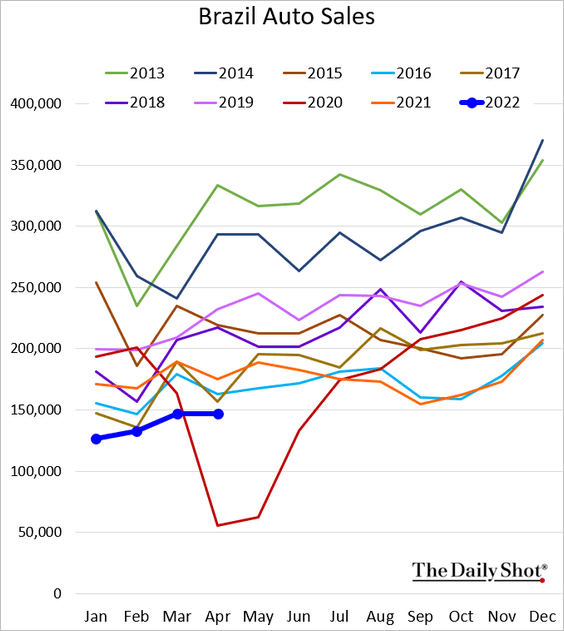
1. Brazil’s industrial production edged higher in March.
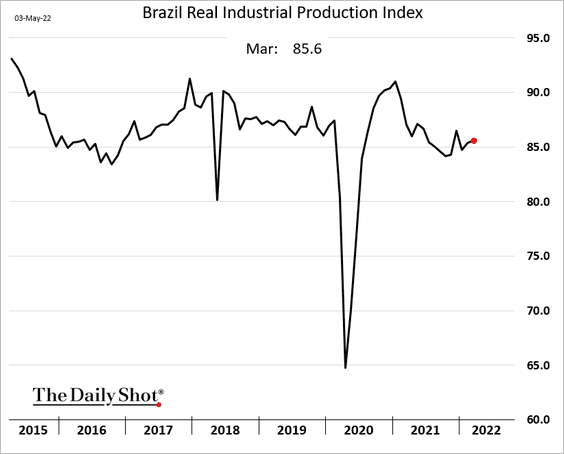
 Source: Reuters Read full article
Auto sales remain soft.
——————–
2. Russia’s manufacturing sector continued to contract in April.
 Source: IHS Markit
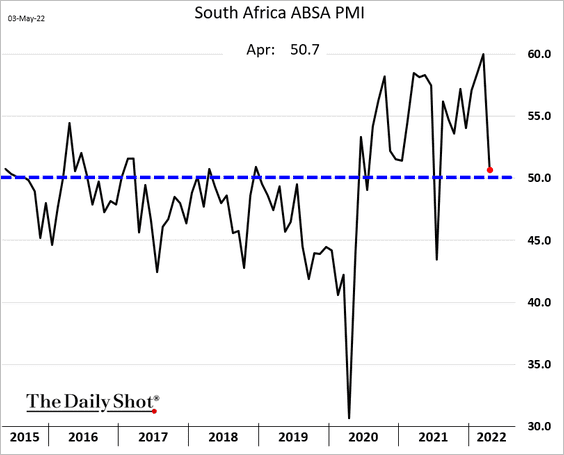
3. South Africa’s manufacturing growth stalled abruptly last month.
4. Which countries’ economies are most sensitive to China?
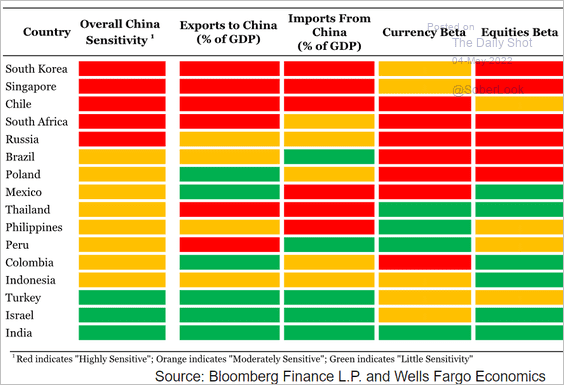 Source: Wells Fargo Securities
5. We could see rate cuts in some countries later this year.
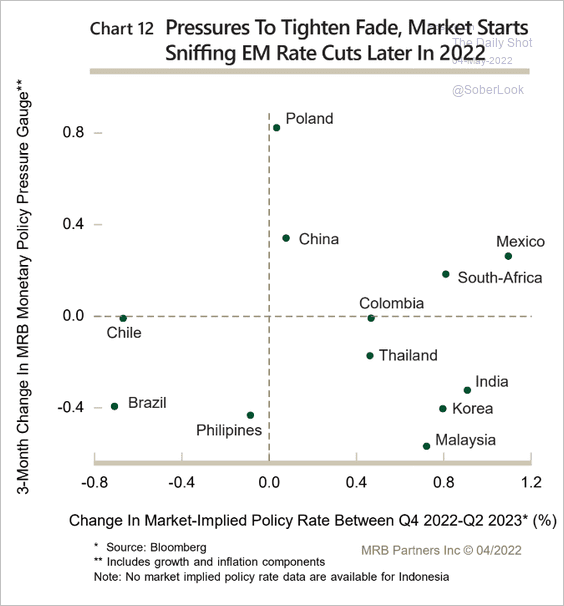 Source: MRB Partners
6. EM manufacturing price gains have been much less severe than in advanced economies.
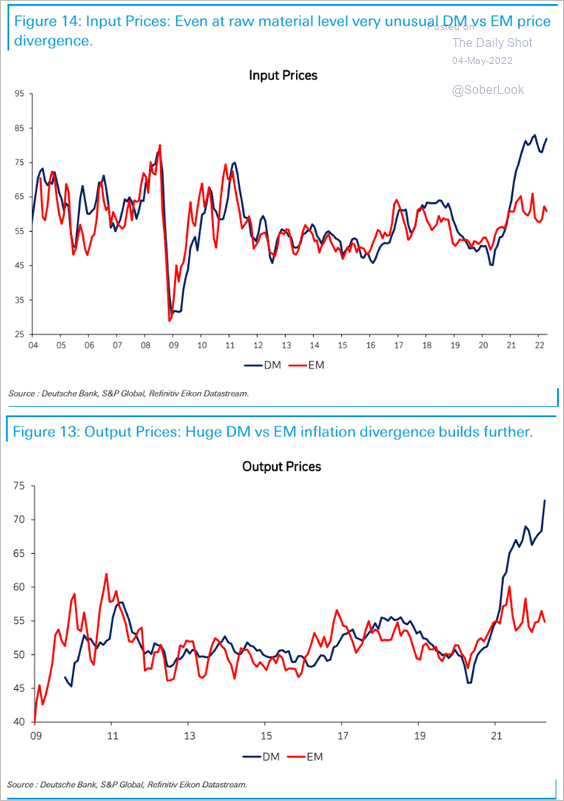 Source: Deutsche Bank Research
7. Rising commodity prices result in higher import prices and weaker trade balances in some EM Asia and European countries. Meanwhile, GCC countries clearly benefit.
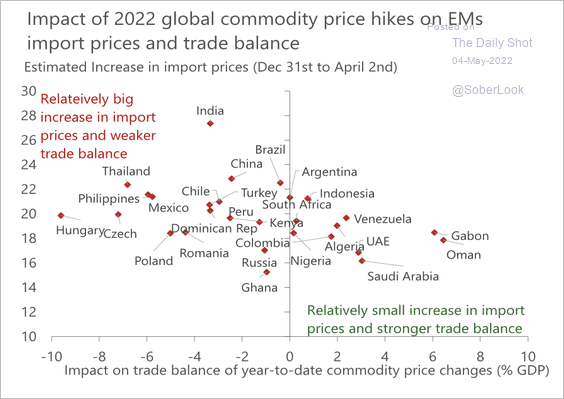 Source: Oxford Economics
Commodity importers’ currencies have depreciated the most this year.
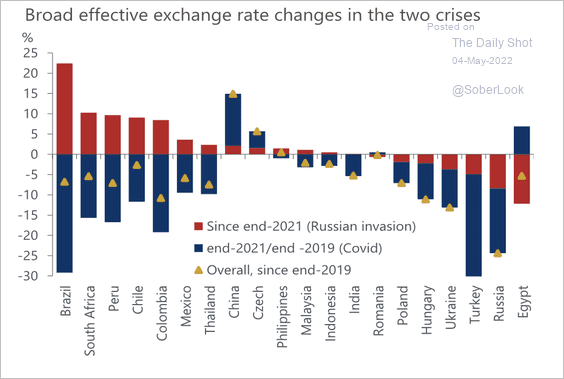 Source: Oxford Economics
Food subsidies have helped dampen inflationary pressures.
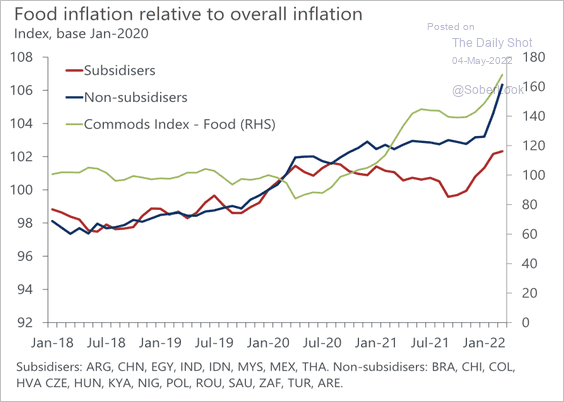 Source: Oxford Economics
Back to Index
Cryptocurrency
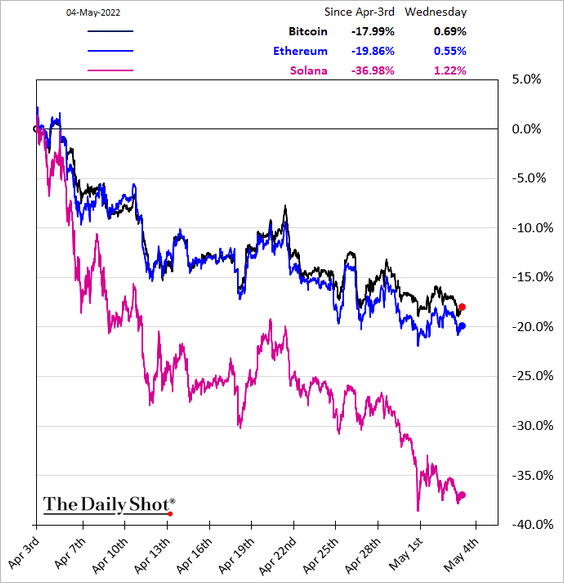
1. Solana has underperformed sharply in recent weeks amid concerns about network stability.
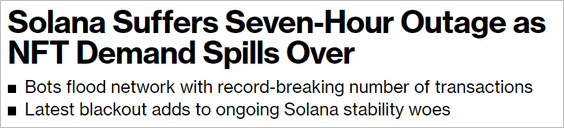 Source: @markets Read full article
——————–
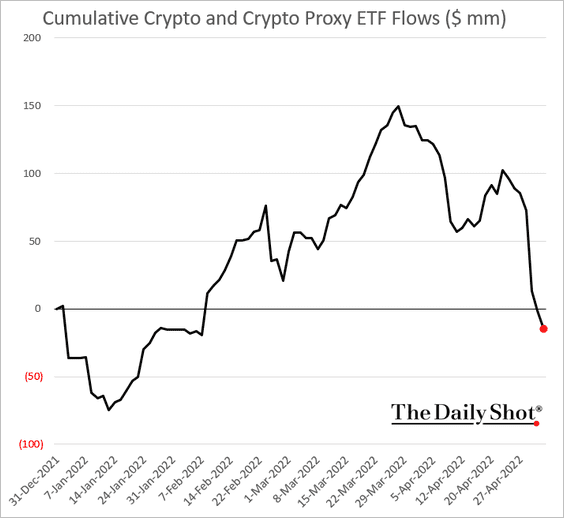
2. Crypto ETF year-to-date flows have turned negative again.
3. A pending reversal in bitcoin’s dominance ratio, or BTC’s market cap relative to the total crypto market cap, could indicate a prolonged risk-off environment.
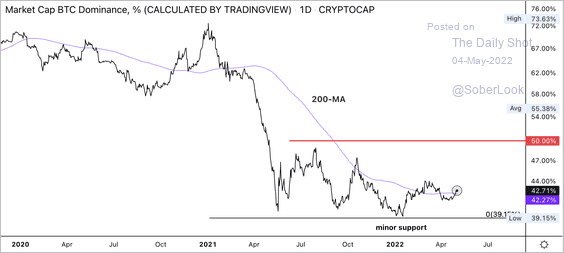 Source: CoinDesk Read full article
4. Bitcoin has suffered a loss of long-term upside momentum.
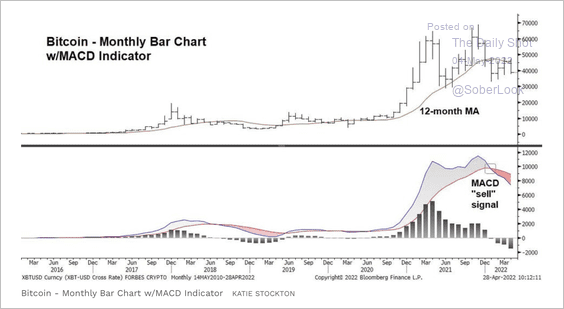 Source: @StocktonKatie
And ether (ETH) appears overbought.
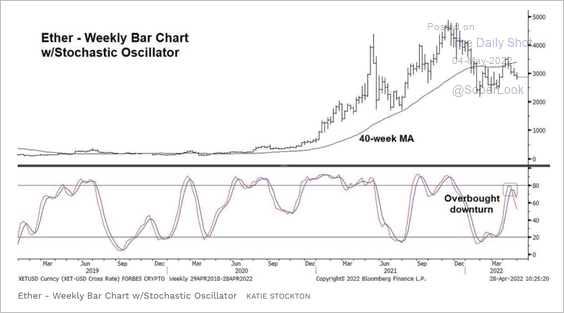 Source: @StocktonKatie
5. Long-term bitcoin holders are starting to take some profits.
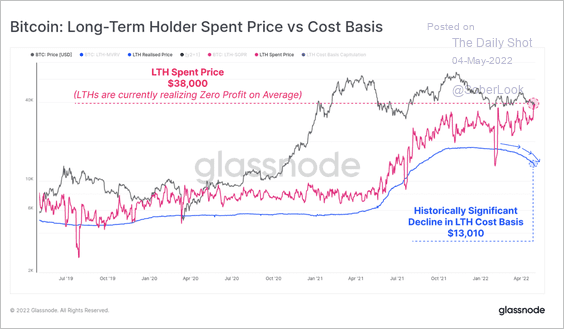 Source: Glassnode Read full article
6. Bitcoin’s implied volatility is trending lower, although some traders expect greater price swings ahead of the Fed meeting, which could cause a spike in front-end vol.
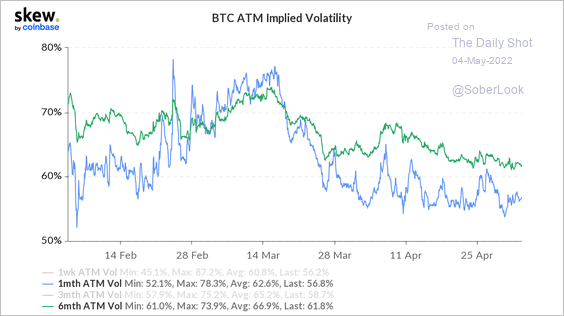 Source: @CoinbaseInsto
7. OpenSea accounts for a majority of NFT trading volume.
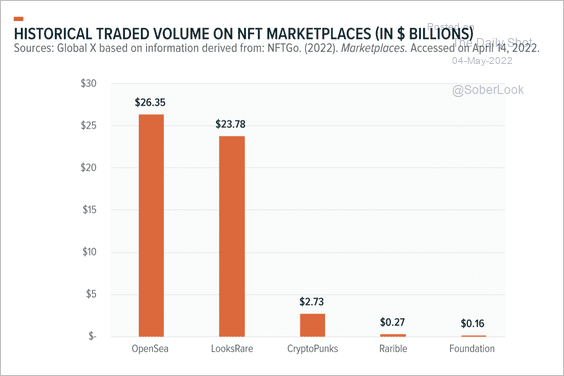 Source: Global X ETFs Read full article
Back to Index
Commodities
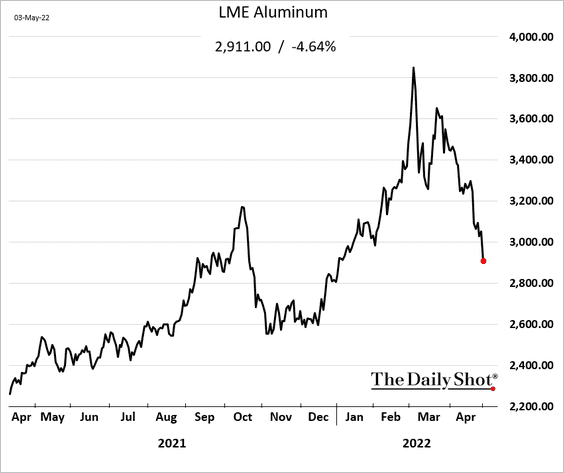
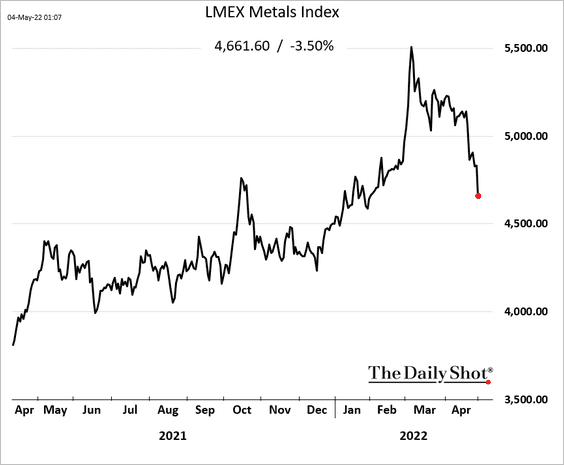
1. Industrial metals have been under pressure due to concerns about softer demand from China.
• Aluminum:
• The LMEX index:
By the way, aluminum production growth is slowing outside of China.
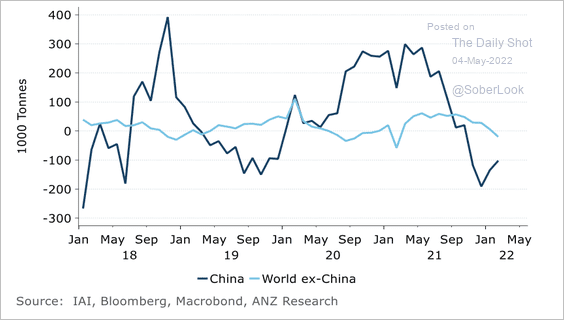 Source: @ANZ_Research
——————–
2. India’s gold imports fell sharply in March.
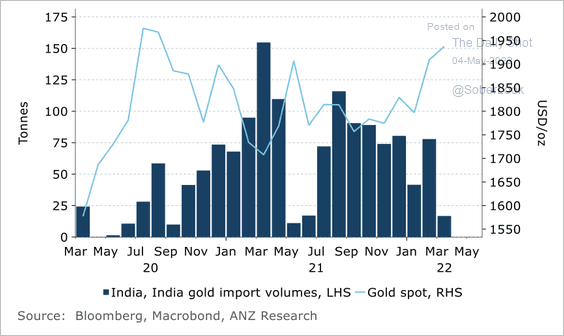 Source: @ANZ_Research
• Platinum and palladium inventories are declining.
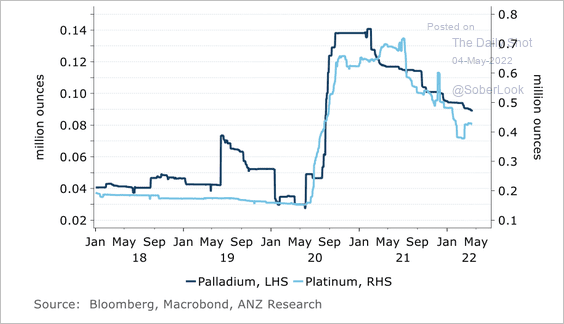 Source: @ANZ_Research
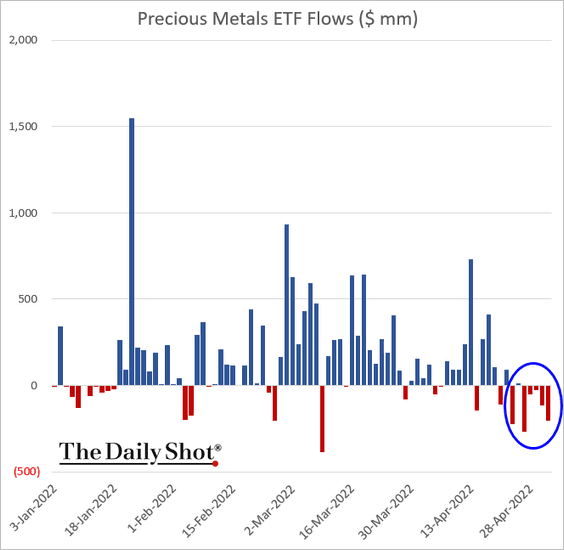
• Precious metals ETFs are experiencing outflows.
——————–
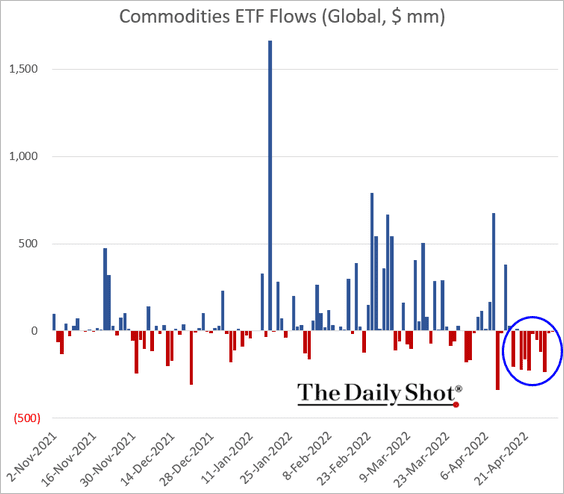
3. On the whole, commodity ETFs have been bleeding capital in recent days.
4. Peak backwardation?
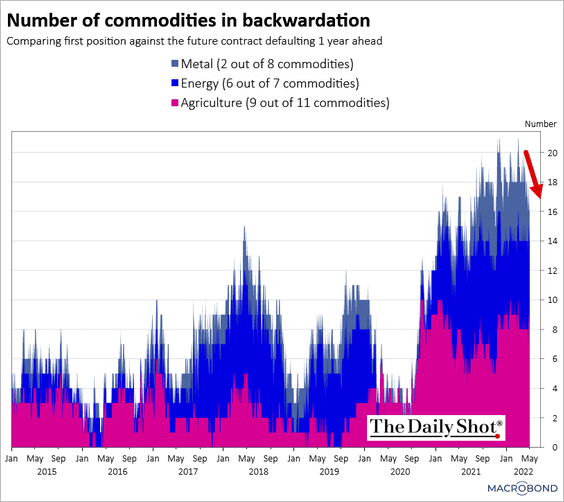 Source: Chart and data provided by Macrobond
Back to Index
Energy
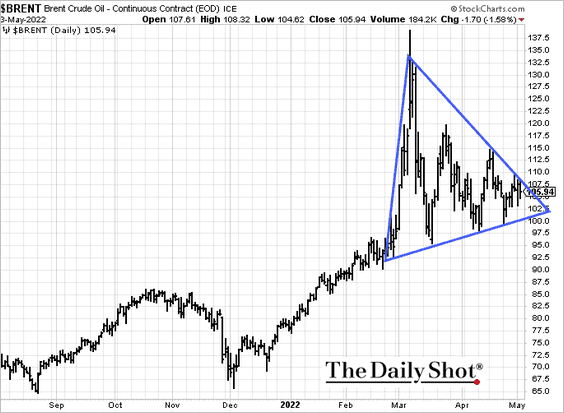
1. The wedge in Brent crude remains intact.
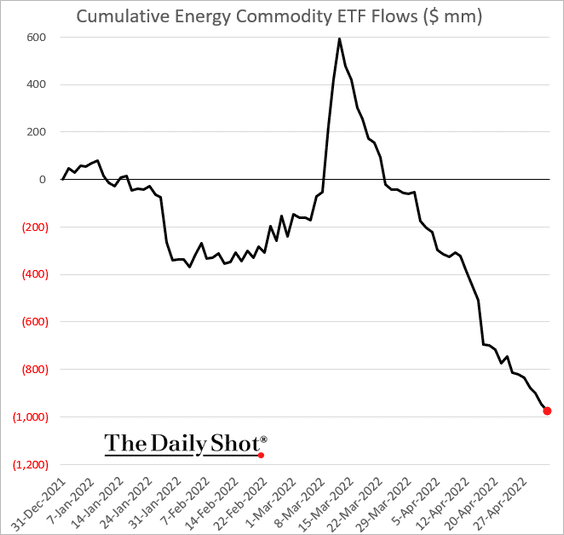
2. Energy commodity ETFs continue to see outflows.
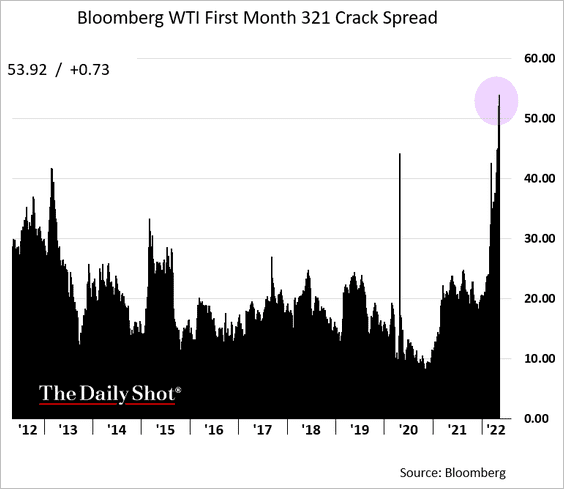
3. US crack spreads are hitting record highs.
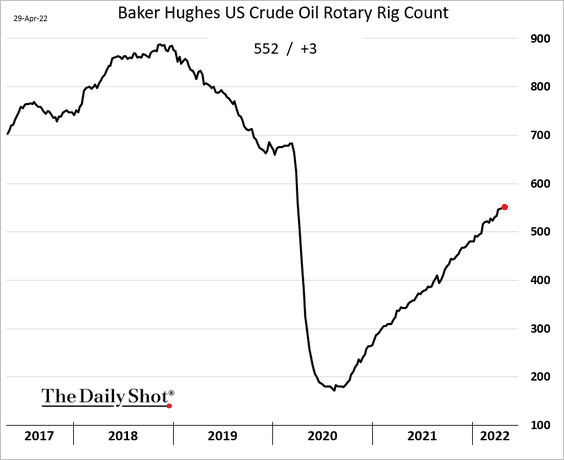
4. The US rig count keeps grinding higher.
5. Russian oil production reached 1987 levels before the recent drop in output. The country has little storage capacity, which means production could ramp up, according to PGM Global.
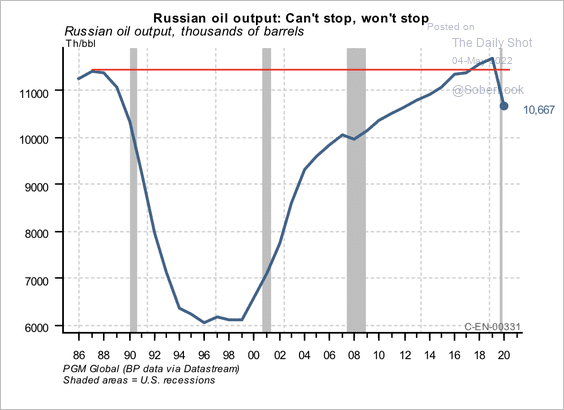 Source: PGM Global
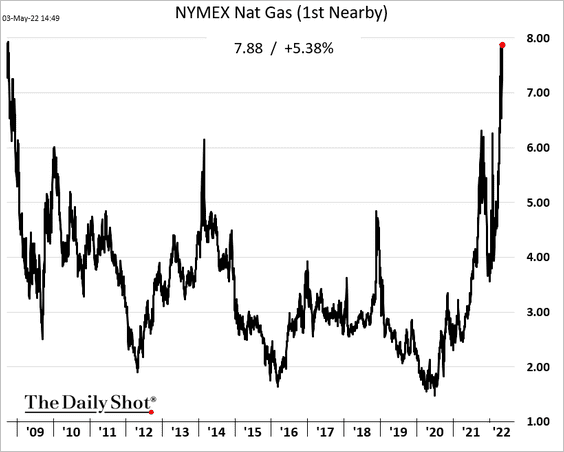
6. US natural gas futures have been surging.
7. Which energy sources provide the best return on investment?
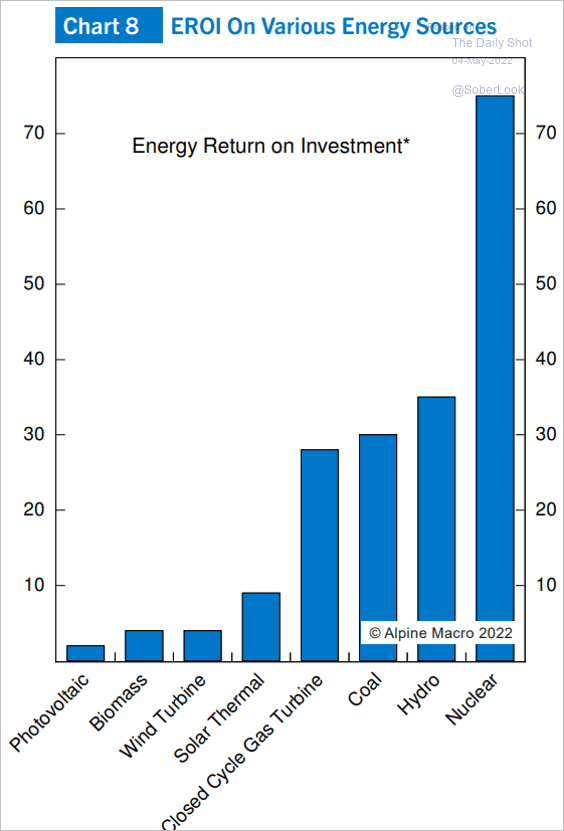 Source: Alpine Macro
8. US energy companies’ CaPex lags the recent surge in cash flows.
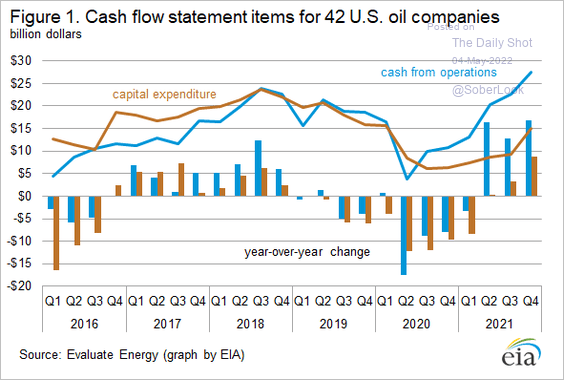 Source: @EIAgov
Well completions have been lagging oil prices.
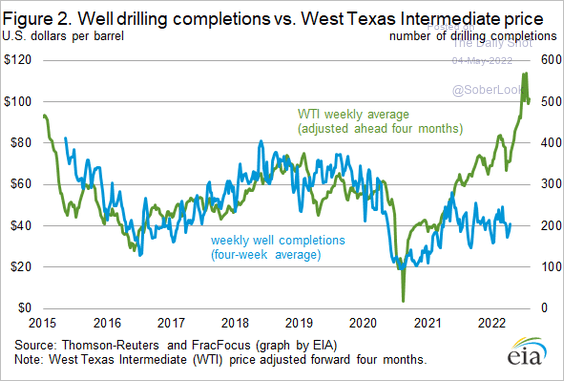 Source: @EIAgov
Back to Index
Equities
1. Analysts’ earnings forecasts have been rising.
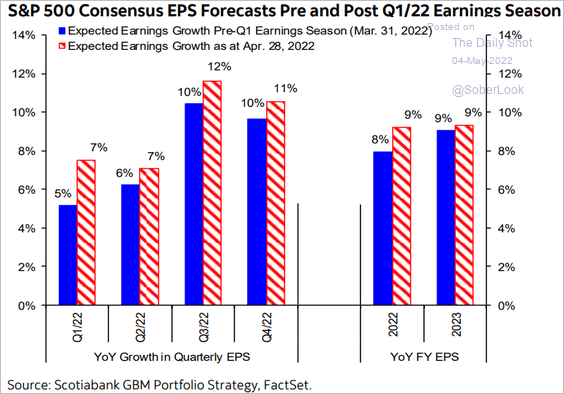 Source: Hugo Ste-Marie, Portfolio & Quantitative Strategy Global Equity Research, Scotia Capital
But Q2 estimates excluding energy and pandemic-impacted companies are down.
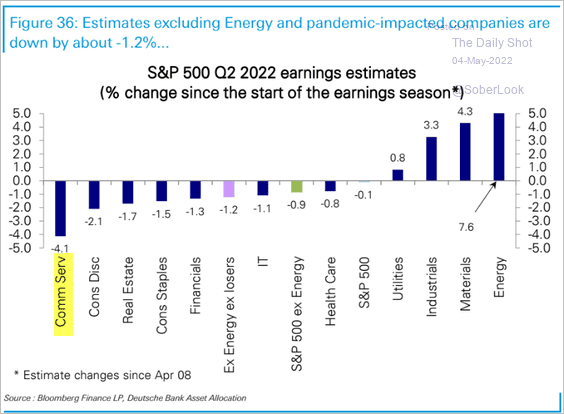 Source: Deutsche Bank Research
• Tight financial conditions could pressure earnings.
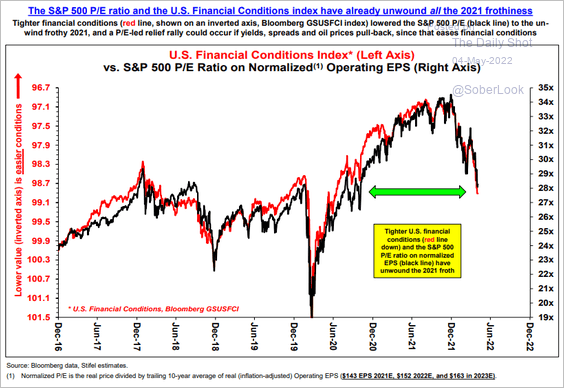 Source: Stifel
• Management guidance and earnings revisions have been weak.
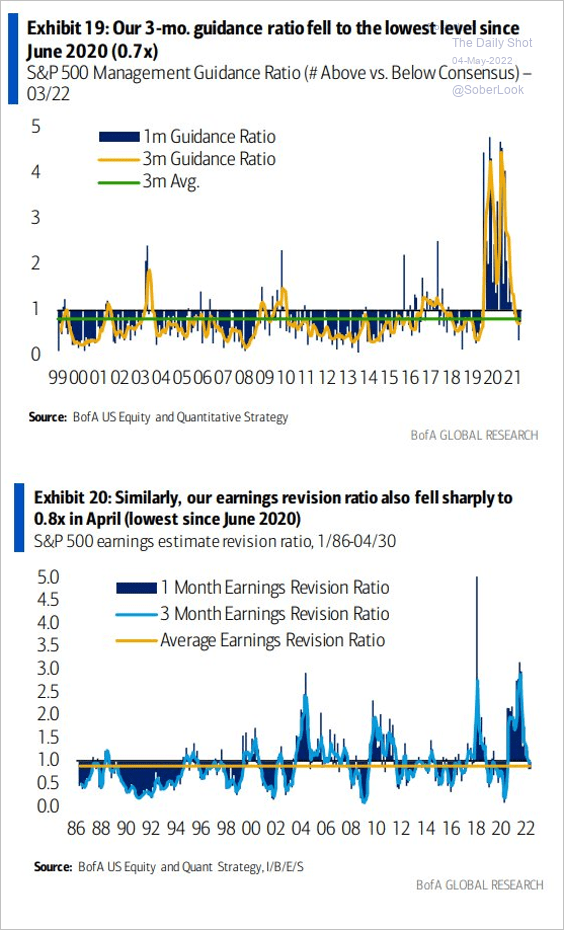 Source: BofA Global Research
• The median earnings beat improved during this earnings season.
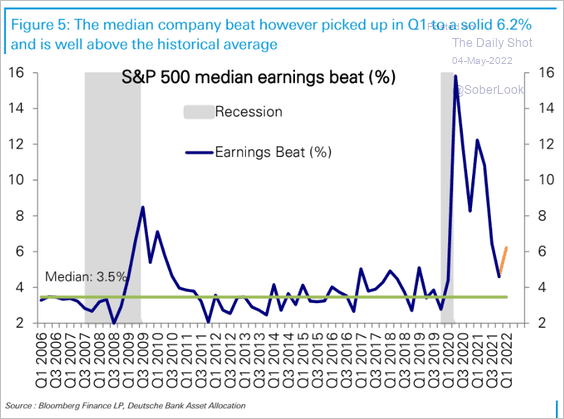 Source: Deutsche Bank Research
——————–
2. Margin levels remain elevated, …
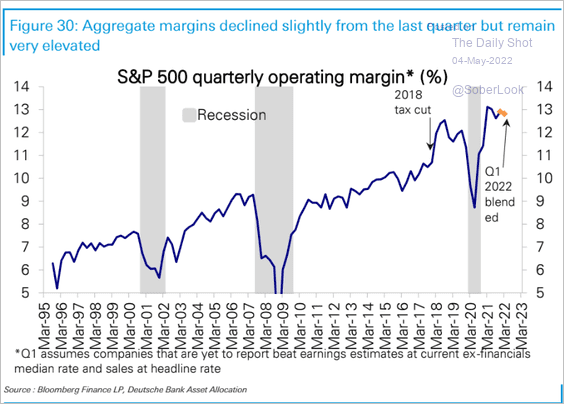 Source: Deutsche Bank Research
…with the median margin beat improving in this earnings season.
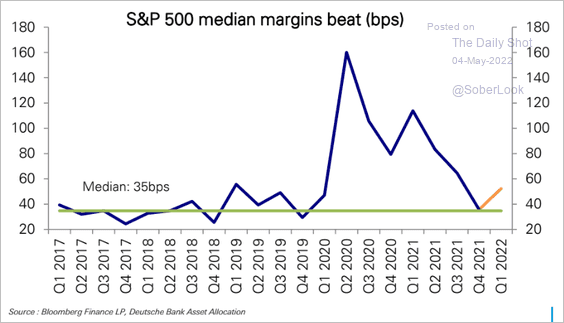 Source: Deutsche Bank Research
But companies are facing margin pressures. There is only so much in price increases that firms can pass on to their customers before getting pushback.
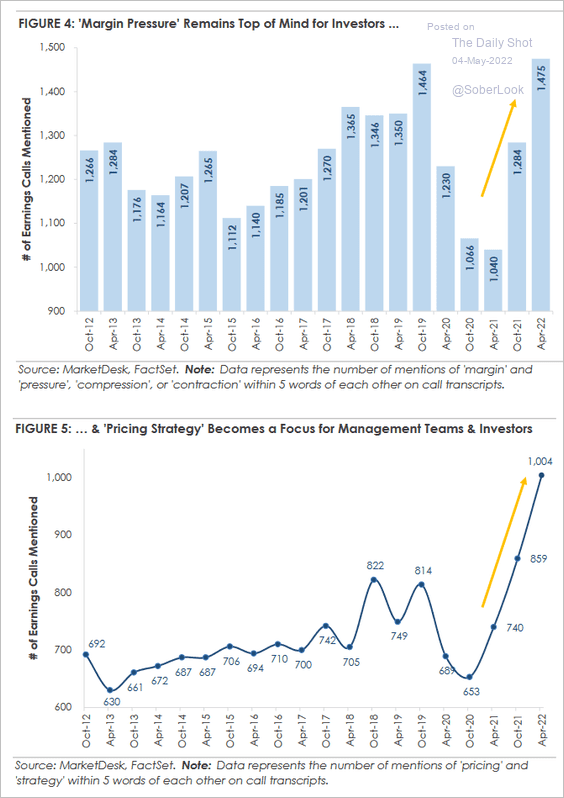 Source: MarketDesk Research
——————–
3. Crowded stocks have been hit hard after reporting earnings.
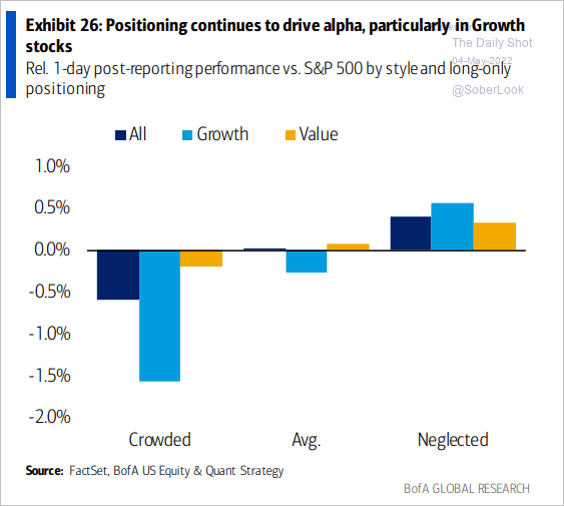 Source: BofA Global Research
4. Only 10% of global equity markets are trading below their long-term valuation averages.
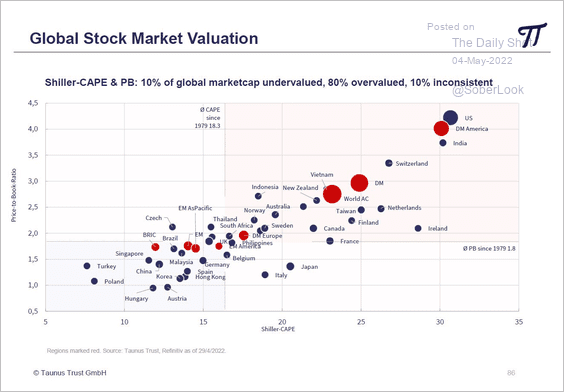 Source: @NorbertKeimling
5. The S&P 500 intraday volatility has been elevated.
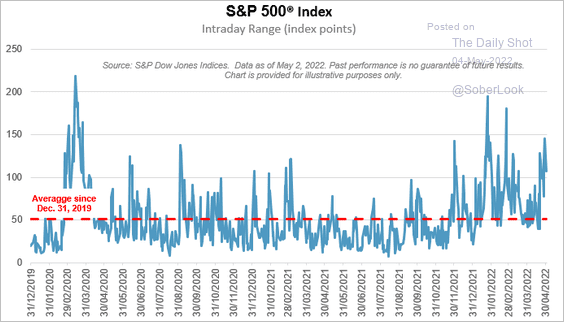 Source: S&P Global Market Intelligence
The market pullback this year (so far) has been average.
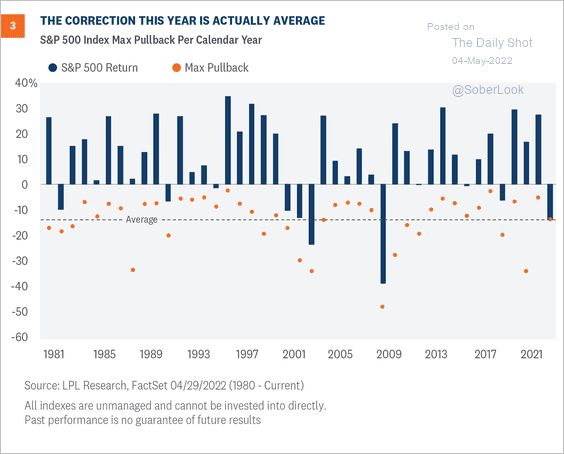 Source: LPL Research
——————–
6. Defensive sectors such as consumer staples, utilities, health care, and real estate tend to perform well between May and August.
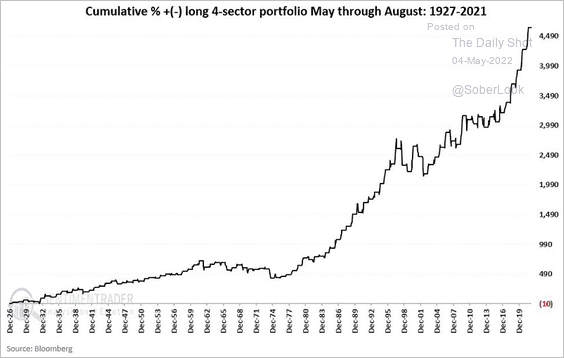 Source: SentimenTrader
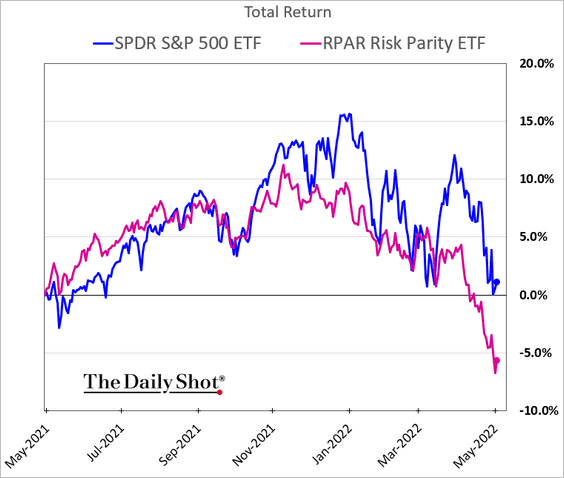
7. Risk parity strategies continue to lag.
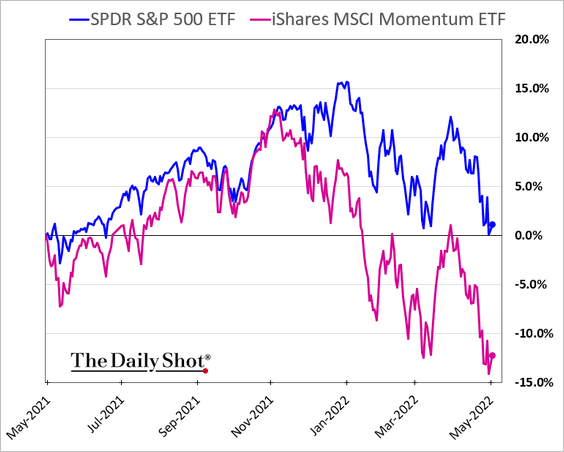
8. Momentum stocks have been underperforming.
9. Which are the most shorted sectors?
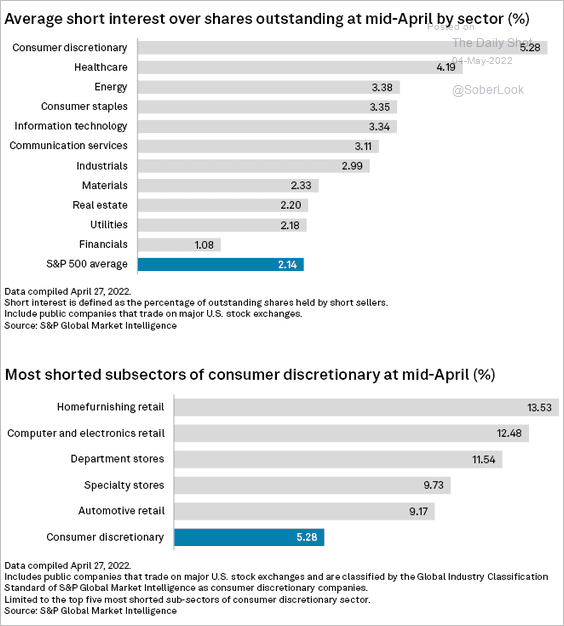 Source: S&P Global Market Intelligence
Back to Index
Rates
1. If the aggressive Fed tightening continues to weigh on the cyclicals/defensives performance, Treasury yields should move lower, particularly in the 10-year maturities.
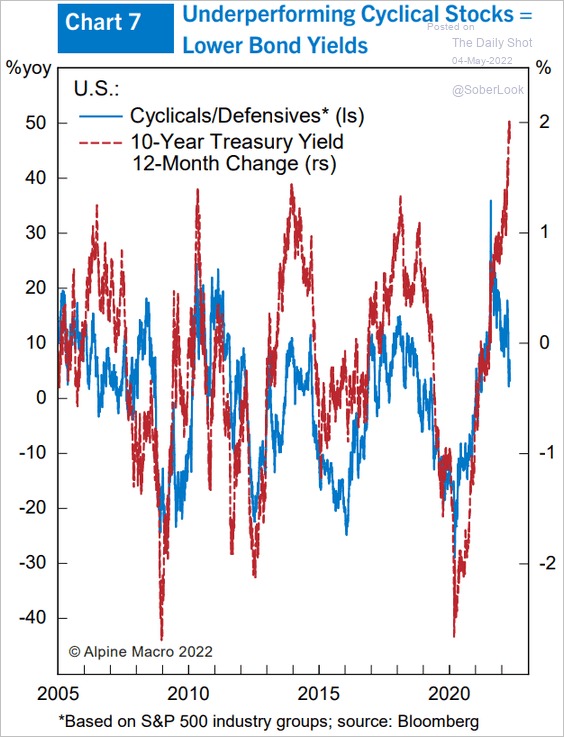 Source: Alpine Macro
2. Will we get a 75 bps hike in June?
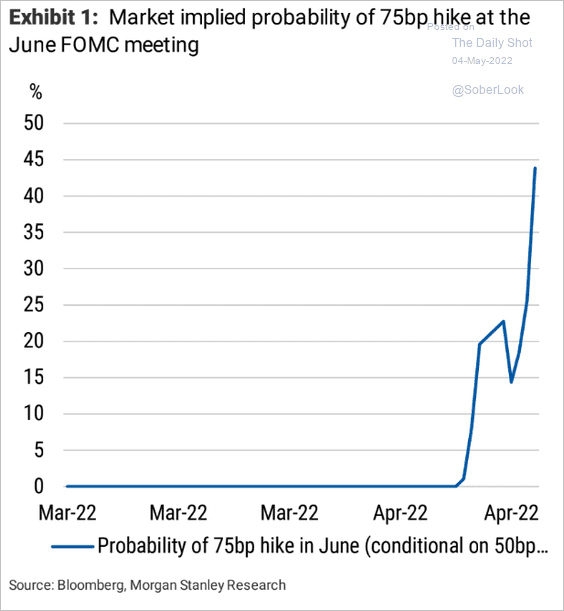 Source: Morgan Stanley Research
3. T-bills have been trading at a premium to repo alternatives as investors flooded into cash.
 Source: Alpine Macro
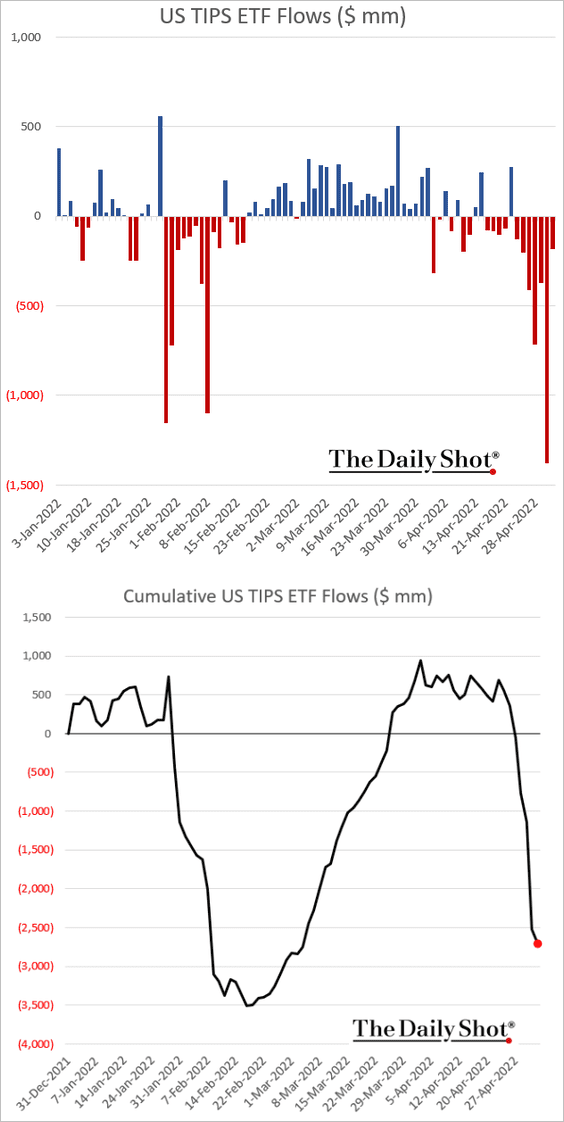
4. TIPS ETFs have been experiencing outflows.
——————–
Food for Thought
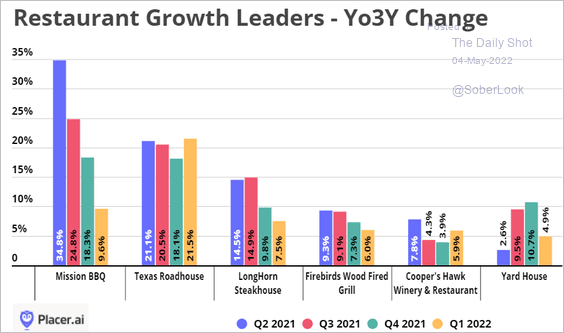
1. Best-performing restaurant chains since 2019:
 Source: Placer.ai
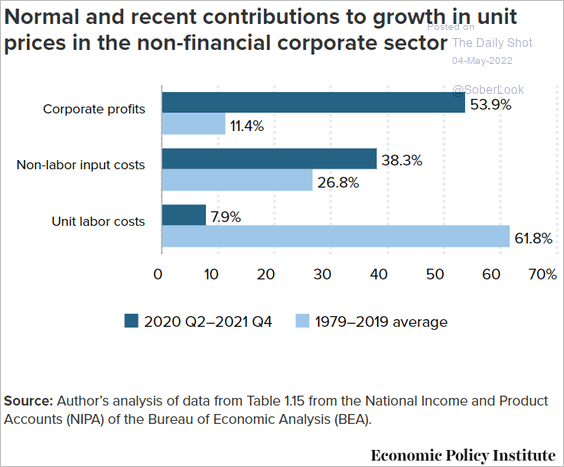
2. How corporate profits, input costs, and labor costs contributed to inflation:
 Source: @EconomicPolicy
3. The economics of Netflix:
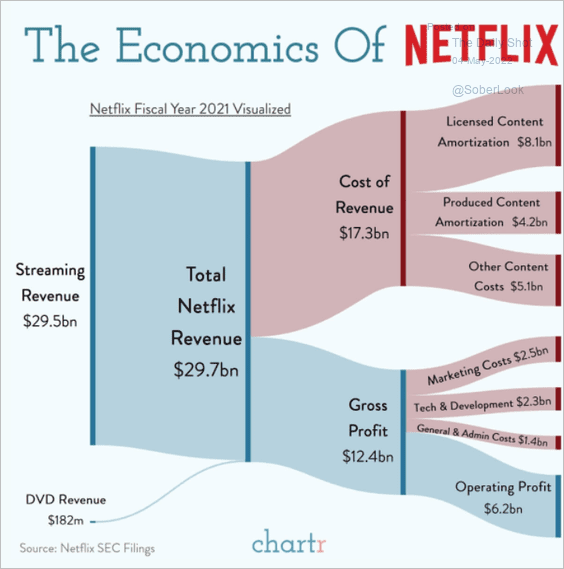 Source: @chartrdaily Read full article
4. The decline in birth rates during the 1918 flu pandemic:
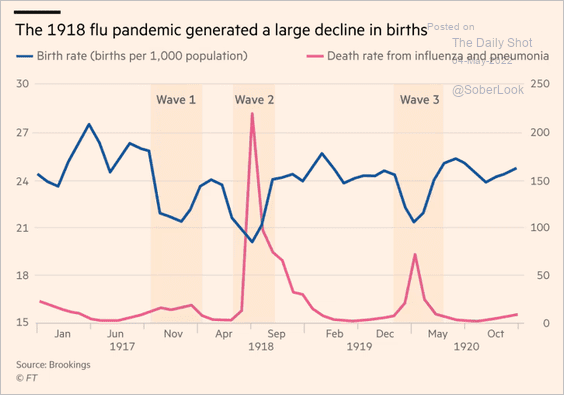 Source: @financialtimes Read full article
5. Sanctions over time and their success rates:
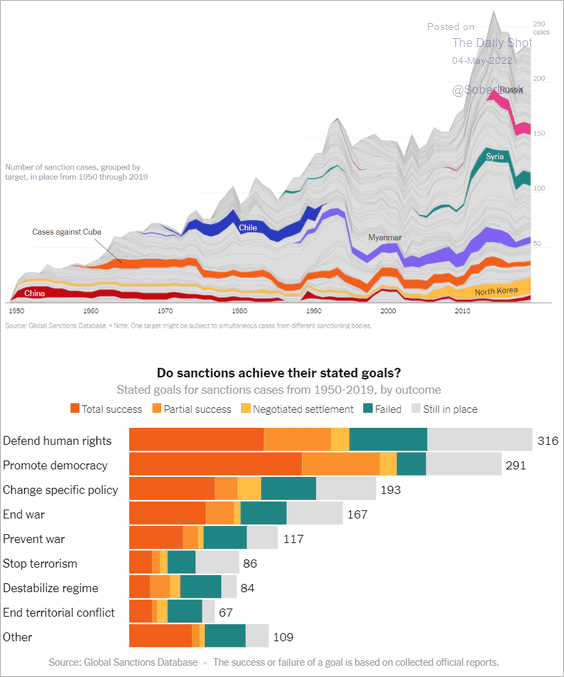 Source: @WSJ Read full article
6. The rebound in CO2 emissions:
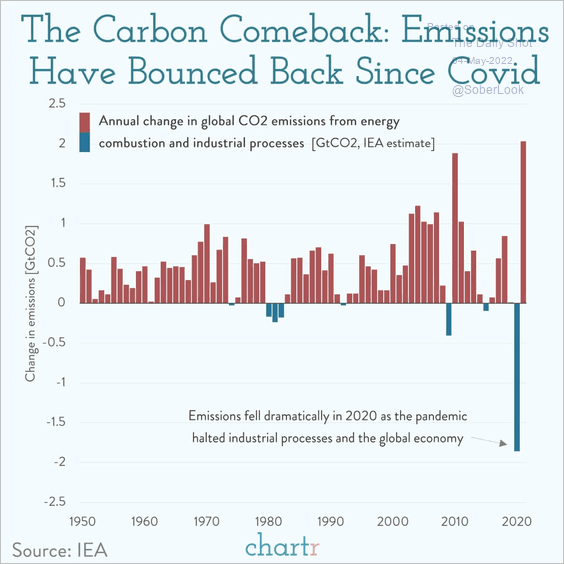 Source: @chartrdaily
7. Political ideology by birth cohort:
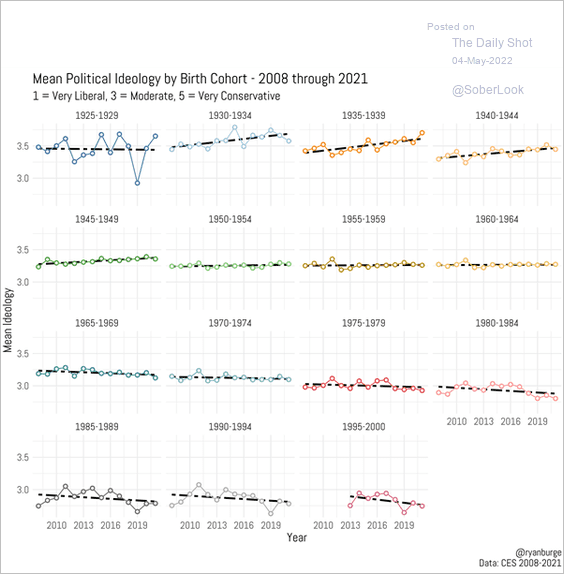 Source: @ryanburge
8. How long did you wait?
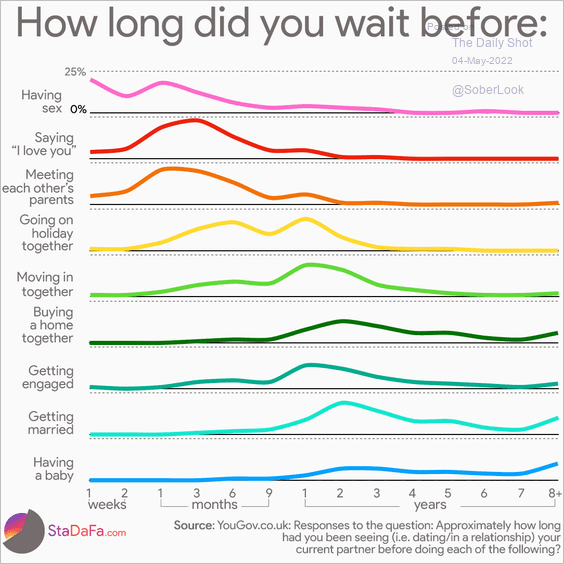 Source: Statistics_Data_Facts Read full article
How long should you wait?
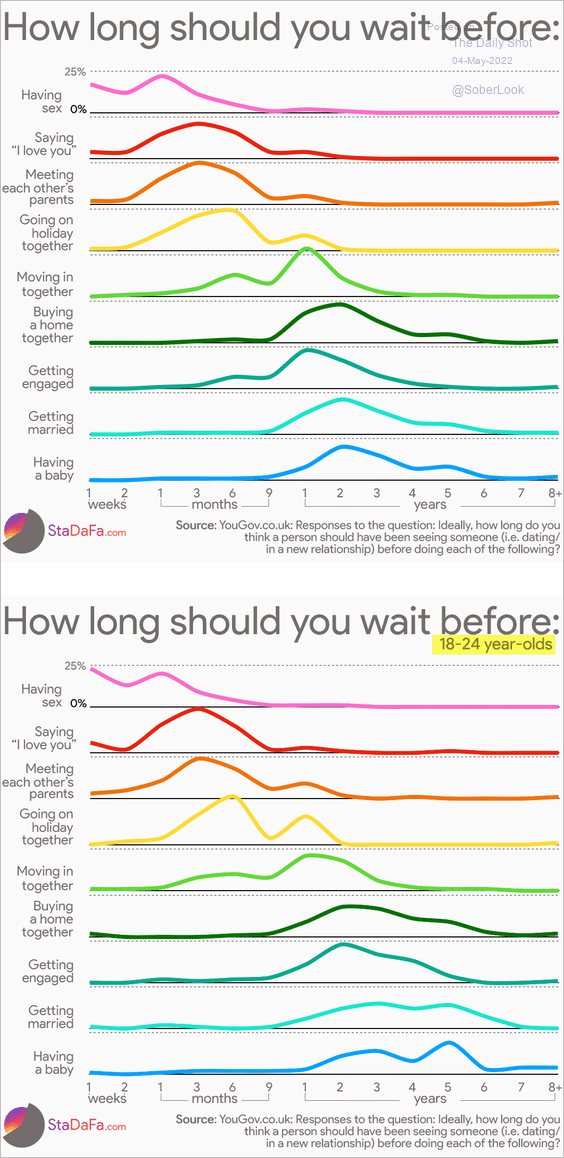 Source: Statistics_Data_Facts Read full article
——————–
Back to Index