
The Daily Shot: 10-May-22
• Equities
• Credit
• Rates
• Commodities
• Energy
• Cryptocurrency
• Emerging Markets
• China
• Australia
• The Eurozone
• Canada
• The United States
• Global Developments
• Food for Thought
Equities
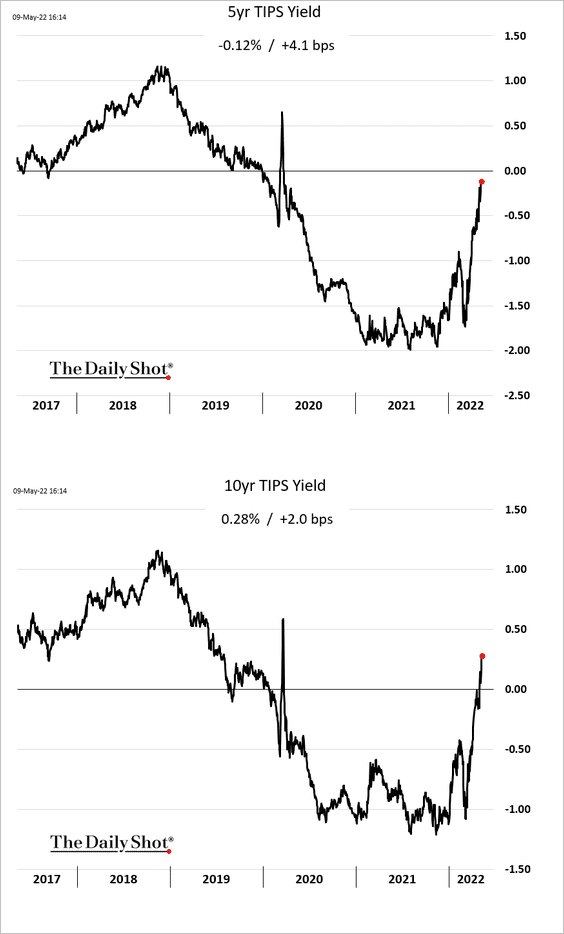
1. Rising real yields continued to put pressure on growth stocks on Monday.
• The current quarter’s underperformance of growth vs. value stocks is the worst since the dot-com bubble.
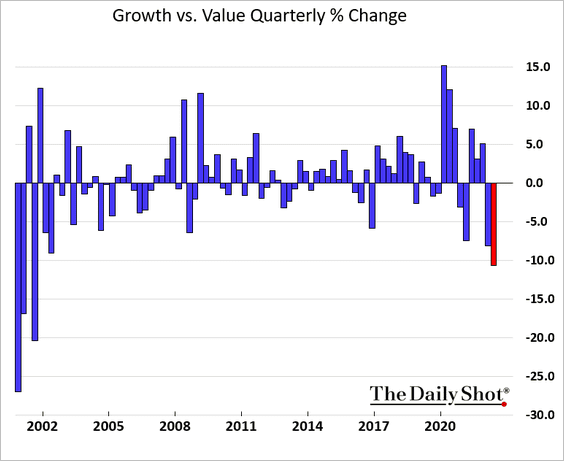
• More room to go?
 Source: Hugo Ste-Marie, Portfolio & Quantitative Strategy Global Equity Research, Scotia Capital
• The current drawdown in the Nasdaq Composite and Nasdaq 100 indices is approaching the COVID shock.
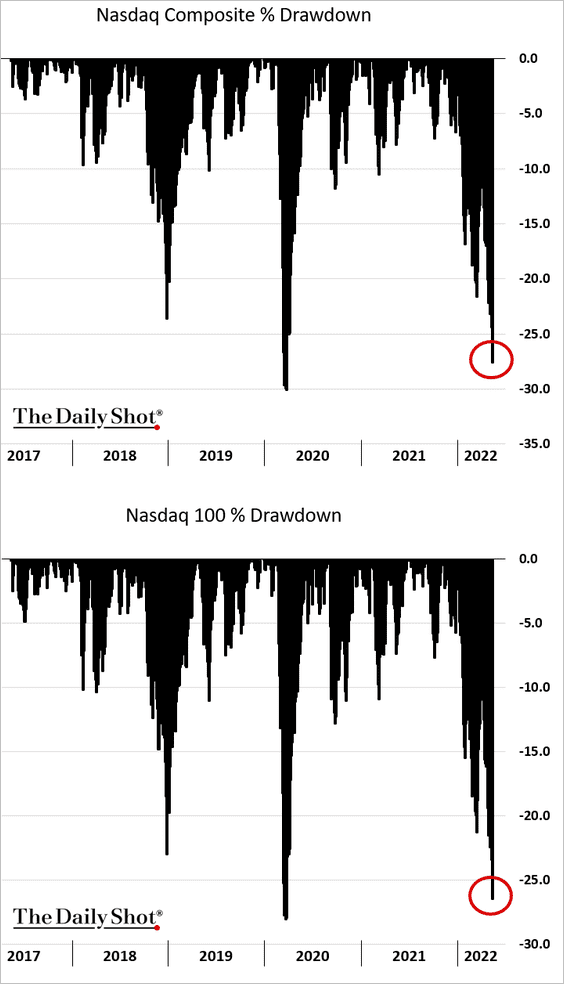
• Speculative growth shares had the worst day since early 2020. It feels like capitulation.
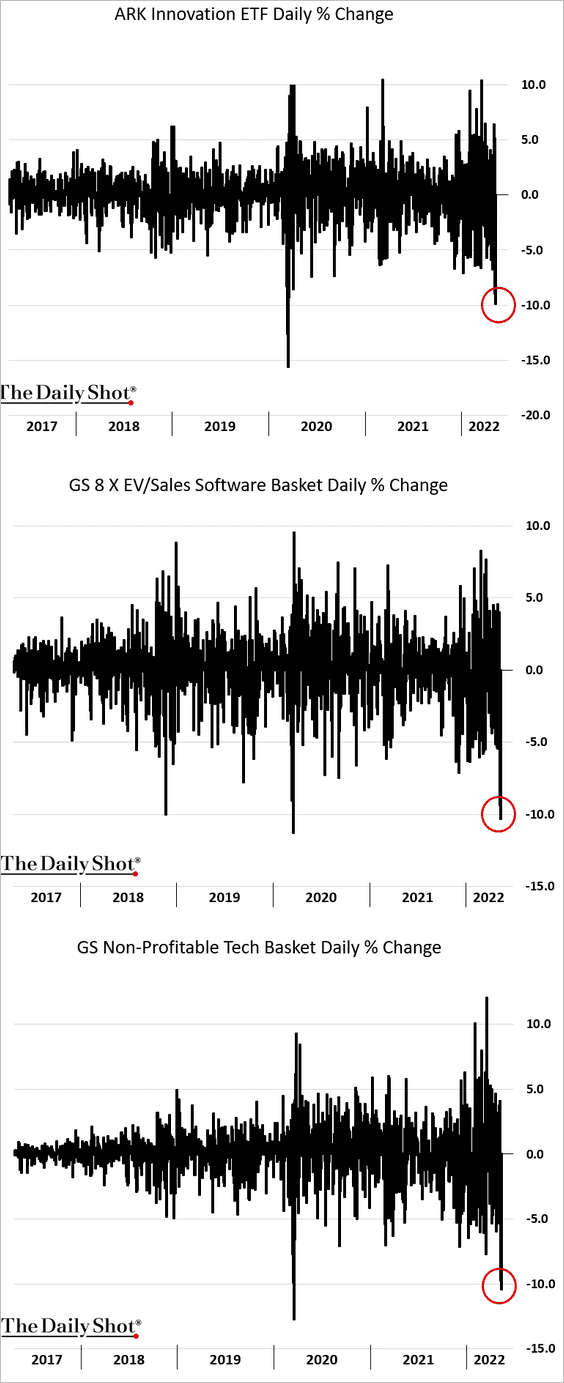
ARK Innovation has given up all of its outperformance.
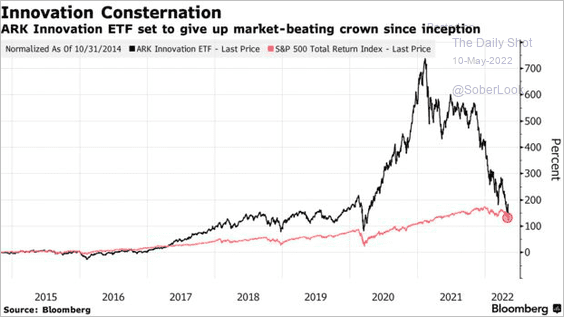 Source: @markets Read full article
——————–
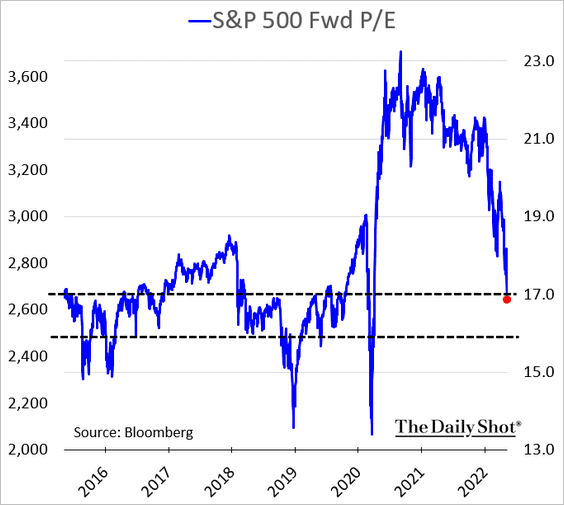
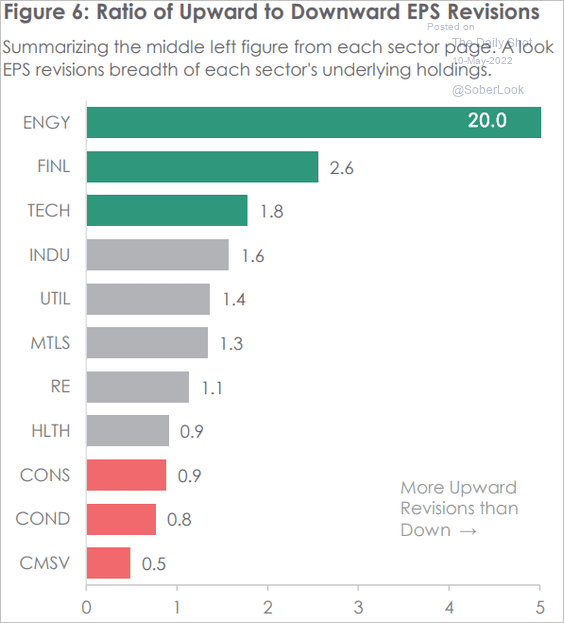
2. The S&P 500 forward P/E ratio went through the 17x support level. Market participants are increasingly skeptical about consensus earnings estimates.
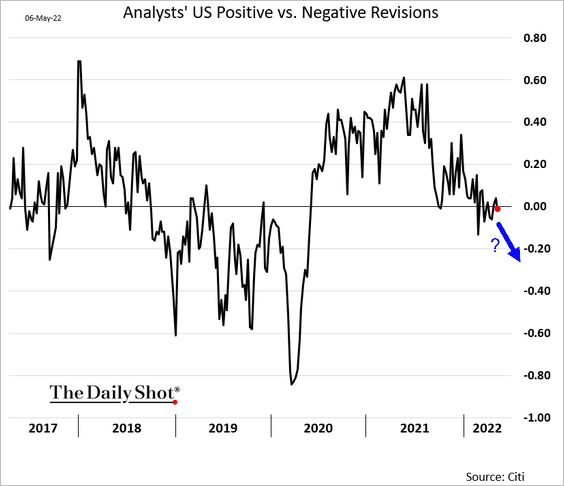
The balance of earnings revisions has been flat lately. Will we see it turn lower?
Here is the ratio of upward to downward EPS revisions by sector over the last three months.
 Source: MarketDesk Research
——————–
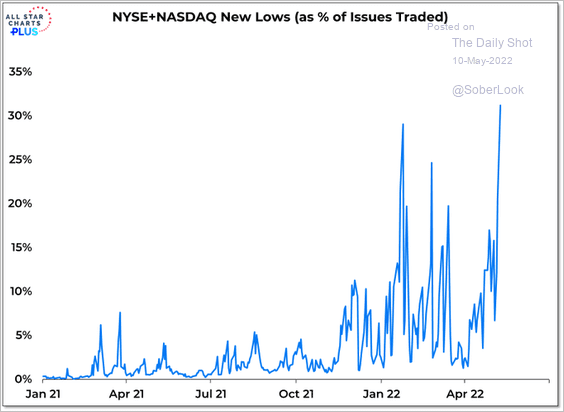
3. There are a lot of new lows.
 Source: @WillieDelwiche
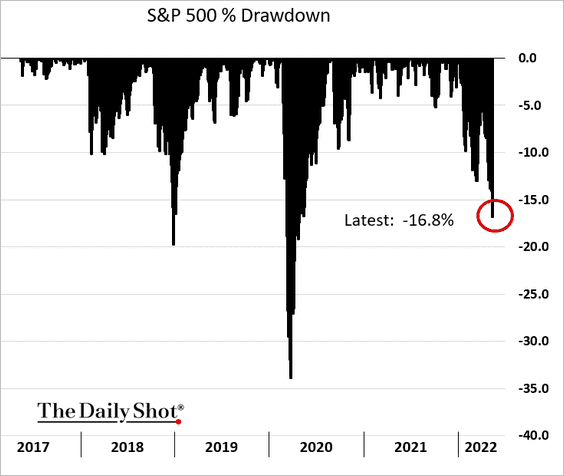
4. The S&P 500 is some 11% below its 200-day moving average.

We are about 3% away from the official bear market label.
Bear market next year (when the fed funds rate moves into restrictive territory)?
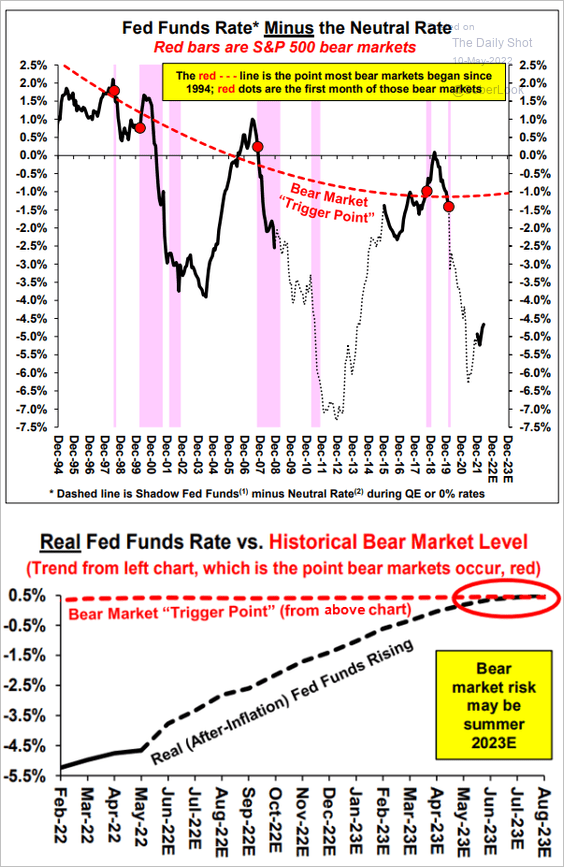 Source: Stifel
——————–
5. More fools than money?
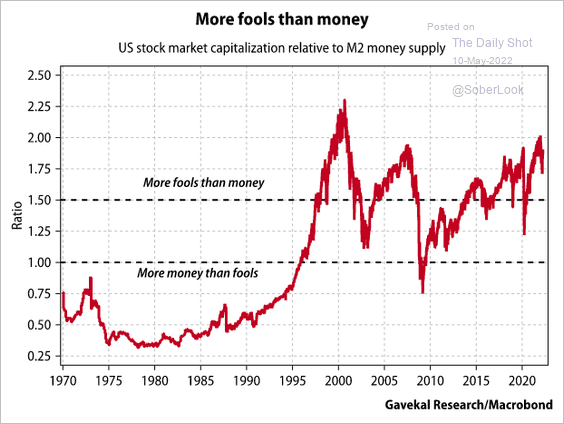 Source: Gavekal Research
6. Historically, the current volatility represents a more “typical” market behavior.
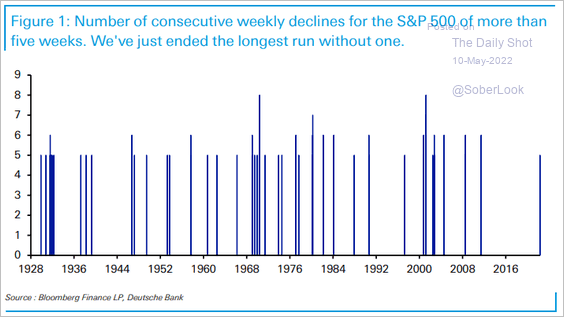 Source: Deutsche Bank Research
7. The Nasdaq Composite is exhibiting a similar topping pattern to the Dec. 2015 rate hike, which was reversed relatively quickly.
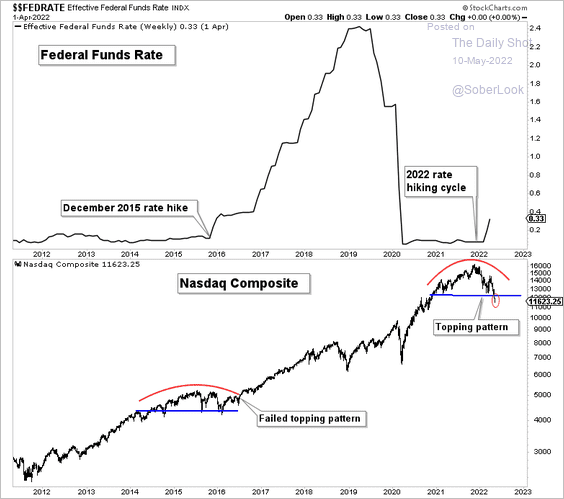 Source: Aazan Habib; Paradigm Capital
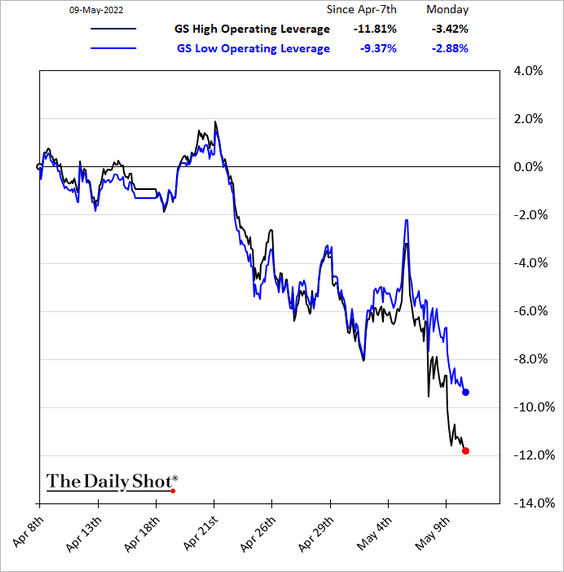
8. Companies with low operating leverage have been outperforming in recent days.
Back to Index
Credit
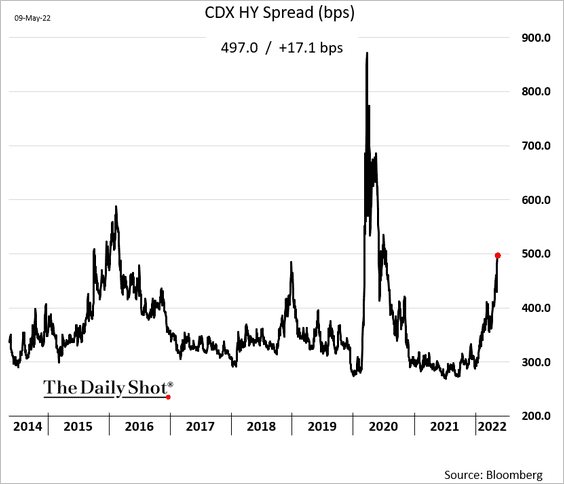
1. Corporate credit markets are under pressure.
• HY CDX spread:
• IG bond selloff:
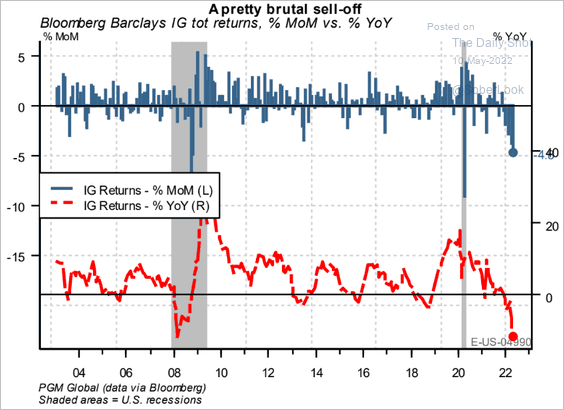 Source: PGM Global
2. Unlike the COVID shock, the current selloff doesn’t discriminate.
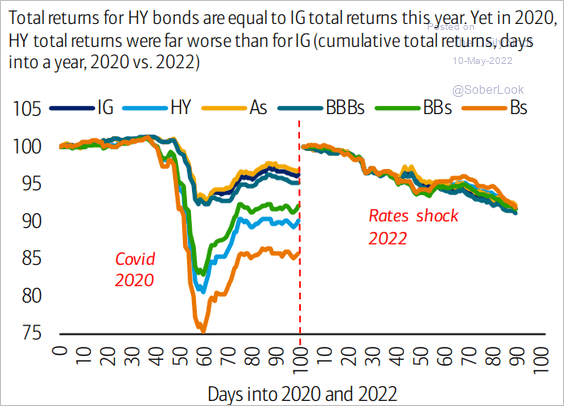 Source: @bondvigilantes, @BankofAmerica
3. More room for the CCC-BB spread to widen?
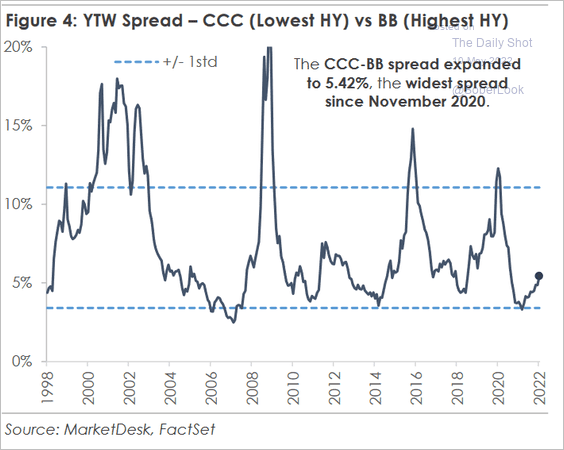 Source: MarketDesk Research
4. Foreign ownership of US corporate bonds has been declining.
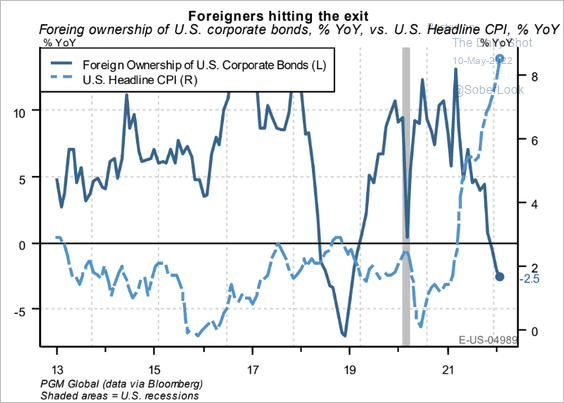 Source: PGM Global
Back to Index
Rates
1. The correlation between the copper/gold ratio and the 10-year Treasury yield is breaking down.
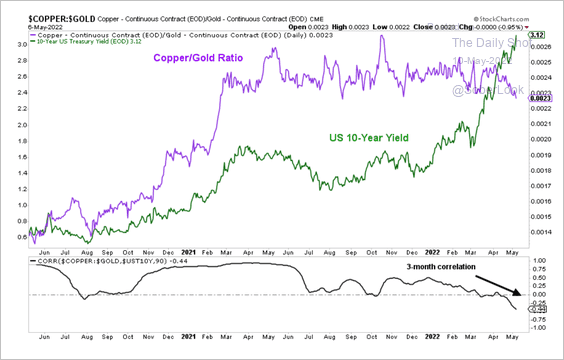 Source: Aazan Habib; Paradigm Capital
2. With rapidly slowing refi activity, the Fed will be forced to sell MBS debt outright (2 charts).
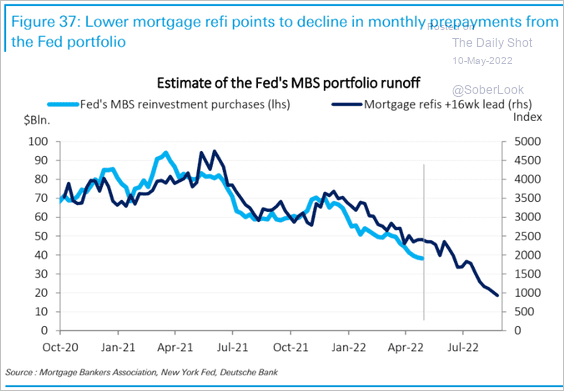 Source: Deutsche Bank Research
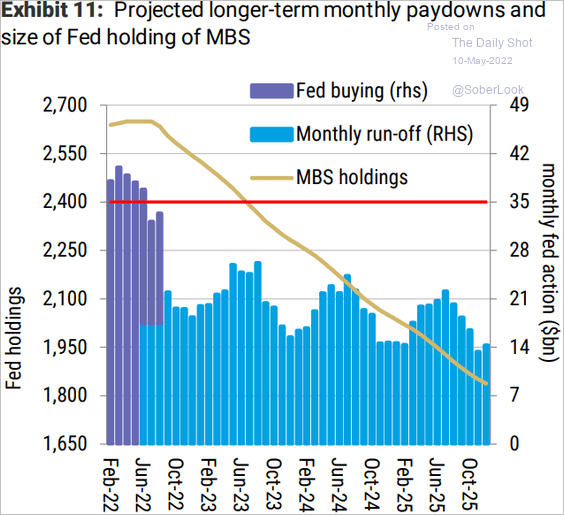 Source: Morgan Stanley Research
——————–
3. Will institutions reduce their portfolio durations further?
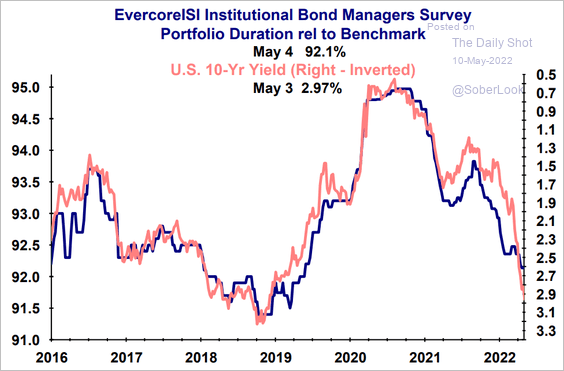 Source: Evercore ISI Research
Back to Index
Commodities
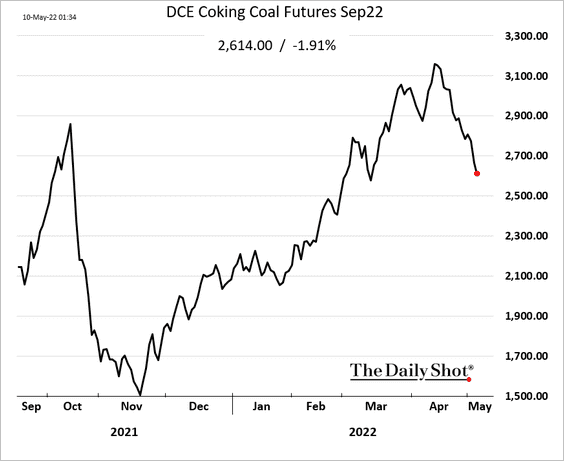
1. Iron ore continues to tumble amid softer demand from China.

Metallurgical coal is following iron ore lower.
——————–
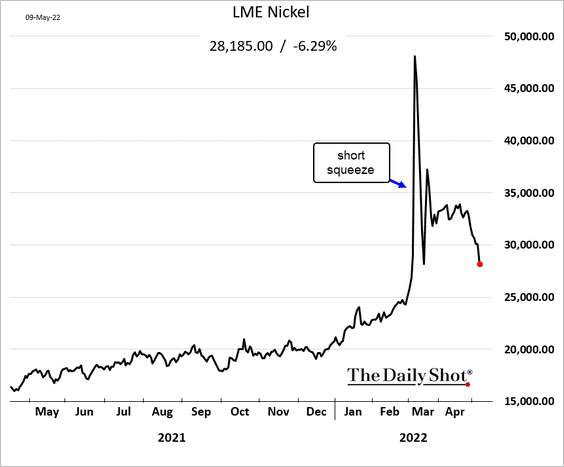
2. Nickel tool a hit in recent days.
3. More downside risks for copper?
 Source: Alpine Macro
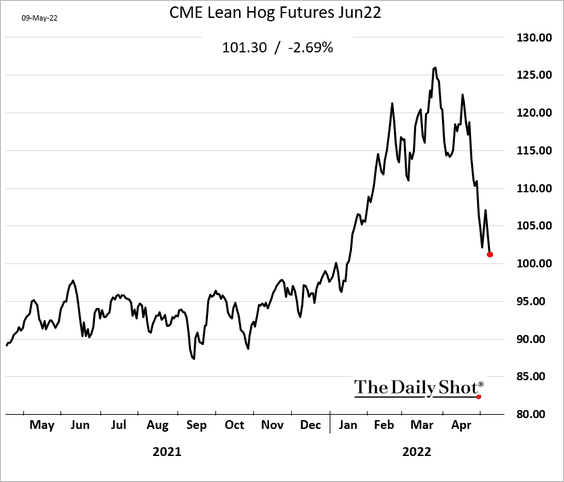
4. Chicago hog futures are tumbling.
Back to Index
Energy
1. Brent crude is holding the uptrend support.
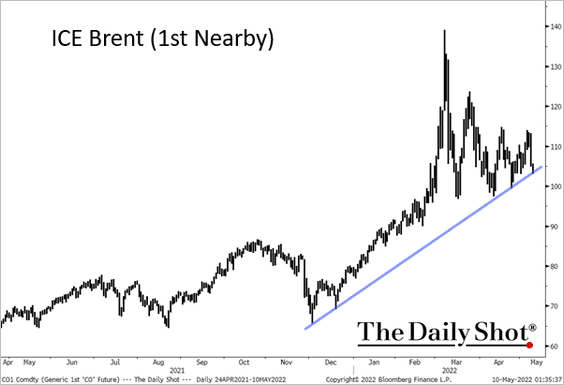 Source: @TheTerminal, Bloomberg Finance L.P.
2. The US showed a big draw from the Strategic Petroleum Reserve.
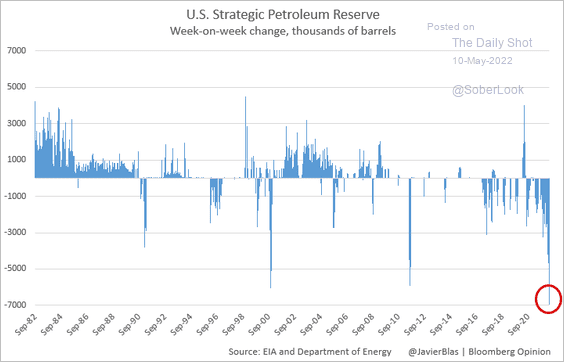 Source: @JavierBlas, @EIAgov
3. Refinery margins are near record levels.
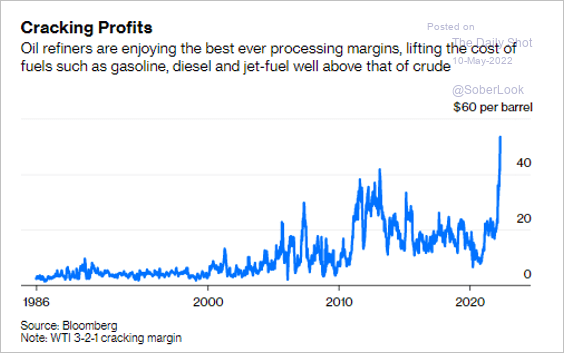 Source: @JavierBlas, @bopinion Read full article
4. Russian crude oil exports are turning lower after the post-invasion spike.
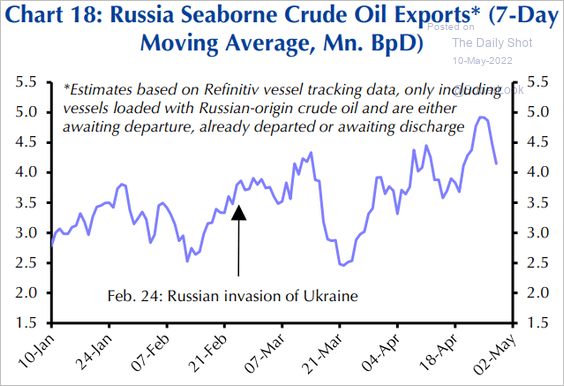 Source: Capital Economics
Seaborn oil dominates Russia’s exports (which could make sanctions more effective).
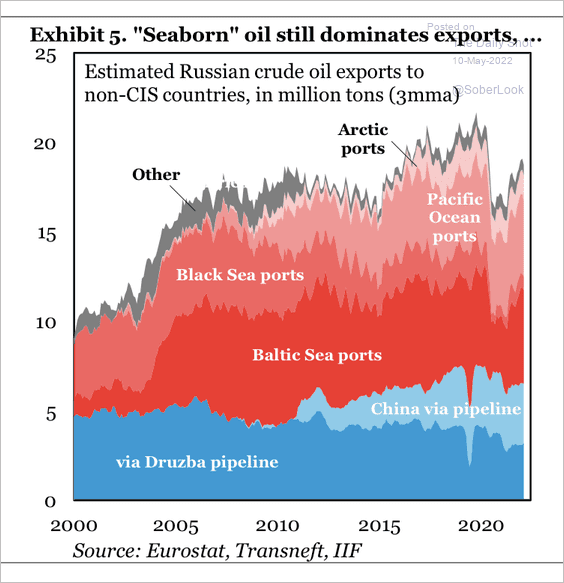 Source: IIF
Back to Index
Cryptocurrency
1. Bitcoin’s Fear & Greed Index entered “extreme fear” territory.
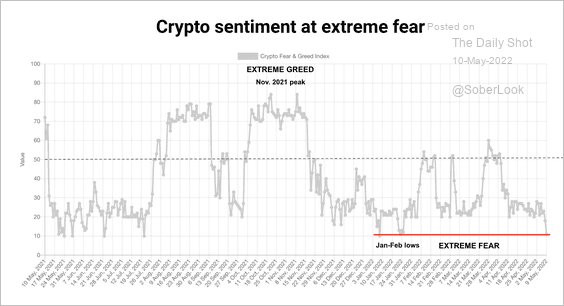 Source: CoinDesk Read full article
2. Bitcoin’s realized price (average cost basis among traders) is currently at $24,300, which could be an important support level.
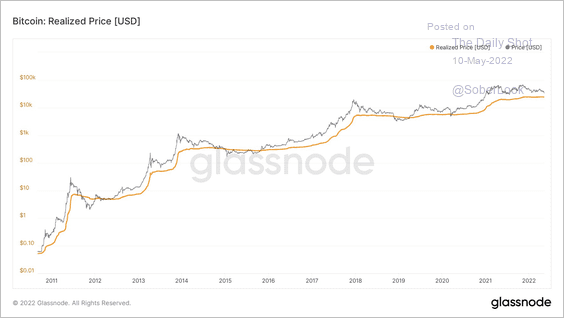 Source: @DylanLeClair_
3. This chart shows bitcoin’s market value relative to its realized value (MVRV), which does not appear oversold.
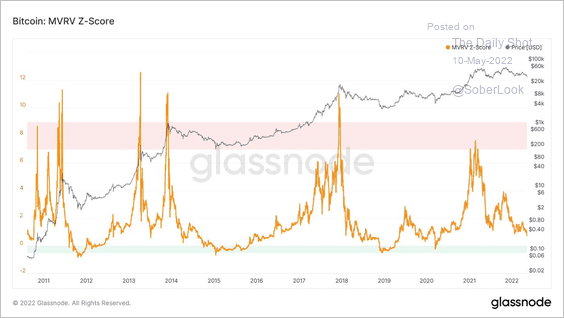 Source: @DylanLeClair_
4. Once again, El Salvador, the first country to make BTC legal tender last year, bought the dip. So far, the crypto venture has been a bust for the impoverished nation.
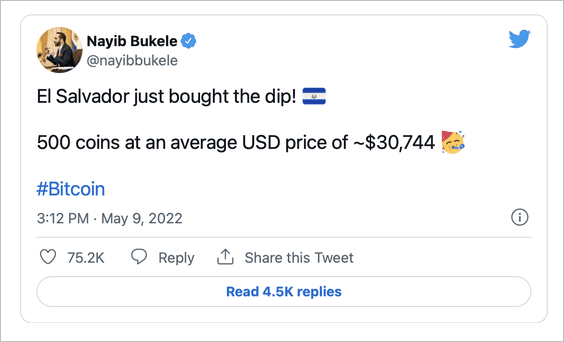 Source: @nayibbukele
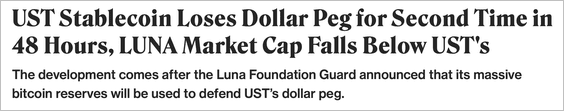
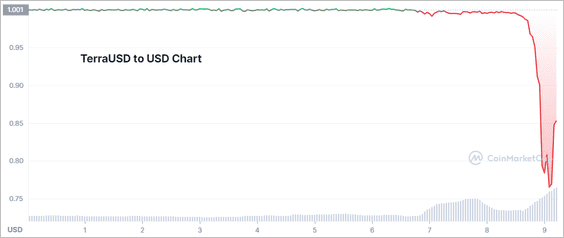
5. The UST stablecoin lost its dollar peg for the second time in three days, increasing the risk of customer redemptions. Welcome to the world of “breaking the buck.”
 Source: CoinDesk Read full article
 Source: CoinDesk Read full article
——————–
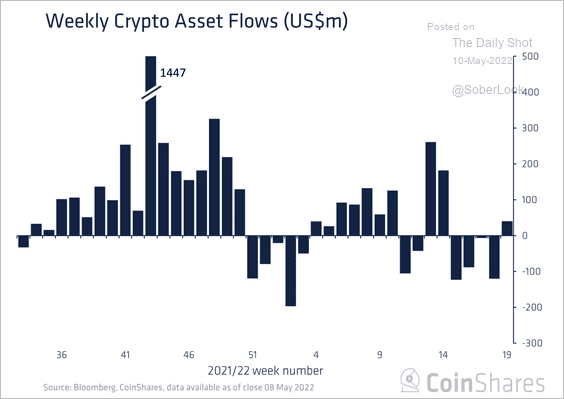
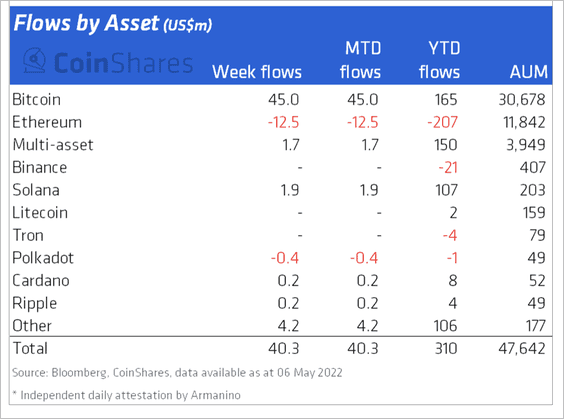
6. Crypto funds saw net inflows over the past week, although short bitcoin funds experienced the second-largest weekly inflows on record over the same period.
 Source: CoinShares Read full article
Ethereum-based funds continue to experience outflows.
 Source: CoinShares Read full article
Back to Index
Emerging Markets
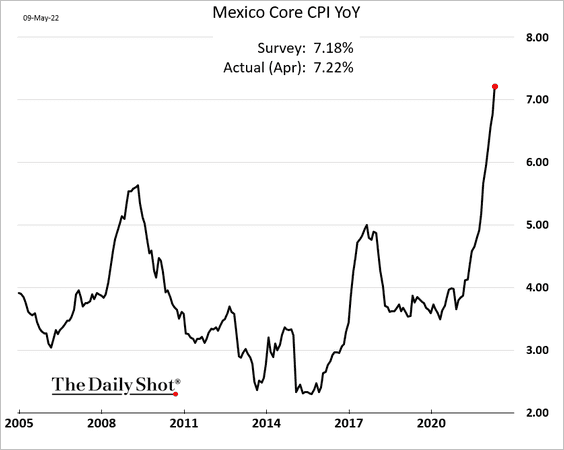
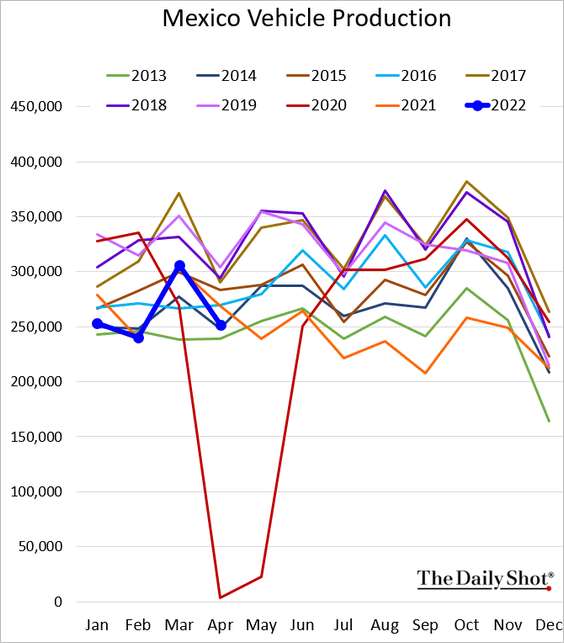
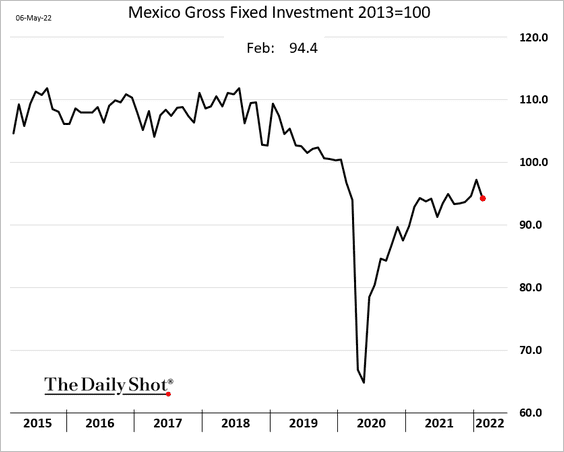
1. Let’s begin with Mexico.
• The core CPI is above 7%.
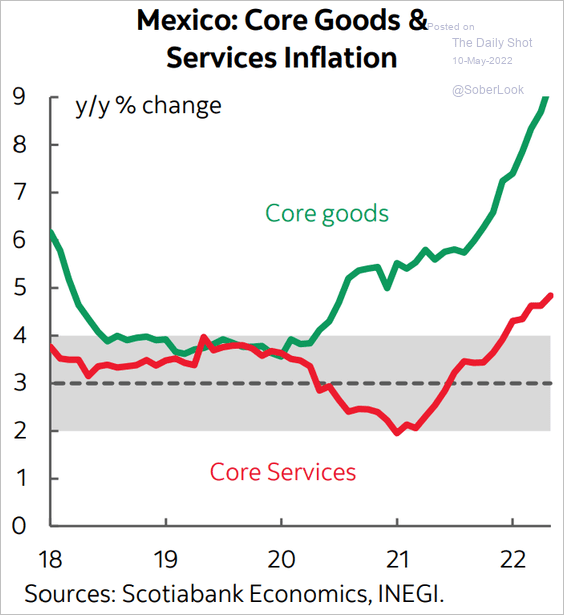 Source: Scotiabank Economics
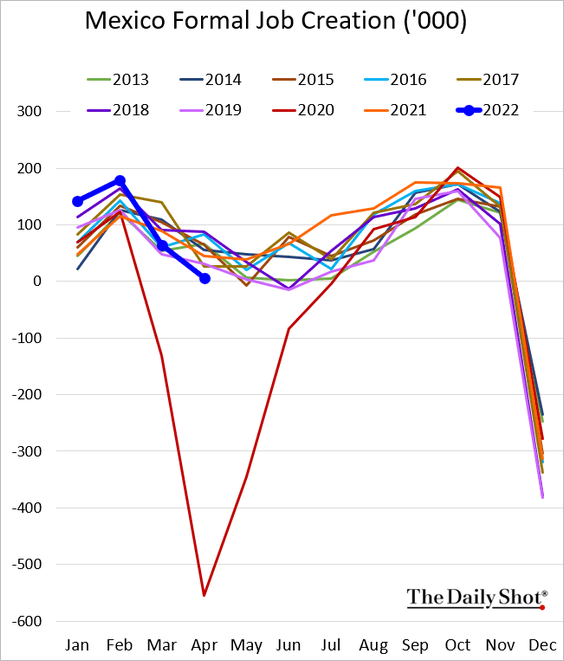
• Formal job creation deteriorated in April.
• Vehicle production is back at 2014 levels.
• Business investment declined in February.
——————–
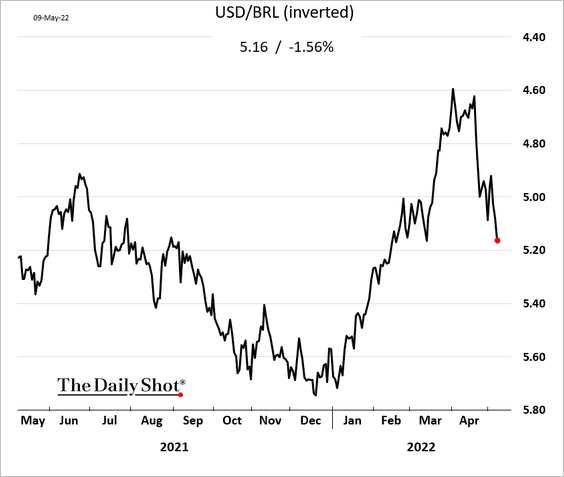
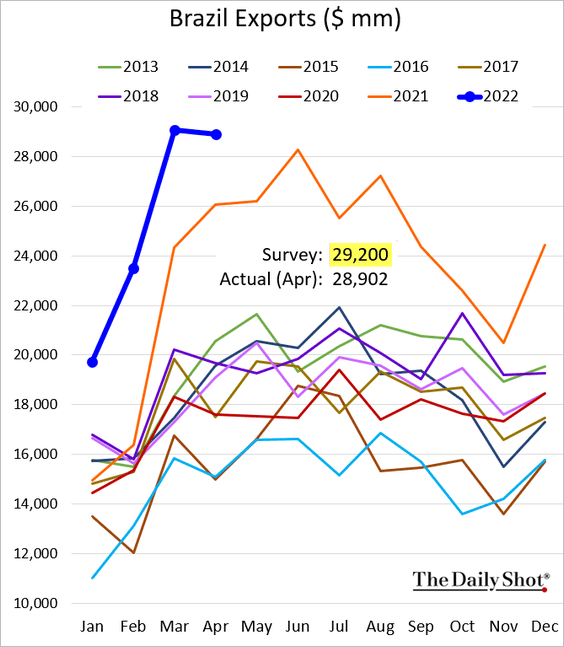
2. The Brazilian real continues to weaken.
Brazilian exports were softer than expected last month.
——————–
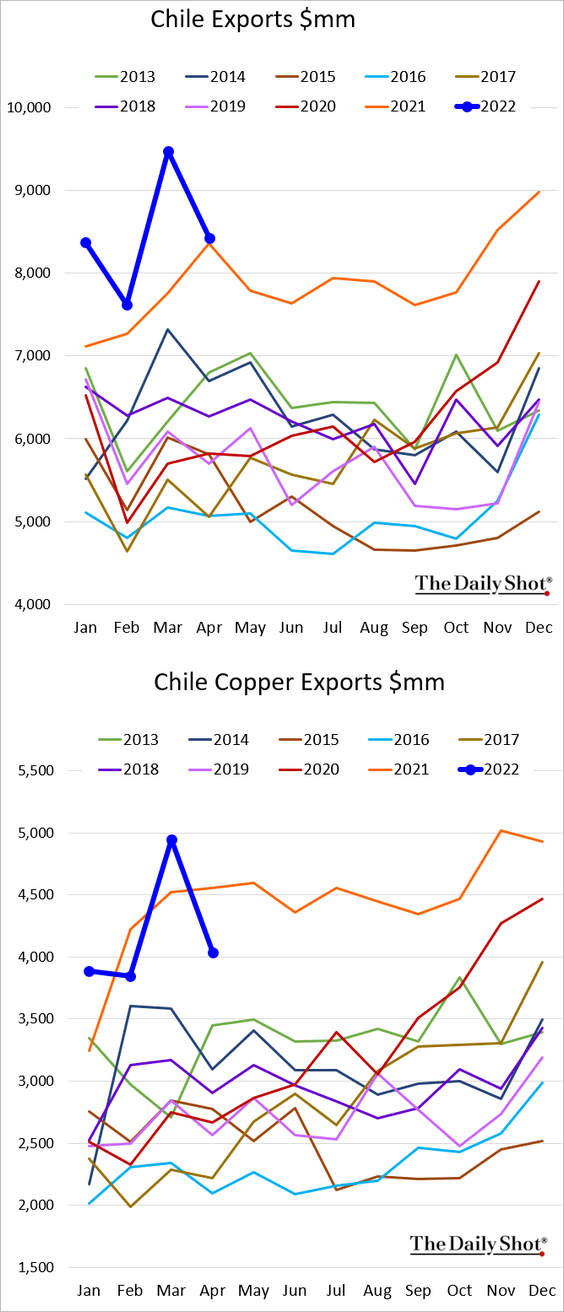
3. Chile’s exports pulled back from the highs.
4. Scotiabank expects inflation to moderate in Brazil and Chile, which could trigger a series of rate cuts (2 charts).
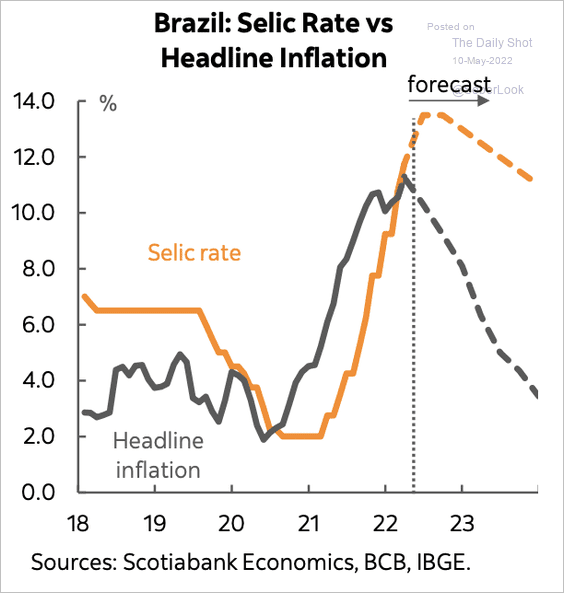 Source: Scotiabank Economics
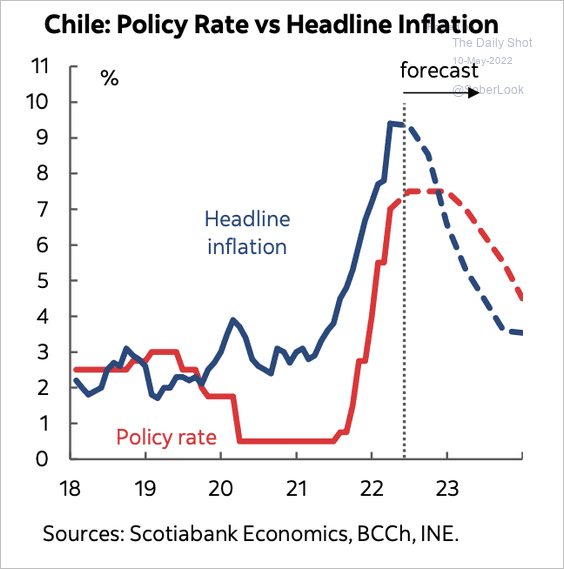 Source: Scotiabank Economics
——————–
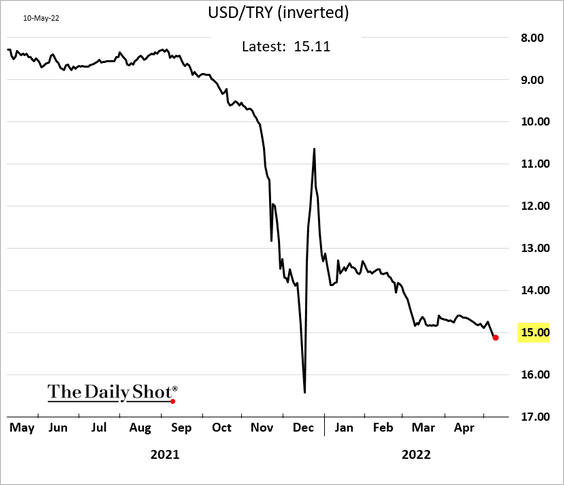
5. The Turkish lira weakened through 15 to the dollar.
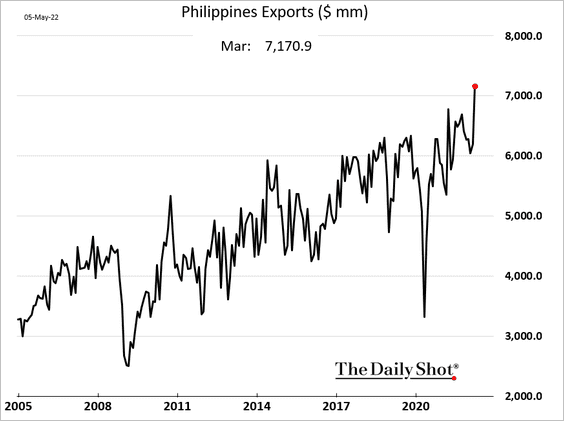
6. Philippine exports hit a record high.
7. With the recent explosion in the US dollar, EM local currency bonds are exhibiting their worst returns since the Global Financial Crisis.
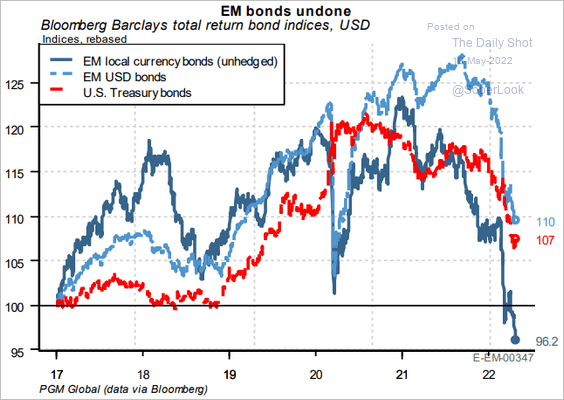 Source: PGM Global
Back to Index
China
1. The decline in steel production and housing starts show no signs of easing.
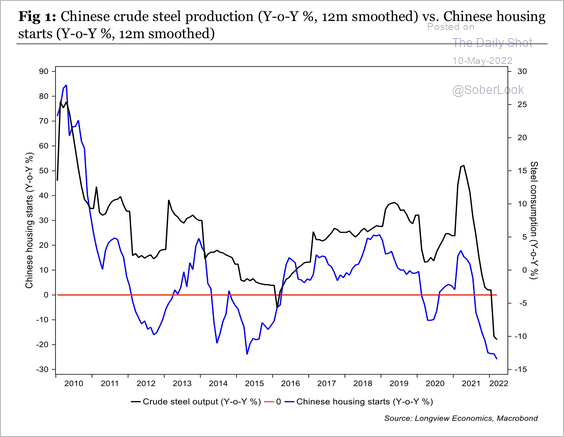 Source: Longview Economics
Developer funding continues to drop.
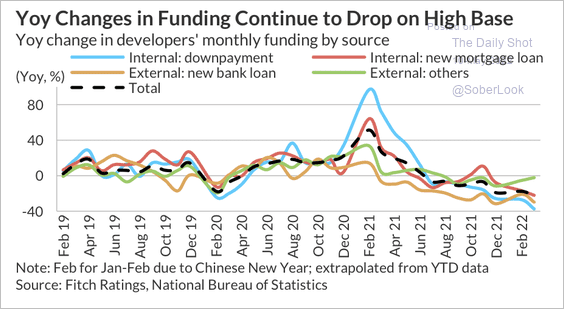 Source: Fitch Ratings
There have been fewer credit downgrades among property developers recently.
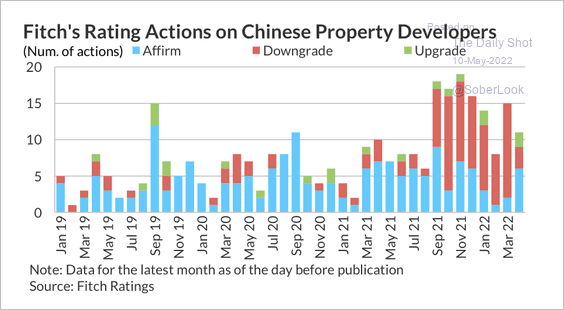 Source: Fitch Ratings
——————–
2. International firms see softer sales in China.
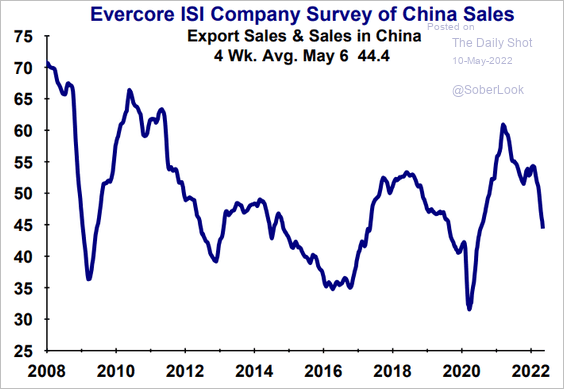 Source: Evercore ISI Research
3. South Korea’s exports illustrate deteriorating domestic demand in China.
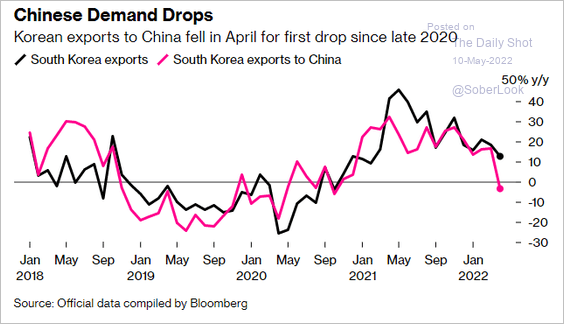 Source: Bloomberg Read full article
Back to Index
Australia
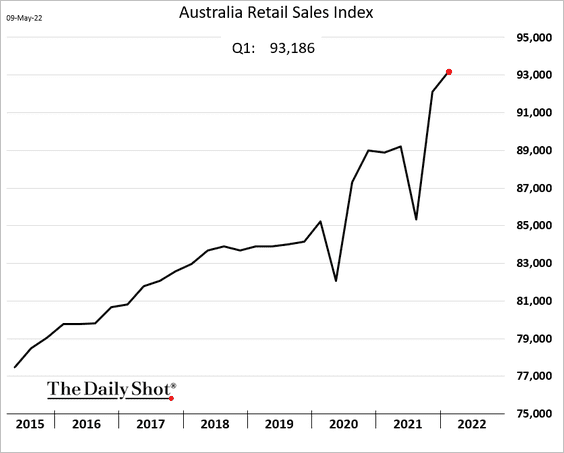
1. Retail sales were robust last quarter.
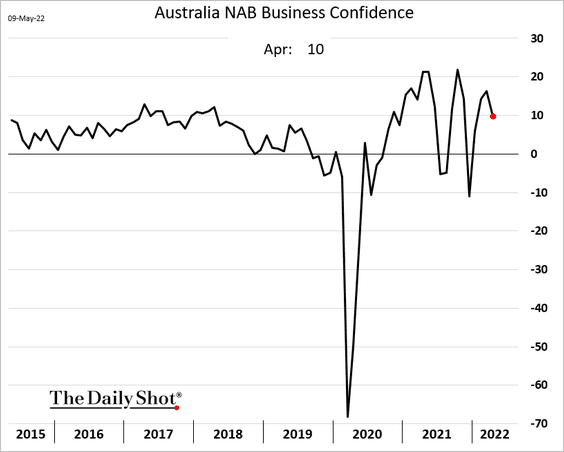
2. Business confidence eased last month.
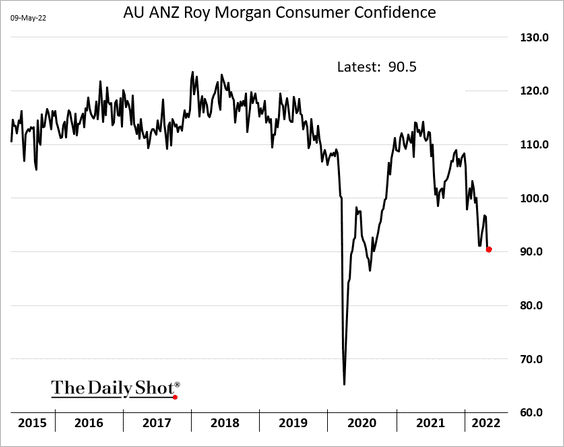
3. Consumer confidence continues to deteriorate.
4. This chart shows the Bloomberg Australia Bond Composite Index at its worst rolling 12-month return since August 1974.
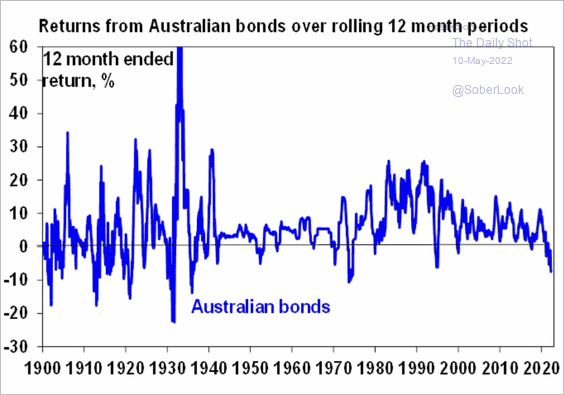 Source: @ShaneOliverAMP
5. China’s share of Australia’s exports has declined over the past year.
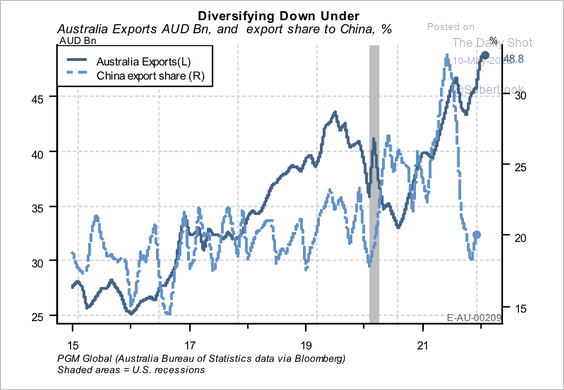 Source: PGM Global
Back to Index
The Eurozone
1. Investor confidence deteriorated further this month.
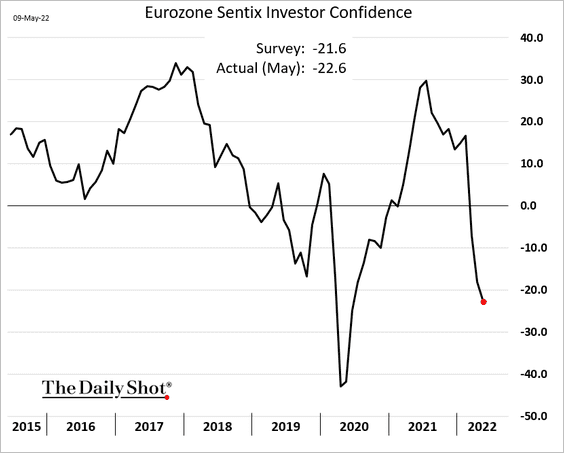
Both soft (chart below) and hard data (2nd chart) point to slower economic growth in the Eurozone.
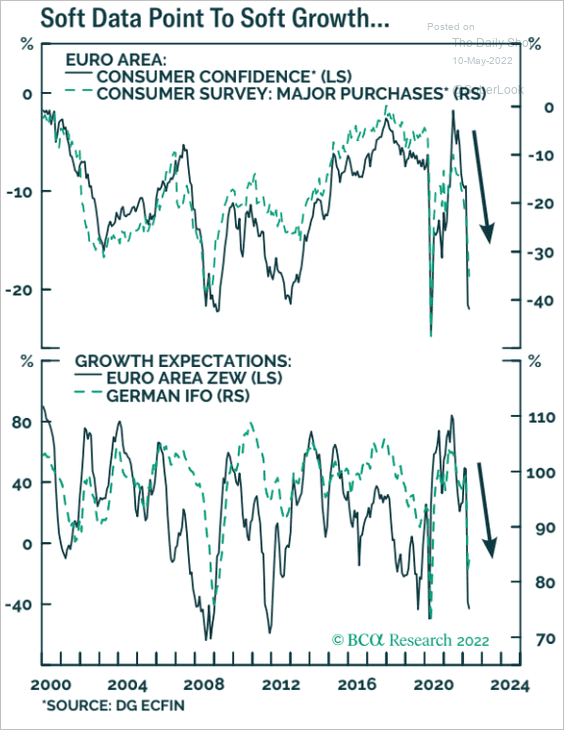 Source: BCA Research
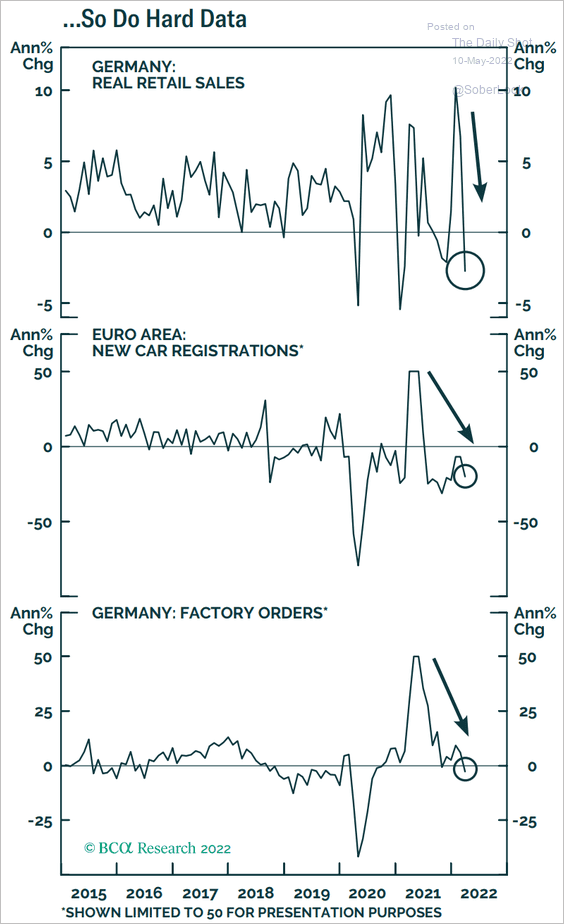 Source: BCA Research
——————–
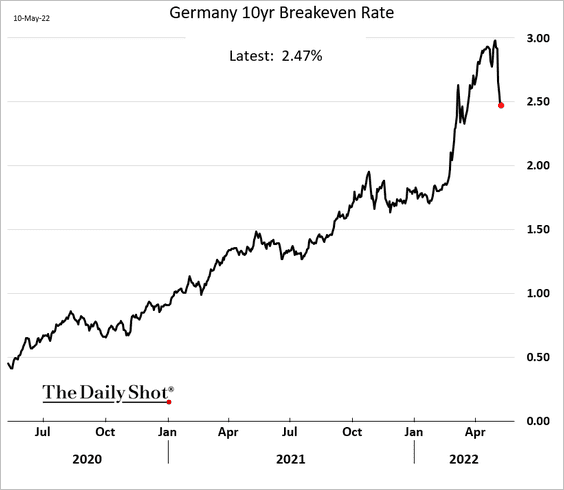
2. German market-based inflation expectations have peaked.
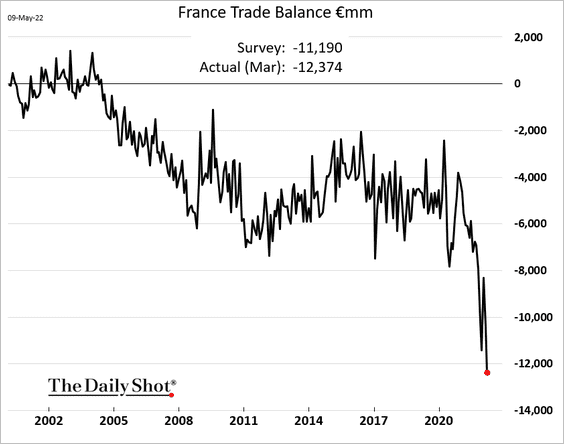
3. The French trade deficit hit a new record as energy prices soared.
But France is running a record surplus in services.
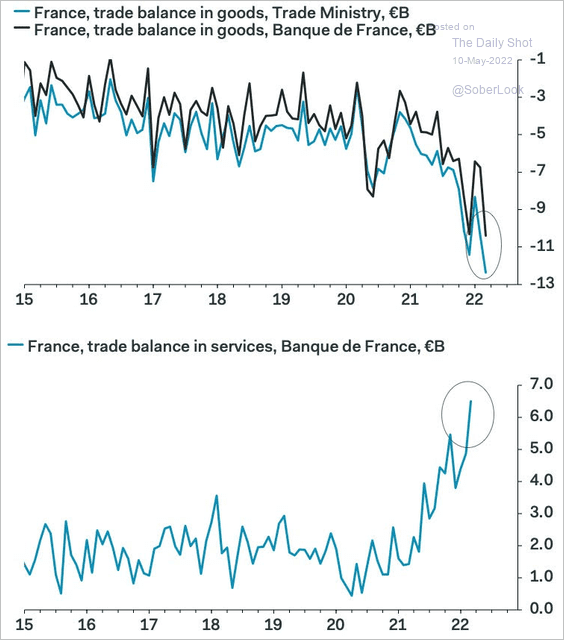 Source: Pantheon Macroeconomics
——————–
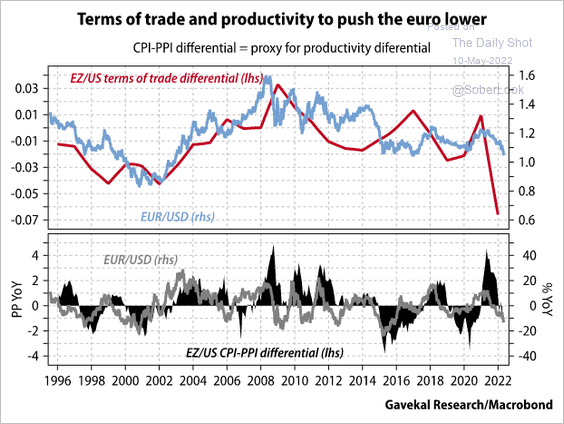
4. The euro faces further downside risks.
 Source: Gavekal Research
Back to Index
Canada
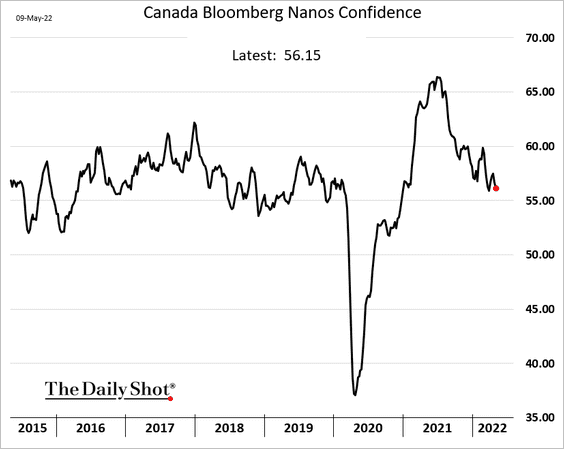
1. Consumer confidence is trending lower.
2. Job searches are picking up, …
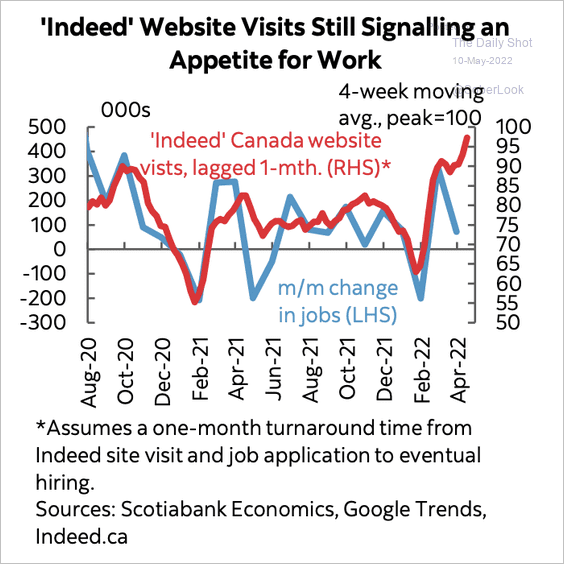 Source: Scotiabank Economics
…and so is the appetite for future hiring.
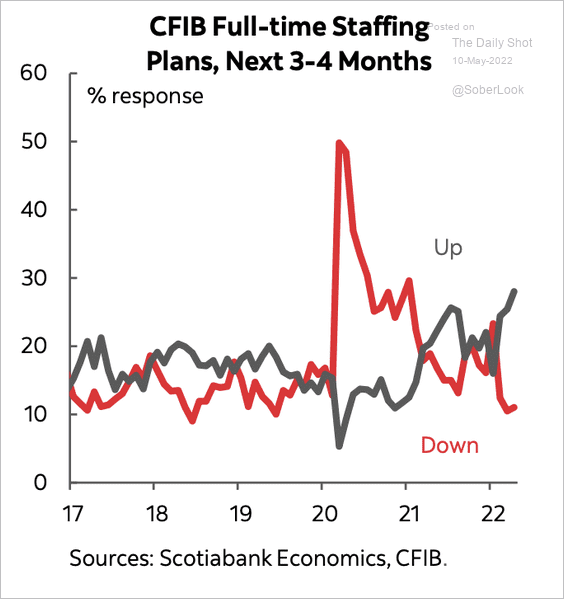 Source: Scotiabank Economics
Back to Index
The United States
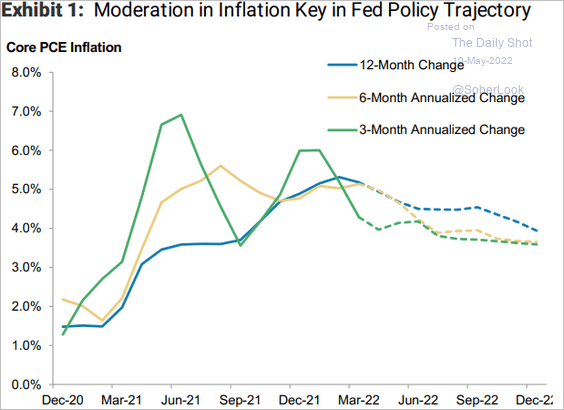
1. Let’s begin with some updates on inflation.
• Nomura expects to see an uptick in the month-over-month CPI change in April, driven by housing.
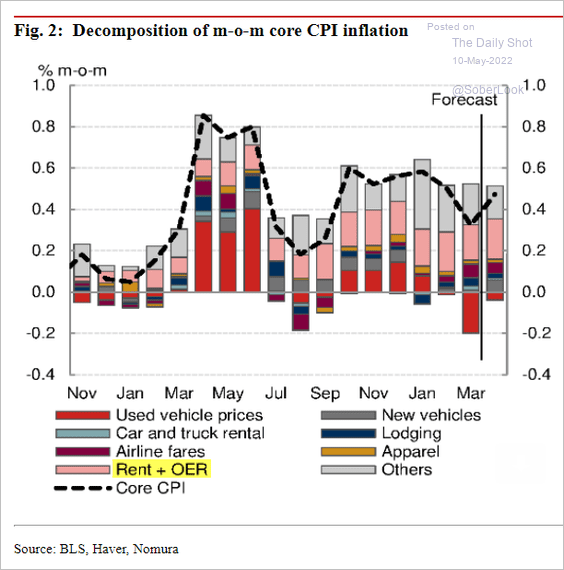 Source: Nomura Securities
Primary rent is expected to be the key contributor to the CPI gain.
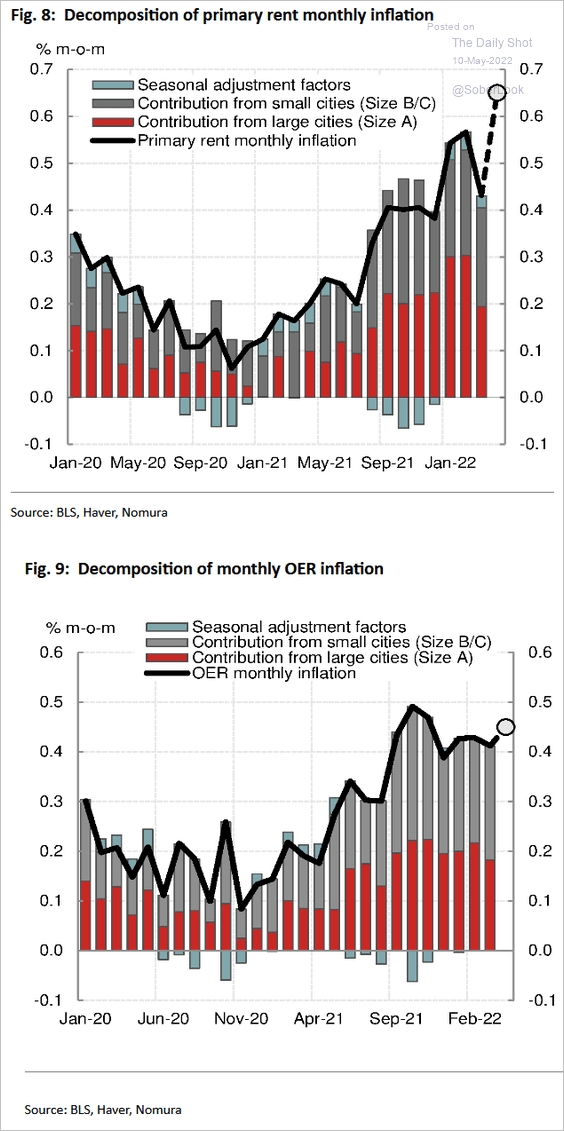 Source: Nomura Securities
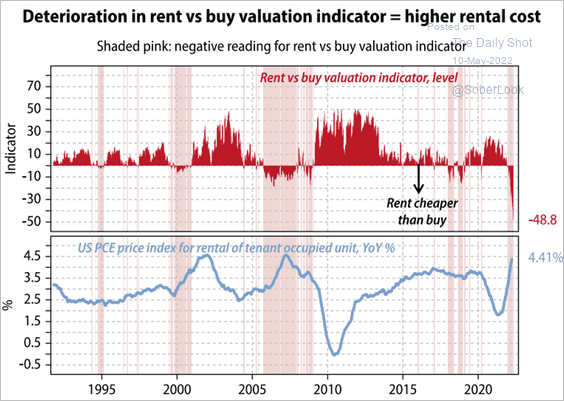
• While supply chain constraints and the global energy crisis are considered less persistent sources of inflation going forward, wage growth and rental prices are two sources that are expected to be more persistent drivers of inflation in 2022 (two charts).
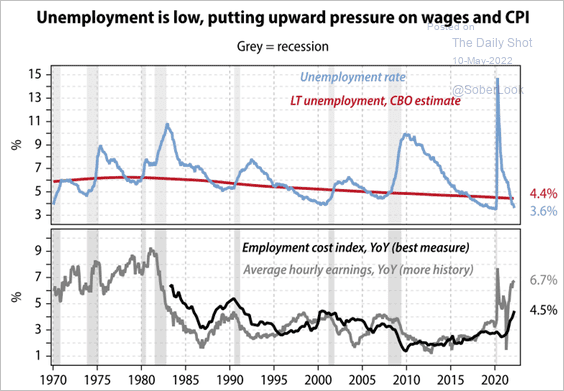 Source: Gavekal Research
 Source: Gavekal Research
• On a year-over-year basis, inflation is expected to soften.
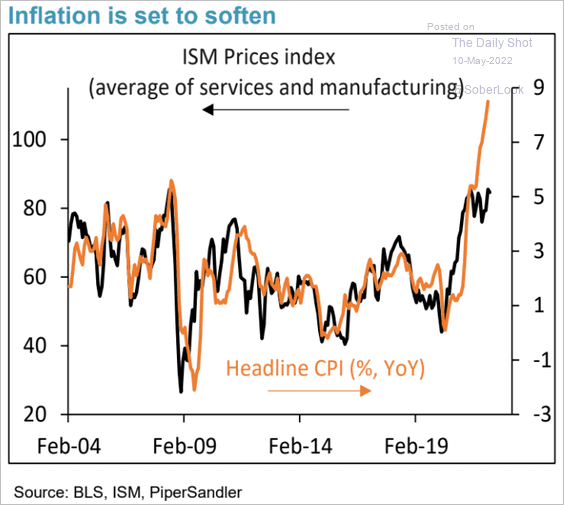 Source: Piper Sandler
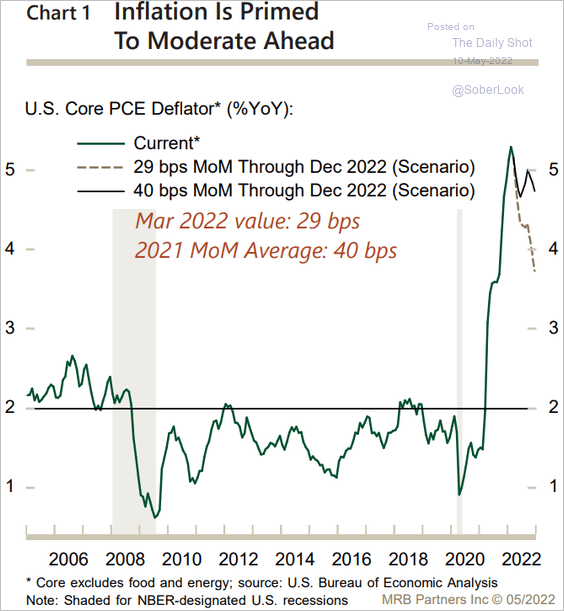 Source: MRB Partners
• Markets are likely to exhibit heightened sensitivity to upcoming inflation prints due to the Fed’s new focus.
 Source: Morgan Stanley Research
• The “untethering” of inflation expectations is a key risk for the Fed.
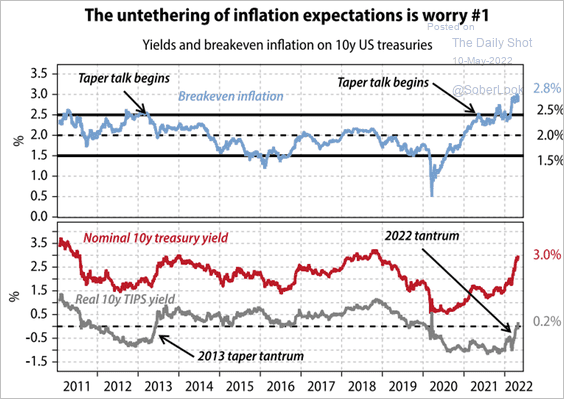 Source: Gavekal Research
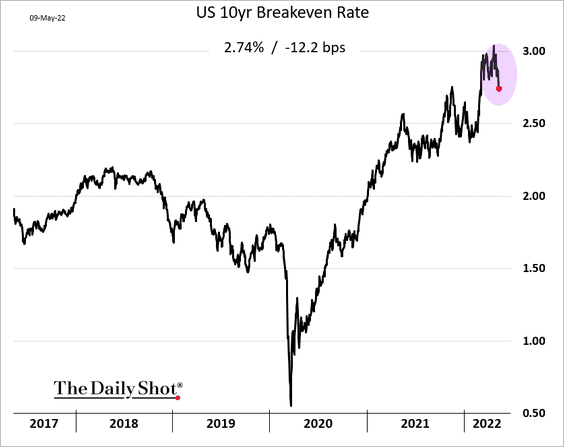
• Market-based inflation expectations moved lower on Monday.
——————–
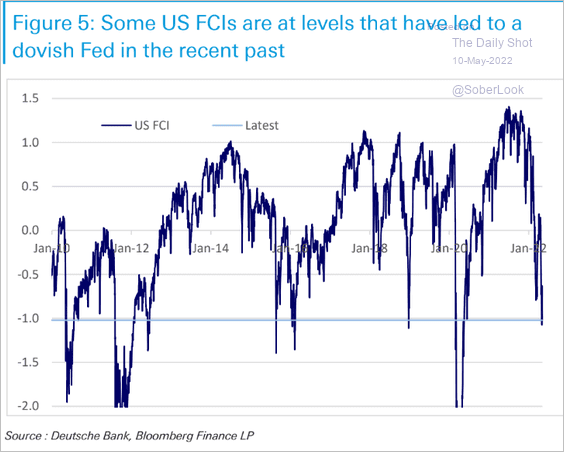
2. The Fed has been successful in tightening US financial conditions through forward guidance.
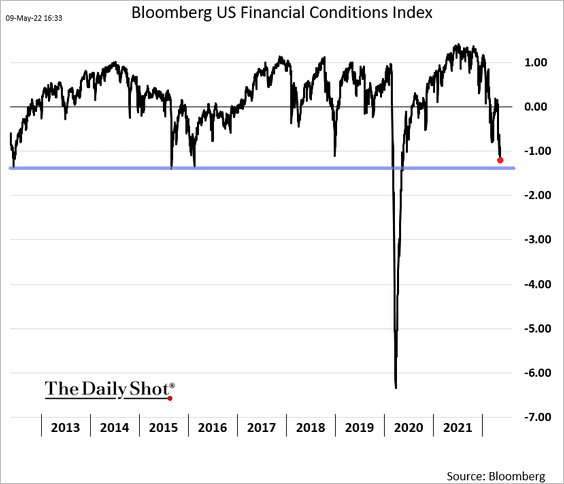
Was the central bank too successful?
 Source: Deutsche Bank Research
——————–
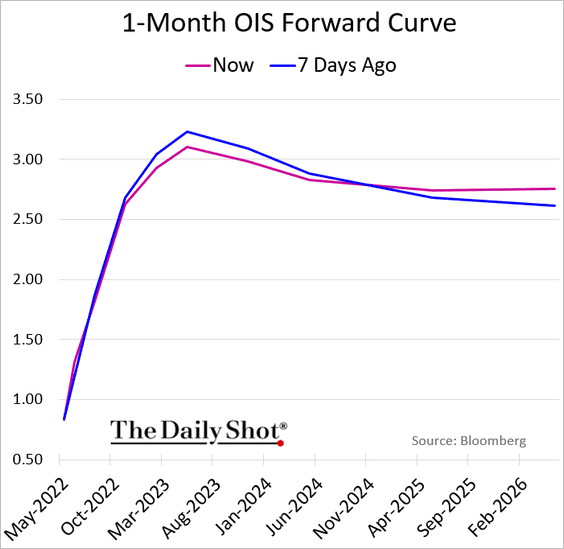
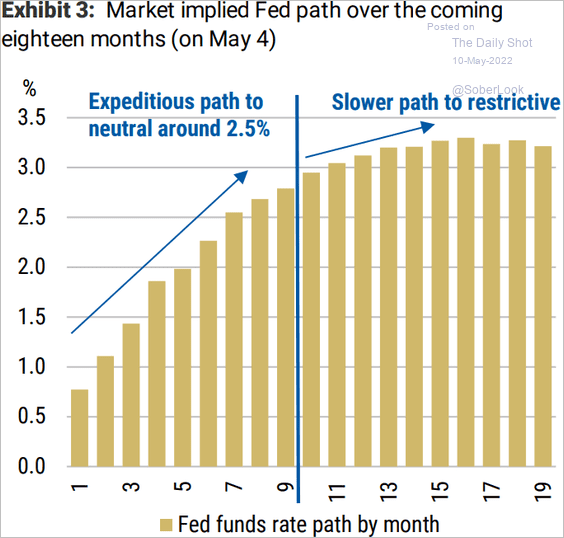
3. Rate hike expectations eased on Monday.
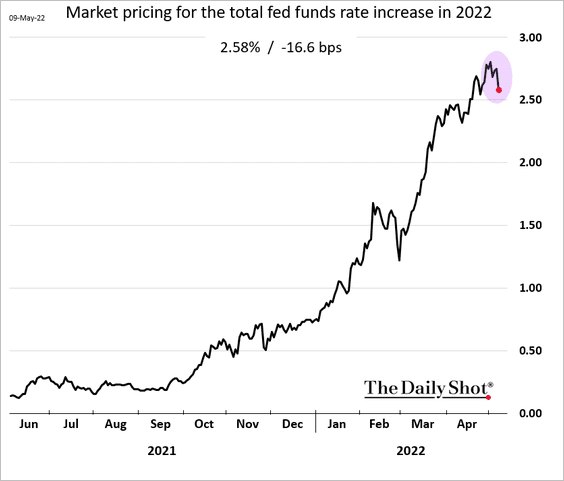
• Here is the market-based trajectory for the fed funds rate.
• The Fed is currently set to “expeditiously” get to neutral by the end of 2022 and move to restrictive monetary conditions in 2023 at a slower pace.
 Source: Morgan Stanley Research
——————–
4. The Evercore ISI industrials survey points to downside risks for the ISM Manufacturing PMI.
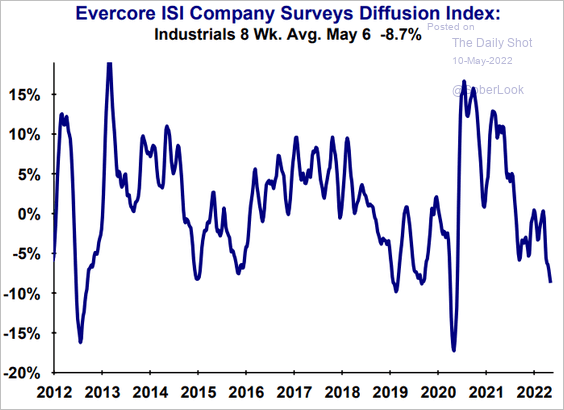 Source: Evercore ISI Research
Back to Index
Global Developments
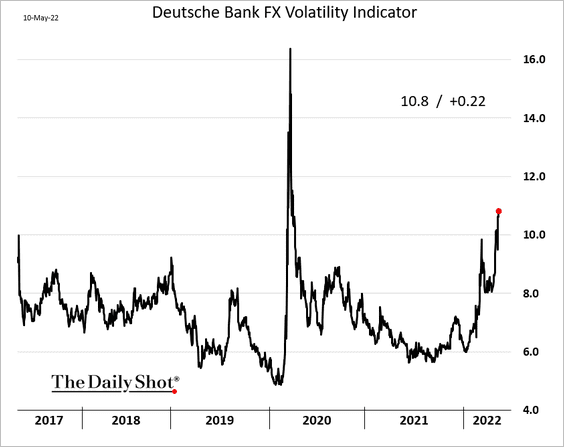
1. Currency market implied volatility is surging.
2. The dollar has seen a top quartile move over the past year, which typically signals further upside for the greenback.
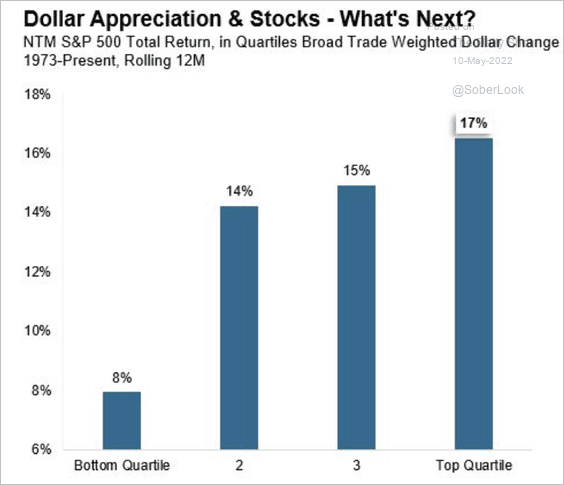 Source: Denise Chisholm; Fidelity Investments
3. Numera Analytics expects global inflation to remain well above trend.
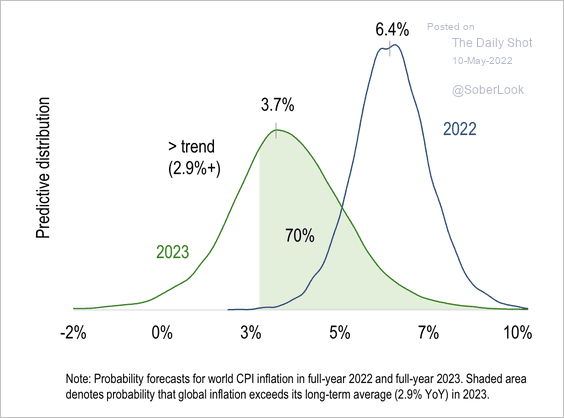 Source: Numera Analytics
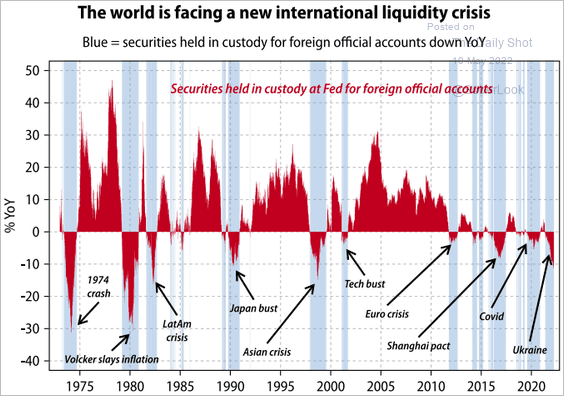
4. Securities held in custody at the Fed on behalf of foreign official accounts have fallen noticeably by 10% over the past year. This reduction in global liquidity has historically coincided with major market adjustments.
 Source: Gavekal Research
——————–
Food for Thought
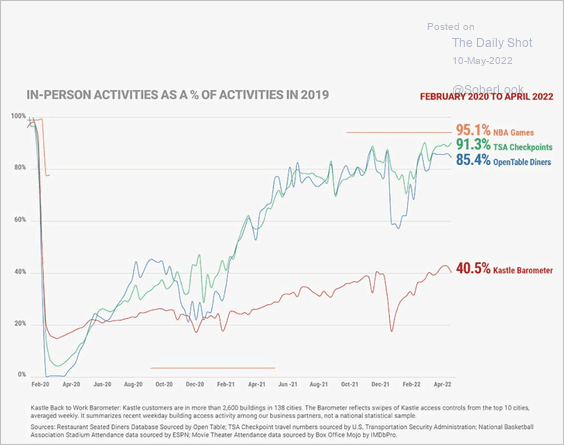
1. The return to normal activity but not to the office:
 Source: Kastle Systems, Bain & Company Read full article
2. Challenges with “free speech” on social media:
 Source: @chartrdaily
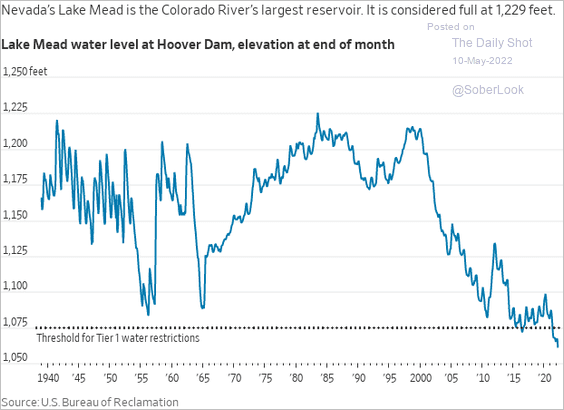
3. Water level at the Hoover Dam:
 Source: @WSJ Read full article
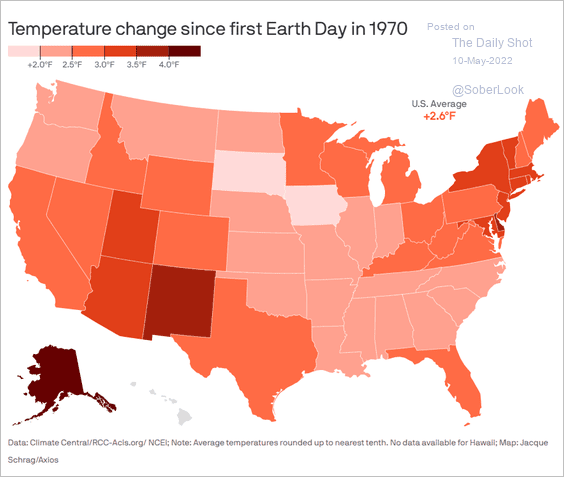
4. Temperature changes since 1970:
 Source: @axios Read full article
5. US work-related visa issuance:
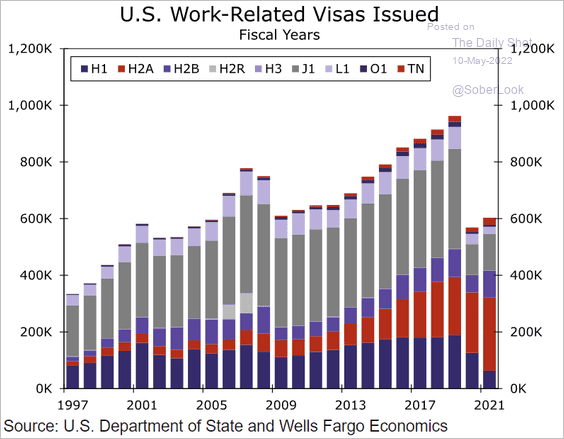 Source: Wells Fargo Securities
6. The US fertility rate:
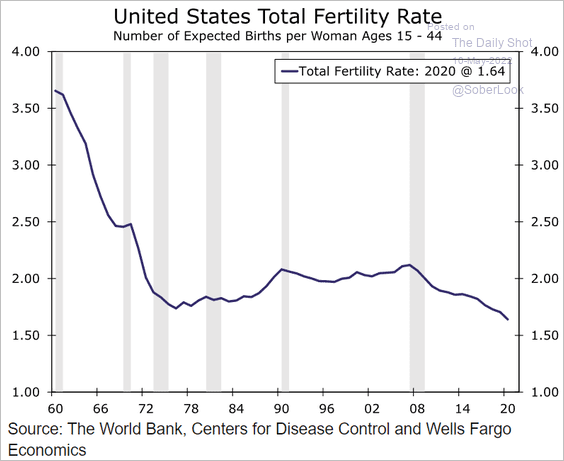 Source: Wells Fargo Securities
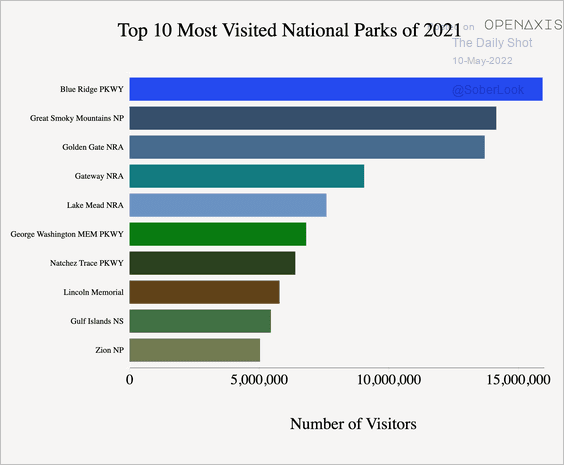
7. Most visited US national parks:
——————–
Back to Index