
The Daily Shot: 16-May-22
• The United States
• The United Kingdom
• The Eurozone
• Europe
• Japan
• China
• Emerging Markets
• Cryptocurrency
• Commodities
• Energy
• Equities
• Alternatives
• Credit
• Rates
• Global Developments
• Food for Thought
The United States
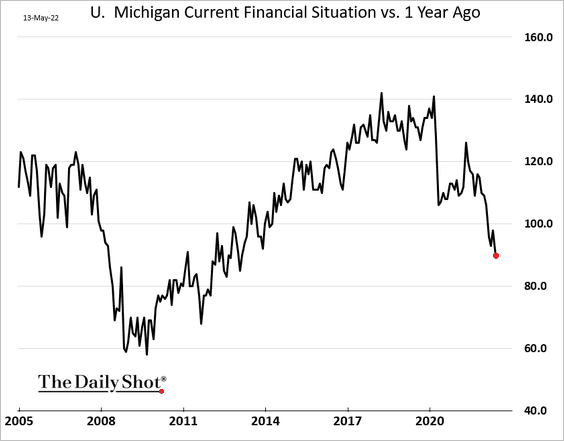
1. The U. Michigan consumer sentiment index dropped to the lowest level since 2011, …
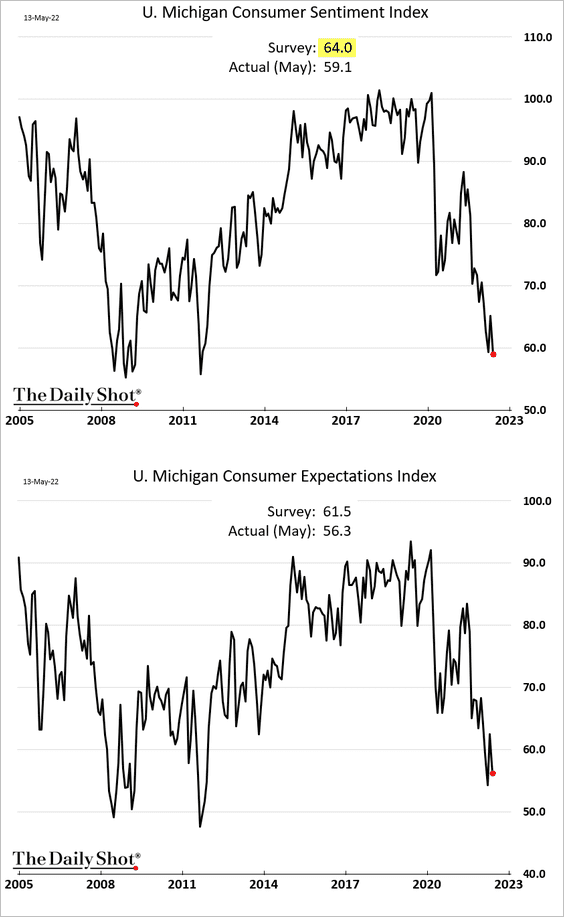
… as gasoline prices hit a record high.
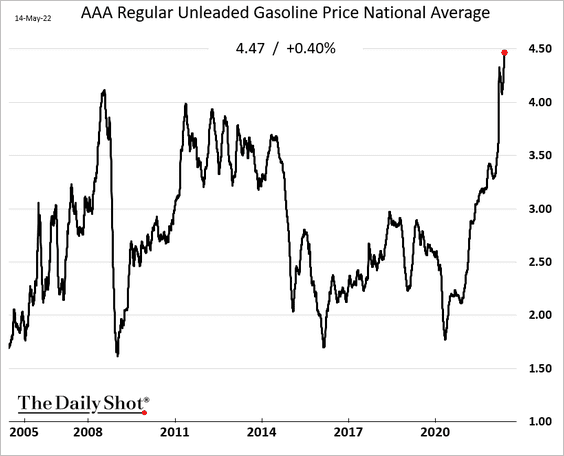
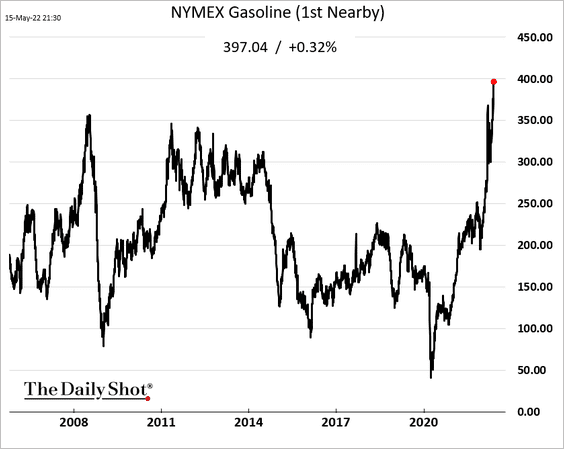
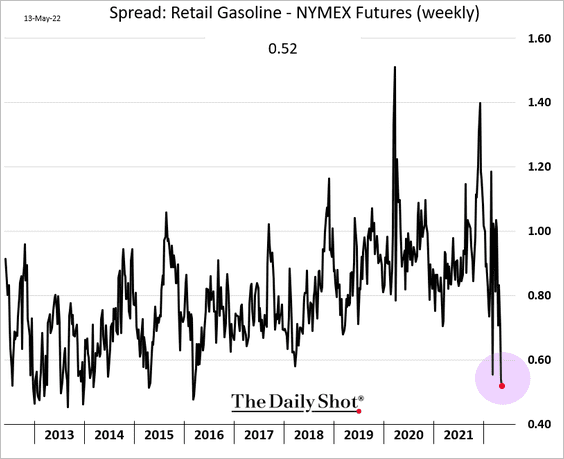
Moreover, gasoline futures point to further gains in retail fuel prices.
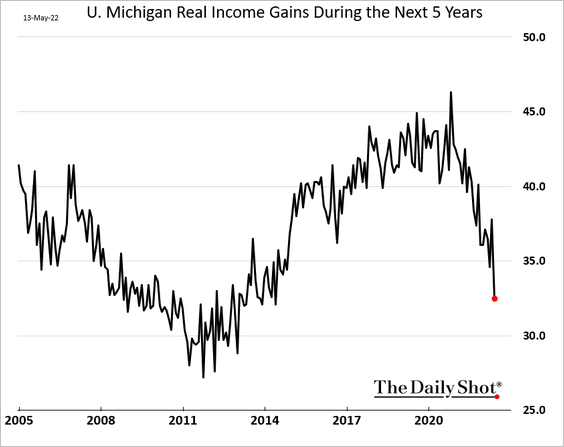
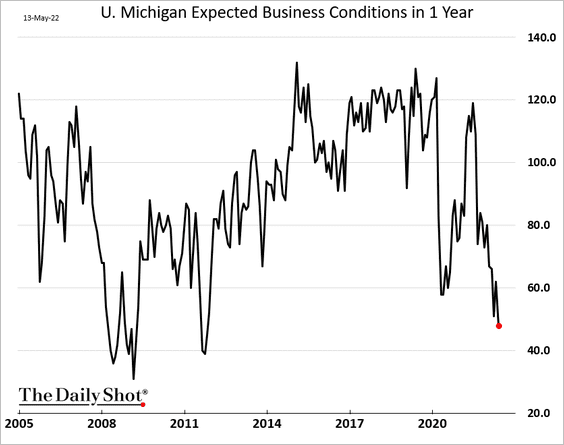
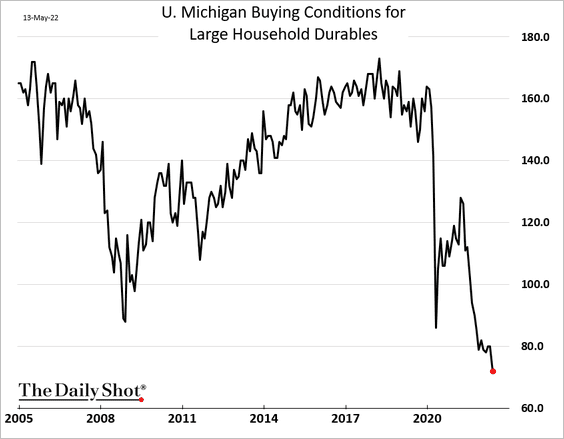
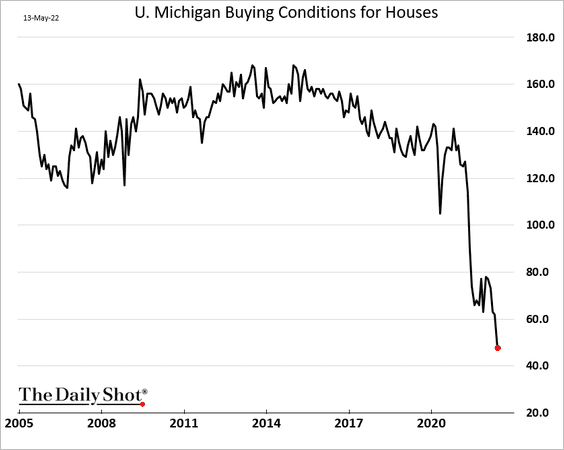
These levels of consumer sentiment look recessionary. Here are some trends from the U. Michigan report.
• Current financial conditions:
• Expected longer-term income gains:
• Expected business conditions:
• Buying conditions for durables:
• Buying conditions for houses:
——————–
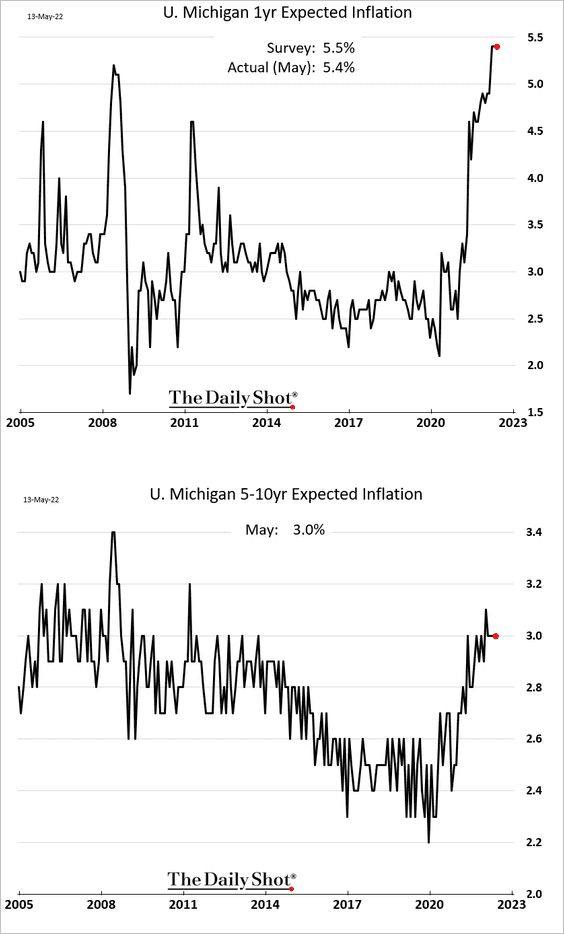
2. Next, we have some updates on inflation and supply bottlenecks.
• The U. Michigan inflation expectations indices held steady this month.
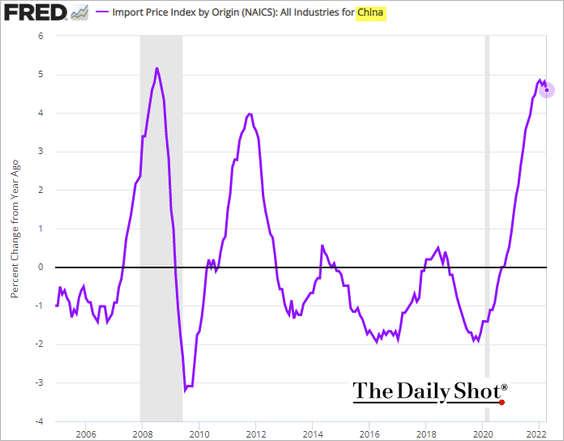
• Import price inflation slowed in April.
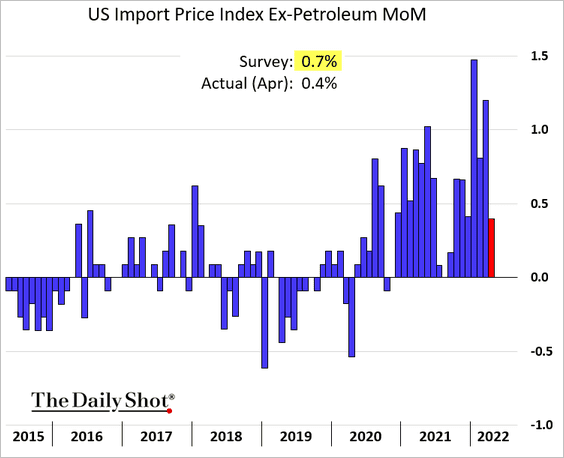
Is it peaking? Here are the price changes on imports from China (year-over-year).
• The Oxford Economics supply chain stress index remains elevated, held up by surging prices.
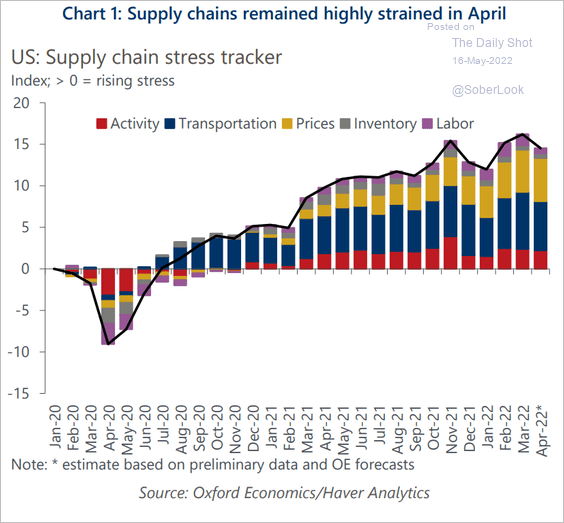 Source: Oxford Economics
But West Coast port blockages are gradually easing.
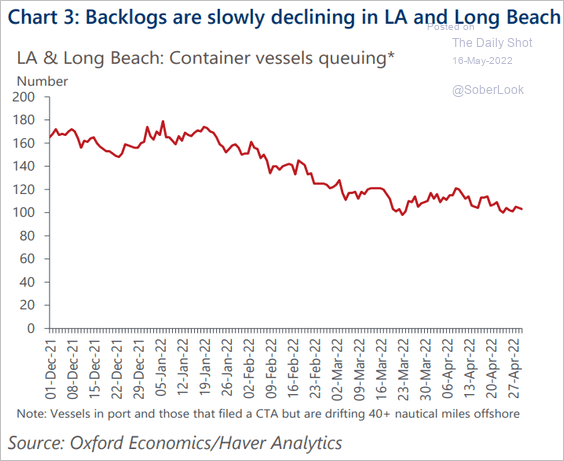 Source: Oxford Economics
• Freight rate inflation has been unprecedented but it appears to be peaking.
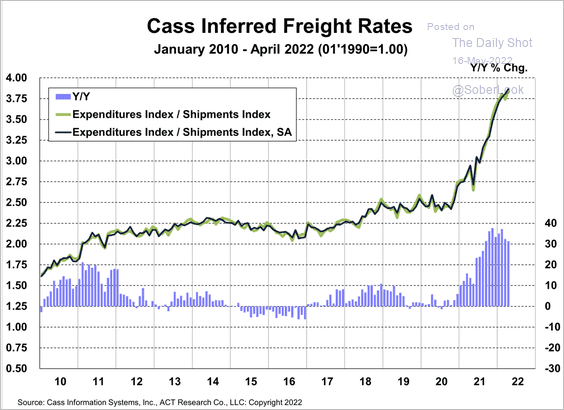 Source: Cass Information Systems
Freight trucking shortages are easing.
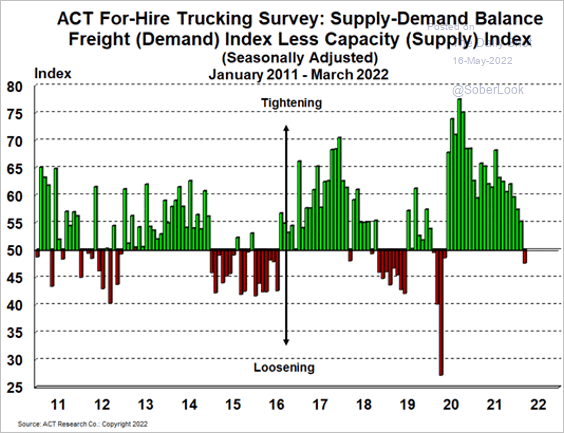 Source: Cass Information Systems
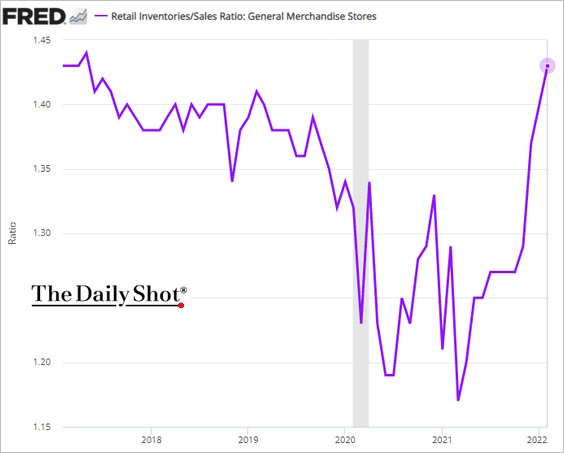
• Outside of vehicles and a few one-off items, retail inventories have improved markedly.
 h/t Anna Wong
——————–
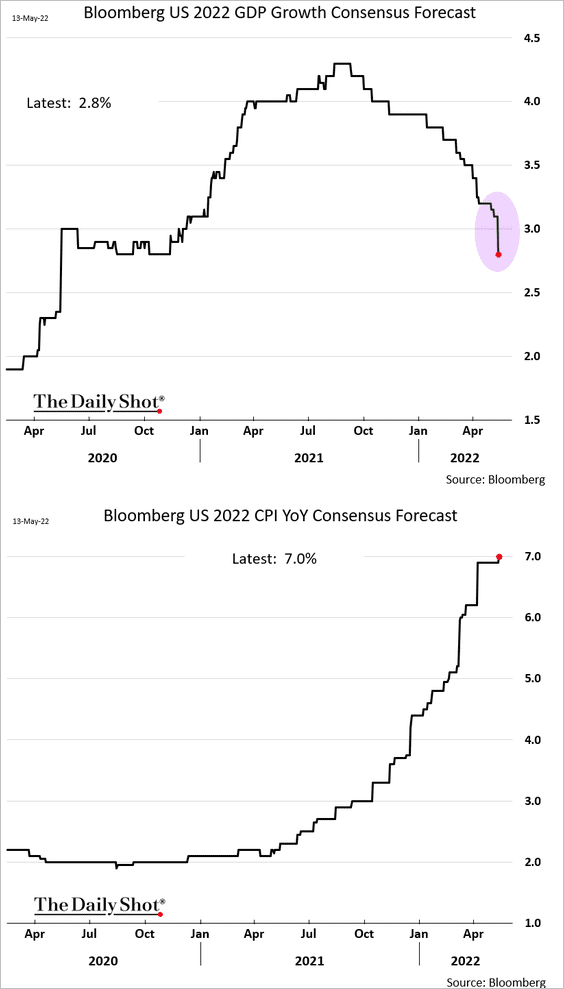
3. Consensus forecasts for 2022 show rising stagflationary risks as economists rapidly downgrade the GDP growth projections.
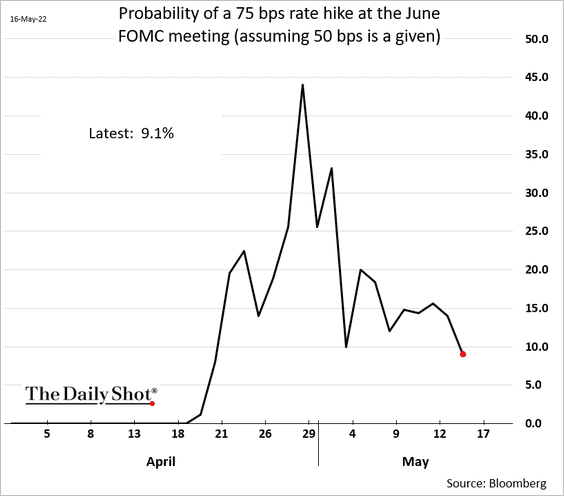
4. The market-based probability of a 75 bps Fed rate hike in June is now below 10%.
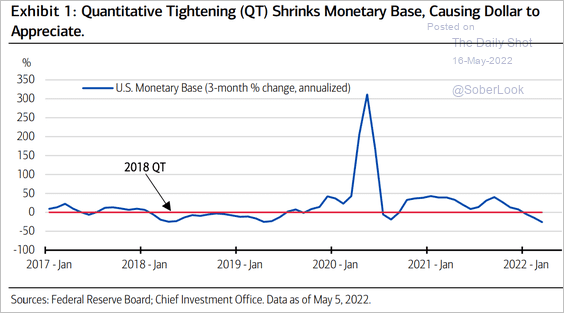
5. Tighter monetary conditions have been a tailwind for the US dollar.
 Source: Merrill Lynch
Back to Index
The United Kingdom
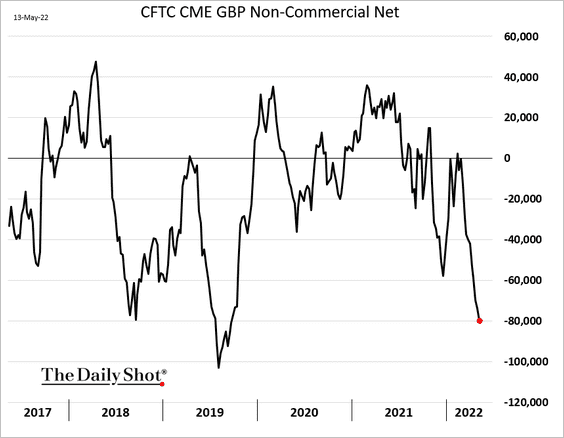
1. Speculative accounts continue to press their bets against the pound.
2. The surge in trade deficit makes the UK economy more vulnerable to global price fluctuations.
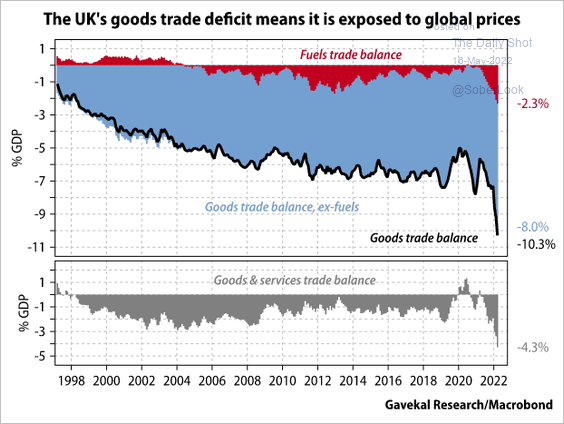 Source: Gavekal Research
Back to Index
The Eurozone
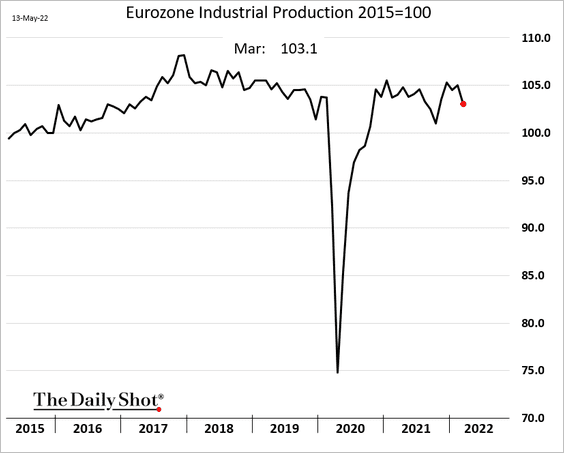
1. Industrial production dipped below pre-COVID levels in March.
2. The euro-area core CPI indicators continue to signal increasing inflationary pressures.
• France:
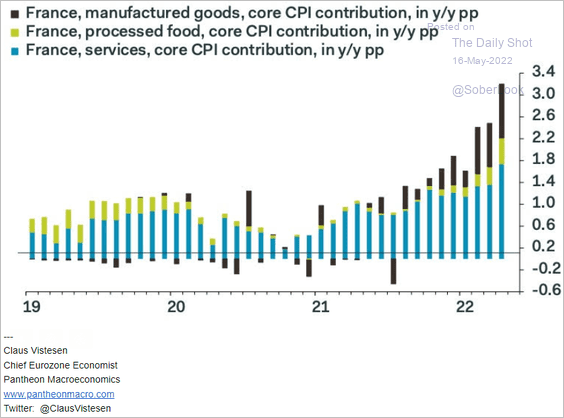 Source: Pantheon Macroeconomics
• Spain:
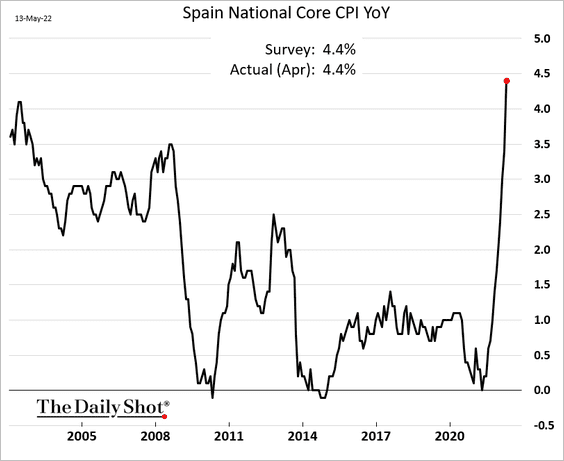
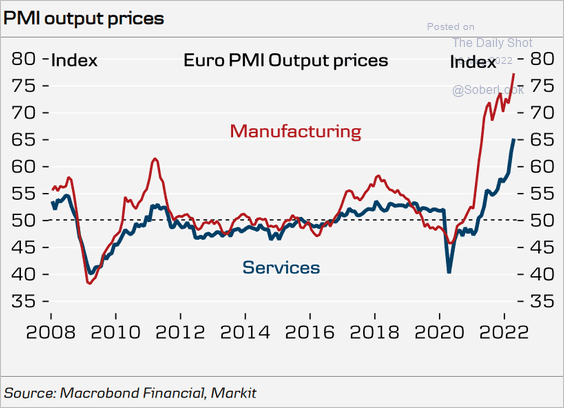
The PMI reports show companies boosting prices in the manufacturing and services sectors.
 Source: Danske Bank
——————–
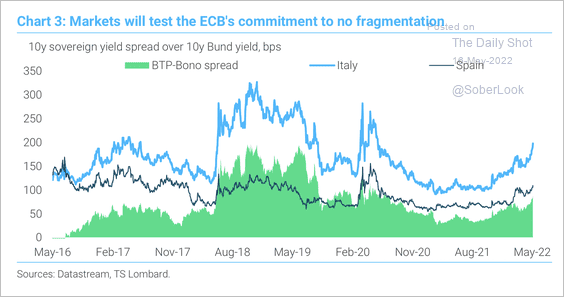
3. The spread between Italy and Spain’s 10-year bonds touched 200 basis points, which is the lower bound of what has historically triggered policy intervention, according to TS Lombard.
 Source: TS Lombard
Back to Index
Europe
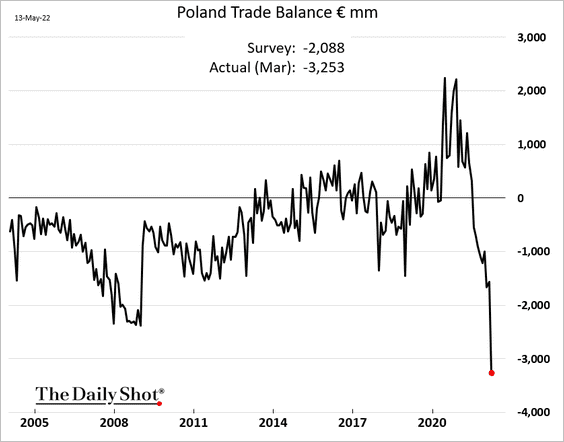
1. Poland’s trade deficit widened to a new record in March as energy costs surged.
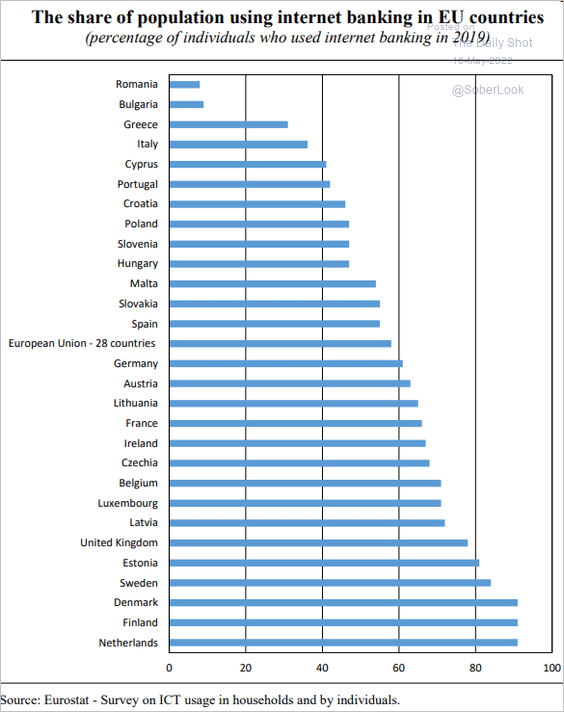
2. Who is using internet banking in the EU?
 Source: Bank of Italy Read full article
Back to Index
Japan
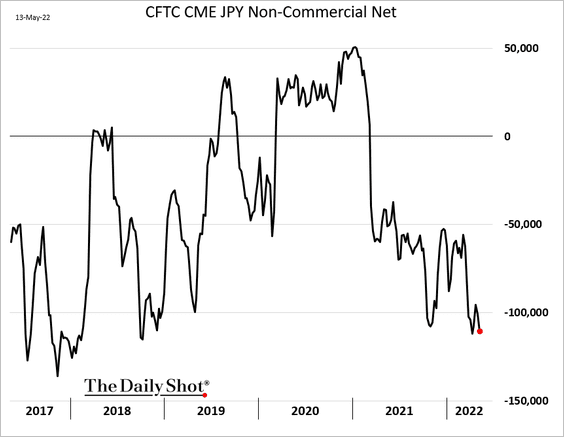
1. Traders continue to bet against the yen.
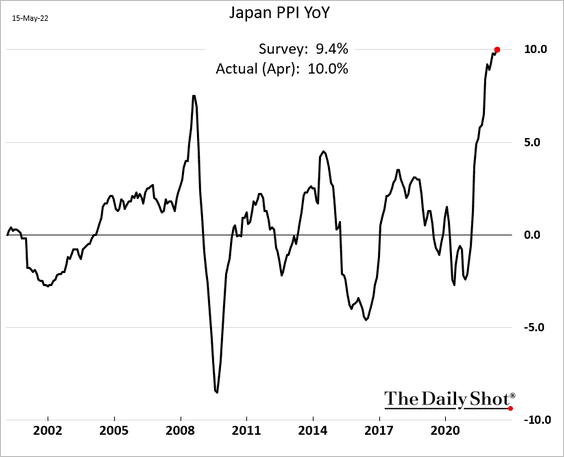
2. Japan’s producer price inflation hit 10%.
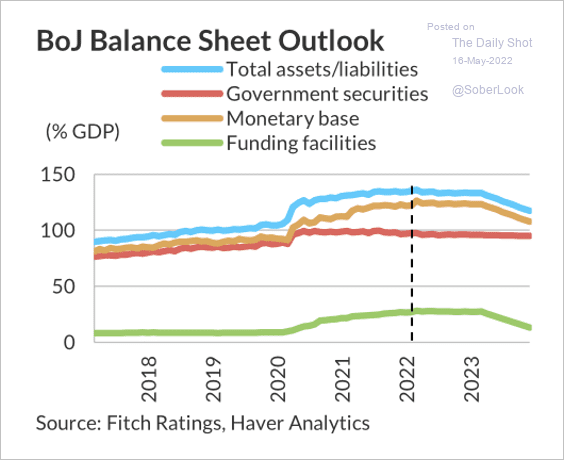
3. Fitch expects the BoJ’s balance sheet to shrink as a percent of GDP over the next year.
 Source: Fitch Ratings
Back to Index
China
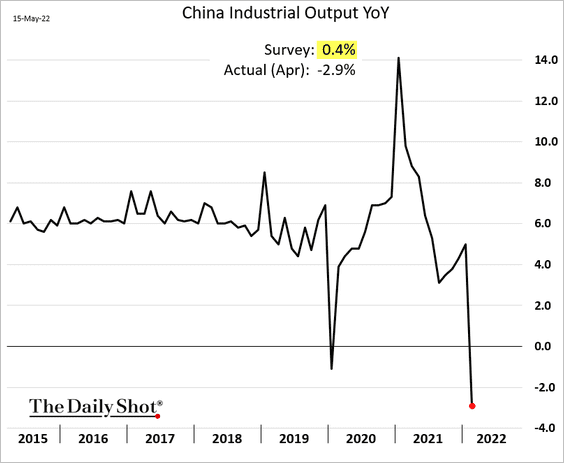
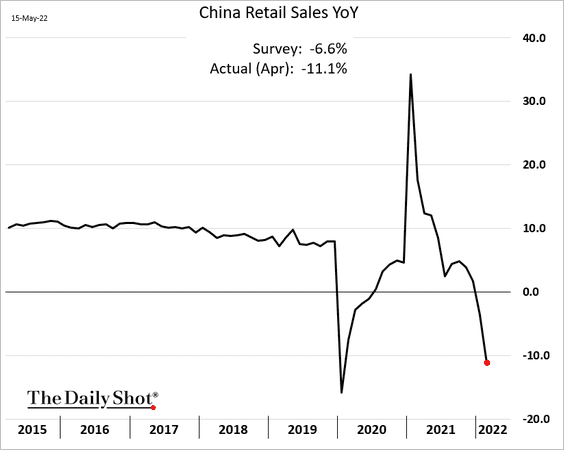
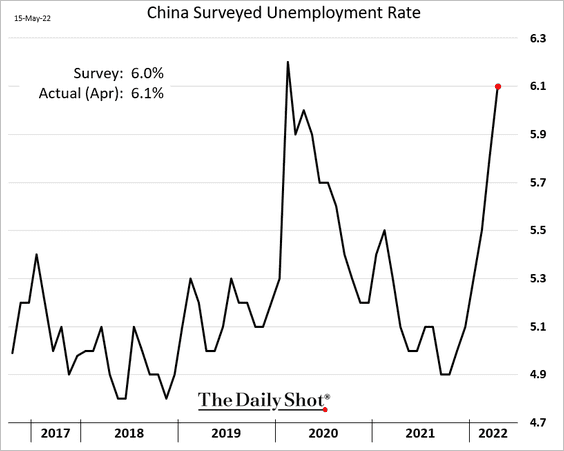
1. Economic indicators tumbled last month amid lockdowns. The report sent global stocks and equity futures lower. It’s worth noting that the authorities are eager to get the economy moving again and are likely to keep easing up on the lockdowns.
• Industrial production (year over year):
• Retail sales (year over year):
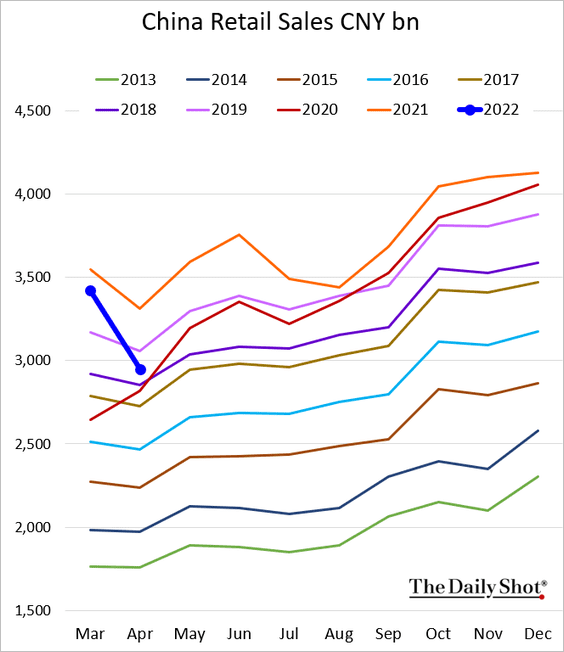
Retail sales (absolute levels):
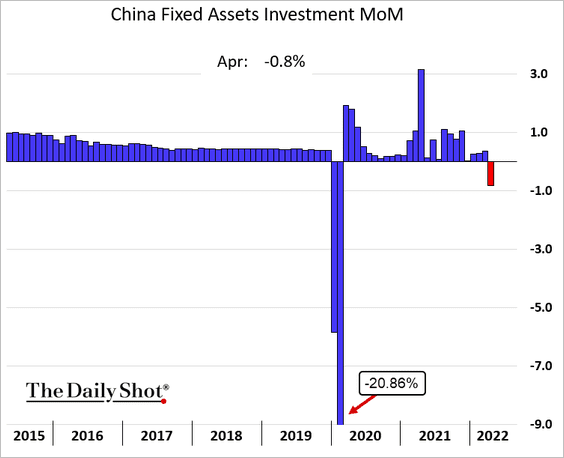
• Fixed asset investment (month-over-month):
The unemployment rate climbed further.
——————–
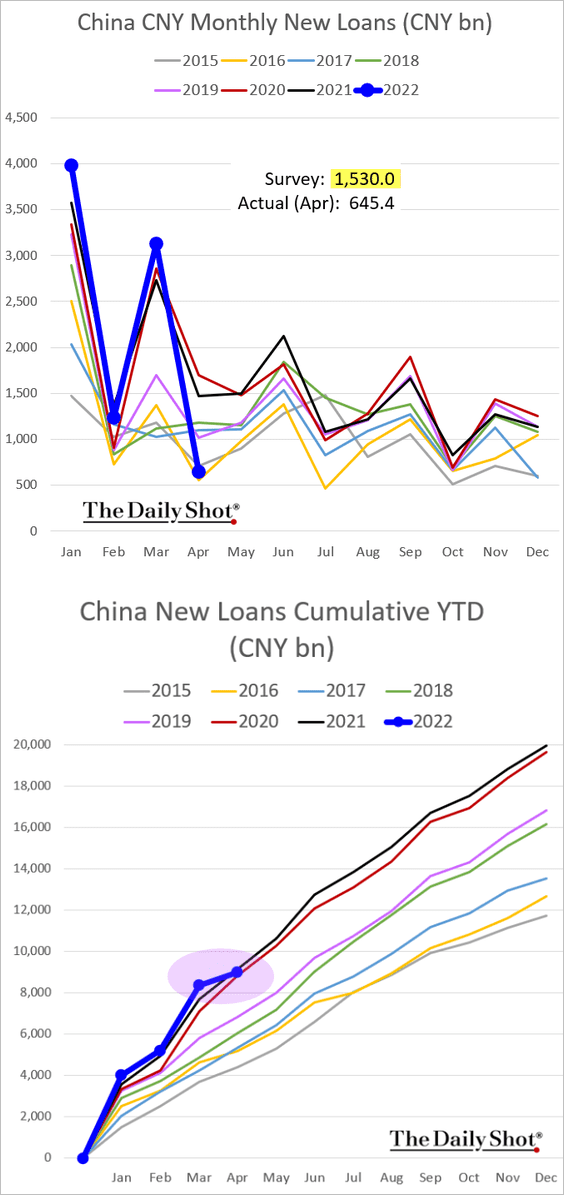
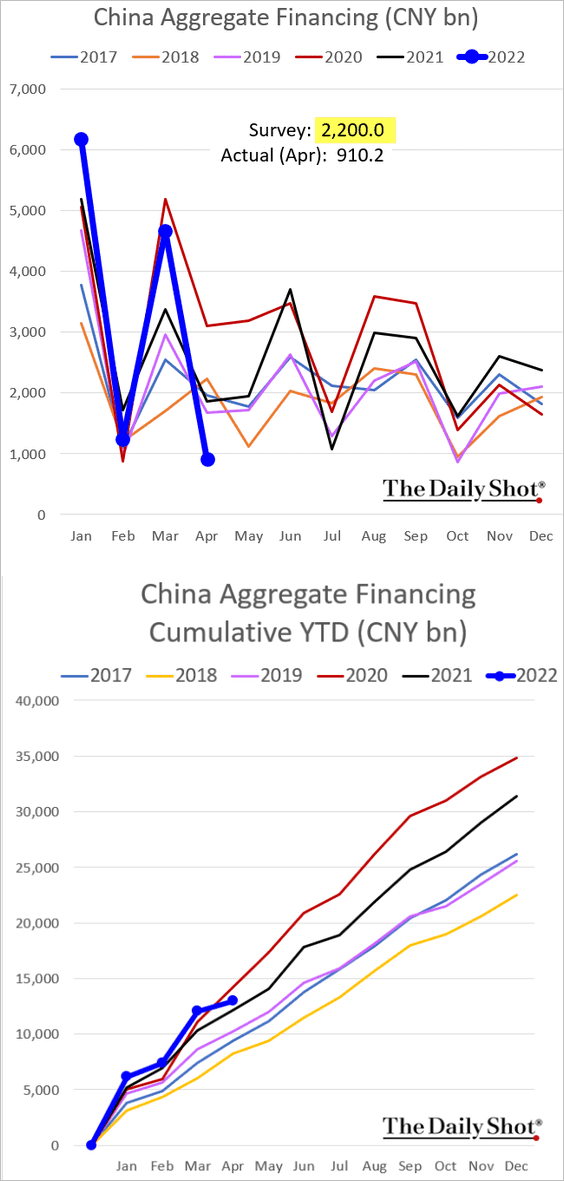
2. Credit growth deteriorated sharply last month.
• CNY loans:
• Aggregate financing:
——————–
3. International companies have been facing more challenges selling in China this year.
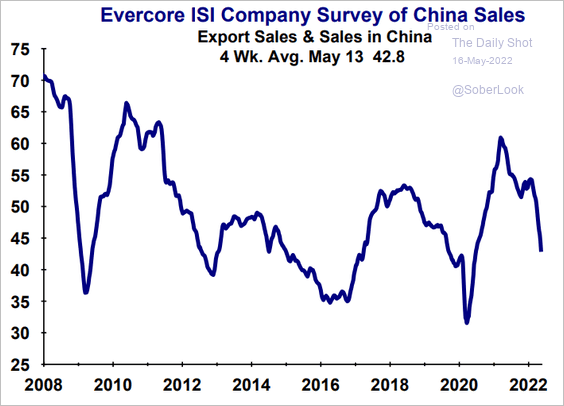 Source: Evercore ISI Research
4. Lockdowns have triggered earnings downgrades.
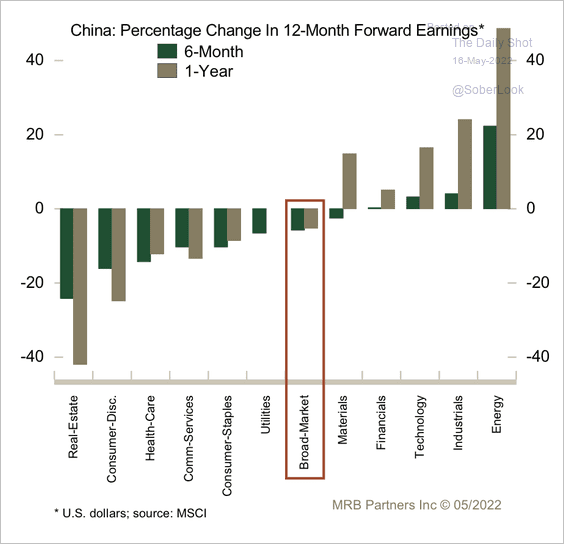 Source: MRB Partners
Back to Index
Emerging Markets
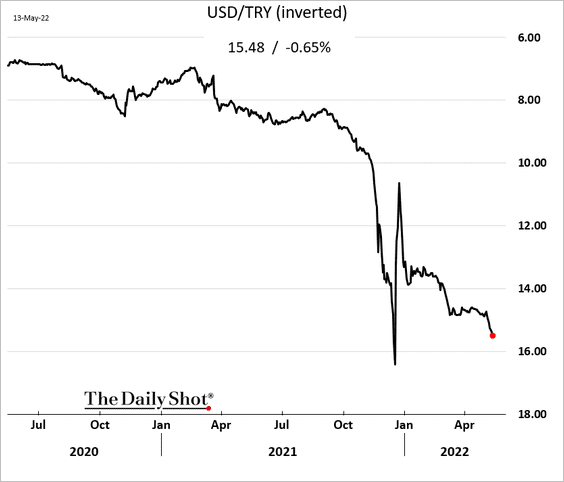
1. The Turkish lira continues to weaken.
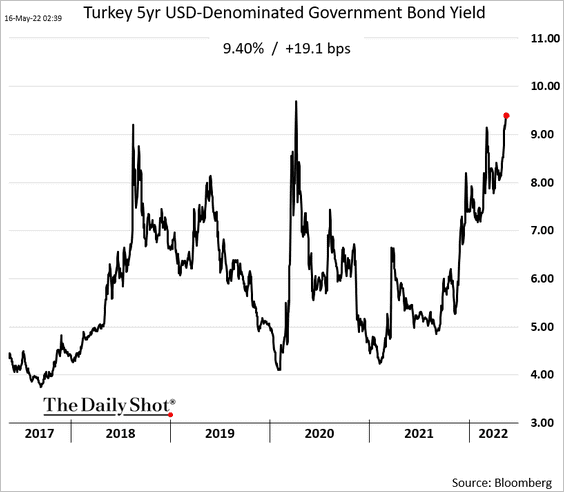
• Turkish USD bonds are under pressure.
• Hyperinflation is taking a toll on Turkish households.
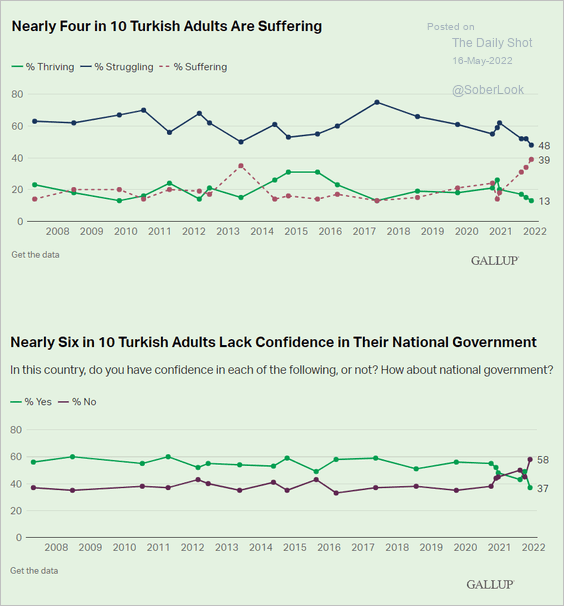 Source: Gallup Read full article
——————–
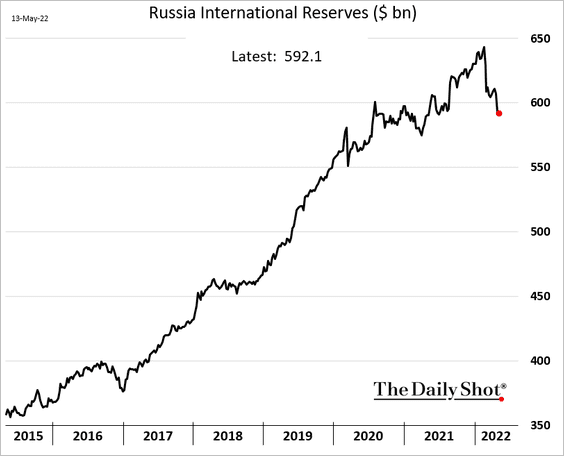
2. Russia’s core CPI is above 20% (to the extent the index can be trusted).
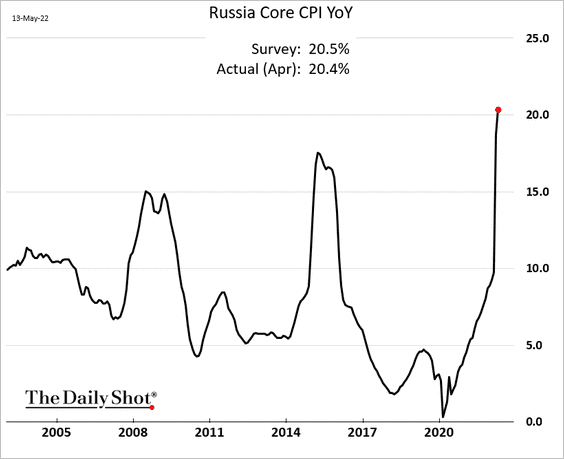
The F/X reserves are declining, due in part to lower gold prices.
——————–
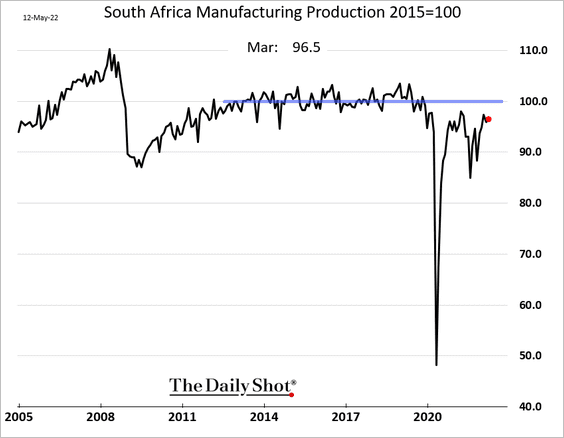
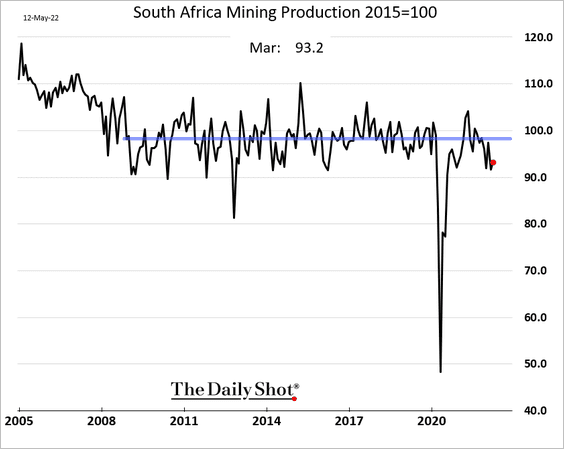
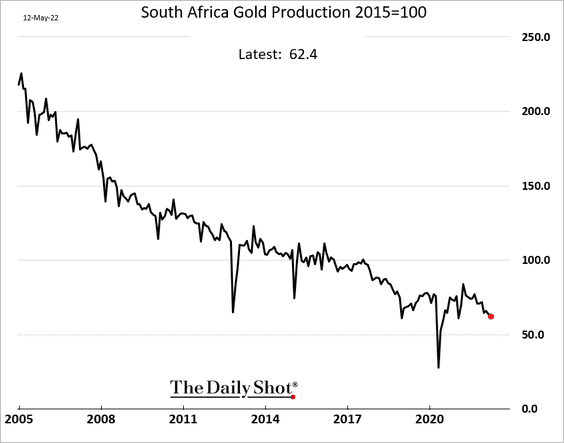
3. South Africa’s industrial production remains below pre-COVID levels.
• Manufacturing:
• Mining:
Here is South Africa’s gold production.
——————–
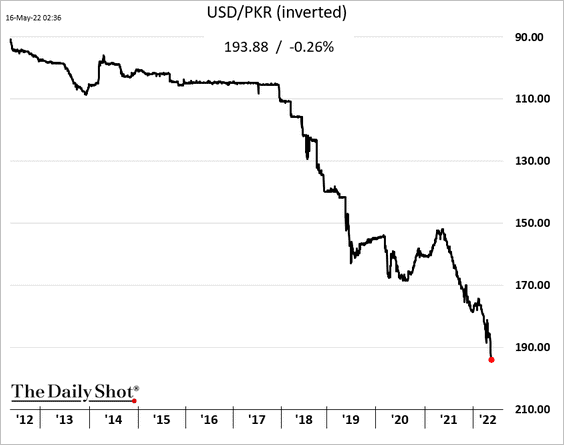
4. The Pakistani rupee keeps hitting record lows vs. USD.
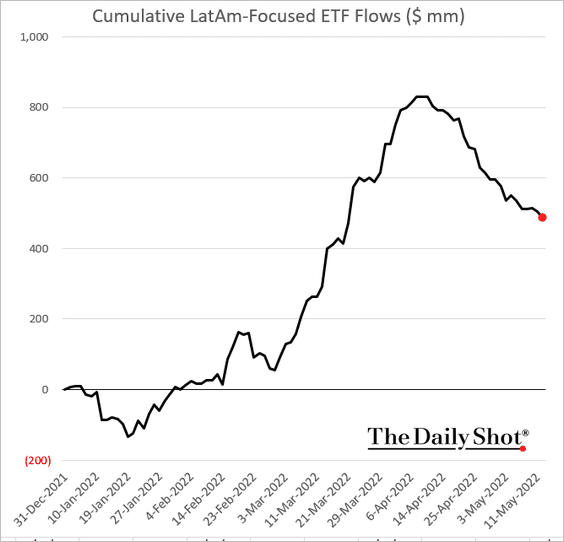
5. LatAm-focused ETFs continue to see net outflows.
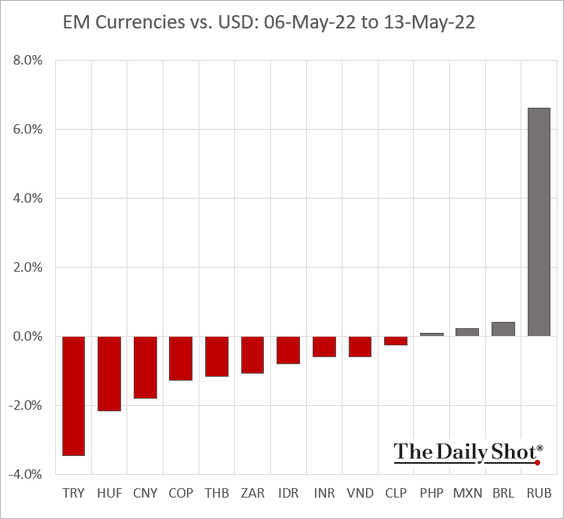
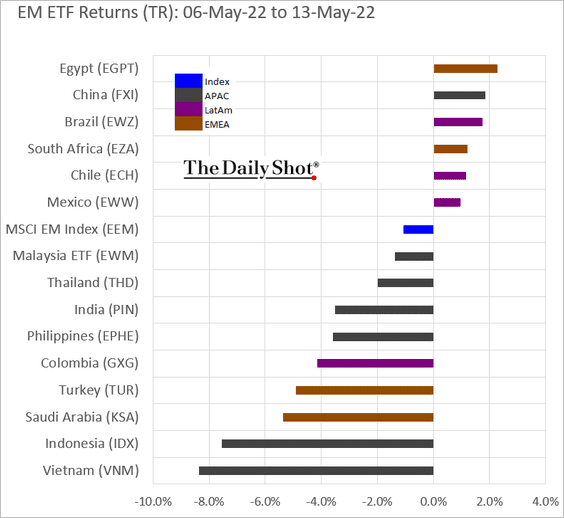
6. Next, we have some performance data from last week.
• Currencies:
• Equity ETFs:
Back to Index
Cryptocurrency
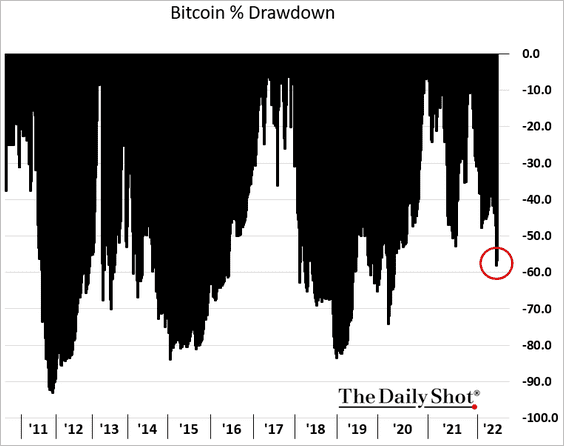
1. After a bounce over the weekend, cryptos dropped this morning, with bitcoin trading below $30k.

The latest drawdown in crypto is not unusual.
——————–
2. Grayscale Bitcoin Trust is trading at a record discount to NAV.
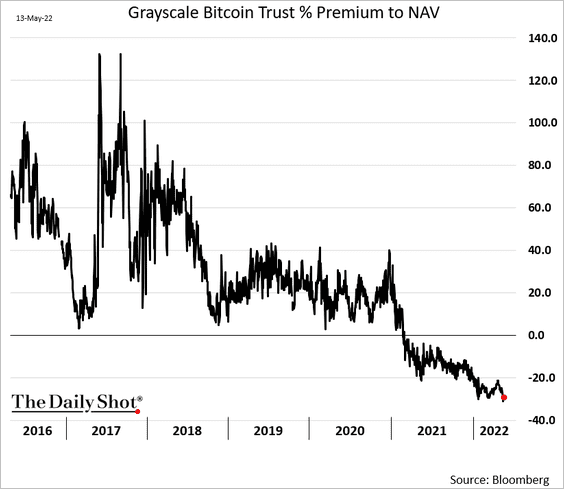
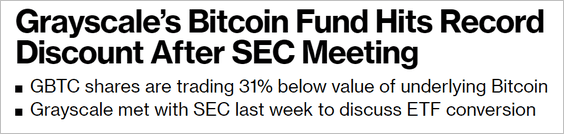 Source: Bloomberg Read full article
——————–
3. The recent contraction in stablecoin supply signals a degree of net capital outflow from the cryptocurrency industry at large.
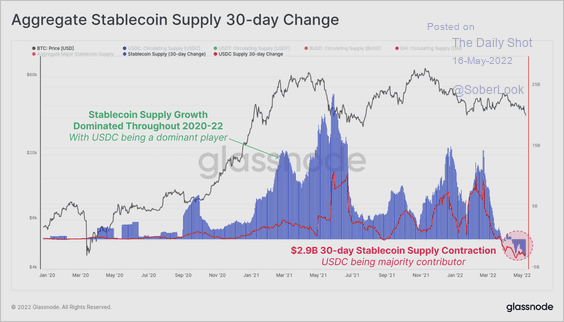 Source: Glassnode Read full article
4. Bitcoin’s forward returns following a 55%+ drawdown tend to be flat or negative over the following six months.
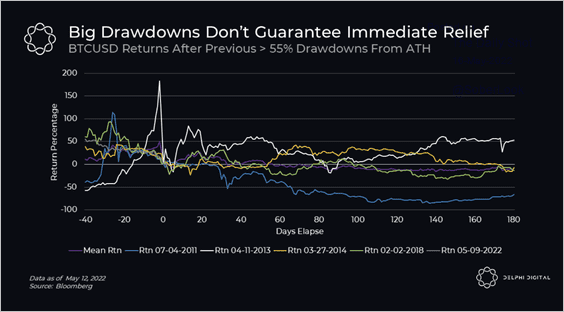 Source: @Delphi_Digital
5. Web3 and gaming tokens underperformed last week.
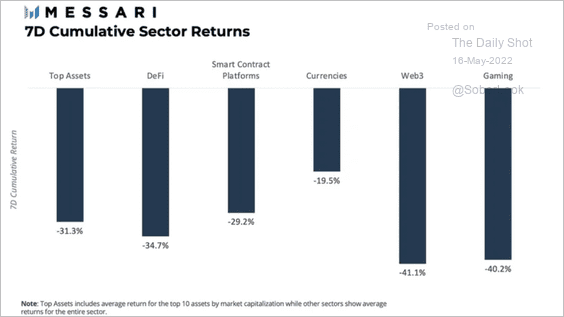 Source: @MessariCrypto
6. TerraUSD is trading below 20 cents on the dollar.
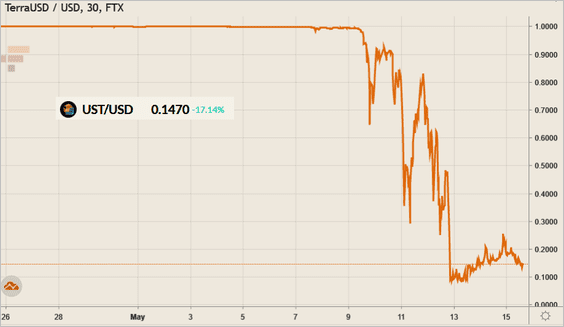 Source: FTX
Back to Index
Commodities
1. Wheat futures surged this morning.
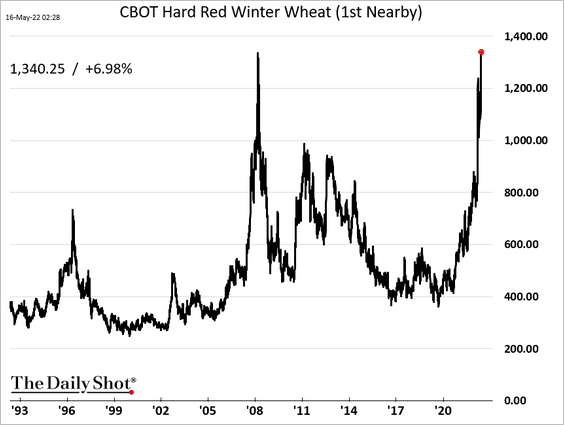
 Source: @markets Read full article
• Wheat inventories are expected to fall further.
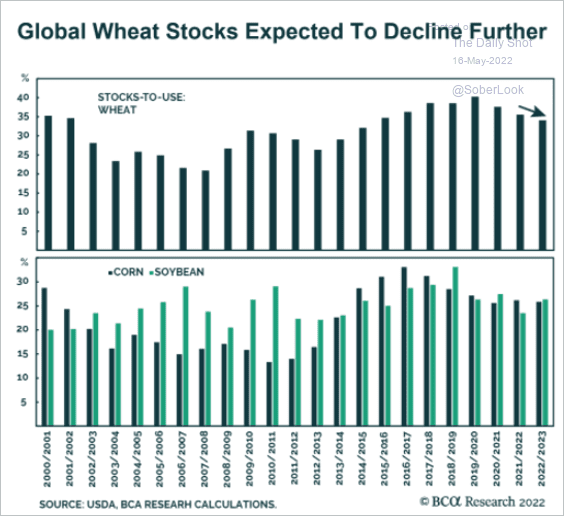 Source: BCA Research
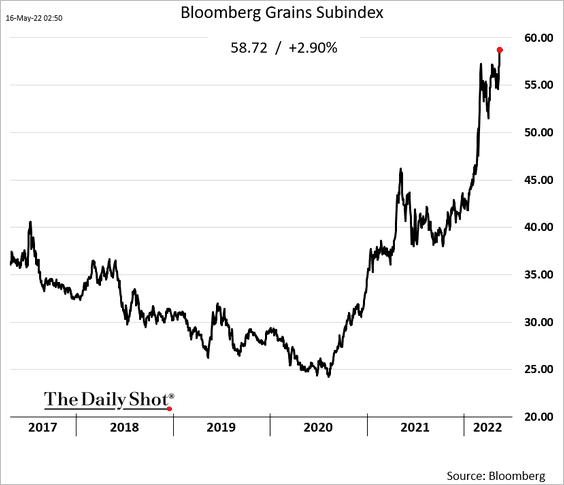
• Here is Bloomberg’s grains index.
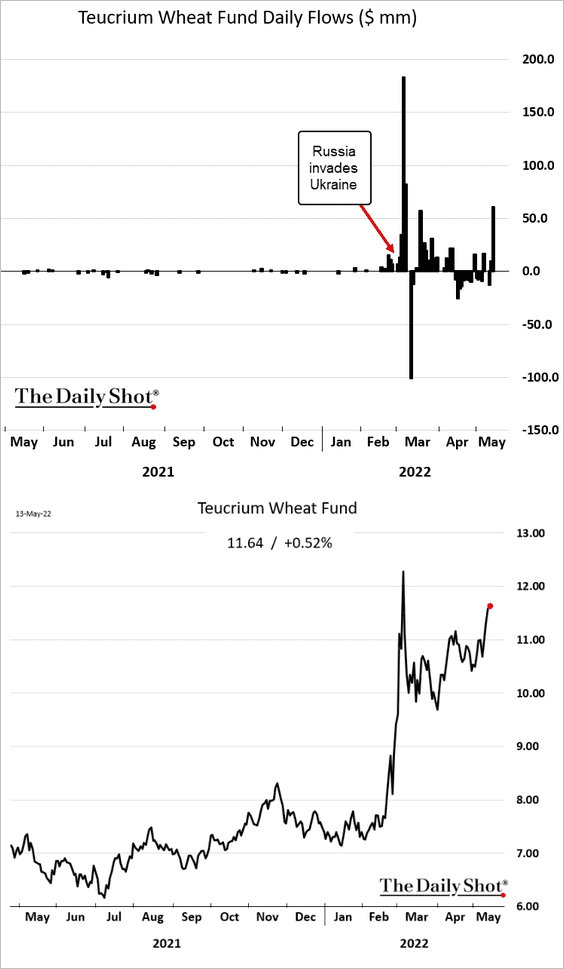
• This chart shows fund flows into a wheat-focused ETF.
——————–
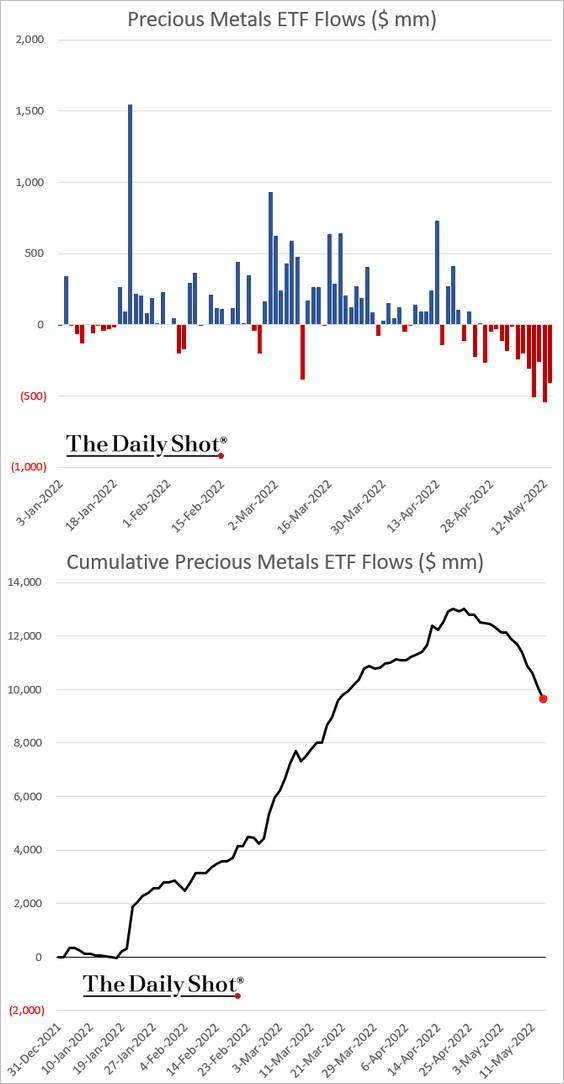
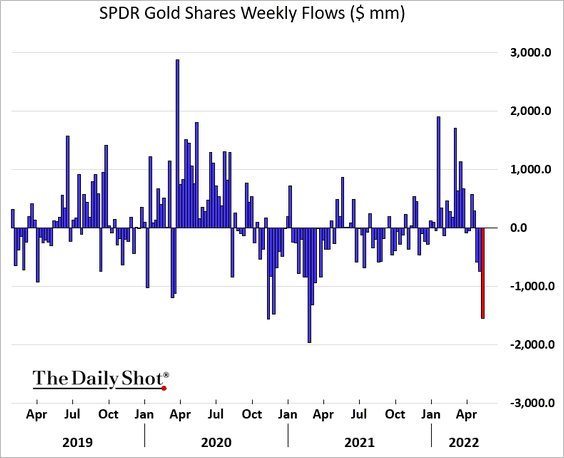
2. Precious metals ETFs continue to see outflows.
——————–
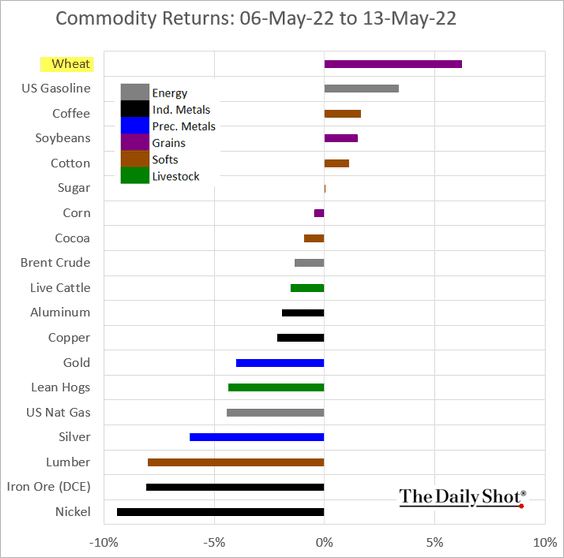
3. This chart shows last week’s performance across commodity markets.
Back to Index
Energy
1. Global oil output has been pulled lower by Russia.
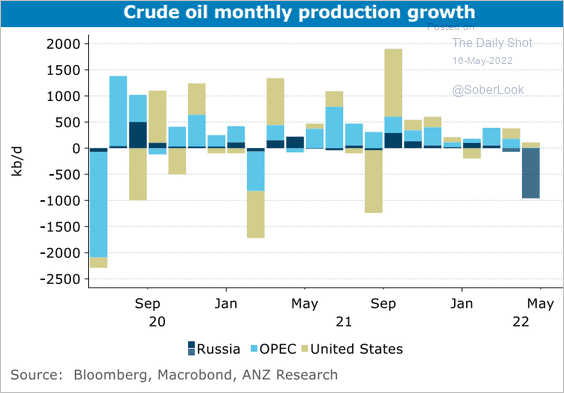 Source: @ANZ_Research
2. Here is the decomposition of last month’s oil price gains.
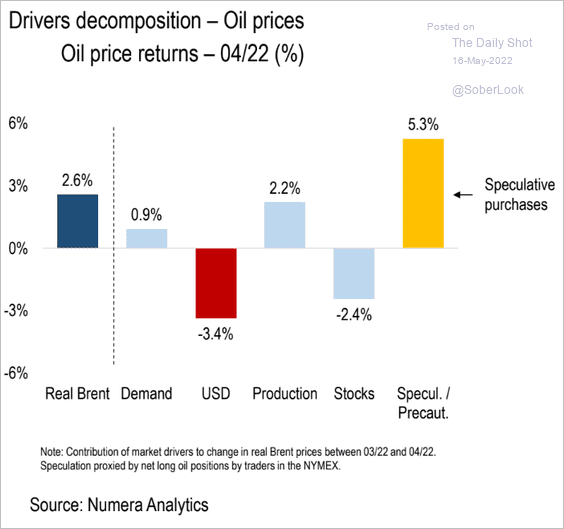 Source: Numera Analytics
3. Volatile energy prices have threatened the financial stability of large commodity traders.
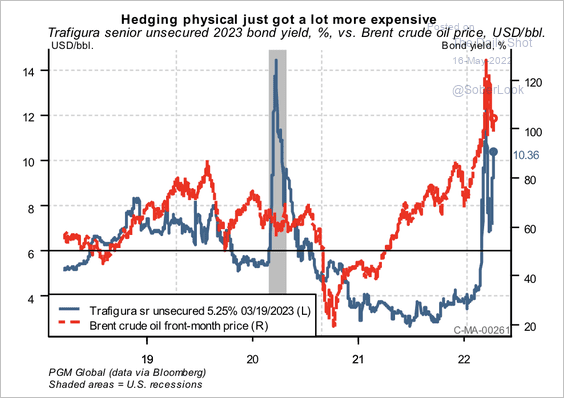 Source: PGM Global
Back to Index
Equities
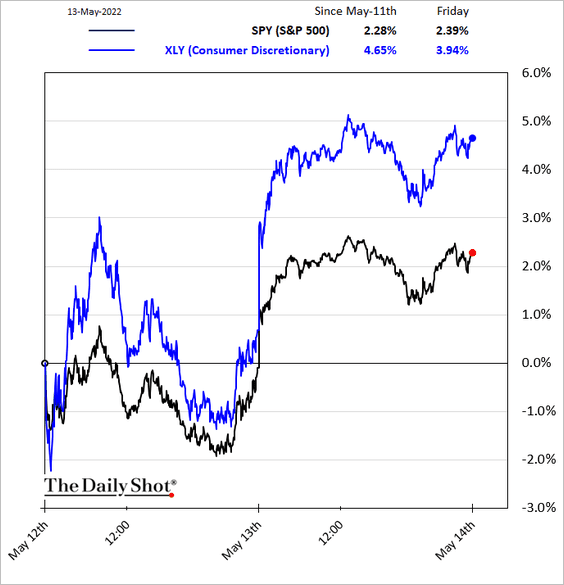
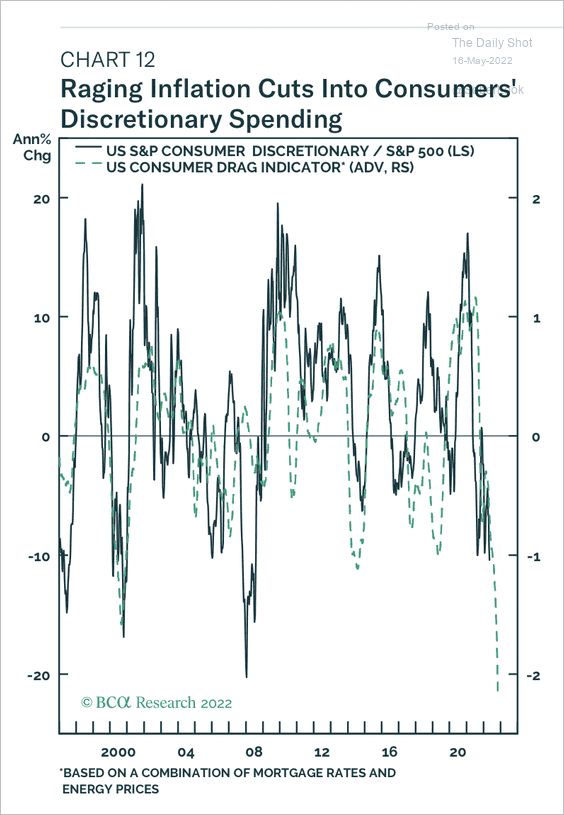
1. Short-covering sent consumer discretionary stocks sharply higher on Friday.
But ETF flows in the sector continue to trend lower, …
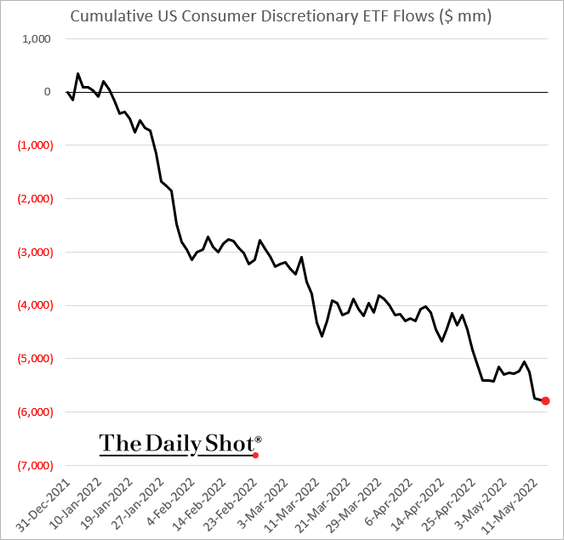
… amid concerns about US consumer spending coming under pressure.
 Source: BCA Research
——————–
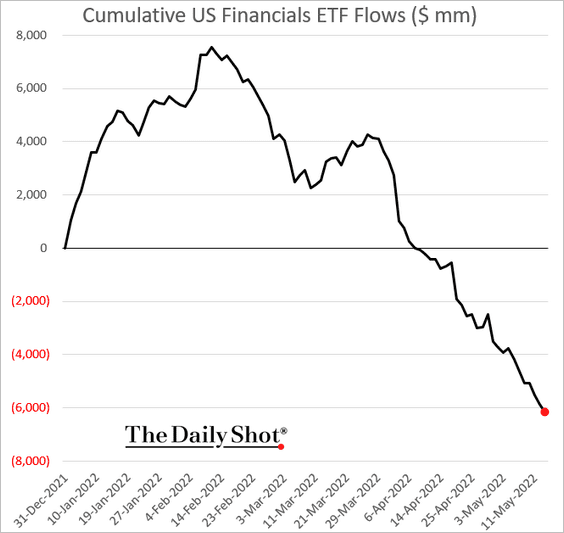
2. Financial-sector ETFs also continue to see outflows.
3. But thematic ETFs are gaining fresh capital.
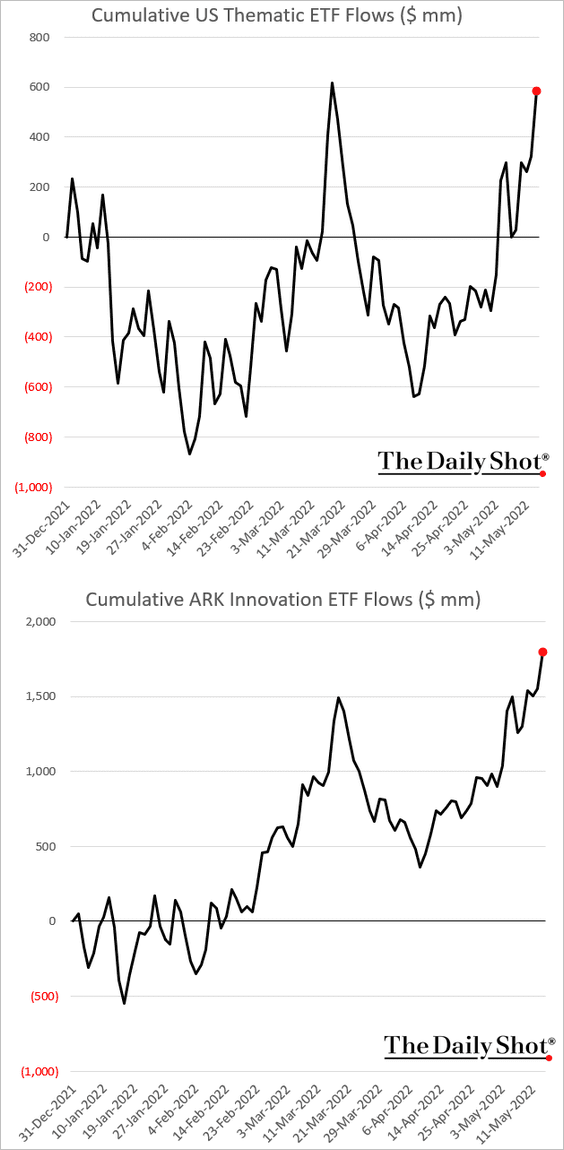
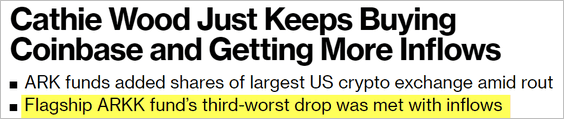 Source: Bloomberg Read full article
——————–
4. The percentage of S&P 500 members hitting new 52-week lows doesn’t yet indicate capitulation.
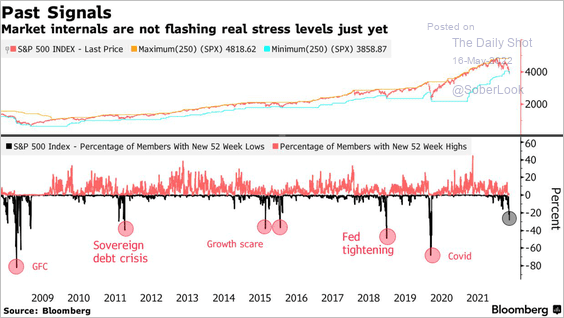 Source: @jessefelder, Bloomberg Read full article
However, here is the broader market.
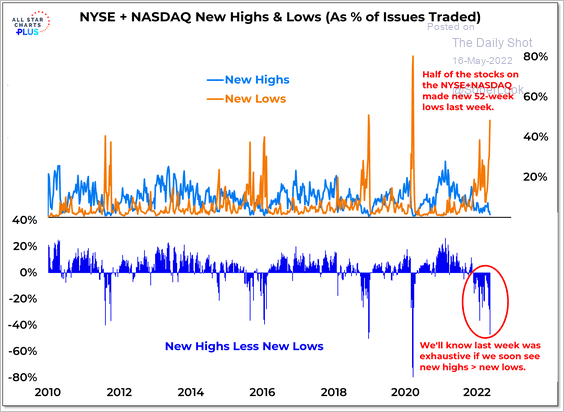 Source: @WillieDelwiche
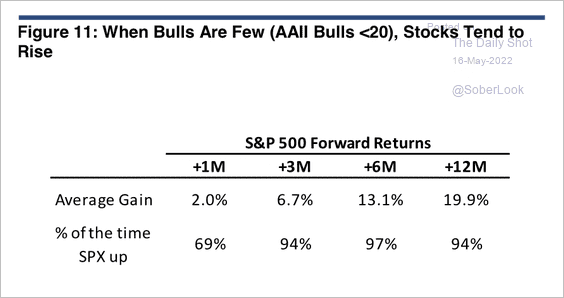
5. Outside of a recession, equities tend to recover after bearish sentiment reaches an extreme (2 charts).
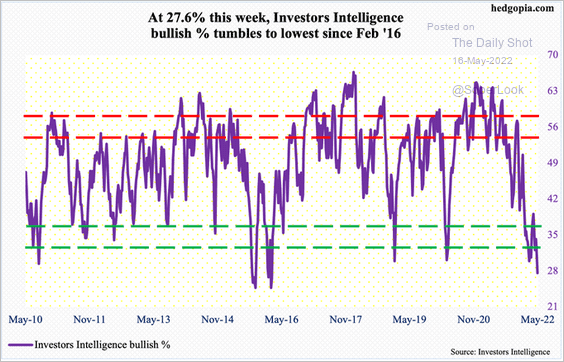 Source: @hedgopia
 Source: Evercore ISI Research
6. How does the S&P 500 perform after a five-month decline of greater than 15%?
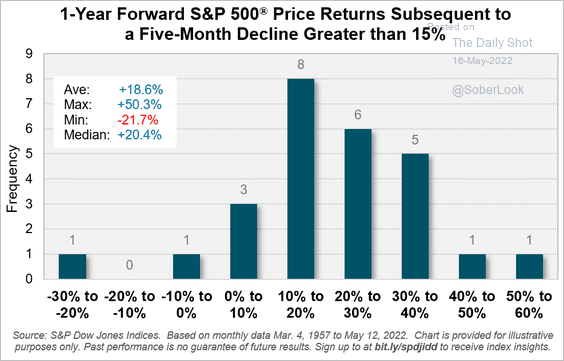 Source: S&P Global Market Intelligence
7. Historically, high inflation and rising yields have been a headwind for equities. But are we shifting to the “high inflation and falling yields” regime?
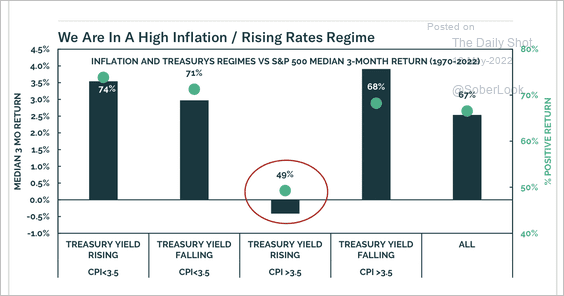 Source: BCA Research
Will stocks rebound as inflation peaks?
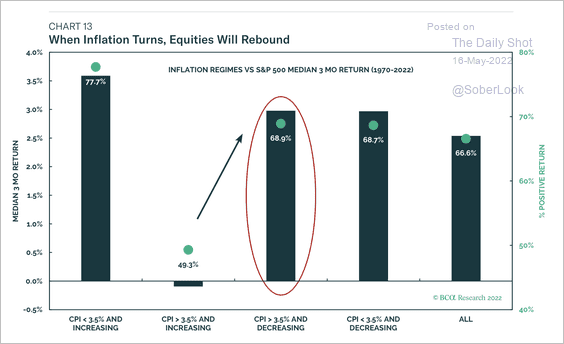 Source: BCA Research
——————–
8. The consensus forward earnings for the S&P500, S&P400, and S&P600 are pointing to robust profits growth over the coming year. Are analysts too optimistic?
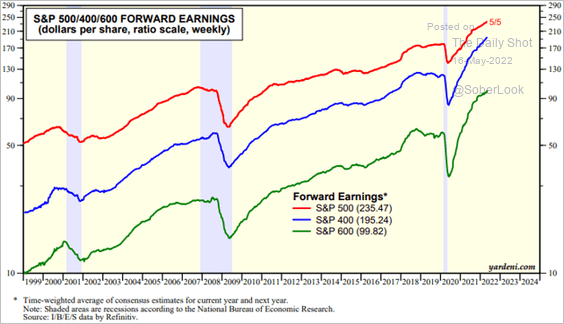 Source: Yardeni Research
9. Goldman cut its S&P 500 2022 year-end target from 4,700 to 4,300.
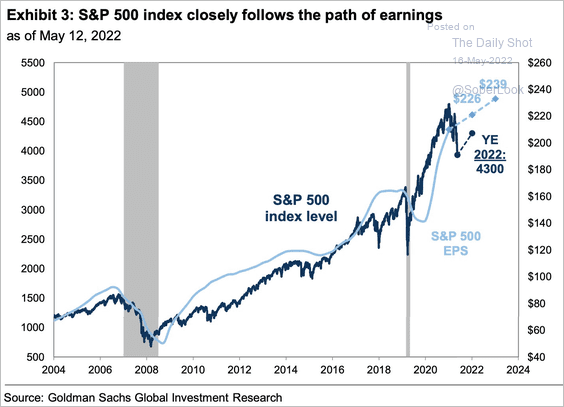 Source: Goldman Sachs
10. Some of the most expensive stocks have seen the worst returns so far this year.
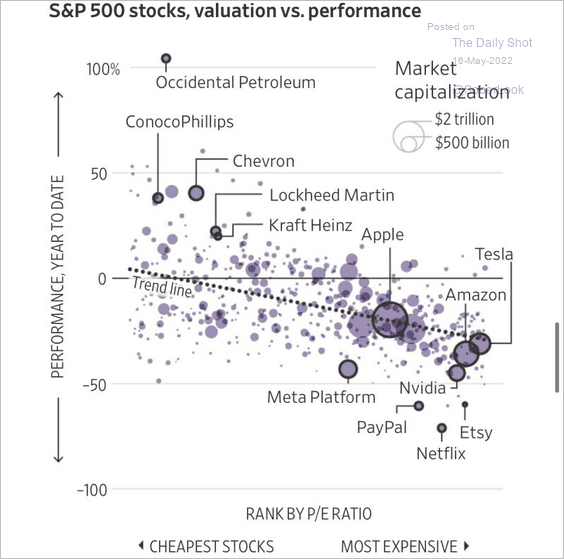 Source: @WSJ Read full article
11. US equities’ relative performance has diverged from the US dollar.
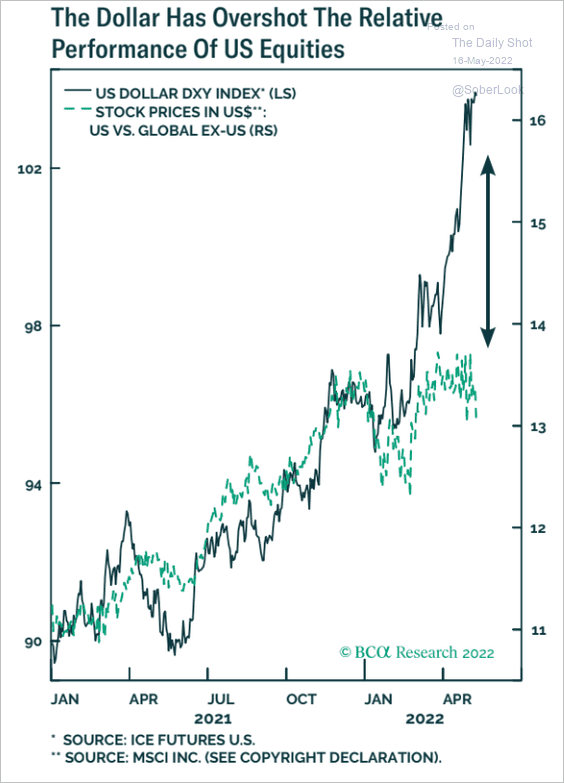 Source: BCA Research
12. Companies with higher domestic revenue exposure have been outperforming.
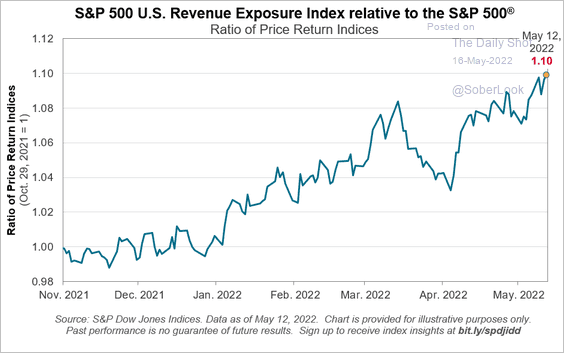 Source: S&P Global Market Intelligence
13. Small caps continue to trade at a deep discount to large caps.
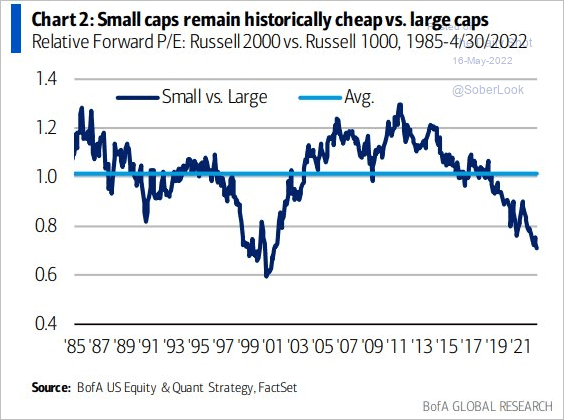 Source: BofA Global Research; @MikeZaccardi
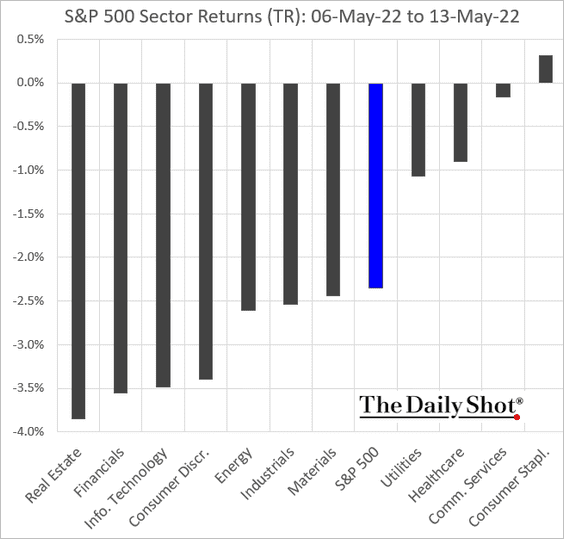
14. Next, we have some performance data from last week.
• Sectors:
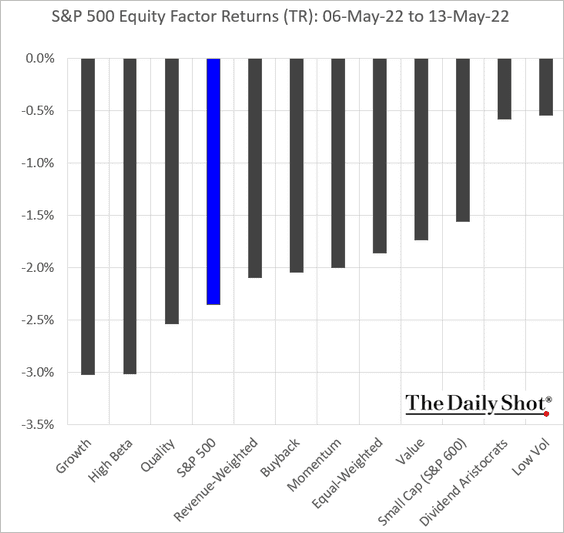
• Equity factors:
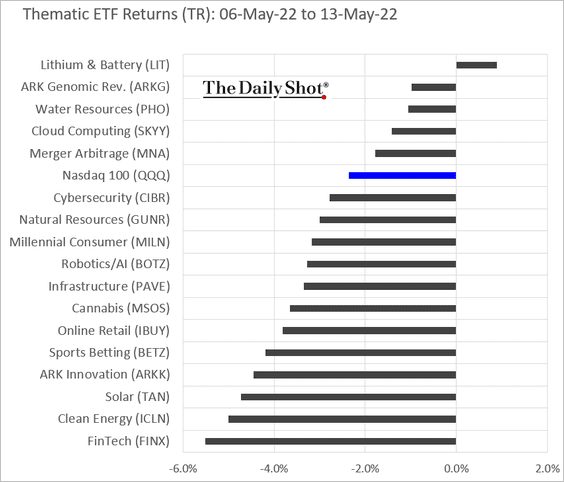
• Thematic ETFs:
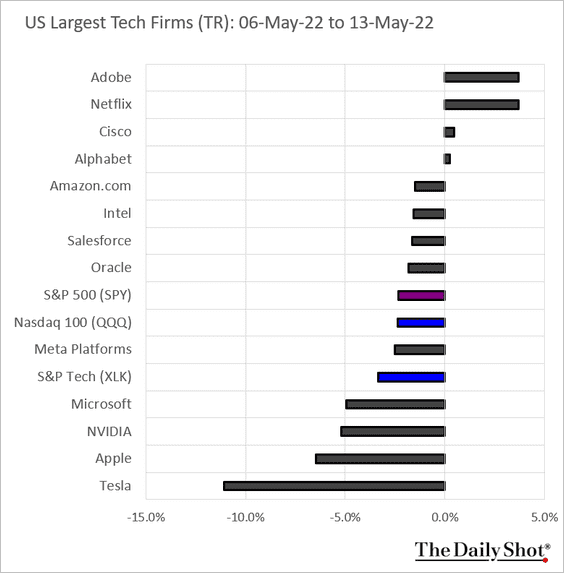
• The largest US tech firms:
Back to Index
Alternatives
1. US venture capital funding cooled off in Q1.
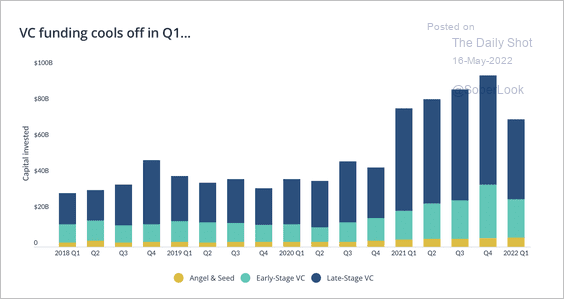 Source: PitchBook Read full article
But the number of late-stage deals hit a record high.
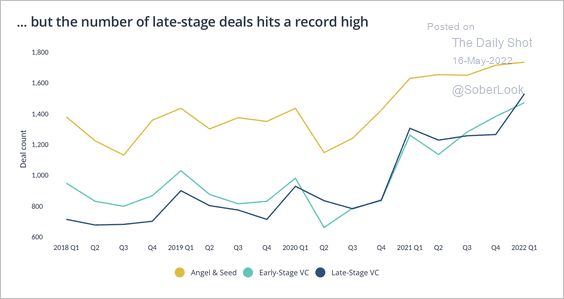 Source: PitchBook Read full article
——————–
2. Median valuations in Q1 were broadly flat relative to last year, with the exception of late-stage venture capital. Outlier transactions such as unicorn creation (startup value >$1bn) and mega-deals have started to slow significantly, according to PitchBook.
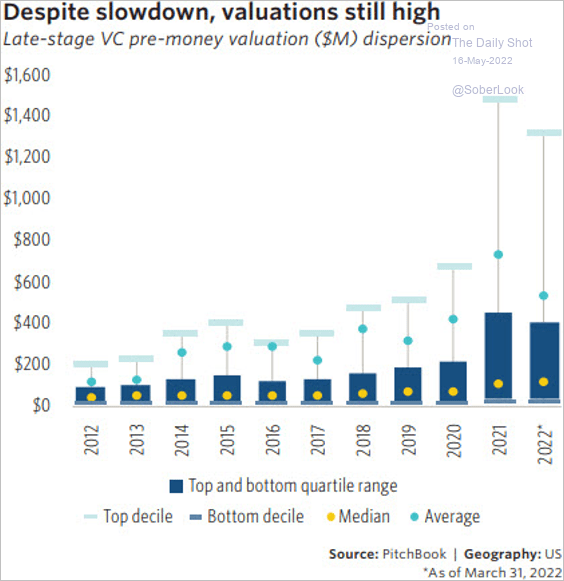 Source: PitchBook
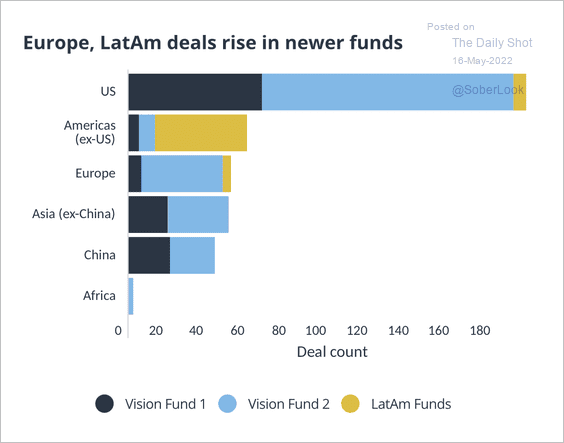
3. SoftBank is trying to diversify its investments across sectors and regions (2 charts).
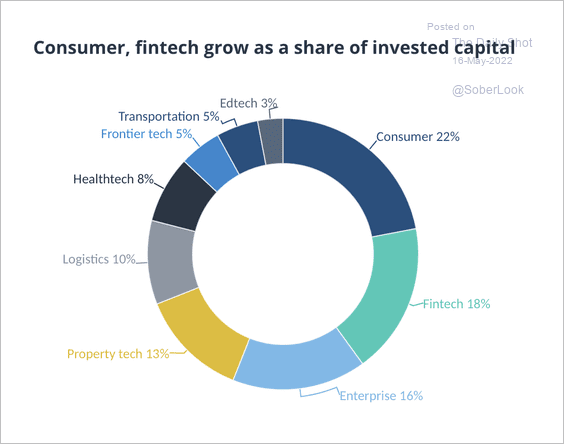 Source: PitchBook
 Source: PitchBook
Back to Index
Credit
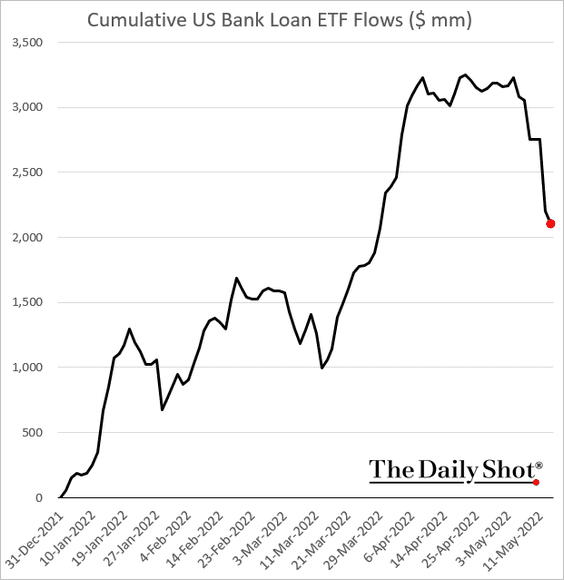
1. It was a rough week for leveraged loans (and BDCs) …
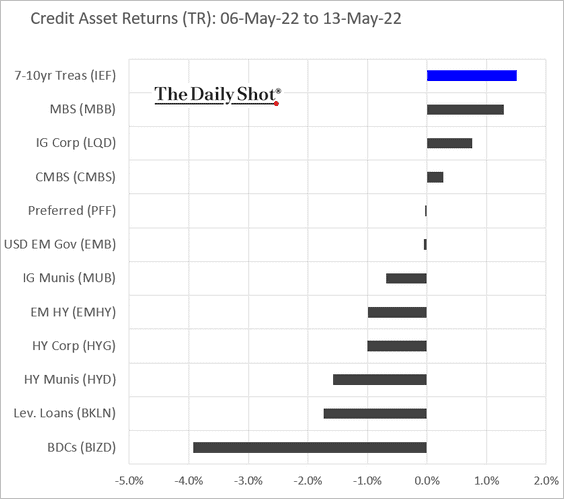
… as ETF outflows accelerated.
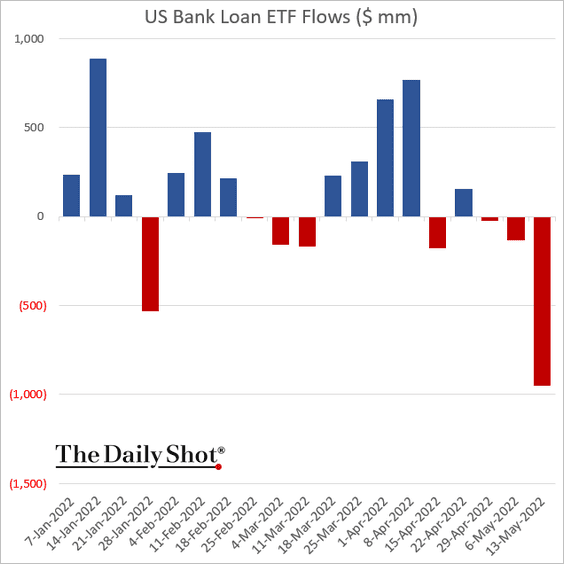
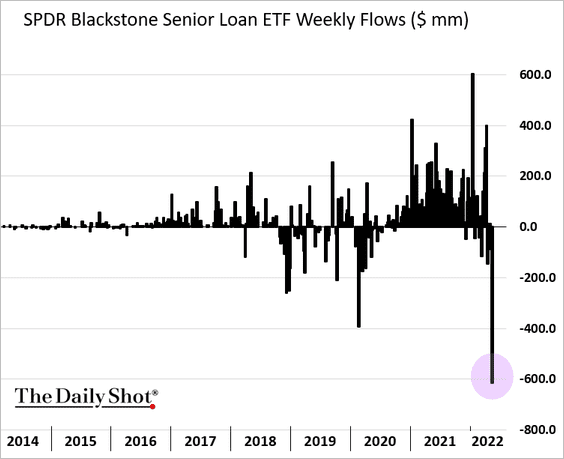
But cumulative ETF flows are still above $2 billion year-to-date.
——————–
2. This chart shows the maximum calendar-year drawdown for long-duration investment-grade bonds.
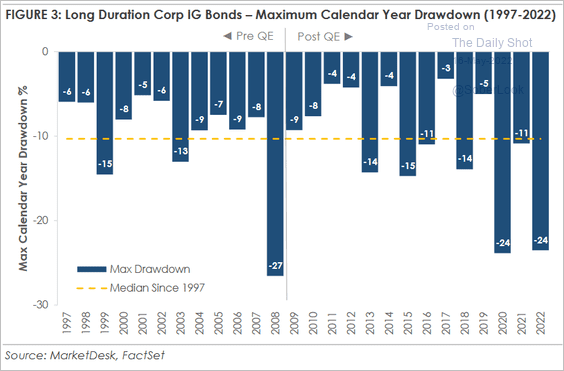 Source: MarketDesk Research
3. Given the elevated volatility, credit spreads are too tight.
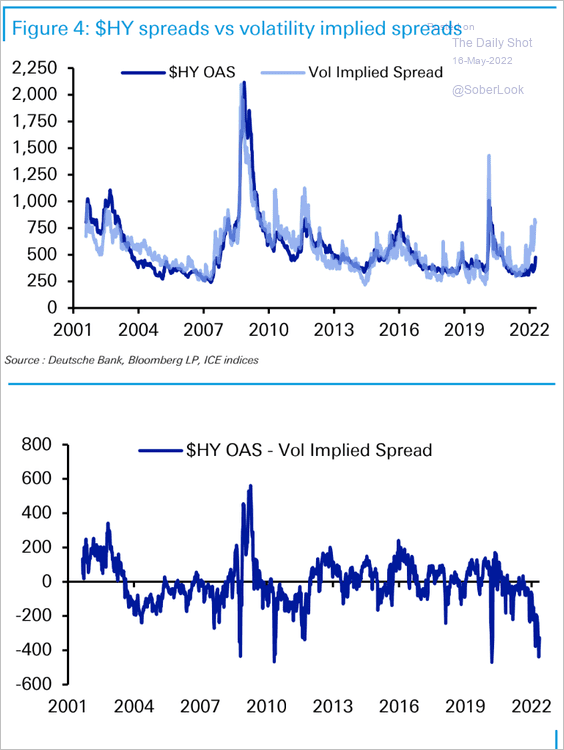 Source: Deutsche Bank Research
4. There is a lot of dry powder in private credit.
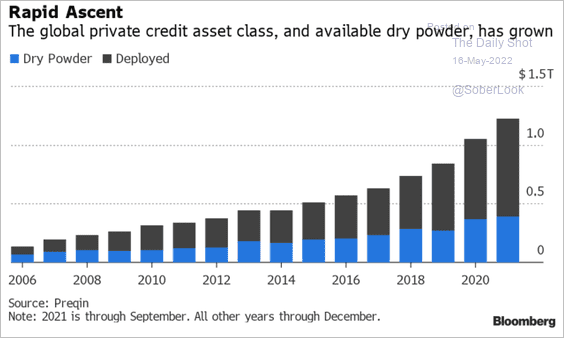 Source: Bloomberg Read full article
5. Business and consumer loans are growing by 3.7% YoY, which may help lift GDP growth this quarter.
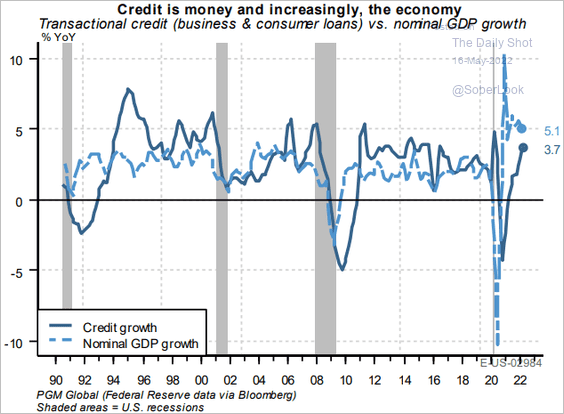 Source: PGM Global
Back to Index
Rates
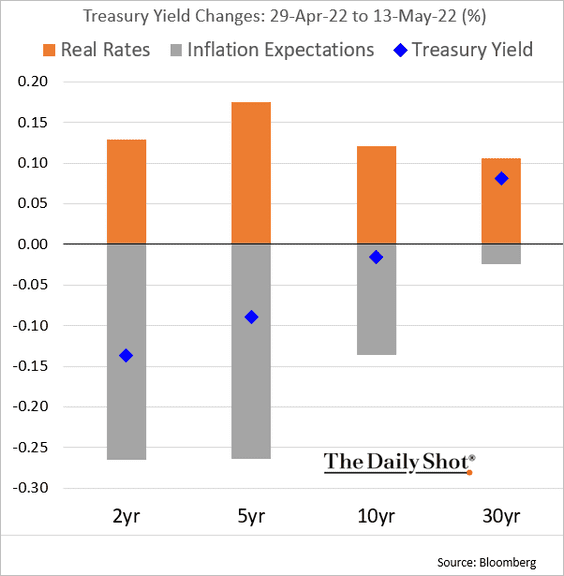
1. It’s been all about real rates this month, as inflation expectations pull back.
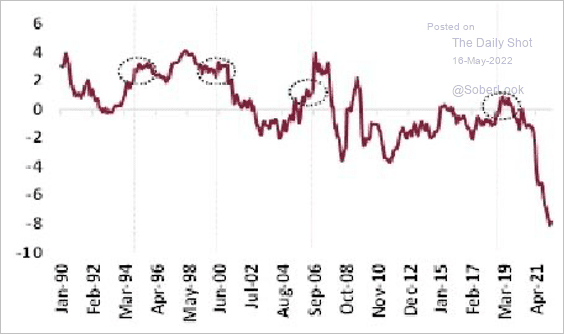
2. Are Treasuries undervalued?
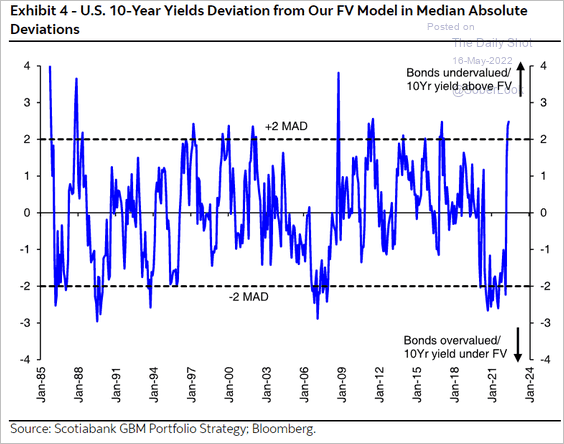 Source: Hugo Ste-Marie, Portfolio & Quantitative Strategy Global Equity Research, Scotia Capital
3. This chart shows the recent divergence between new 10yr note futures short positions and the 10yr Treasury yield.
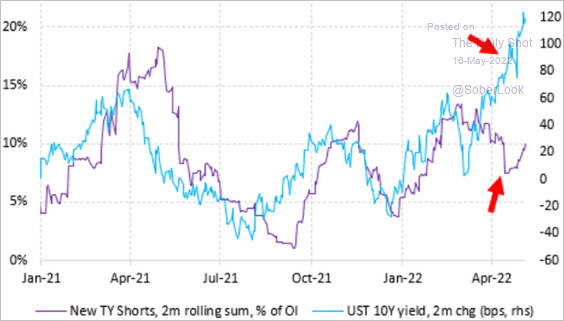 Source: Vanda Research
4. This is the first time the Fed is starting a hiking cycle with a negative real Fed funds rate. Each circle shows where the real rate was at the end of prior tightening cycles.
 Source: Bipan Rai; CIBC Capital Markets
Back to Index
Global Developments
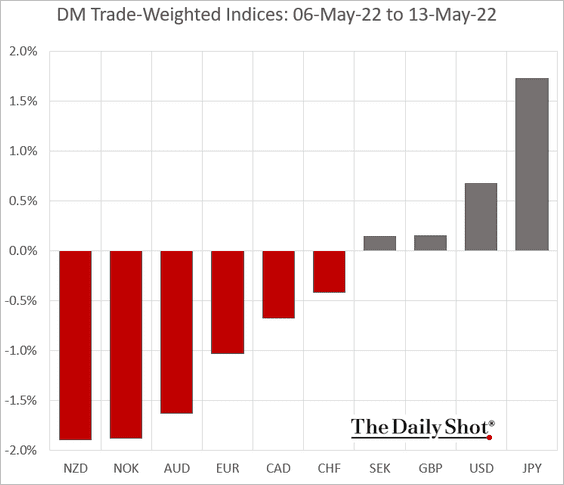
1. Let’s begin with last week’s performance data.
• Trade-weighted currency indices:
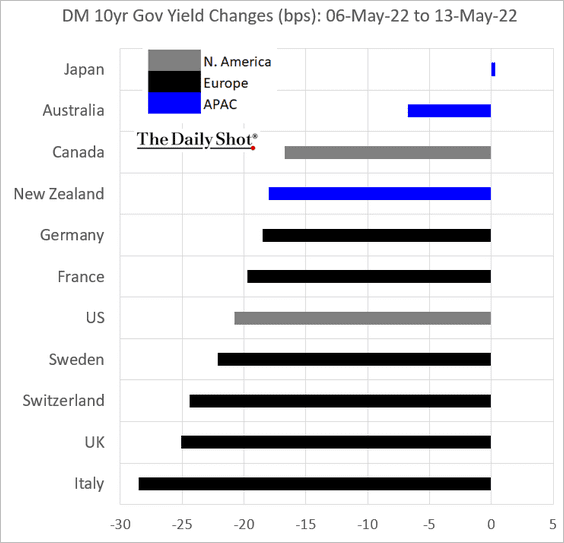
• Bond yield changes:
——————–
2. Which stock markets are in correction/bear-market territory?
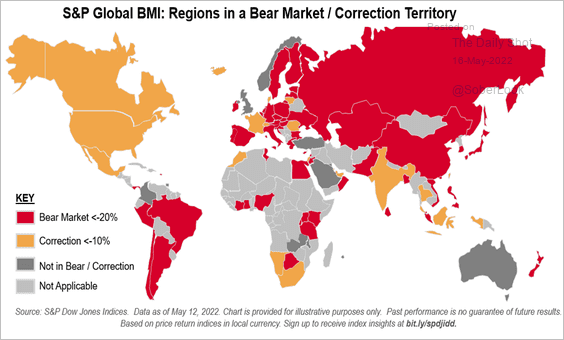 Source: S&P Global Market Intelligence
3. More news stories are mentioning “stagflation.”
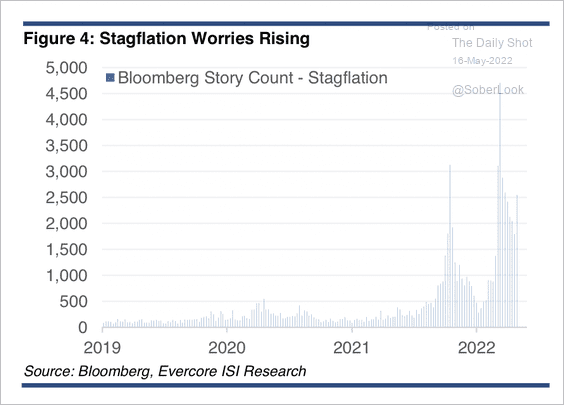 Source: Evercore ISI Research
4. Most economies are overshooting central banks’ inflation targets.
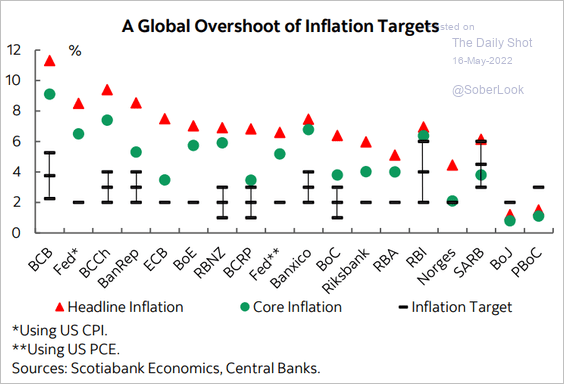 Source: Scotiabank Economics
BCA Research expects developed market inflation to ease (and fewer than expected rate hikes from the ECB).
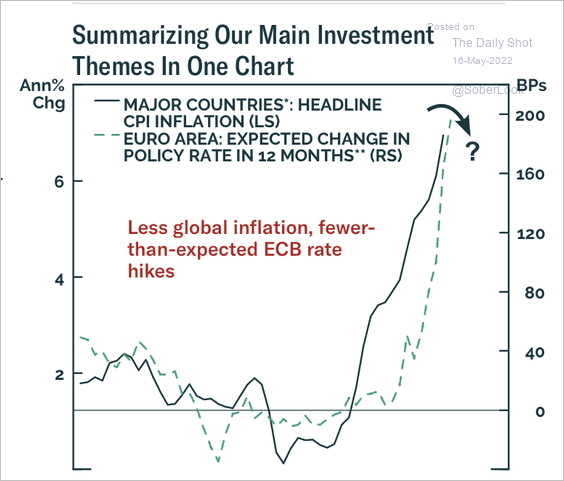 Source: BCA Research
Here is a forecast for policy rate trajectories from Morgan Stanley.
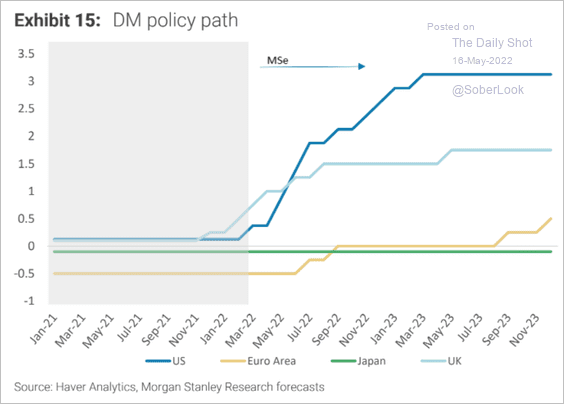 Source: Morgan Stanley Research
——————–
5. Real wages are under pressure.
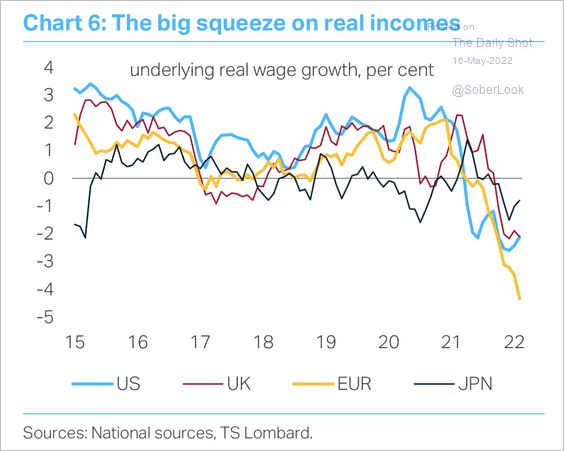 Source: TS Lombard
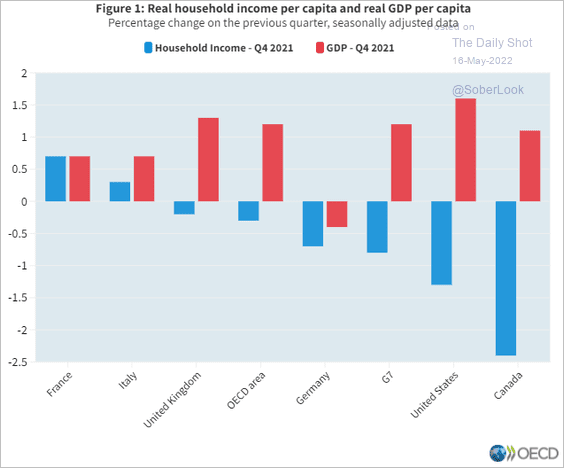 Source: OECD Read full article
——————–
6. Here is ANZ’s global leading indicator.
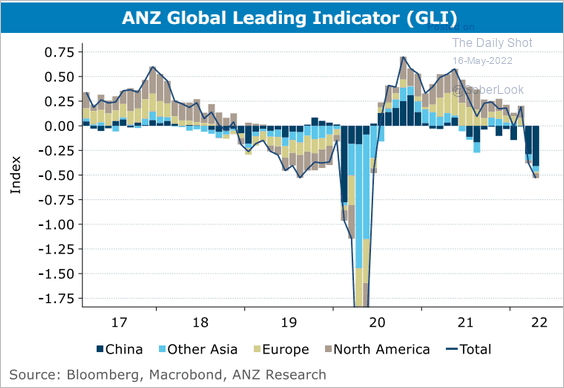 Source: @ANZ_Research
7. Housing in advanced economies is becoming less affordable.
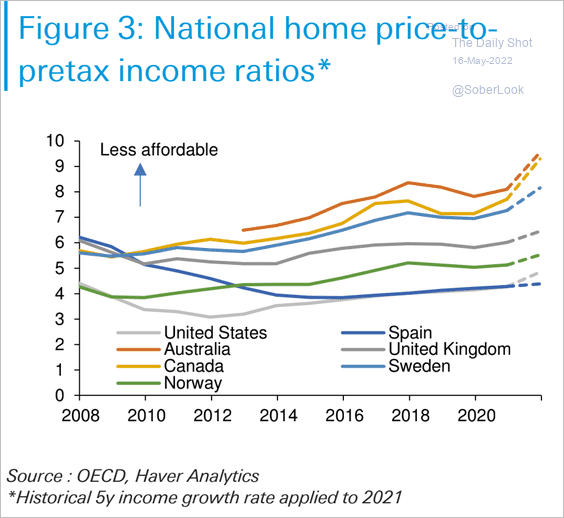 Source: Deutsche Bank Research
——————–
Food for Thought
1. Views on China across advanced economies:
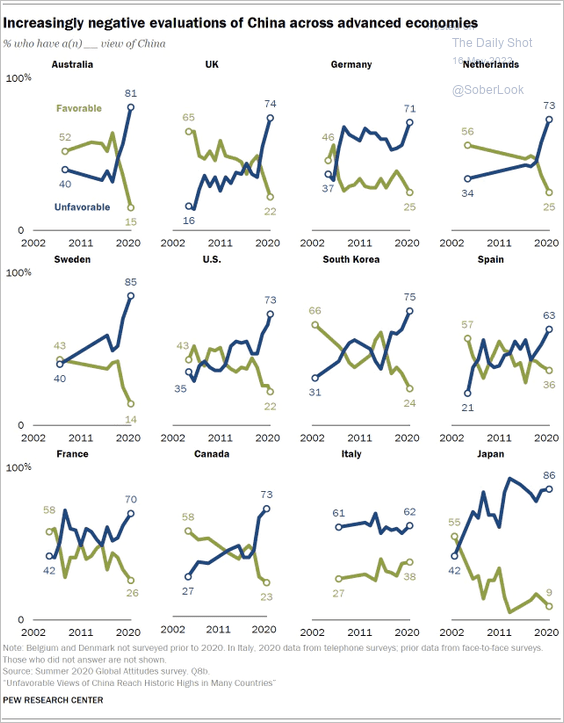 Source: Pew Research Center
2. The world’s biggest shipping hubs:
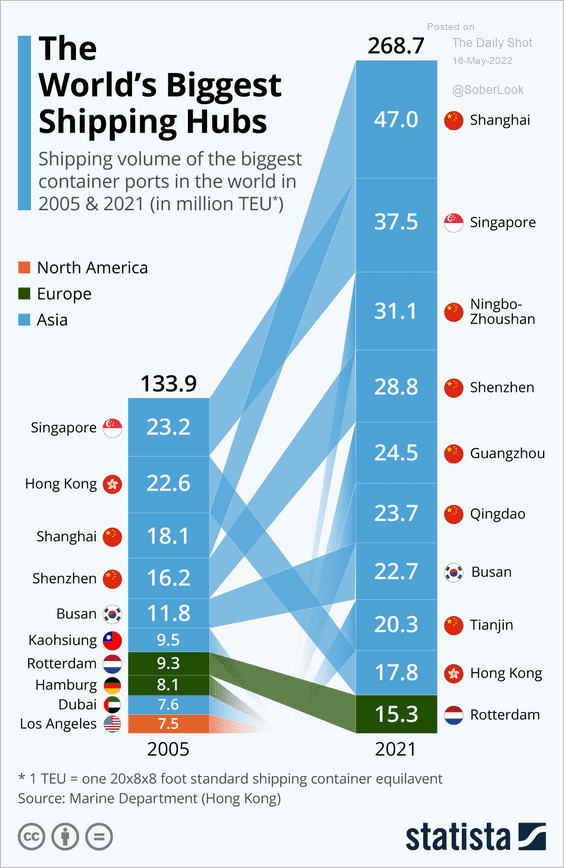 Source: Statista
3. Growth in fintech mortgage lending:
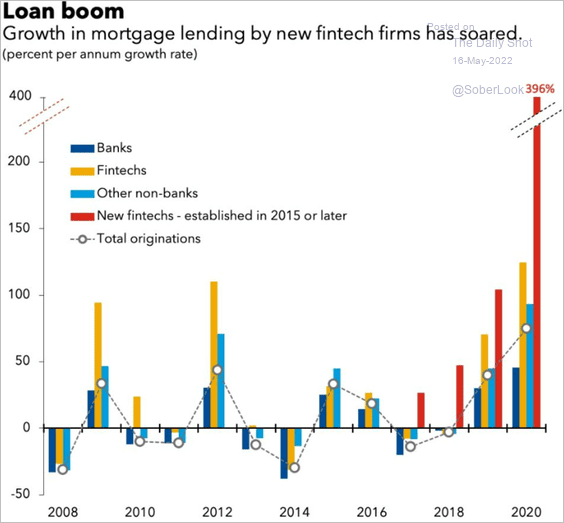 Source: IMF Read full article
4. Governments’ attempts to boost fertility rates:
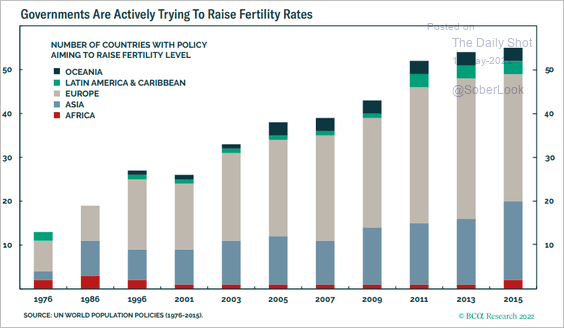 Source: BCA Research
5. The federal portfolio of direct student debt:
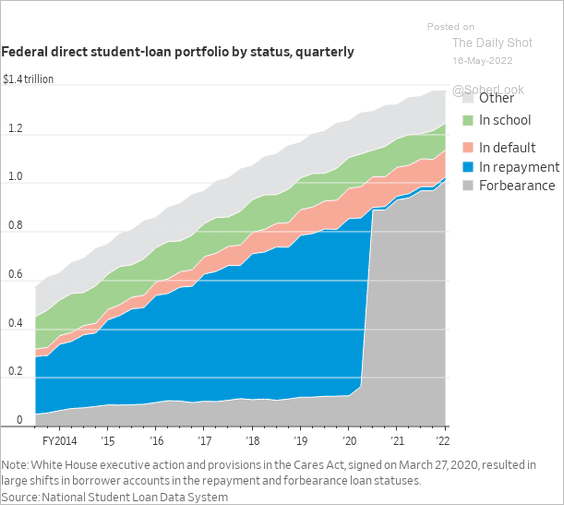 Source: @WSJ Read full article
6. Florida orange crop:
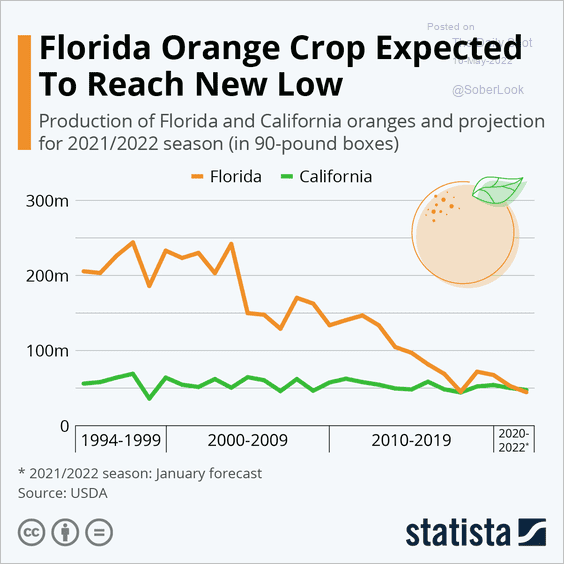 Source: Statista
7. Domestic extremism in the US:
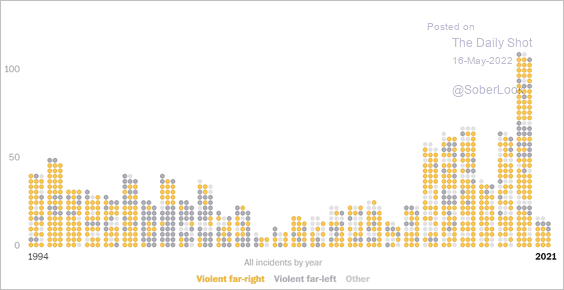 Source: The Washington Post Read full article
8. States expected to ban abortion:
 Source: Statista
9. Real tax liability changes over the past 30 years for the middle 20% of income earners:
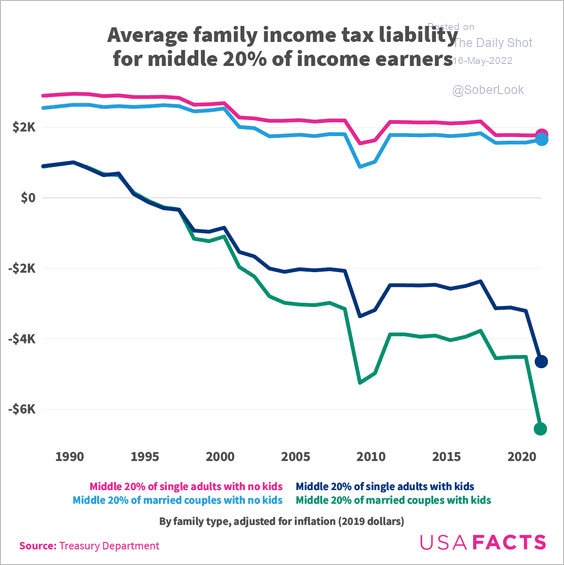 Source: USA Facts Read full article
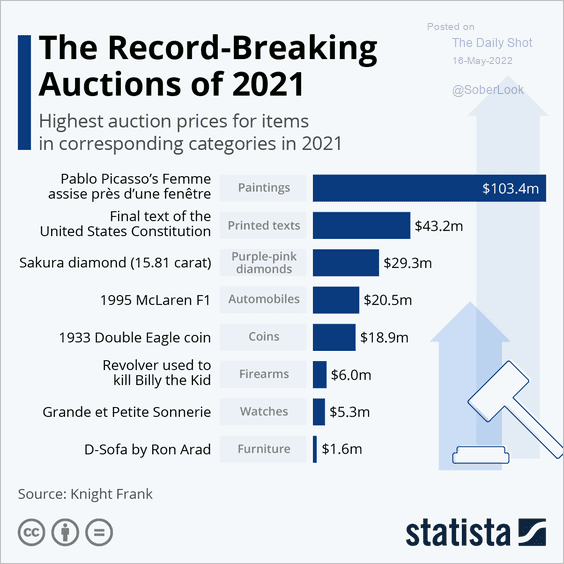
10. The record-breaking auctions of 2021:
——————–
Back to Index