The Daily Shot: 17-May-22
• The United States
• Canada
• The United Kingdom
• The Eurozone
• Asia – Pacific
• China
• Emerging Markets
• Cryptocurrency
• Commodities
• Energy
• Equities
• Credit
• Global Developments
• Food for Thought
The United States
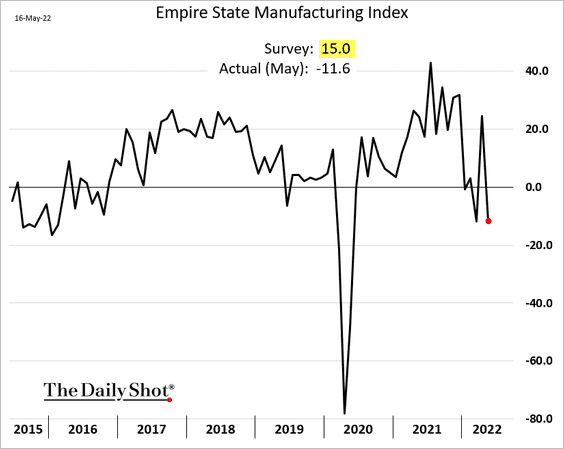
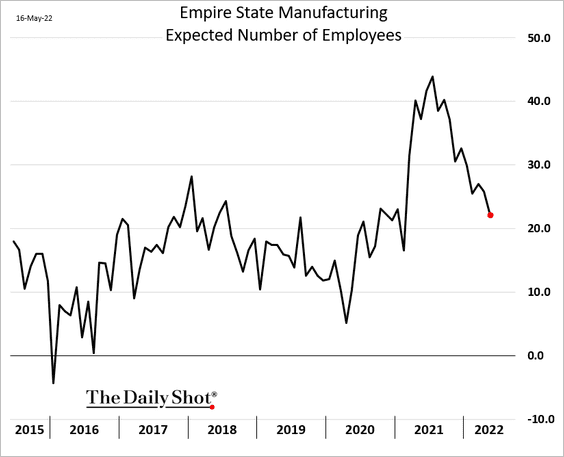
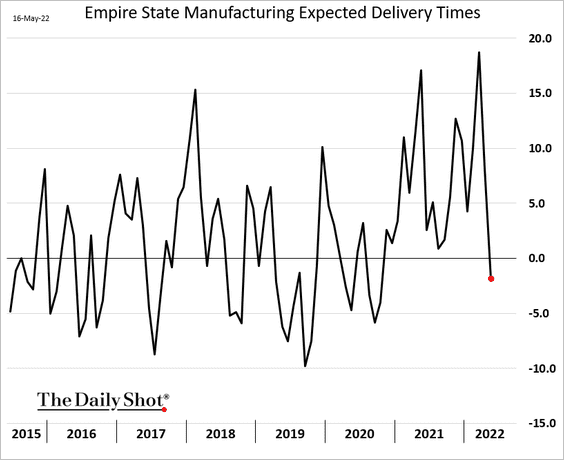
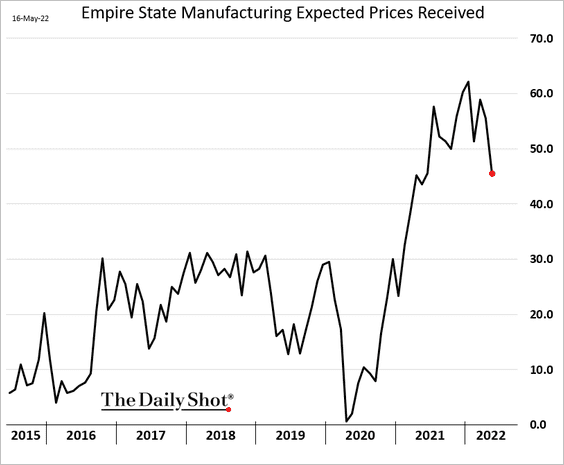
1. The NY Fed’s manufacturing index (the first regional report of the month) surprised to the downside.
• This report doesn’t bode well for manufacturing activity at the national level (ISM).
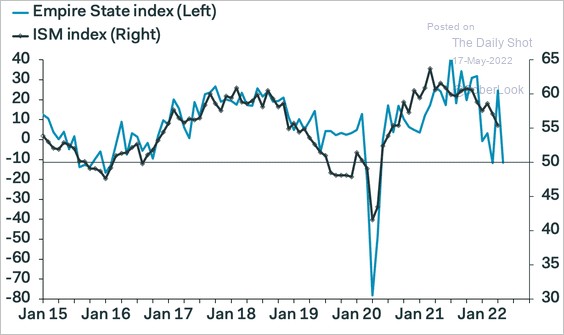 Source: Pantheon Macroeconomics
• Demand appears to have slowed.
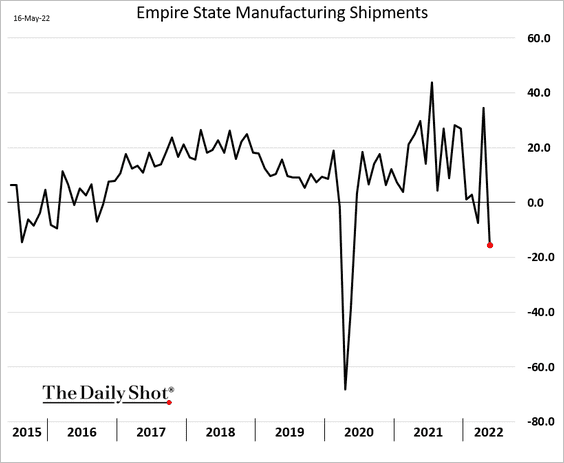
And backlogs are rapidly easing.
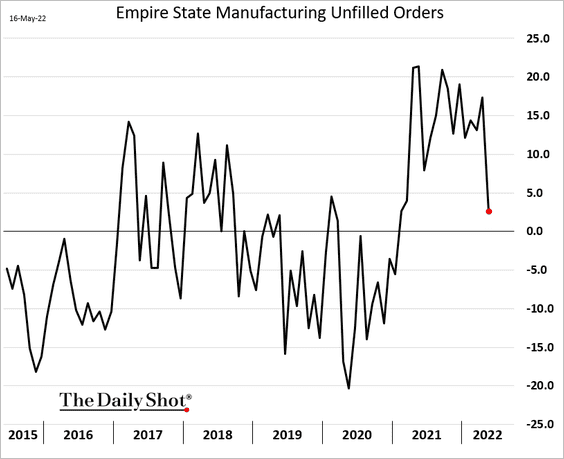
• Hiring expectations are moderating.
• Manufacturers expect delivery times to normalize in the months ahead.
• Price expectations seem to have peaked.
——————–
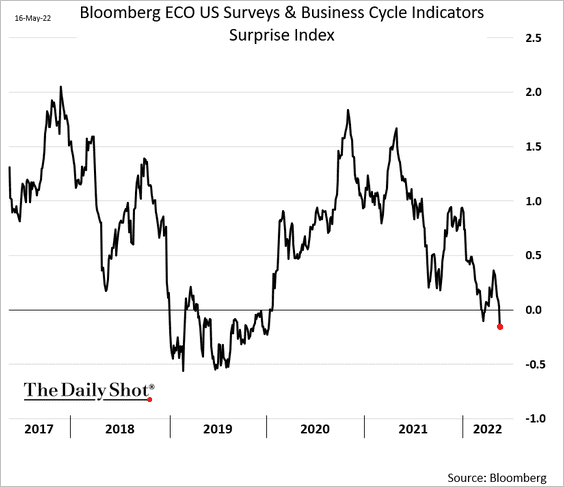
2. Bloomberg’s economic/cycle surprise index has been deteriorating.
Here is the number of stories mentioning “growth slowdown.”
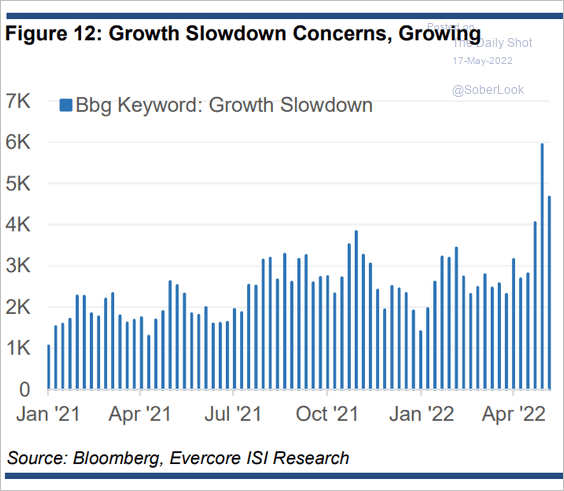 Source: Evercore ISI Research
——————–
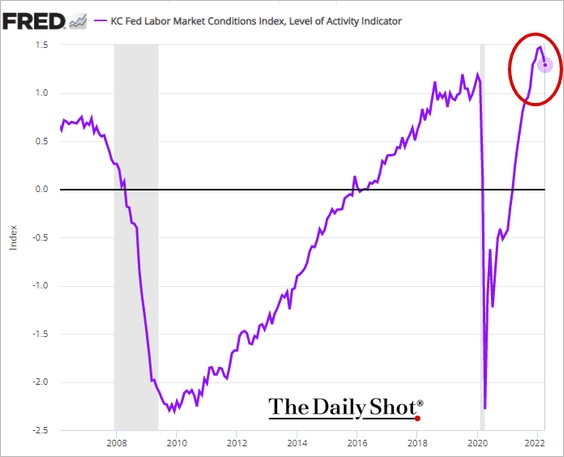
3. Next, we have a couple of updates on the labor market.
• Is the labor market losing momentum? Here is the Kansas City Fed’s national labor market conditions index.
• Economists are forecasting very tight US labor markets through the remainder of 2022 and into 2023.
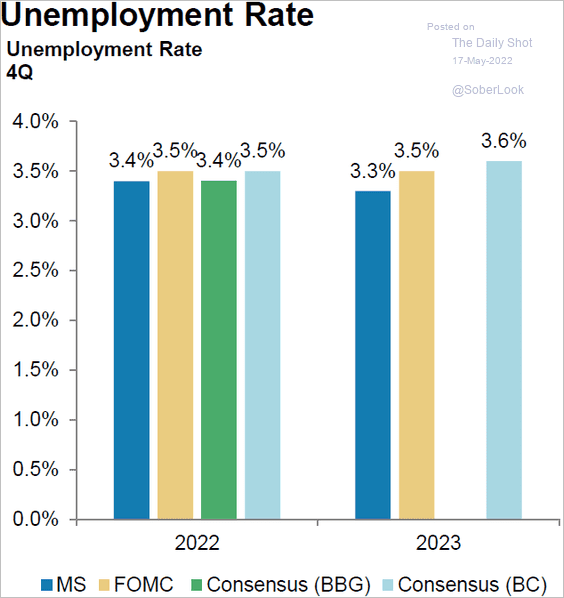 Source: Morgan Stanley Research
——————–
4. The savings of low-wage workers are shrinking.
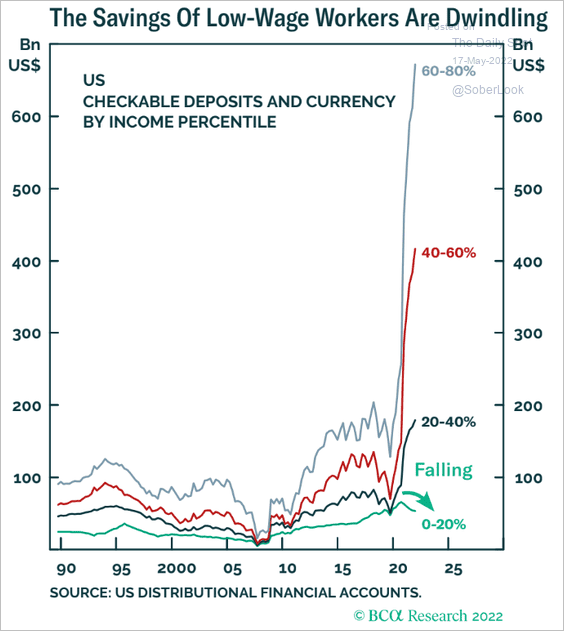 Source: BCA Research
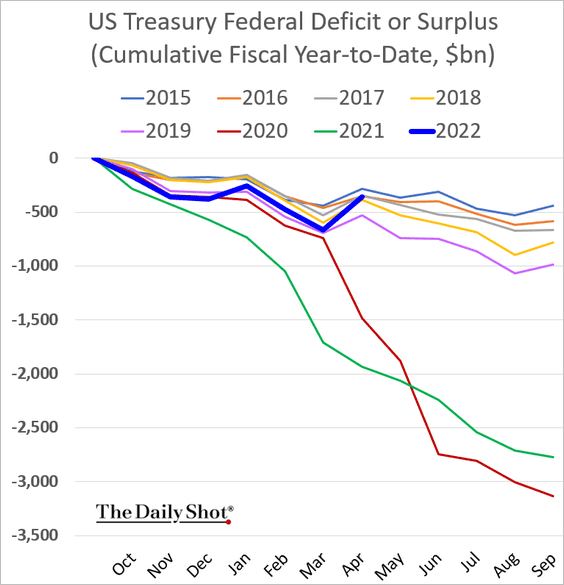
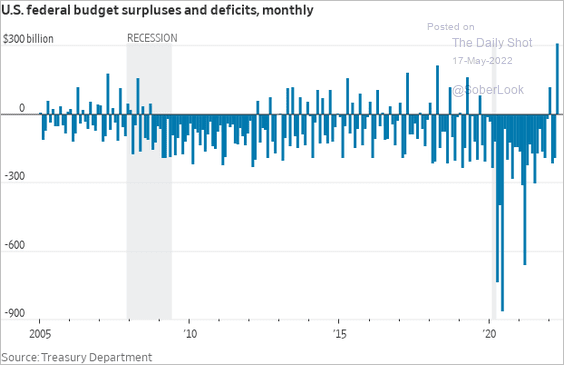
5. The federal budget situation improved markedly in April. Inflation is boosting government receipts by raising nominal wages and business earnings.
 Source: @WSJ Read full article
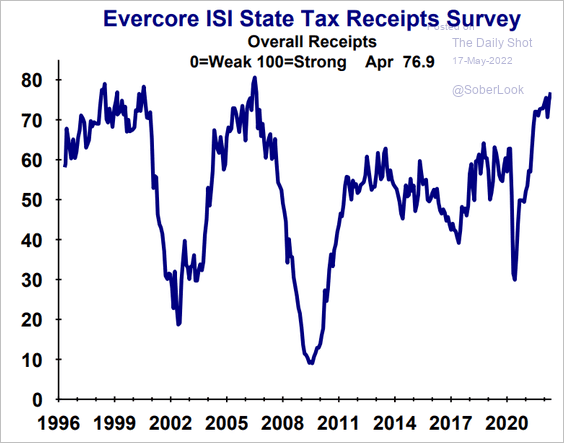
There is a similar situation at the state level.
 Source: Evercore ISI Research
Back to Index
Canada
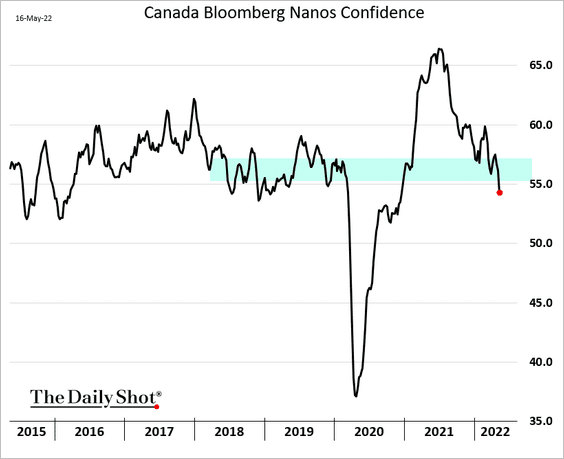
1. Consumer confidence is now below pre-COVID levels.
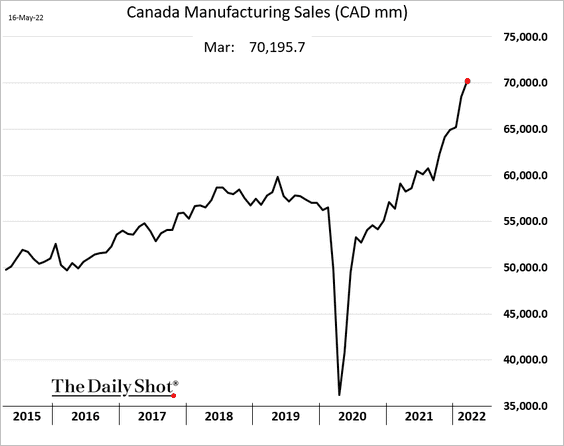
2. Manufacturing sales have been robust.
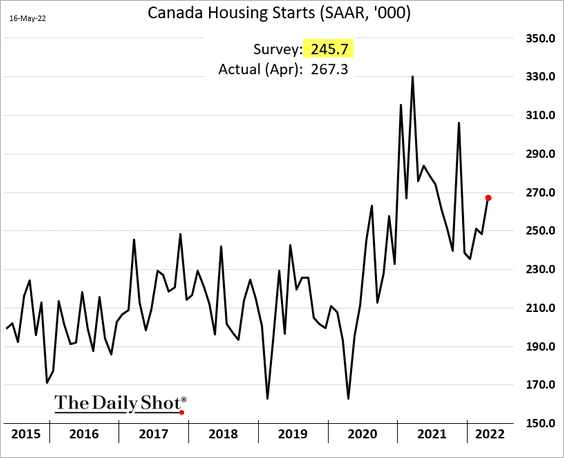
3. April housing starts surprised to the upside.
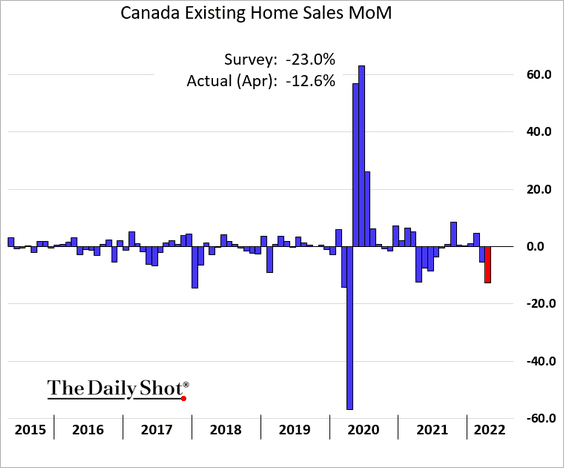
4. The decline in existing home sales last month was smaller than expected.
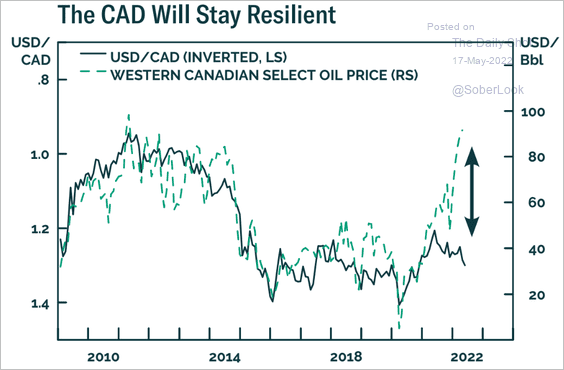
5. Crude oil prices should support the Canadian dollar.
 Source: BCA Research
Back to Index
The United Kingdom
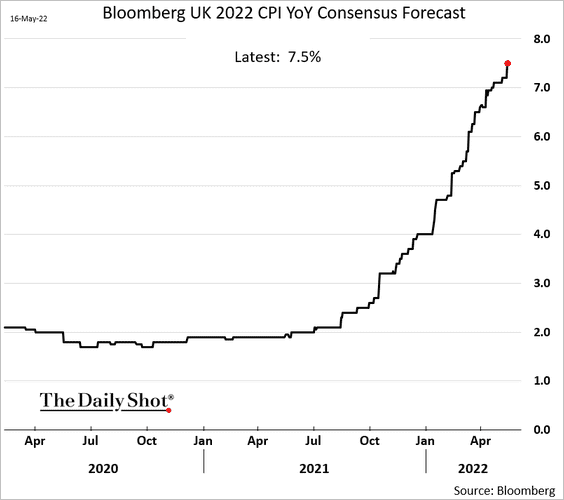
1. Economists continue to boost their forecasts for this year’s CPI.
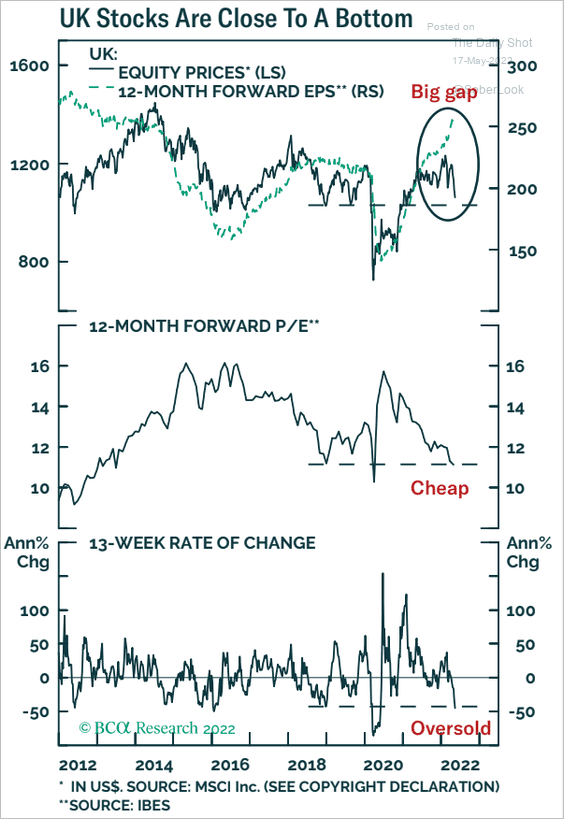
2. UK equities look cheap.
 Source: BCA Research
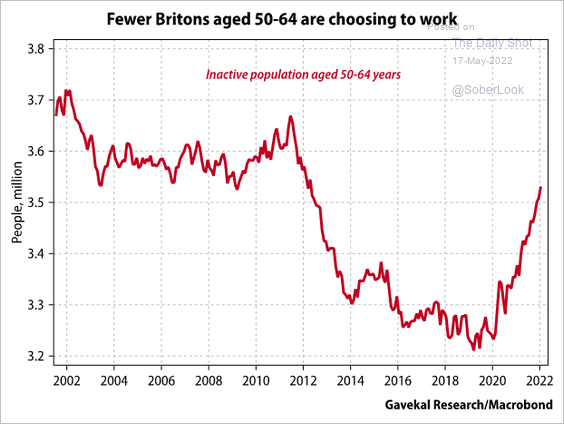
3. Here is the number of people aged 50-64 who are not working.
 Source: Gavekal Research
Back to Index
The Eurozone
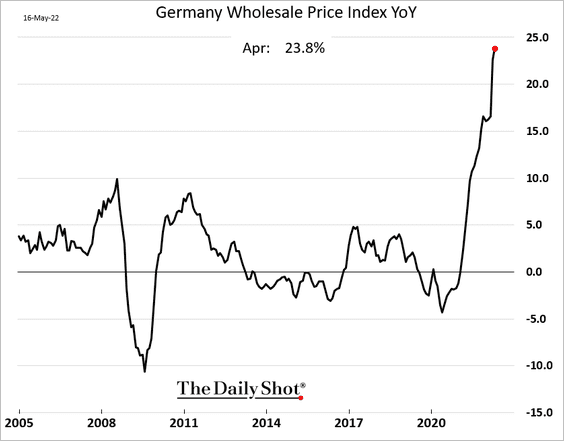
1. Germany’s wholesale price inflation continues to surge.
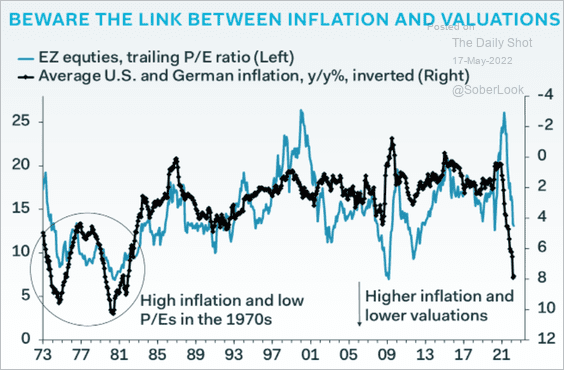
2. Inflation has been putting downward pressure on equity valuations.
 Source: Pantheon Macroeconomics
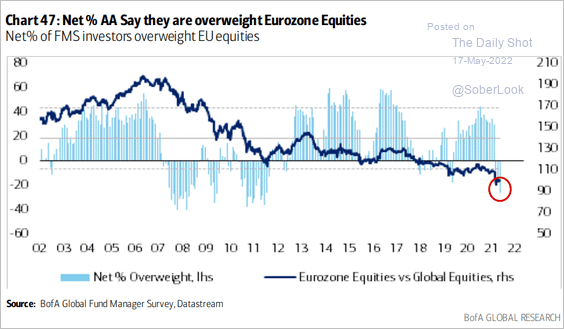
Fund managers haven’t been this bearish on Eurozone stocks in over a decade.
 Source: BofA Global Research
——————–
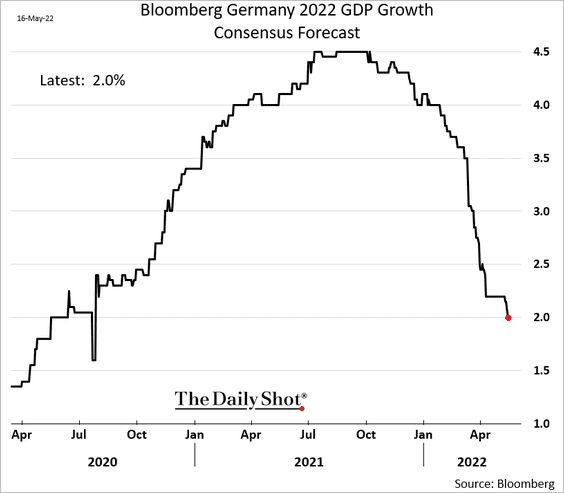
3. Economists continue to downgrade Germany’s GDP growth in 2022.
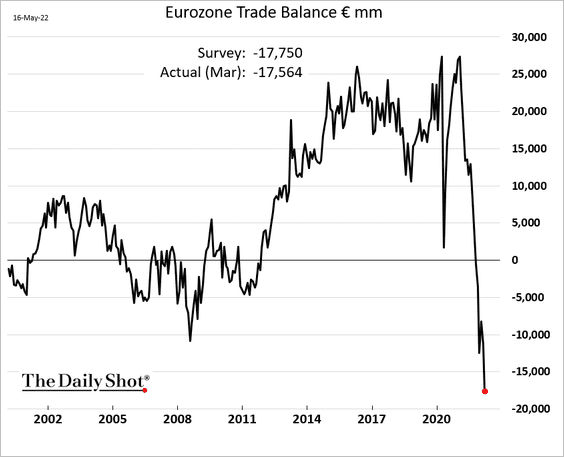
4. The recent spike in the Eurozone’s trade gap with China and surging energy costs sent the overall trade deficit to a new record.
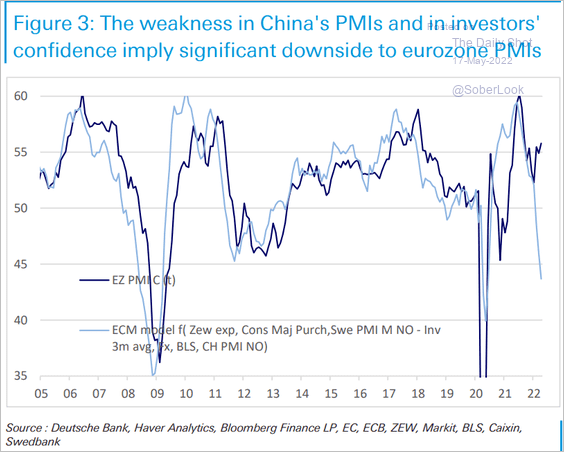
5. Euro-area business activity is facing downside risks.
 Source: Deutsche Bank Research
Back to Index
Asia – Pacific
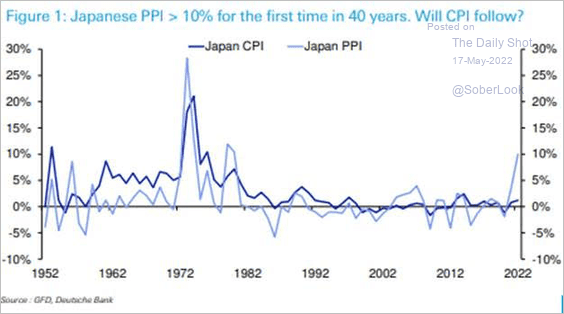
1. Japan’s PPI-CPI divergence could put pressure on margins and boost consumer inflation.
 Source: Deutsche Bank Research
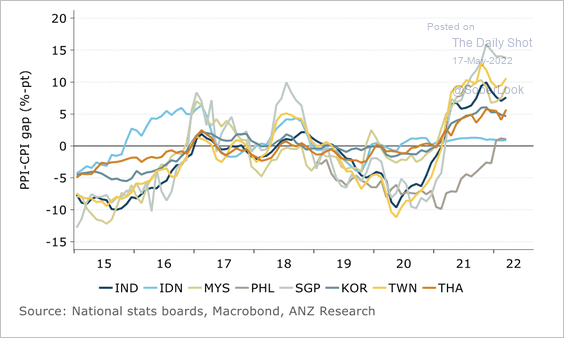
By the way, here is the PPI-CPI gap in other Asian economies.
 Source: @ANZ_Research
——————–
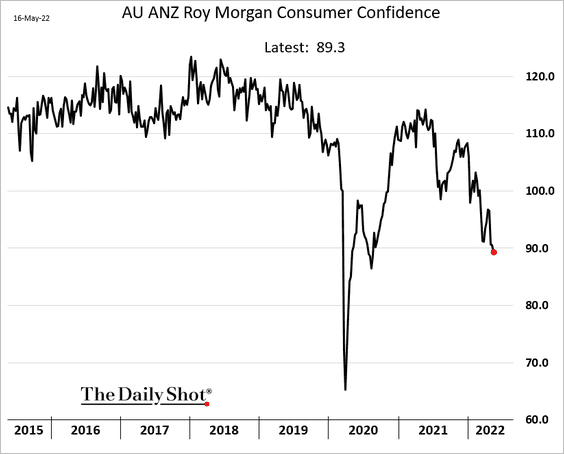
2. Australia’s consumer confidence continues to deteriorate.
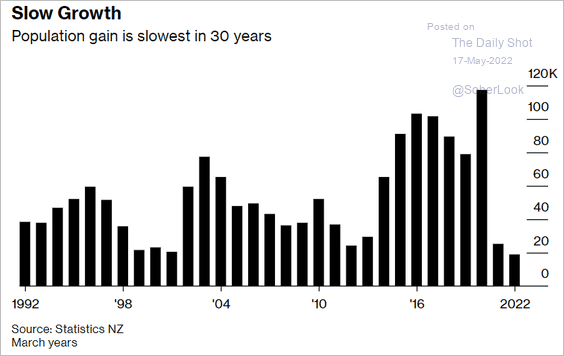
3. New Zealand’s population growth has stalled.
 Source: Bloomberg Read full article
Back to Index
China
1. We continue to see a “stealth” rate cut from the PBoC, …
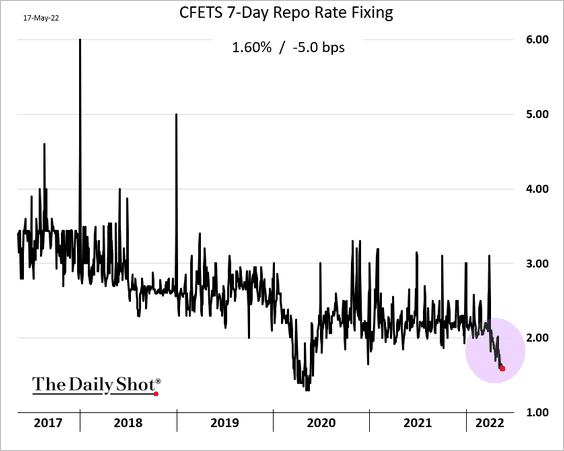
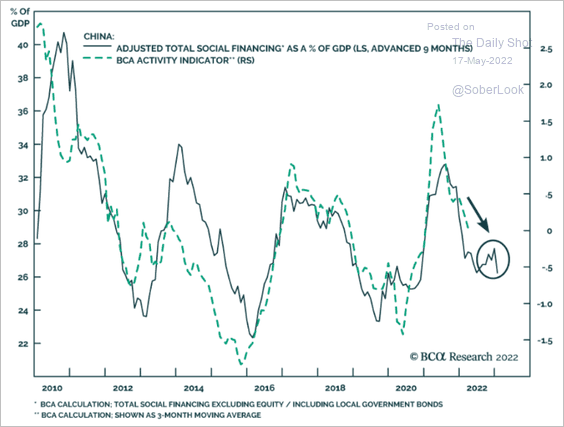
… as the credit slump threatens further deterioration in economic activity.
 Source: BCA Research
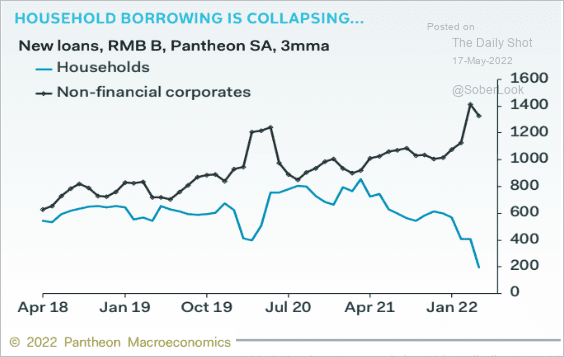
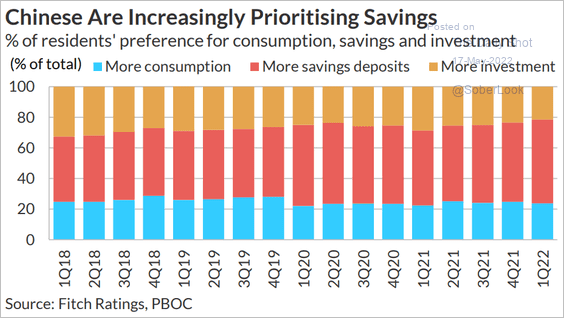
Household borrowing is collapsing, …
 Source: Pantheon Macroeconomics
… as consumers increasingly prioritize savings.
 Source: Fitch Ratings
——————–
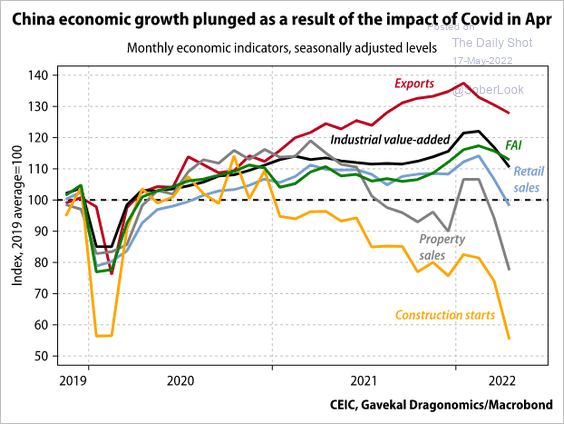
2. The lockdowns’ economic impact has been broad.
 Source: Gavekal Research
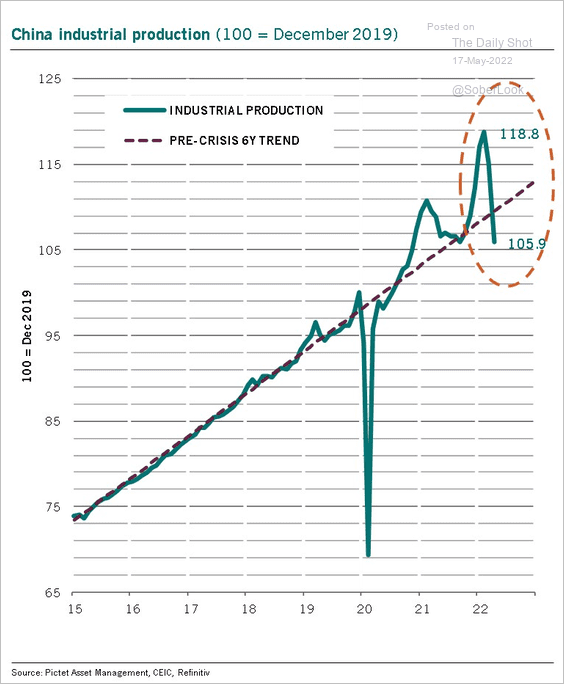
Industrial production is now below the pre-COVID trend.
 Source: @PkZweifel
——————–
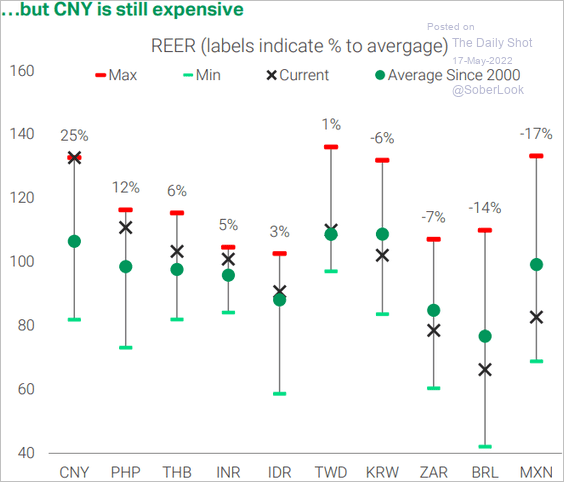
3. While the CNY has depreciated significantly in 2022, it remains expensive relative to its long-term average REER and relative to other currencies.
 Source: TS Lombard
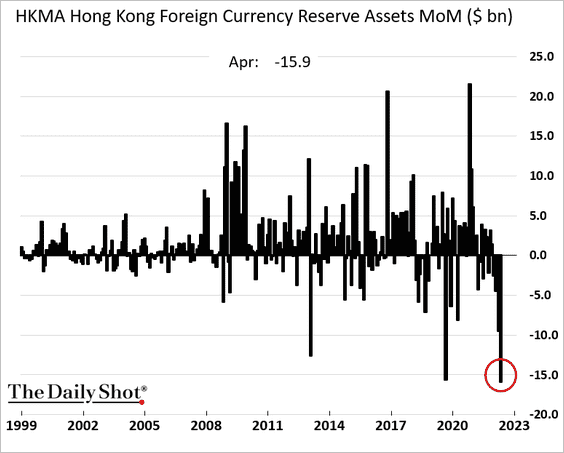
4. Hong Kong lost a record amount of FX reserves last month amid capital outflows.
Back to Index
Emerging Markets
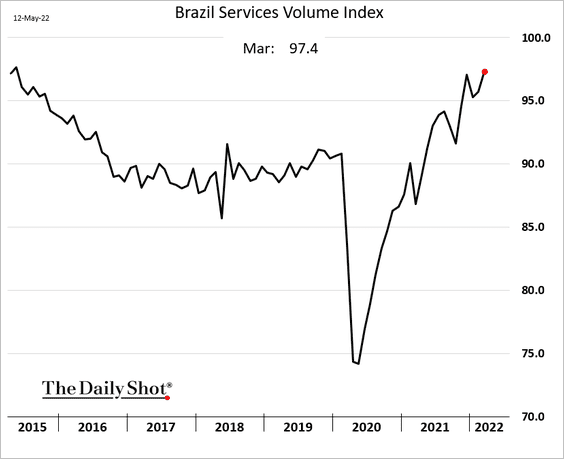
1. Brazil’s service sector output continues to grow.
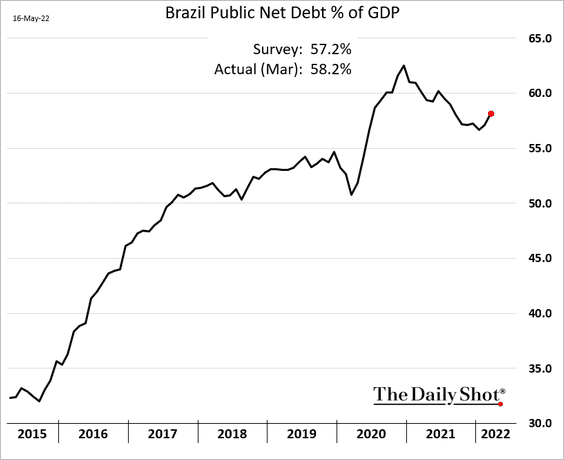
The debt-to-GDP ratio is turning up.
——————–
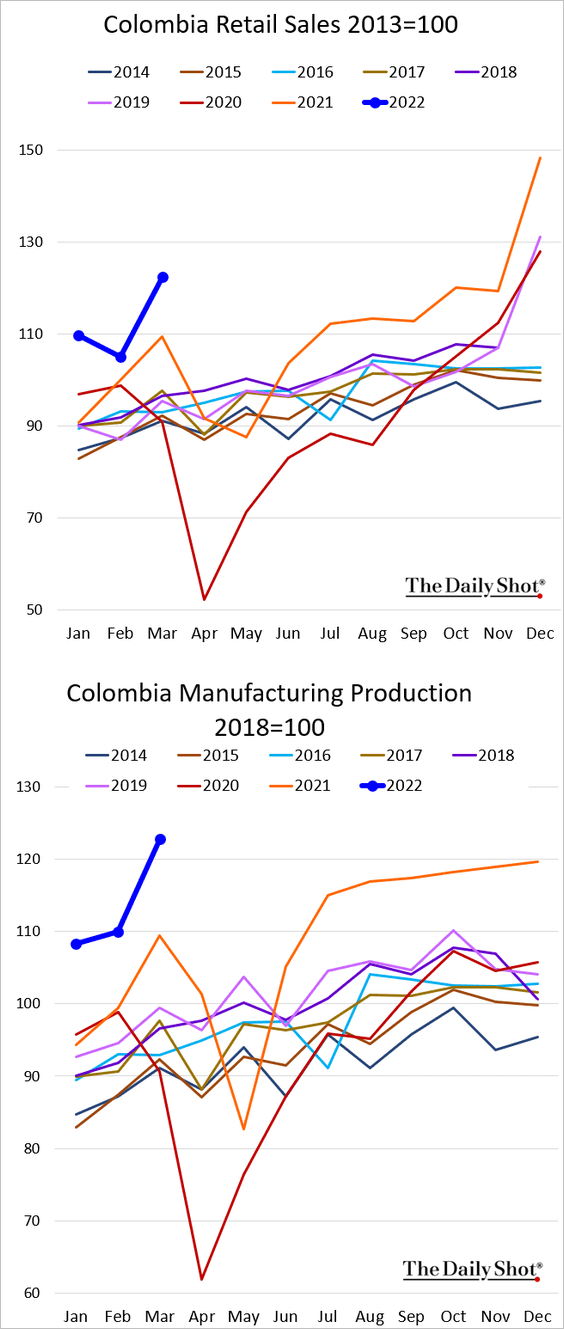
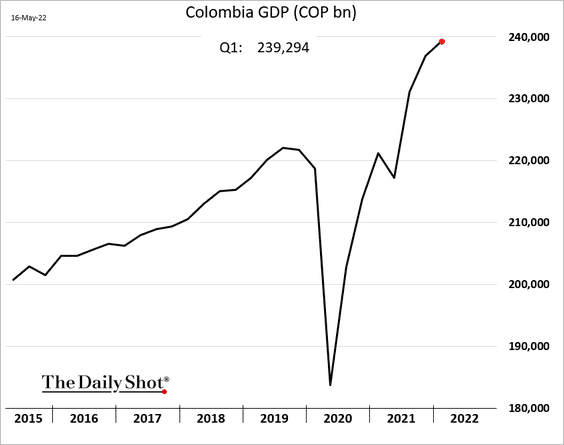
2. Colombia’s economic activity has been very strong.
Here is the GDP level.
——————–
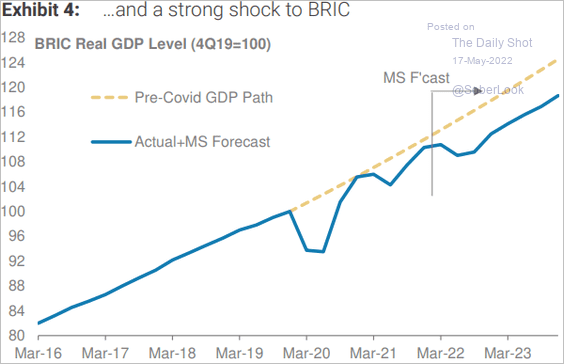
3. BRIC GDP growth is expected to remain below the pre-COVID trend.
 Source: Morgan Stanley Research
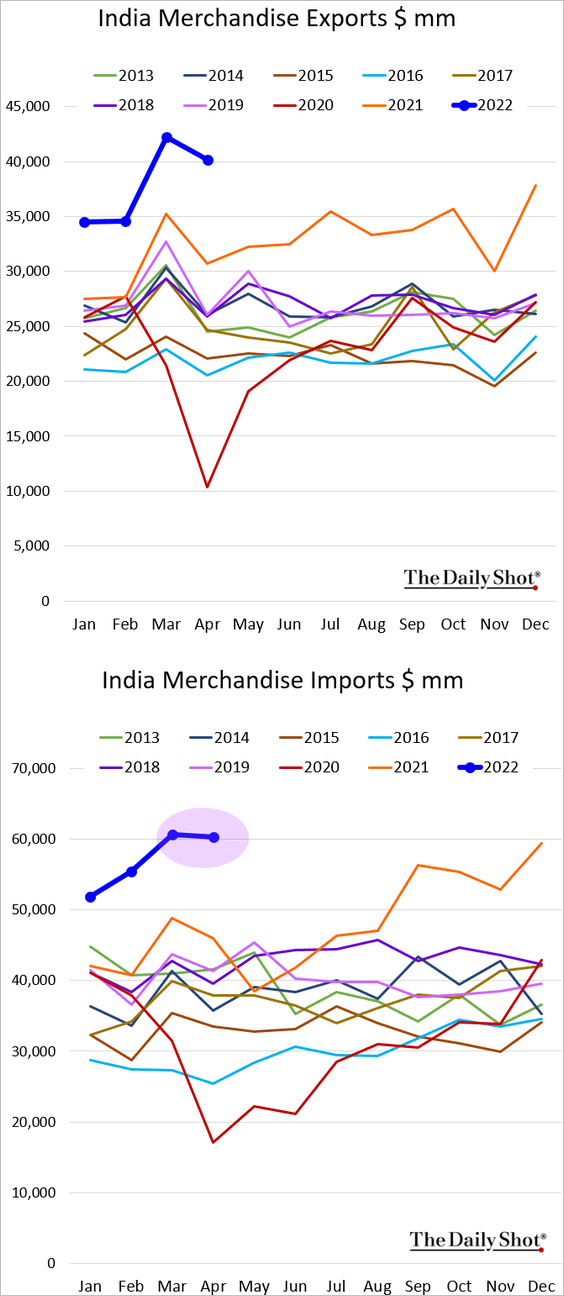
4. India’s imports were elevated for this time of the year due to high commodity costs.
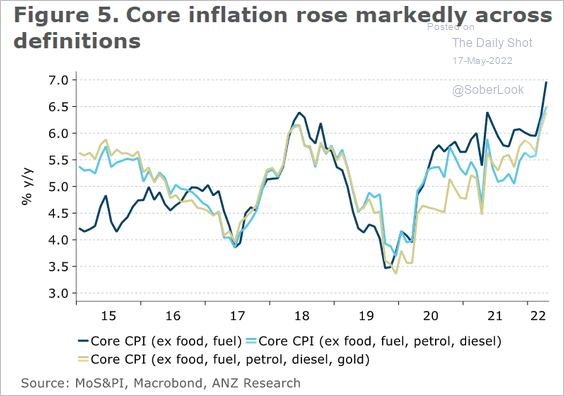
India’s core inflation continues to climb.
 Source: @ANZ_Research
——————–
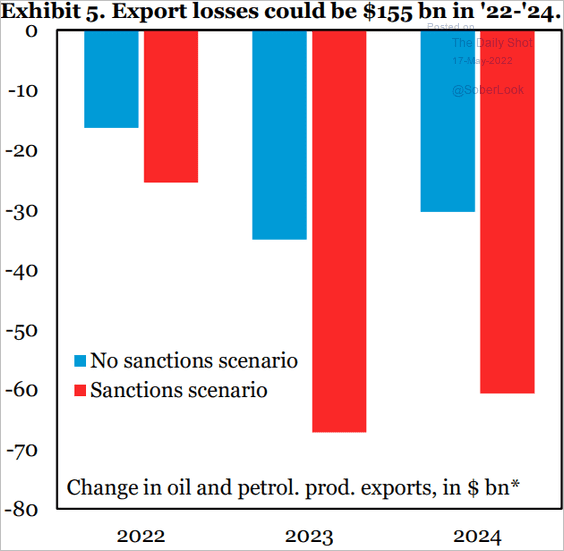
5. Russia’s export losses from the EU’s oil embargo could reach $155 bn.
 Source: TS Lombard
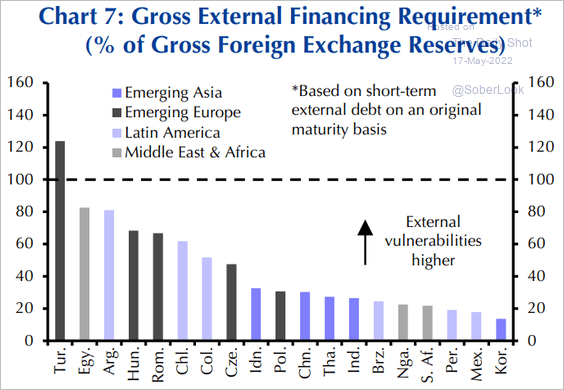
6. This chart shows each country’s external financing requirements as a share of their F/X reserves.
 Source: Capital Economics
Back to Index
Cryptocurrency
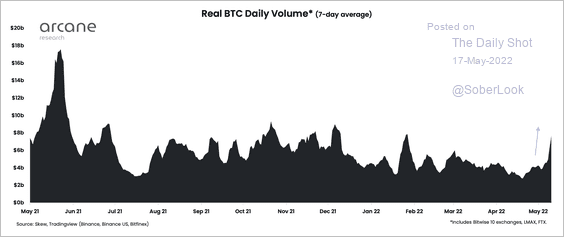
1. Bitcoin’s average trading volume rose toward its highest level since January last week.
 Source: Arcane Research Read full article
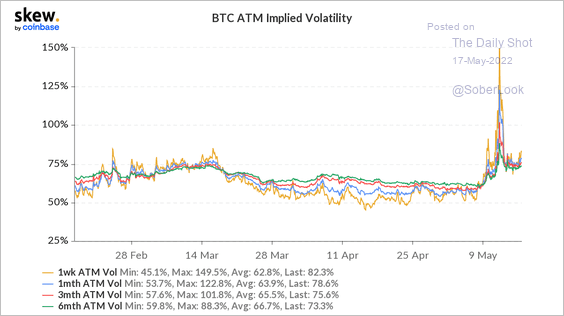
2. Bitcoin’s implied volatility remains elevated following last week’s sell-off.
 Source: @Coinbase_Insto
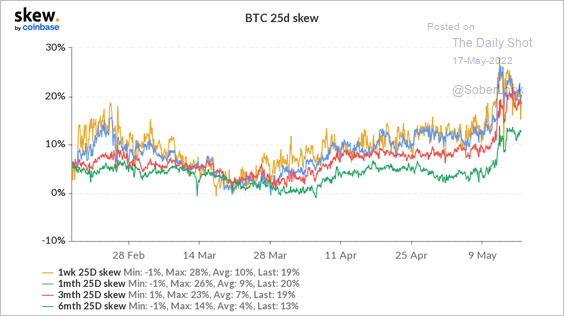
Bitcoin’s skew is also elevated, indicating stronger demand for puts than calls.
 Source: @Coinbase_Insto
——————–
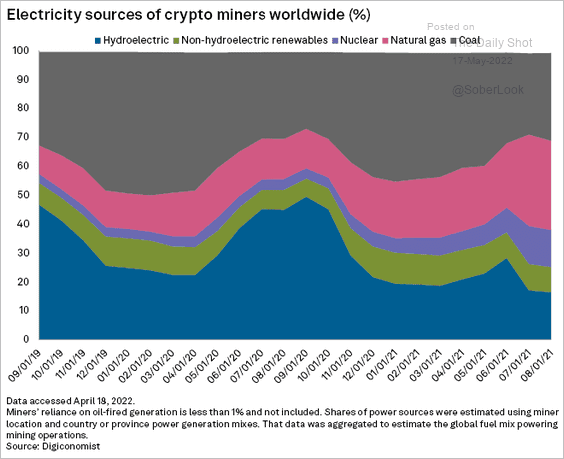
3. A relative reduction in coal usage has been a positive aspect of the bitcoin mining industry’s pivot out of China.
 Source: S&P Global Market Intelligence
Back to Index
Commodities
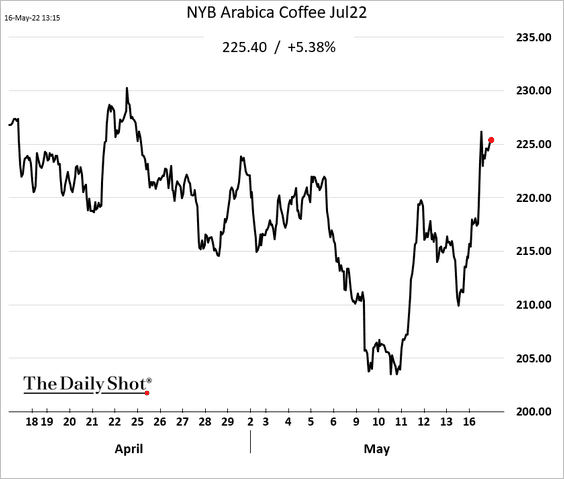
1. Coffee futures are surging due to concerns about frost conditions in Brazil.
 Source: barchart.com Read full article
——————–
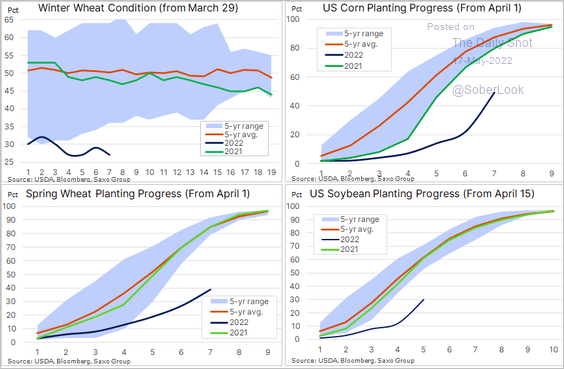
2. Crop conditions indicators for US grains have been less than ideal, especially for wheat.
 Source: @Ole_S_Hansen
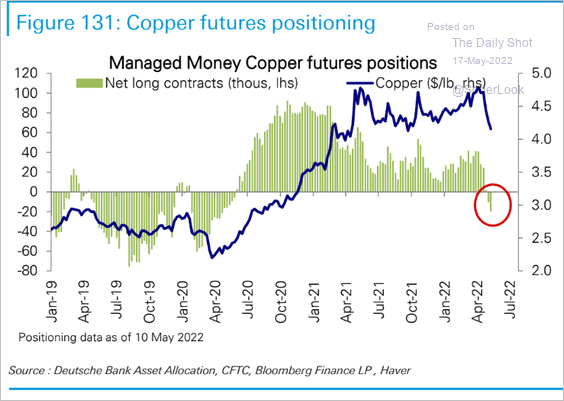
3. Hedge funds have soured on copper.
 Source: Deutsche Bank Research
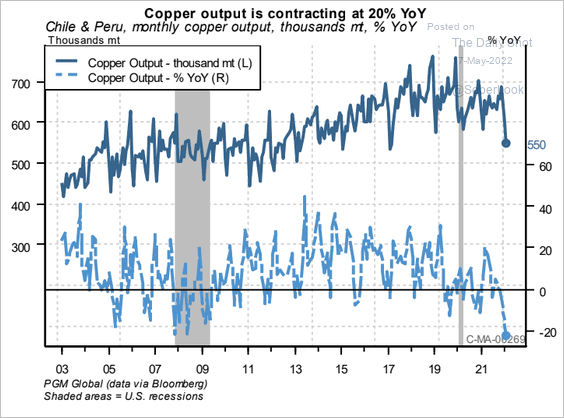
But copper output has been contracting.
 Source: PGM Global
——————–
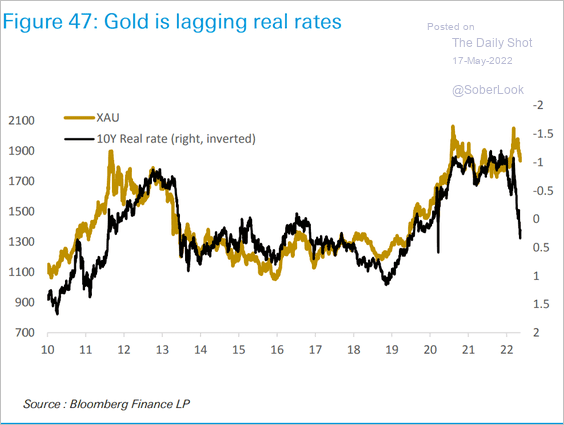
4. Gold has diverged from real rates.
 Source: Deutsche Bank Research
Back to Index
Energy
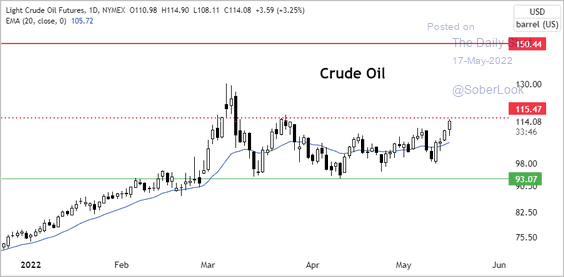
1. Will we see a breakout above $115 in WTI Crude Oil futures?
 Source: Aazan Habib; Paradigm Capital
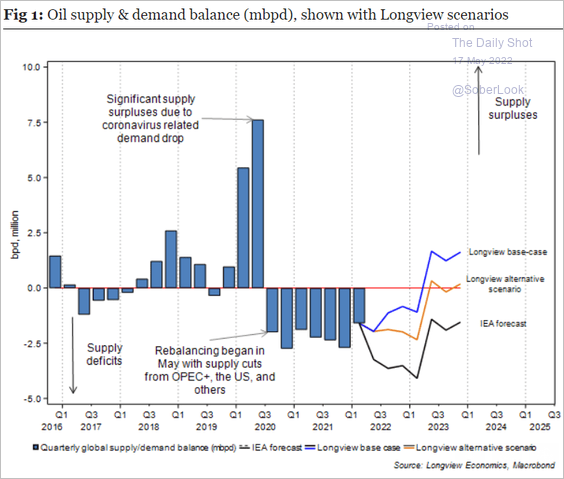
2. Will the global crude oil balance swing into surplus next year?
 Source: Longview Economics
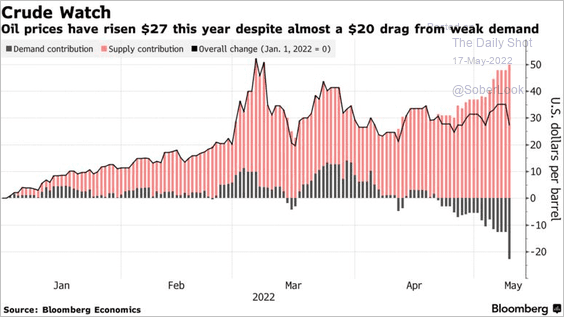
3. Next, we have oil price attribution from supply and demand.
 Source: Bloomberg Read full article
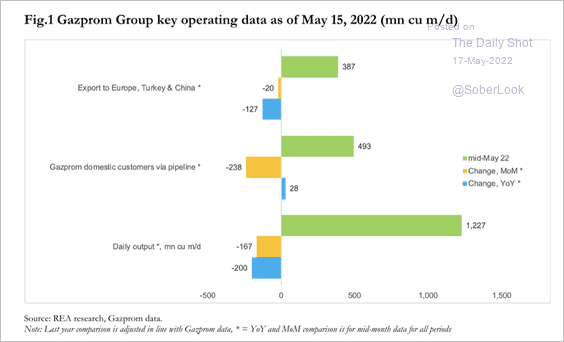
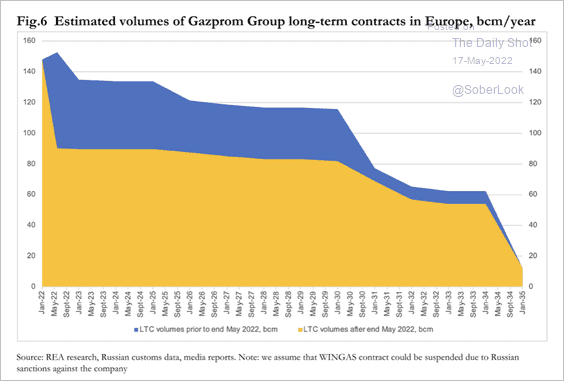
4. Russia’s Gazprom pipeline deliveries to domestic and regional customers declined over the past month. That might indicate that Gazprom is already cutting back volumes to non-compliant customers, according to Renaissance Energy Advisors (2 charts).
 Source: Nadia Kazakova; REA Research
 Source: Nadia Kazakova; REA Research
——————–
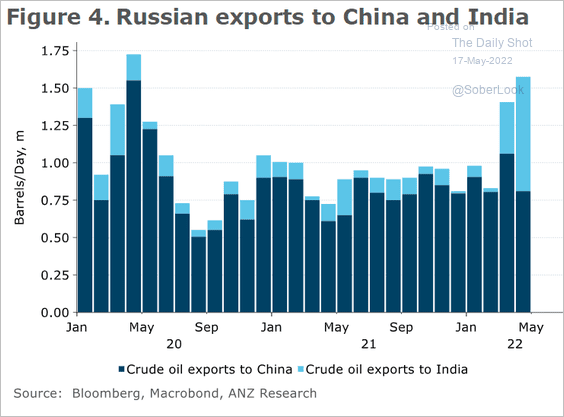
5. This chart shows Russian crude oil exports to China and India.
 Source: @ANZ_Research
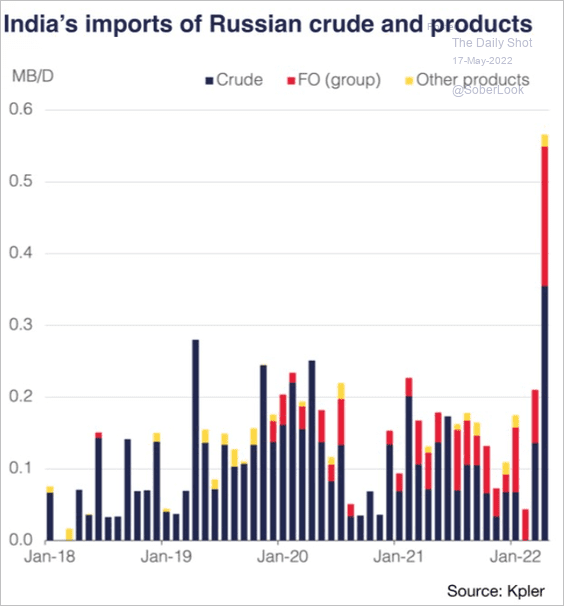
Here are India’s imports of Russian crude and refined products.
 Source: Oxford Institute for Energy Studies
——————–
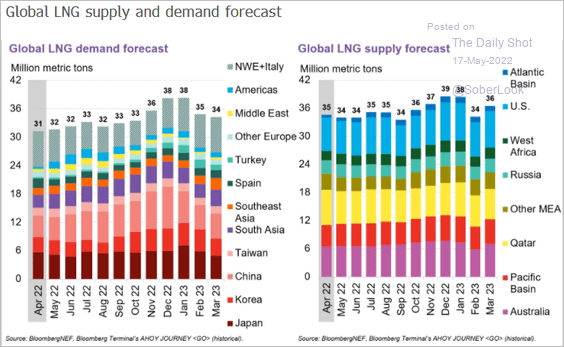
6. Finally, we have LNG supply and demand forecasts from BloombergNEF.
 Source: Michael Yip, BloombergNEF Read full article
Back to Index
Equities
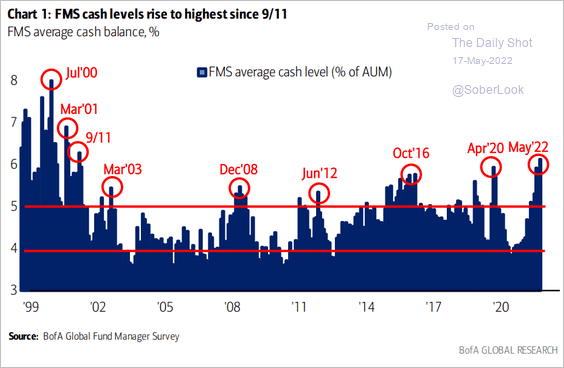
1. Fund managers are extremely bearish, according to BofA.
• Cash levels:
 Source: BofA Global Research
• Risk appetite:
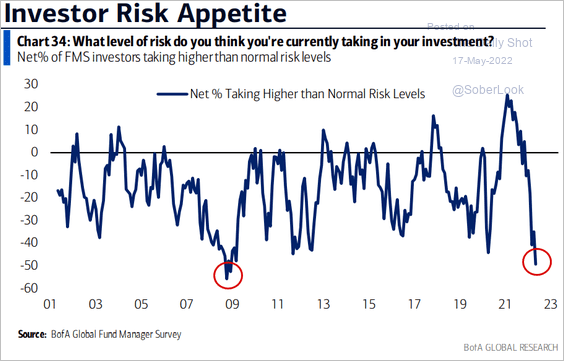 Source: BofA Global Research
Here are some additional sentiment indicators.
• The consolidated positioning index from Deutsche Bank.
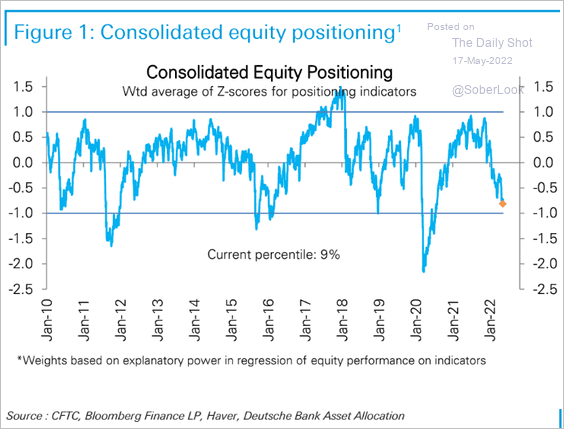 Source: Deutsche Bank Research
• Systematic strategies positioning:
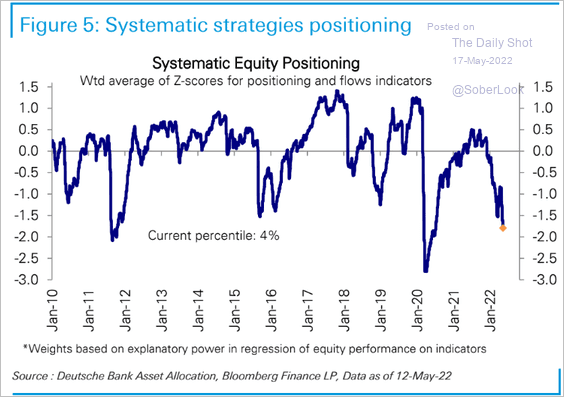 Source: Deutsche Bank Research
• Demand for puts relative to calls.
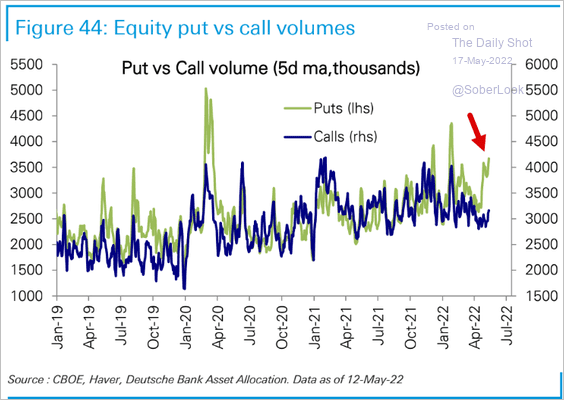 Source: Deutsche Bank Research
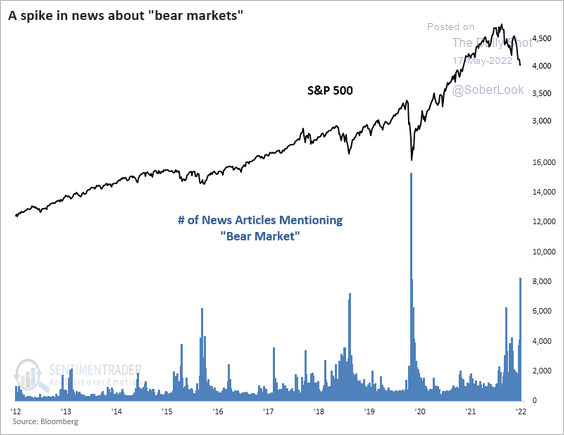
• A spike in the number of news articles mentioning “bear market.”
 Source: SentimenTrader
——————–
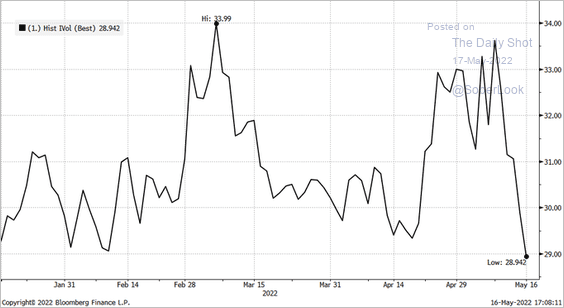
2. But sentiment seems to be shifting. This chart shows the S&P 500 June 3,800 put volatility.
 Source: @danny_kirsch
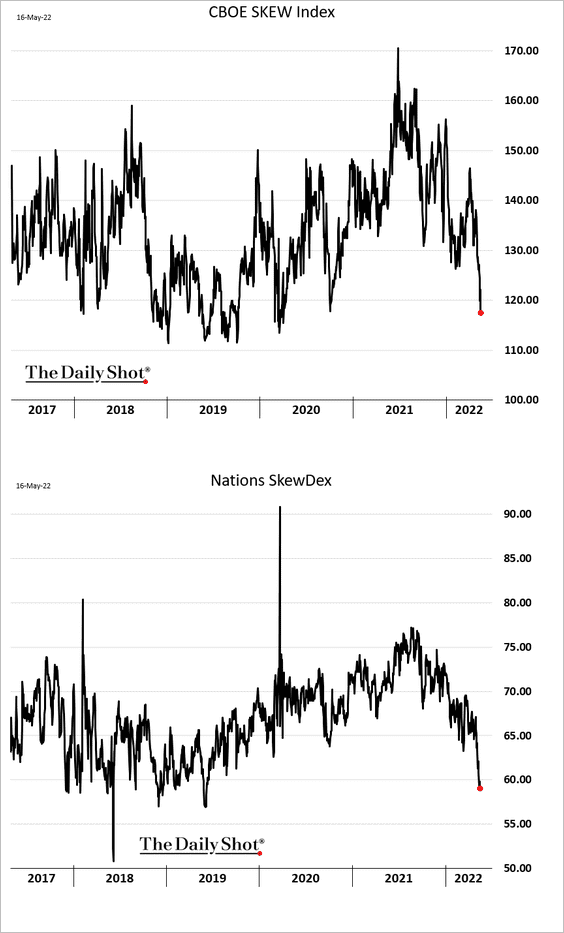
3. Skew indicators are rapidly moving lower.
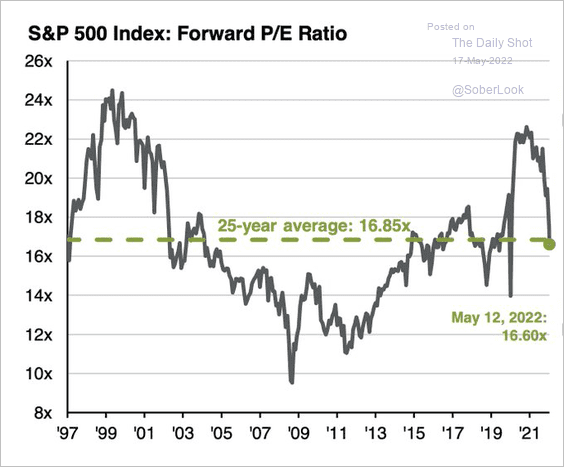
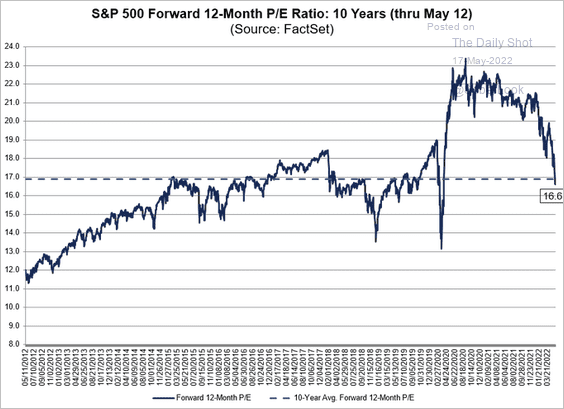
4. Next, we have the S&P 500 forward P/E ratio vs. historical averages.
• 25 years:
 Source: J.P. Morgan Asset Management
• 10 years:
 Source: @FactSet Read full article
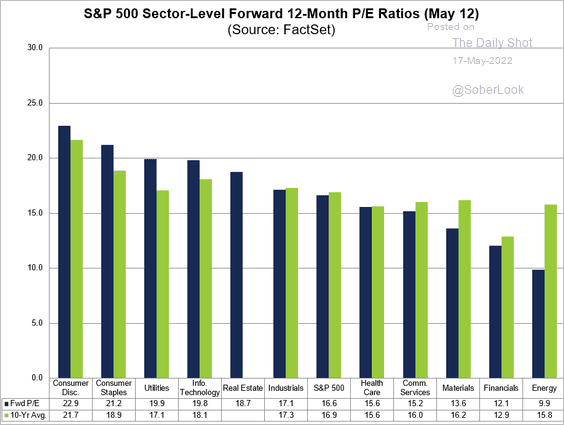
And here are the forward P/E ratios vs. historical averages by sector.
 Source: @FactSet Read full article
——————–
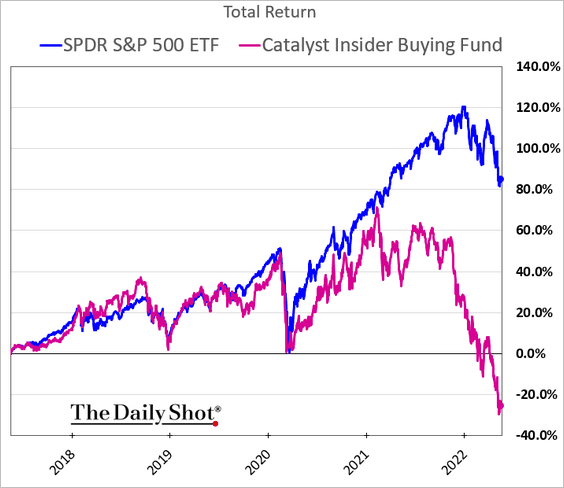
5. Following insider buying activity hasn’t been a good strategy over the past year.
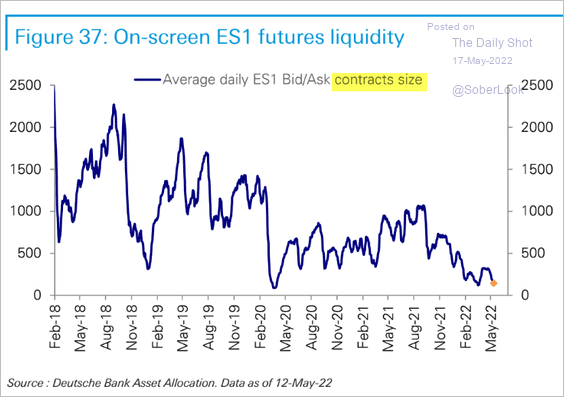
6. S&P 500 futures liquidity has been deteriorating.
 Source: Deutsche Bank Research
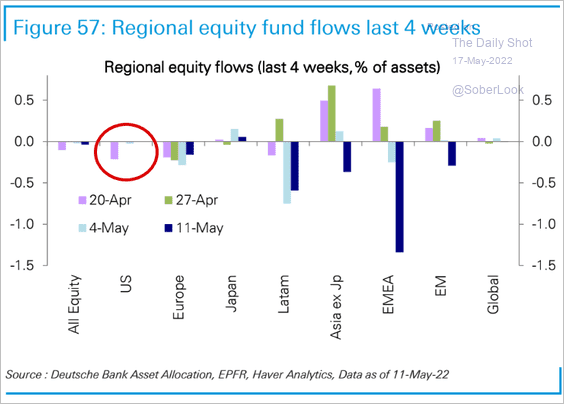
7. US equities have not experienced significant fund outflows in recent weeks.
 Source: Deutsche Bank Research
Back to Index
Credit
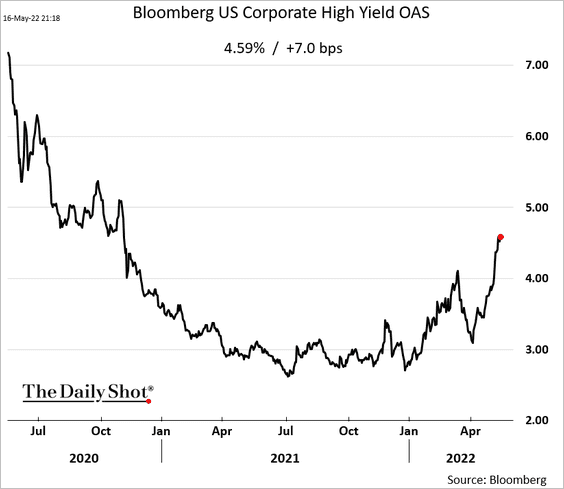
1. US high-yield spreads continue to widen.
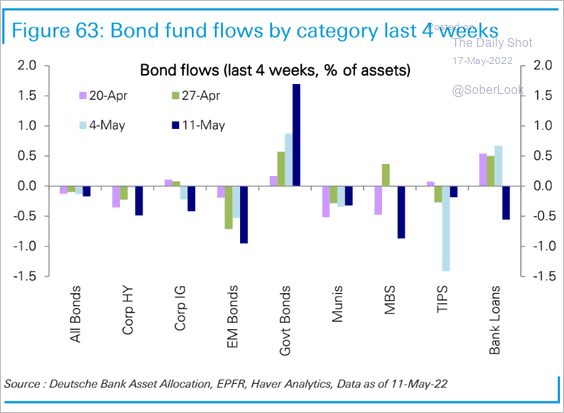
2. This chart shows recent fund flows across fixed-income categories.
 Source: Deutsche Bank Research
Back to Index
Global Developments
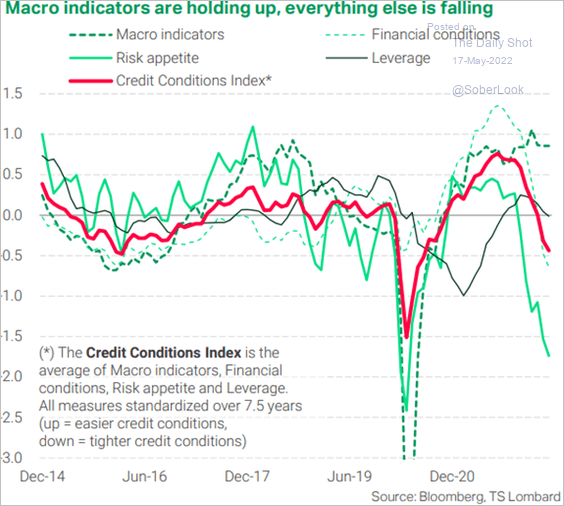
1. In addition to weakening credit conditions, risk appetite, financial conditions, and leverage have all turned down as well, with only macro indicators remaining to confirm the impending slowdown.
 Source: TS Lombard
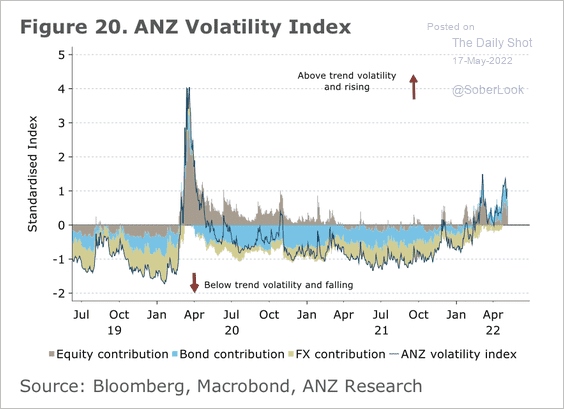
2. Volatility remains elevated, driven by bond markets.
 Source: @ANZ_Research
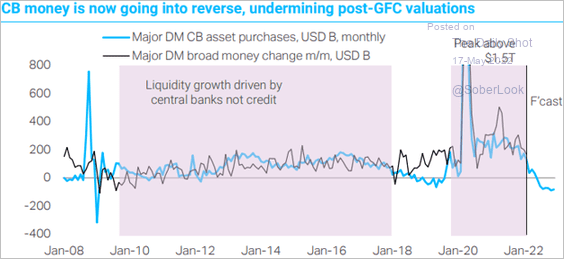
3. The withdrawal of monetary liquidity across developed market (DM) central banks is pressuring equity valuations.
 Source: TS Lombard
4. This table from Capital Economics shows the status of operational independence for select central banks.
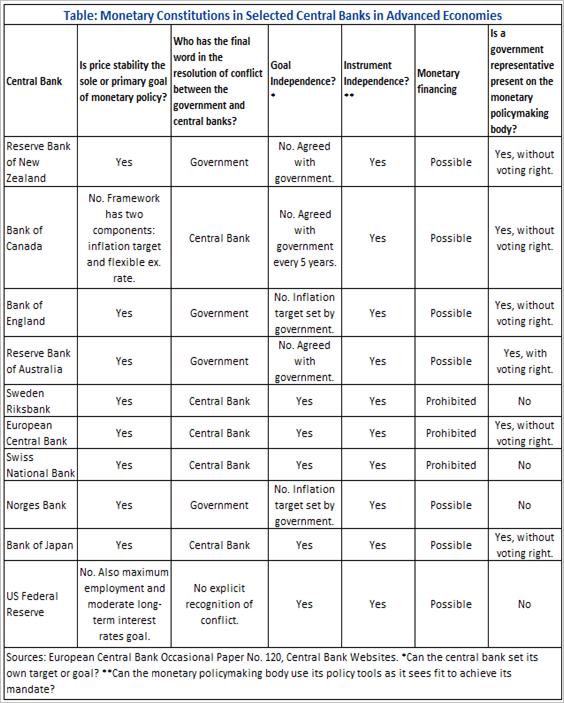 Source: @CapEconomics
——————–
Food for Thought
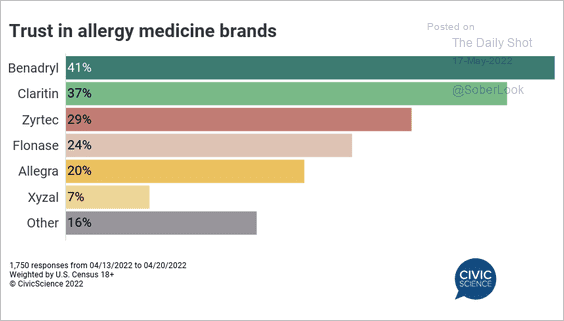
1. Trust in allergy medicine brands:
 Source: @CivicScience Read full article
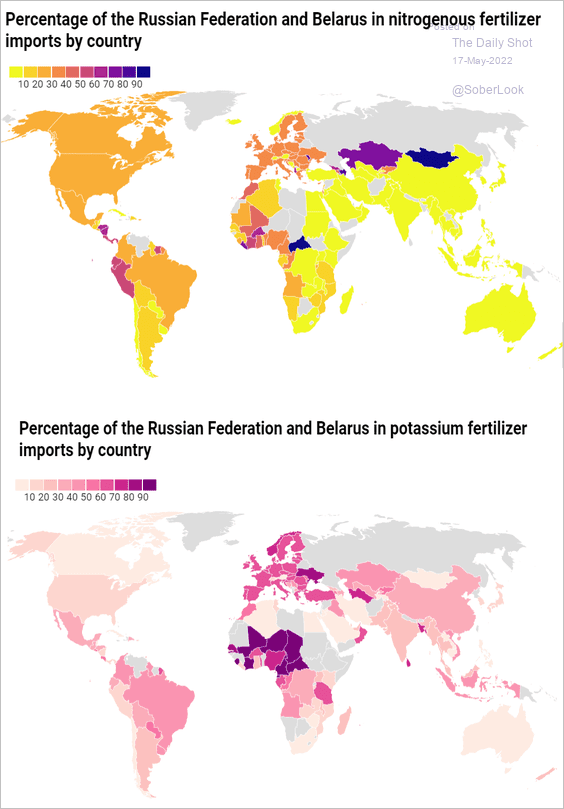
2. Fertilizer imports from Russia and Belarus:
 Source: Food Security Portal Read full article
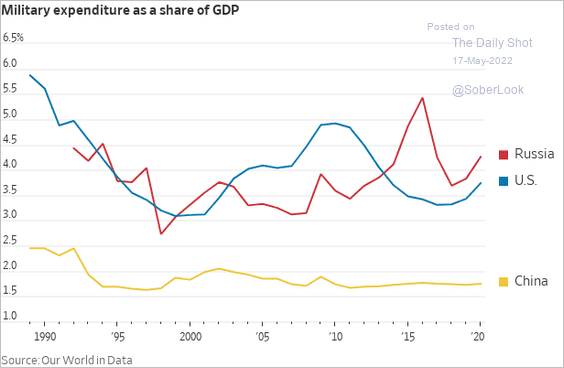
3. Military spending as a share of GDP:
 Source: @WSJ Read full article
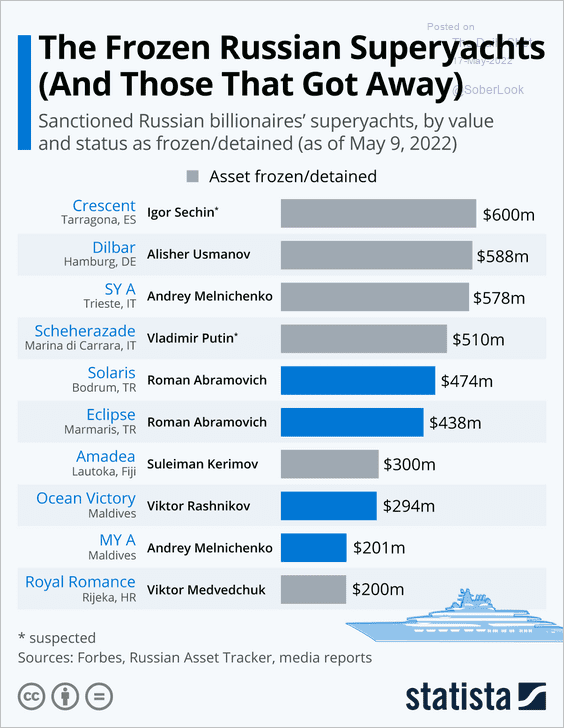
4. Sanctioned Russian superyachts:
 Source: Statista
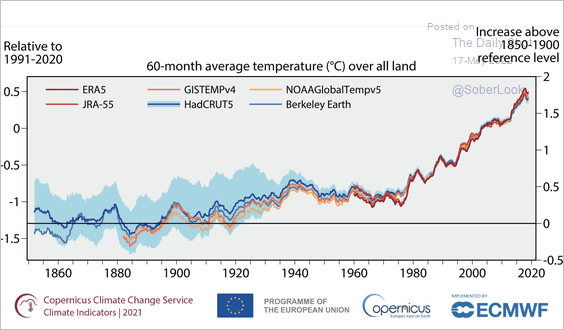
5. Land temperature change since the second half of the 19th century:
 Source: Copernicus Read full article
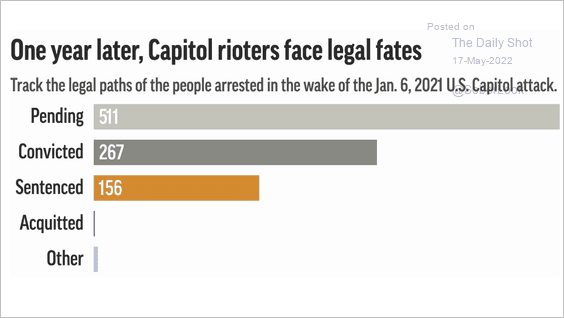
6. Capitol rioters’ case status:
 Source: @AP Read full article
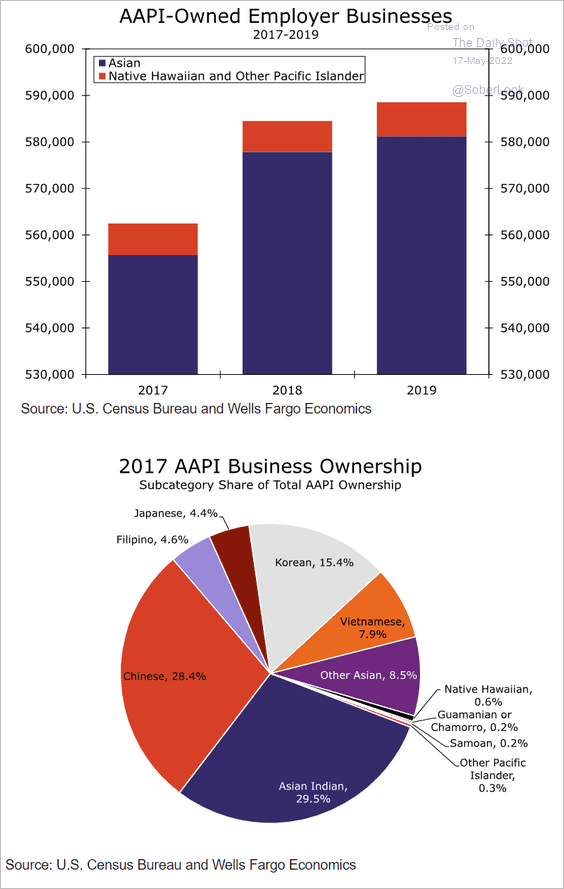
7. Asian American & Pacific Islander business ownership in the US:
 Source: Wells Fargo Securities
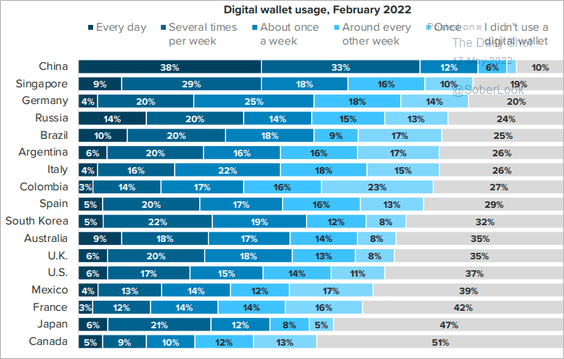
8. Digital wallet usage:
 Source: Morning Consult Read full article
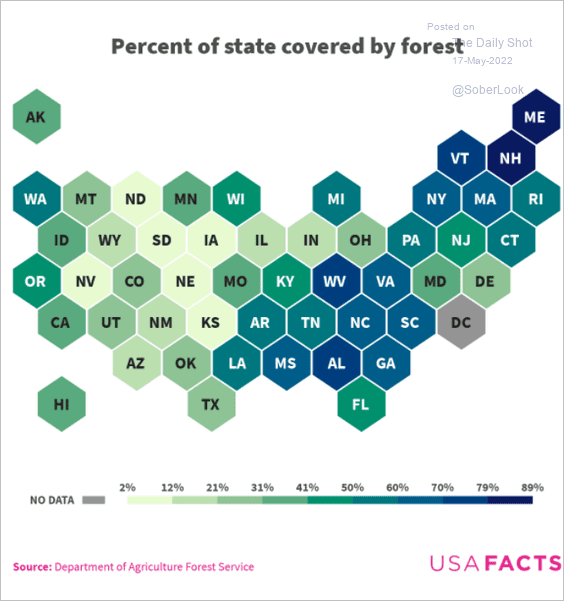
9. The percent of each state covered by forest:
——————–
Back to Index
