
The Daily Shot: 31-May-22
• The United States
• The United Kingdom
• The Eurozone
• Europe
• Japan
• Asia – Pacific
• China
• Emerging Markets
• Cryptocurrency
• Commodities
• Energy
• Equities
• Credit
• Rates
• Global Developments
• Food for Thought
The United States
1. Consumer spending held up better than expected in April, with real expenditures (2nd panel) rising above the pre-COVID trend.
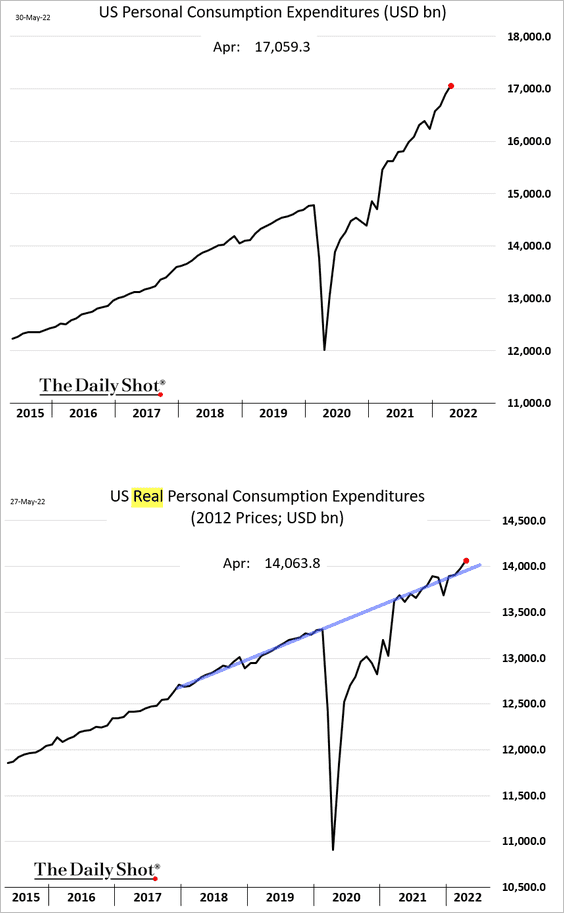
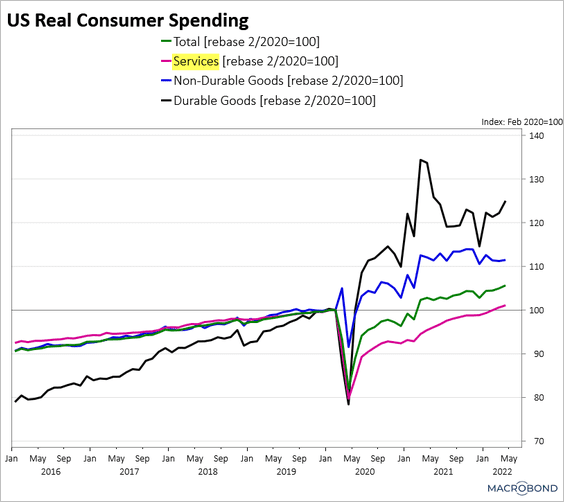
Spending on services has now fully recovered.
 Source: Chart and data provided by Macrobond
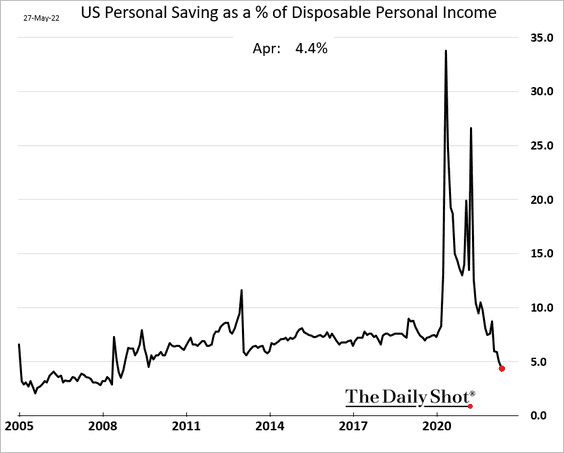
Consumers dipped into their savings, which dropped to the lowest level since 2008 as a percentage of disposable income.
 Source: @WSJ Read full article
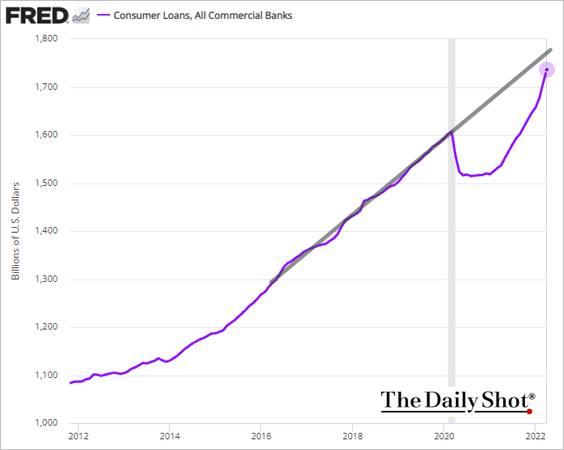
Households also tapped their credit cards, with total consumer credit approaching the pre-COVID trend.
Real disposable income is now well below the trend. Here is a forecast from Wells Fargo.
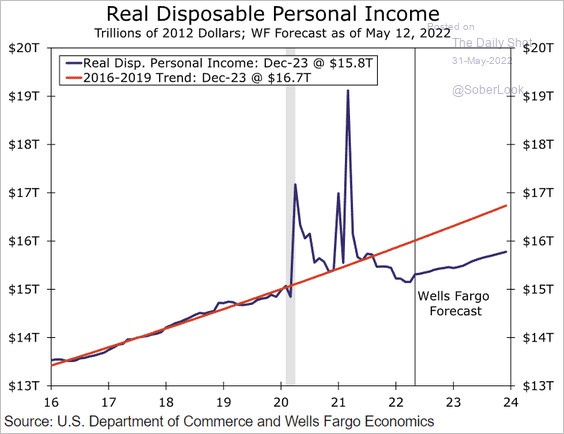 Source: Wells Fargo Securities
——————–
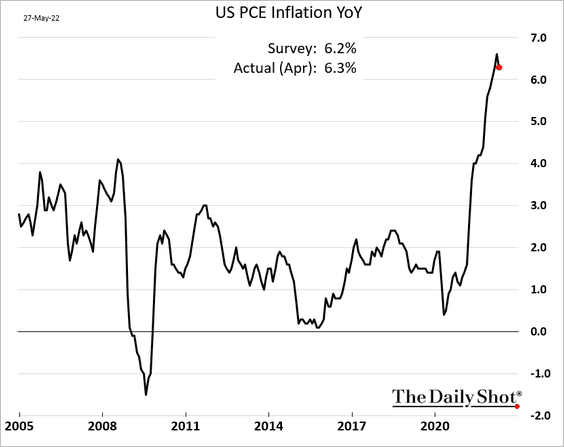
2. Next, we have some updates on inflation.
• The April PCE inflation report showed persistent and broad inflationary pressures. The headline index is slightly below the highs on a year-over-year basis.
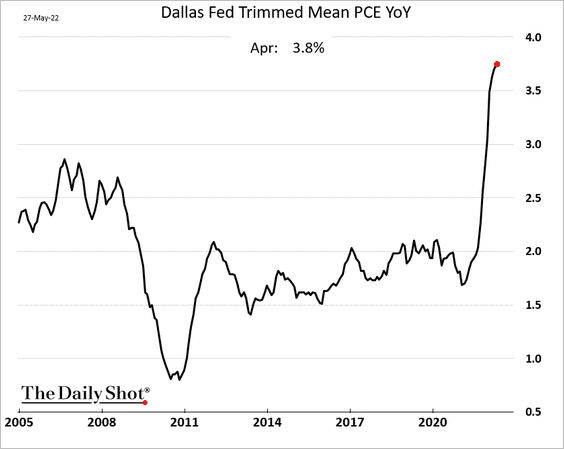
But the trimmed-mean PCE measure (closely watched by Fed officials) is yet to peak.
Core inflation remains elevated, …
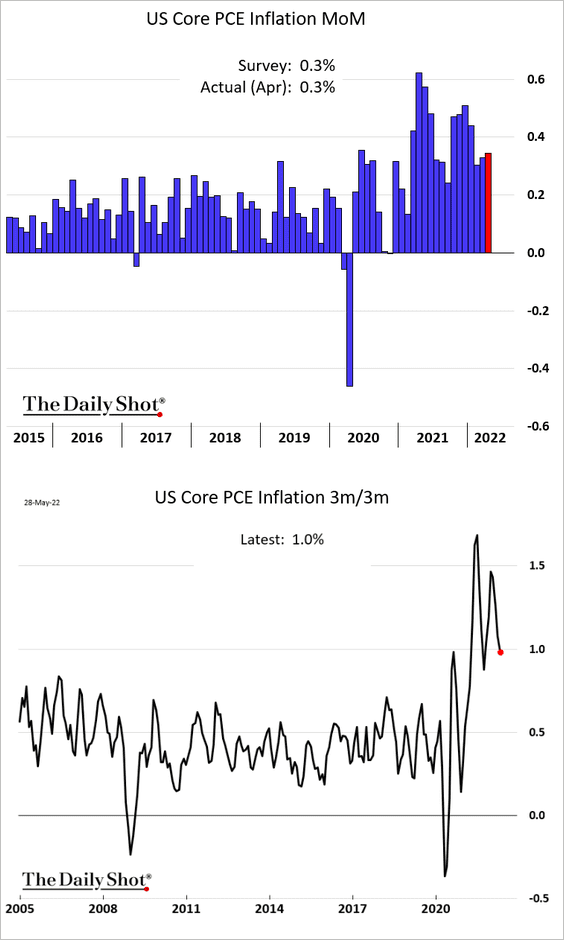
… especially core services (last panel below).
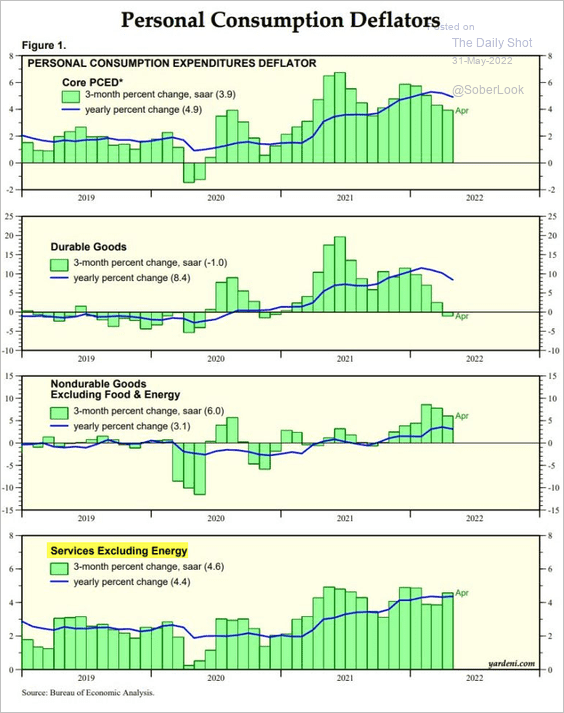 Source: Yardeni Research
This chart shows the options-based probability that the PCE inflation will be above 2.5% over the next 12 months.
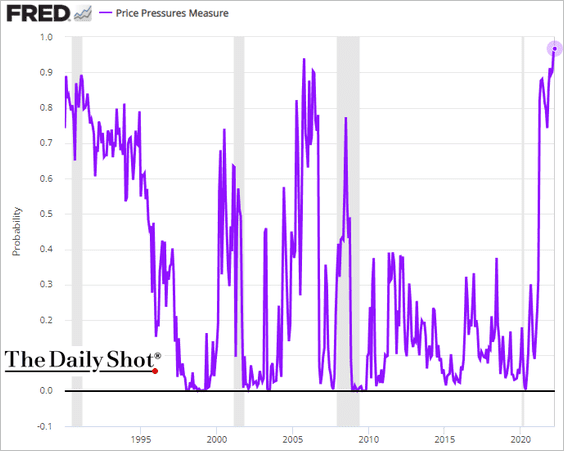
Is inflation “cooling” sufficiently for the Fed to pause in September? Not yet.
 Source: Reuters Read full article
• The U. Michigan 1-year consumer inflation expectations ticked lower this month.
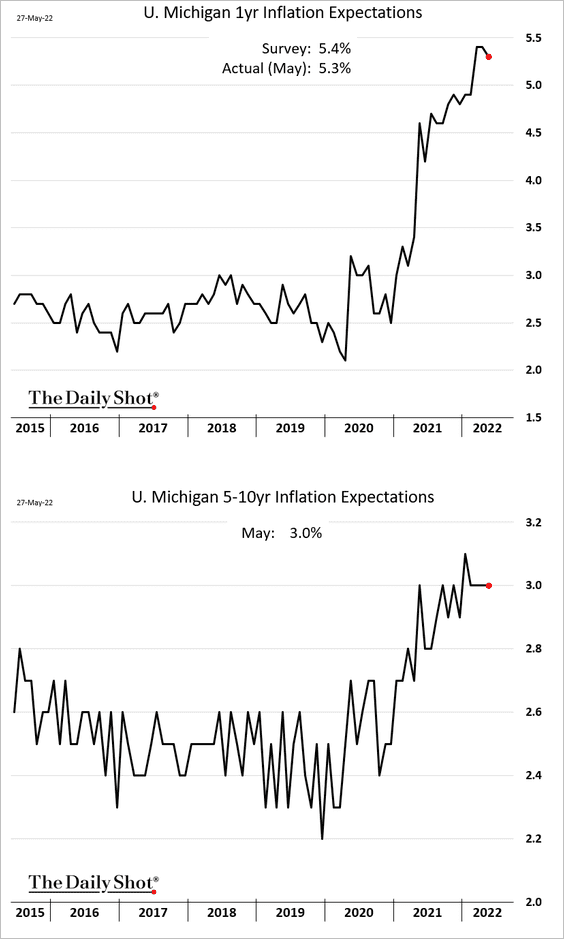
The consumer inflation expectations “curve” is highly inverted.
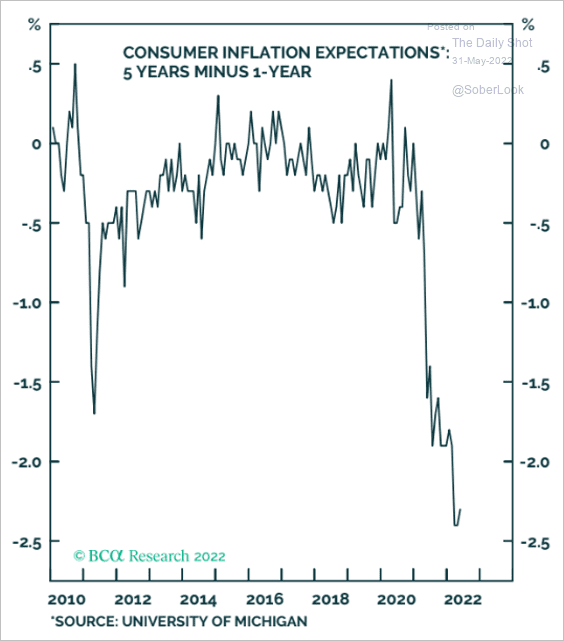 Source: BCA Research
• Where do investors see inflation over the next five years?
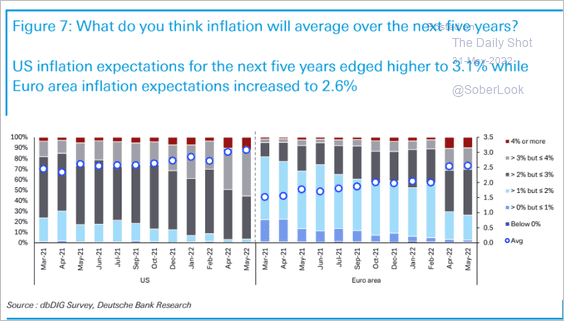 Source: Deutsche Bank Research
——————–
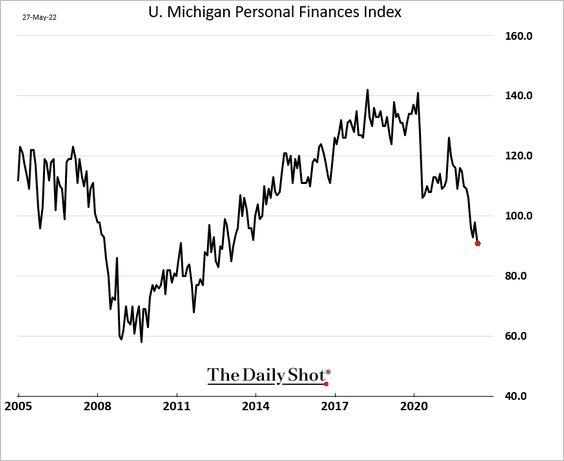
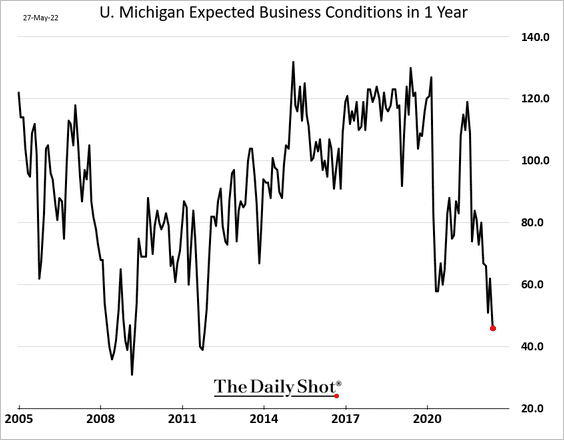
3. The updated May U. Michigan report showed further deterioration in consumer sentiment.
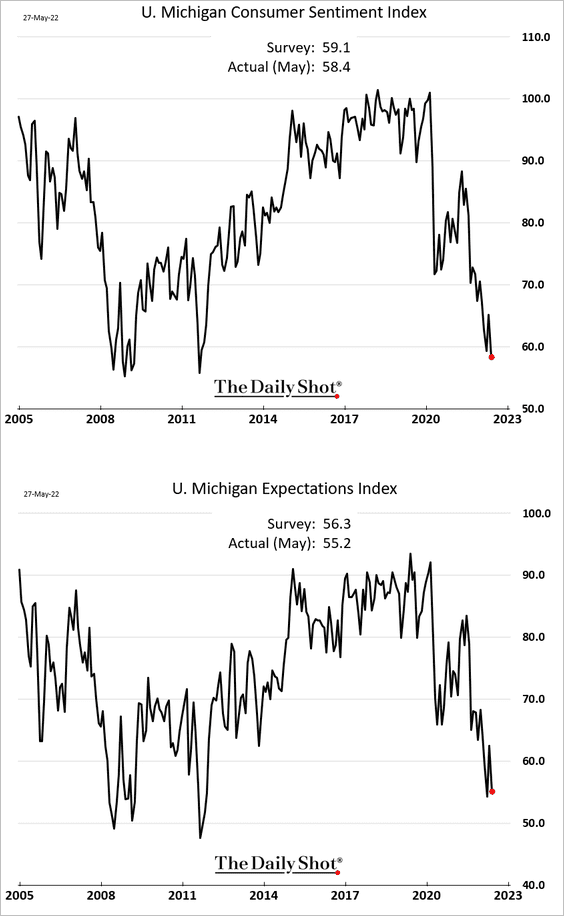
– Personal finances:
– Economic expectations:
• Elevated gasoline prices could inflict further damage to consumer sentiment going forward.
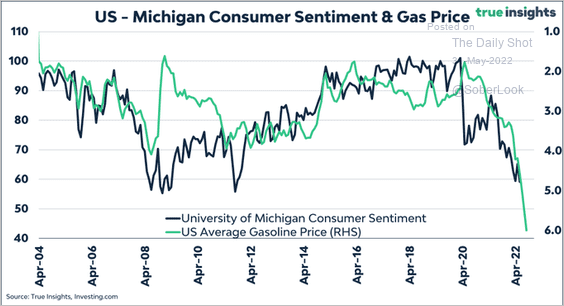 Source: @true_insights_
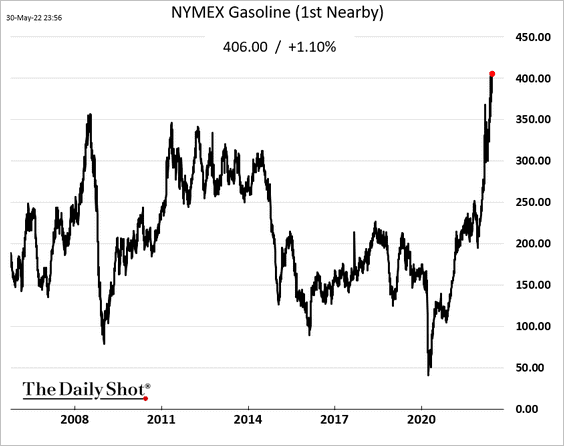
Gasoline futures hit another record high this morning.
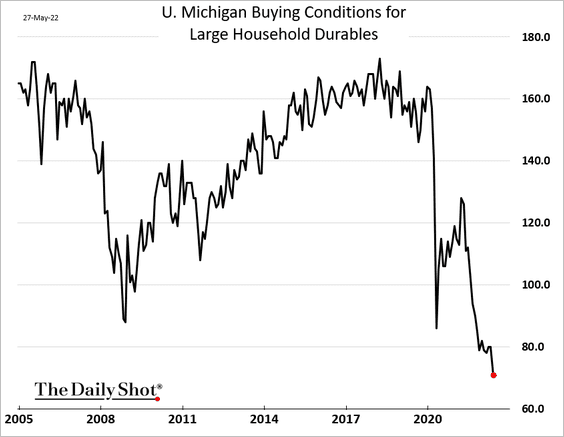
• Buying conditions for household durables have been collapsing. And yet, households keep buying.
——————–
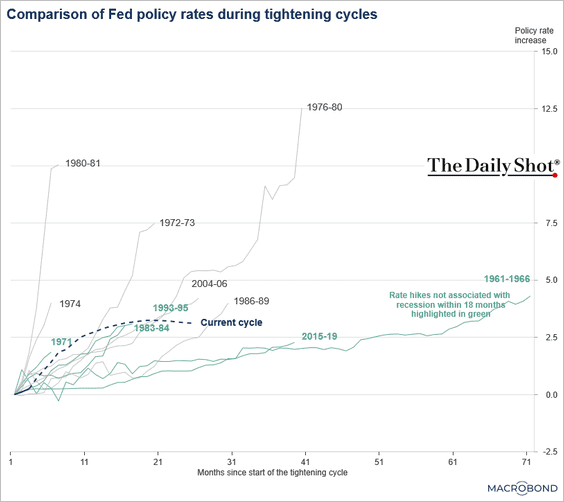
4. Market expectations for the Fed’s total rate hikes in this cycle peak just above 3%.
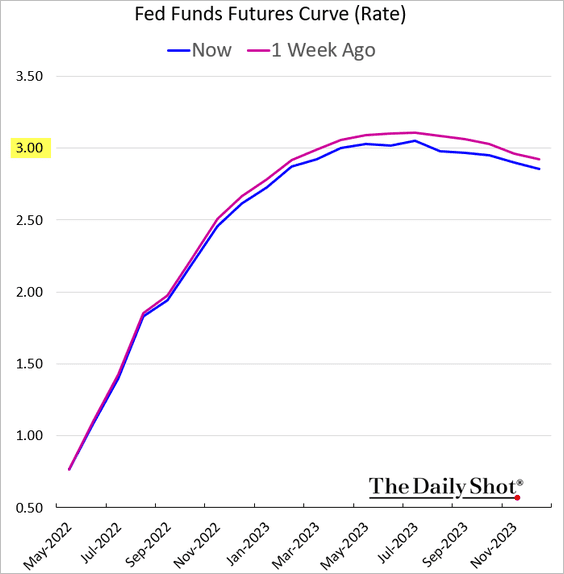
Many previous cycles substantially exceeded that level.
 Source: Chart and data provided by Macrobond
——————–
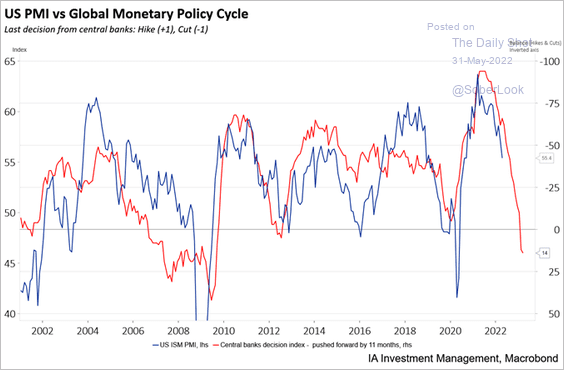
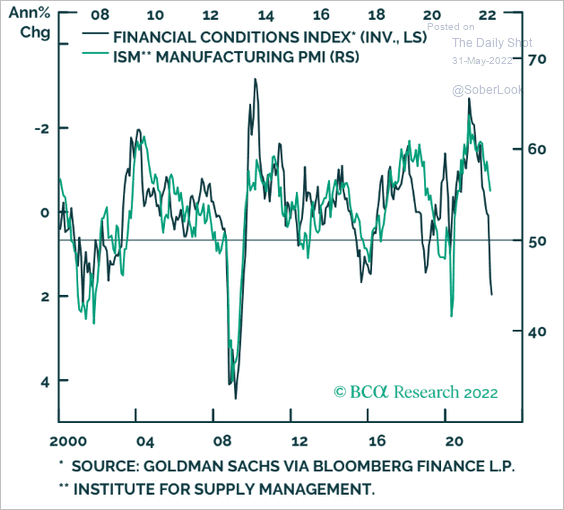
5. The Citi Economic Surprise Index continues to move lower.
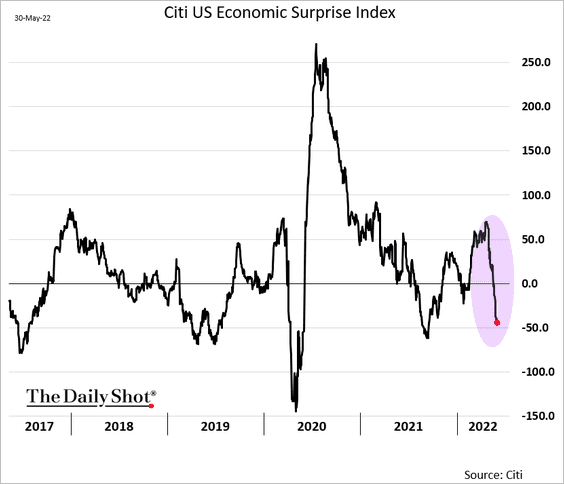
The removal of monetary stimulus around the world and tighter financial conditions point to weakness in US economic activity ahead.
 Source: Industrial Alliance Investment Management
 Source: BCA Research
——————–
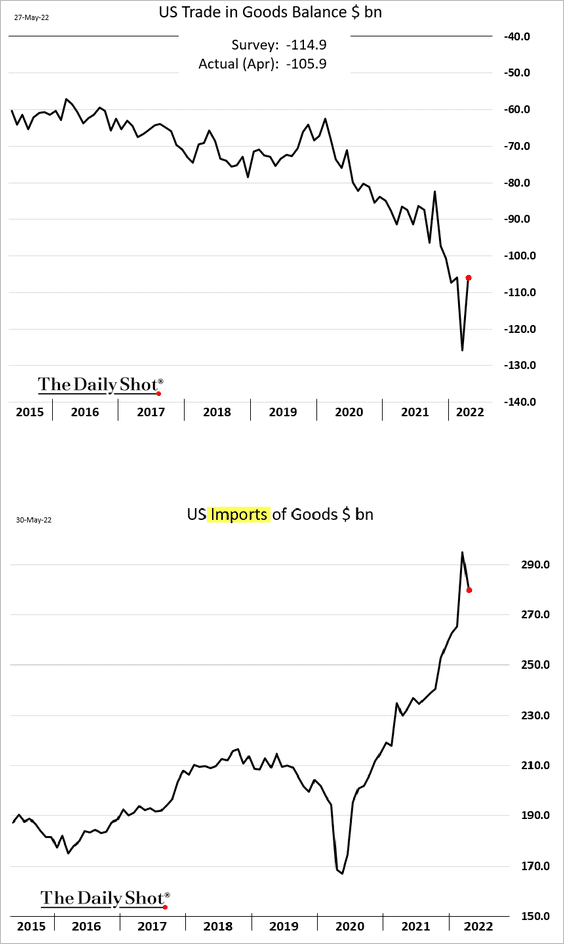
6. US imports slowed in April, which should boost the Q2 GDP growth. The surge in March was due to orders stuck at West Coast ports finally getting through as the backlog eased.
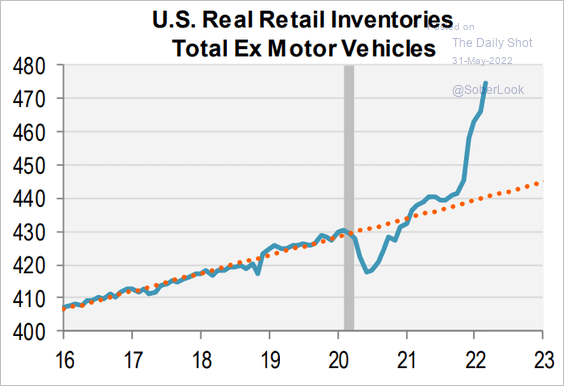
7. Retailers are now facing an inventory overhang.
 Source: Piper Sandler
 Source: Reuters Read full article
Back to Index
The United Kingdom
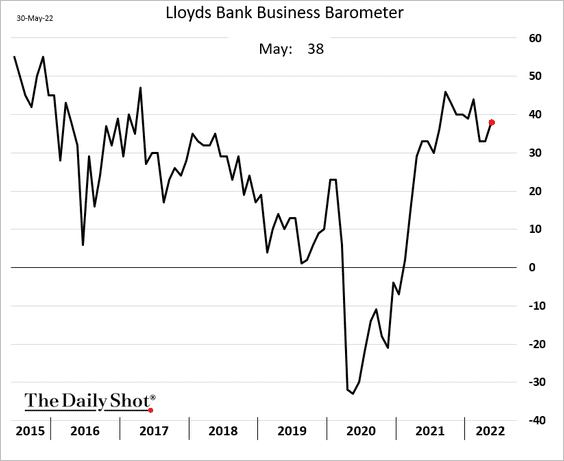
1. The Lloyds Bank business sentiment indicator has been surprisingly stable.
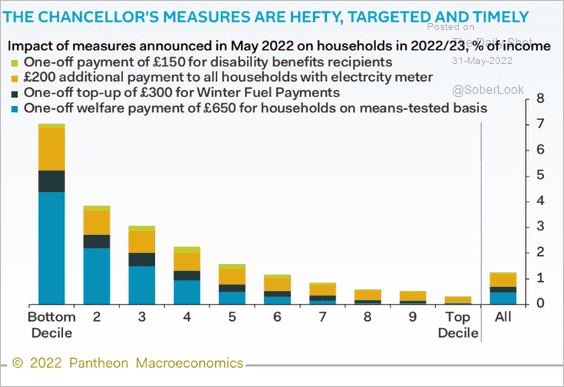
2. Government energy subsidies should help low-income households.
 Source: Pantheon Macroeconomics
Back to Index
The Eurozone
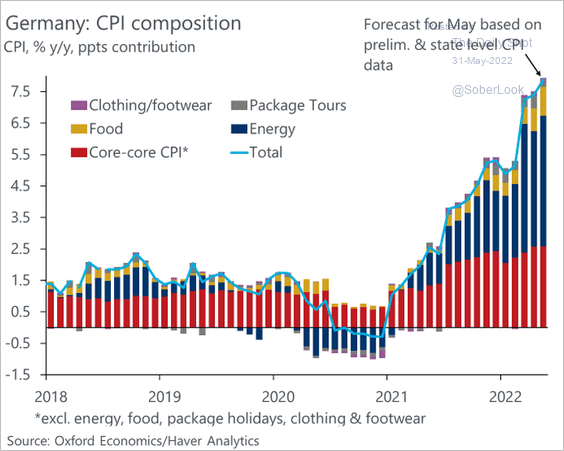
1. Germany’s May CPI report was another shocker, as the Eurozone’s inflation continues to top economists’ forecasts.
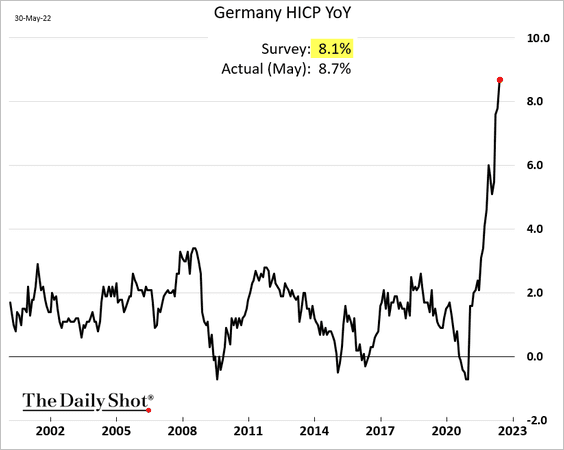
This report gives the ECB hawks more ammunition to push for a 50 bps hike in July.
 Source: @OliverRakau
——————–
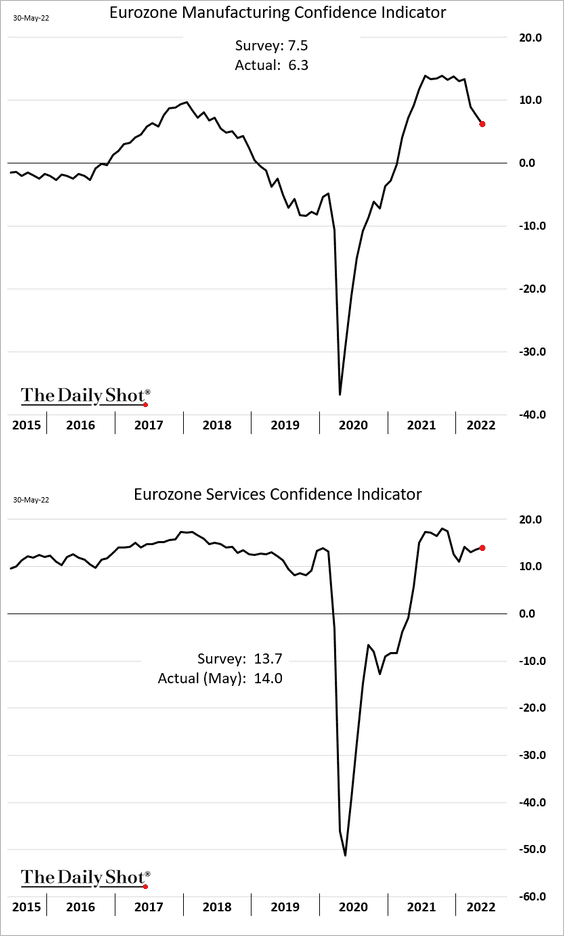
2. Manufacturing business confidence continues to trend lower but services remain resilient.
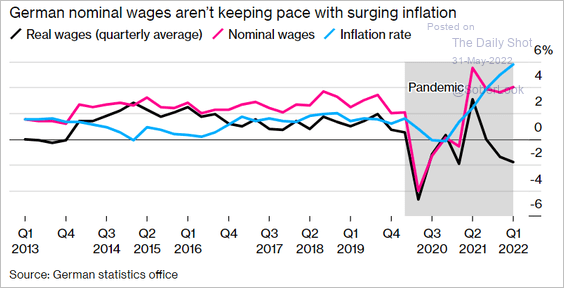
3. Workers’ real wages are under pressure as inflation surges (2 charts).
 Source: Bloomberg Read full article
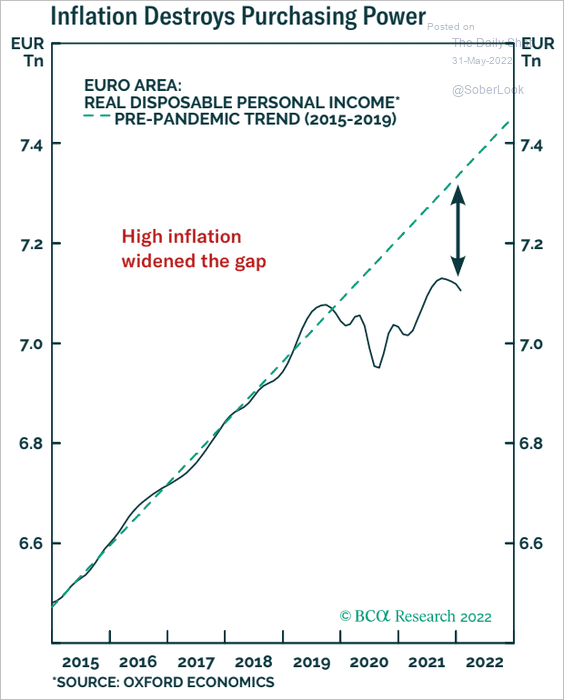 Source: BCA Research
——————–
4. Real retail sales have stalled.
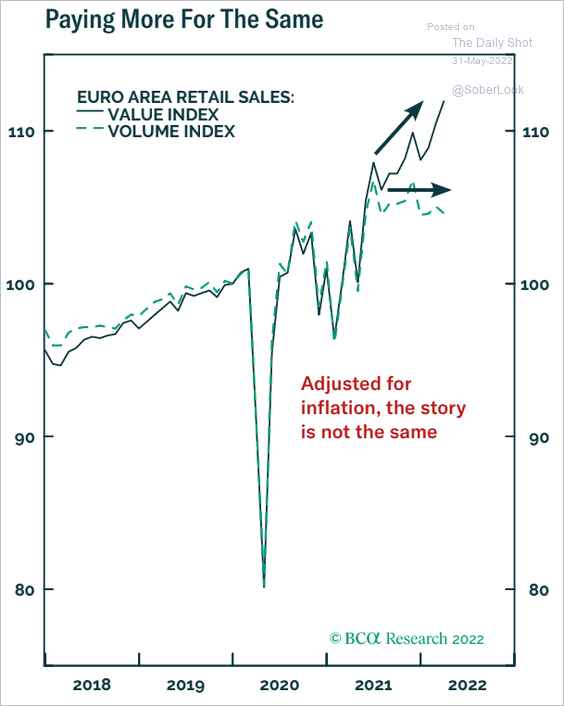 Source: BCA Research
5. Growth in the euro-area money supply continues to slow.
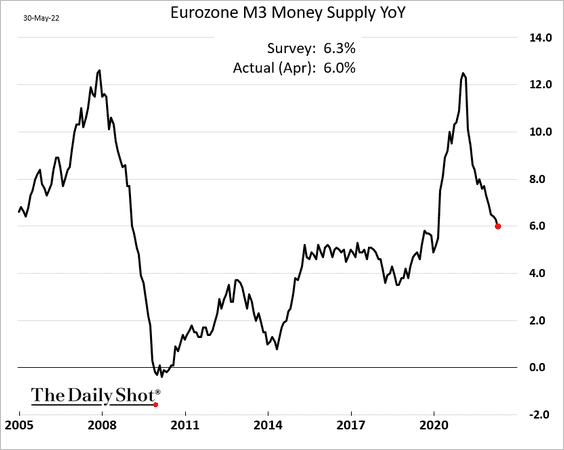
The weakness in the M1 (narrow) money stock points to downside risks for economic activity.
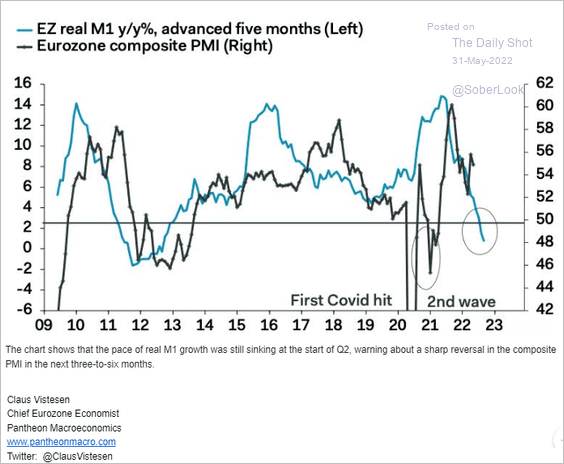 Source: Pantheon Macroeconomics
Back to Index
Europe
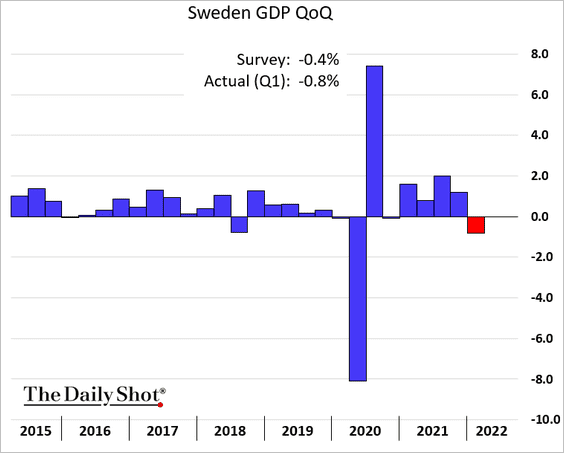
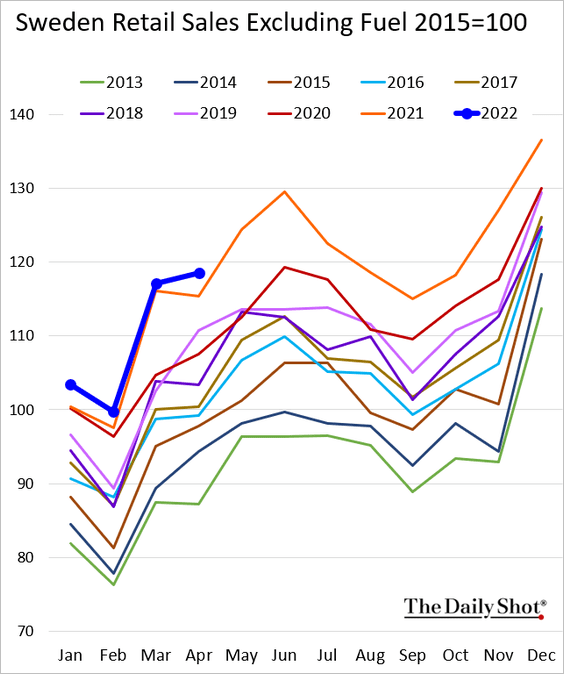
1. Here are some updates on Sweden.
• The Q1 GDP decline was larger than expected.
• Retail sales held up well last month.
• Real wages have tumbled.
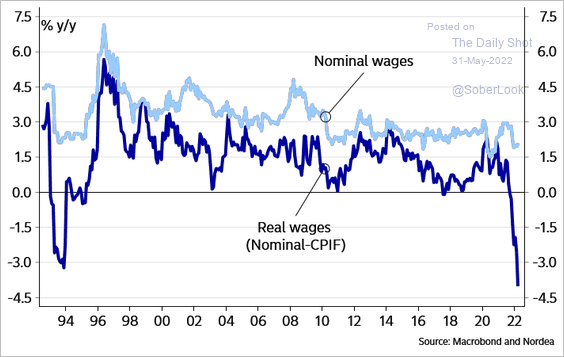 Source: Nordea Markets
——————–
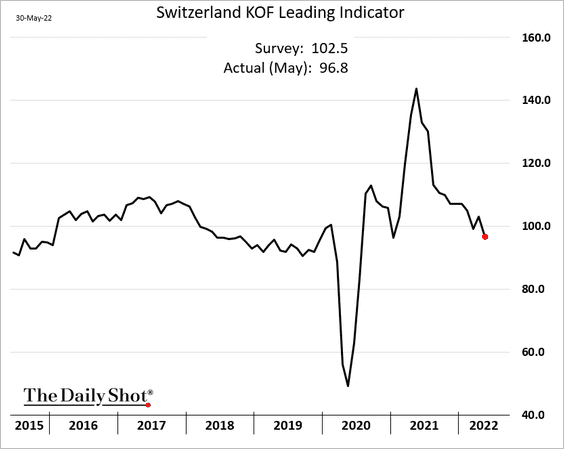
2. Switzerland’s leading index is back below the pre-COVID level.
Back to Index
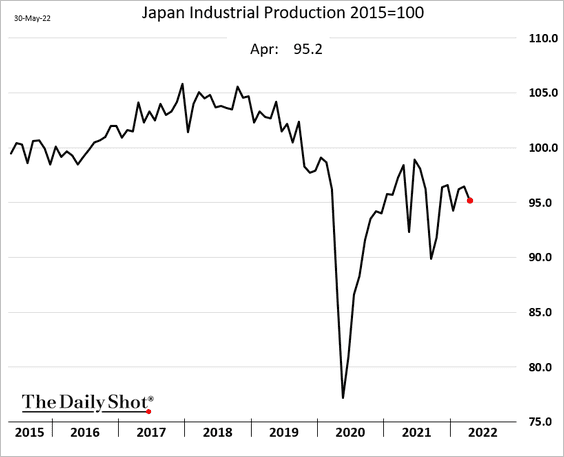
Japan
1. Industrial production weakened last month.
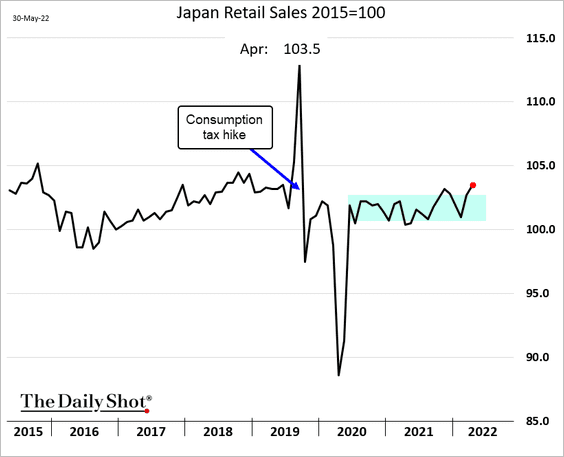
2. Retail sales are above the pandemic-era range.
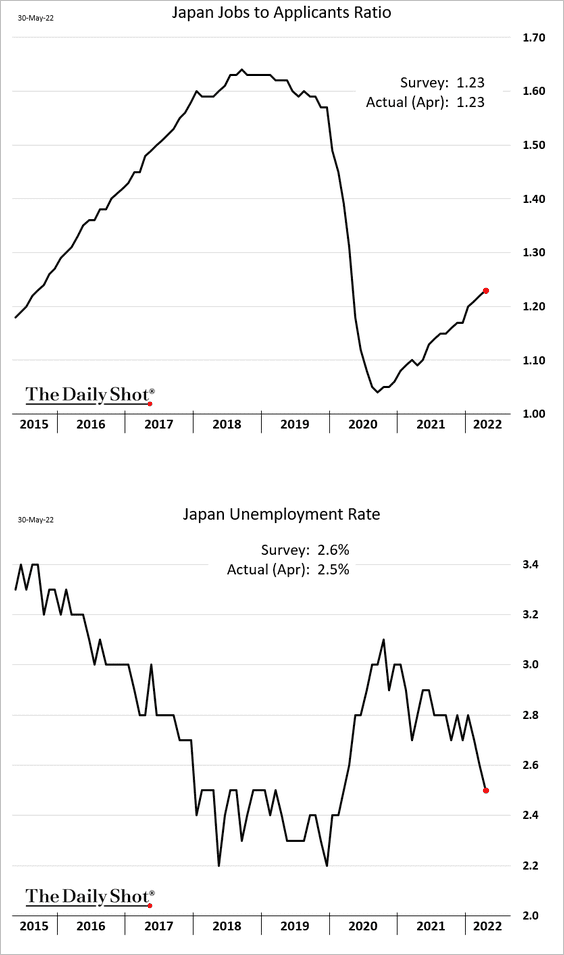
3. Labor market indicators continue to improve.
Back to Index
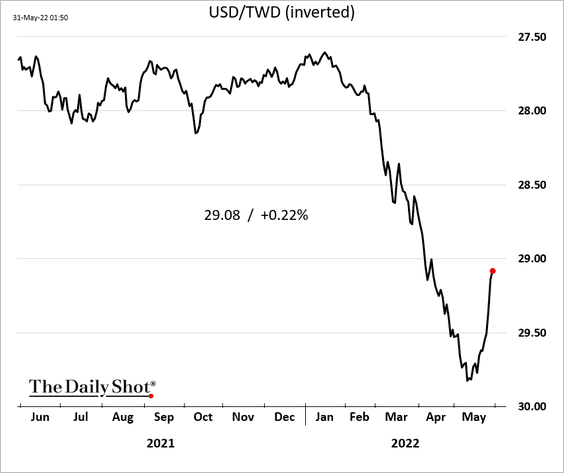
Asia – Pacific
1. Asian currencies have been rebounding. Here is the Taiwan dollar.
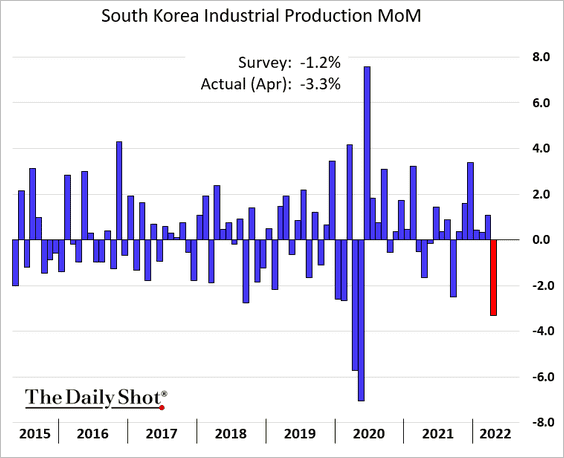
2. South Korea’s industrial production dropped sharply last month, hurt by weaker demand from China.
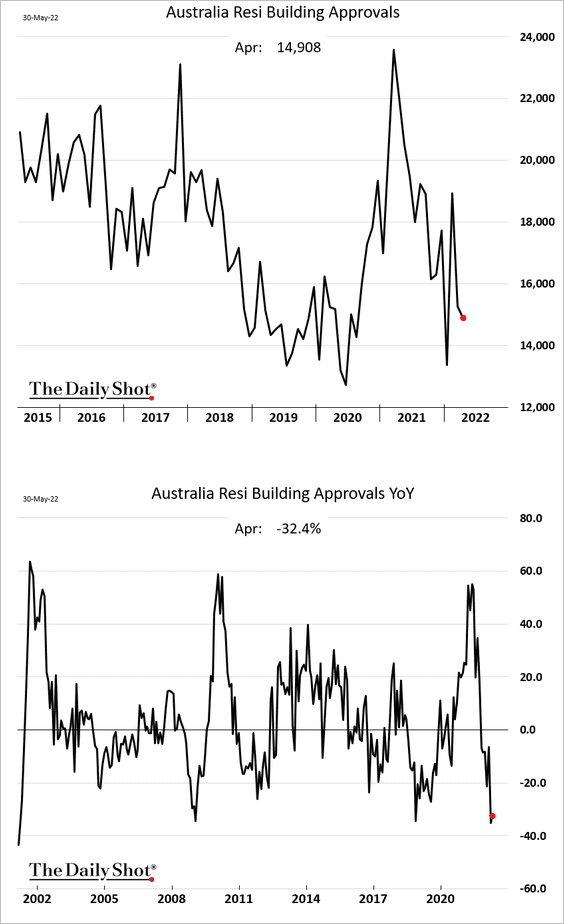
3. Australian building approvals have been moderating.
4. New Zealand’s business confidence deteriorated further in May.
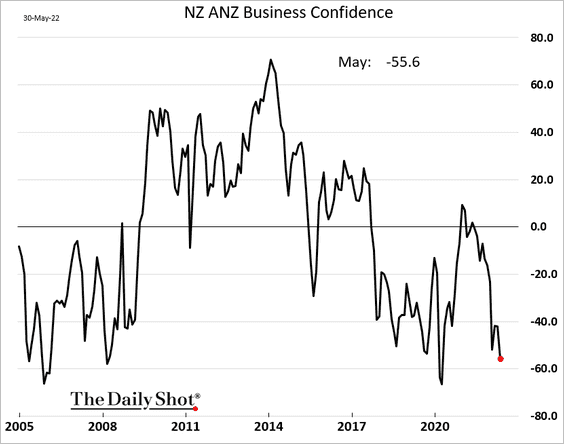
How far will the RBNZ press its rate hikes?
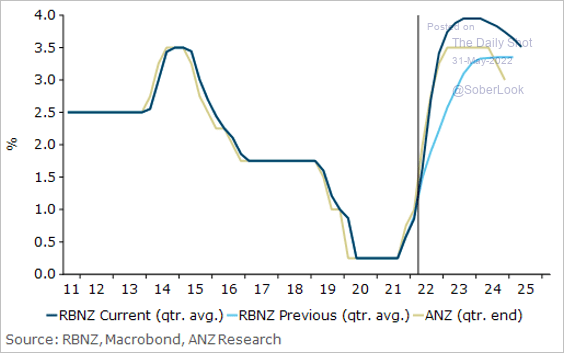 Source: @ANZ_Research
Back to Index
China
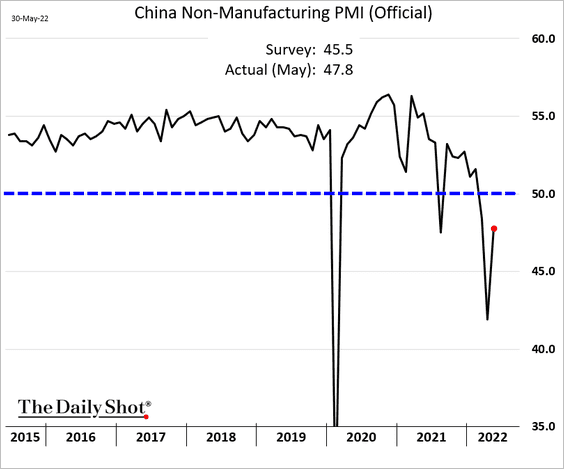
1. The official PMI report showed a substantial improvement (topping forecasts), but business activity growth remained negative in May (PMI < 50).
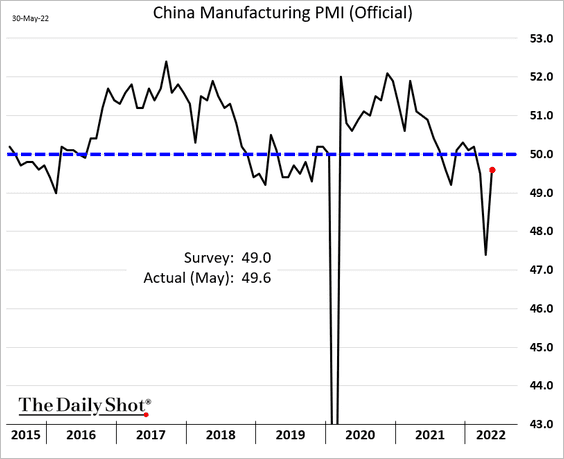
Manufacturing has been under pressure from weak exports.
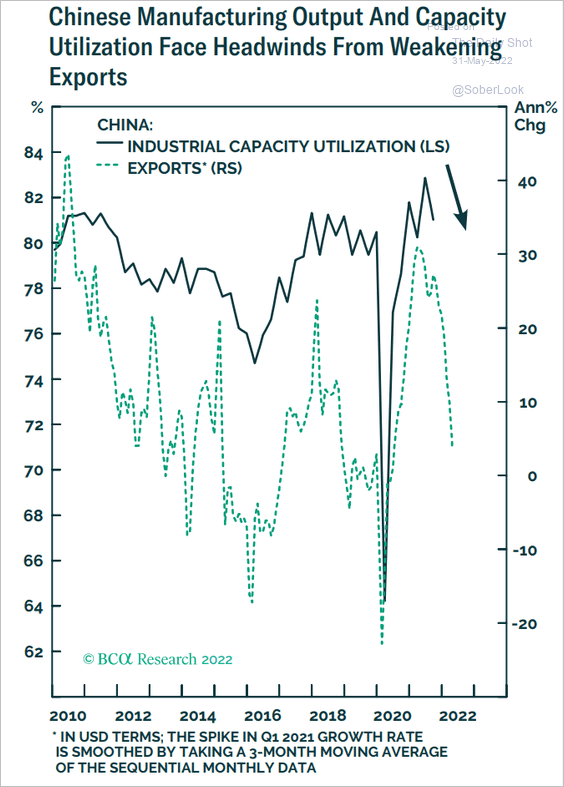 Source: BCA Research
——————–
2. It appears the authorities want to improve the quality of economic data coming out of China.
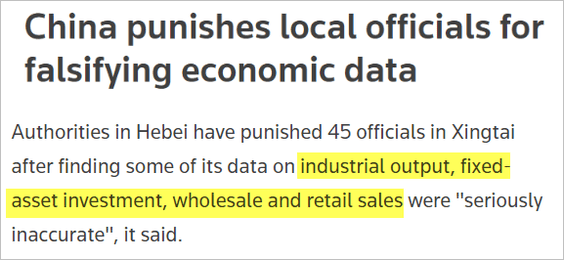 Source: Reuters Read full article
3. The rebound in mobility is not translating into growth in property sales.
![]() Source: Gavekal Research
Source: Gavekal Research
4. Growth in power consumption has been slowing.
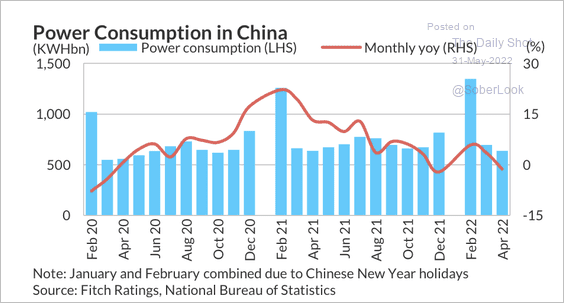 Source: Fitch Ratings
Back to Index
Emerging Markets
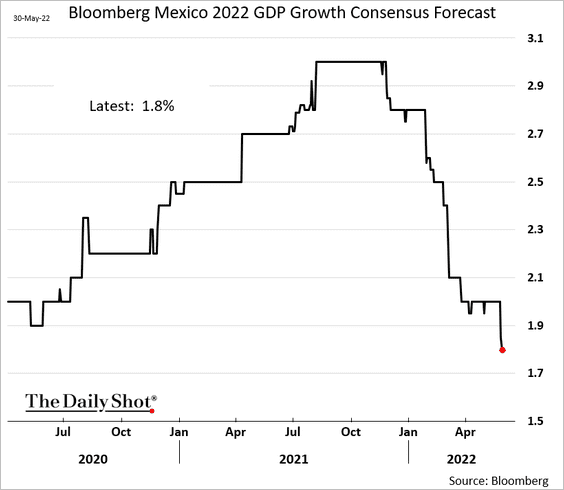
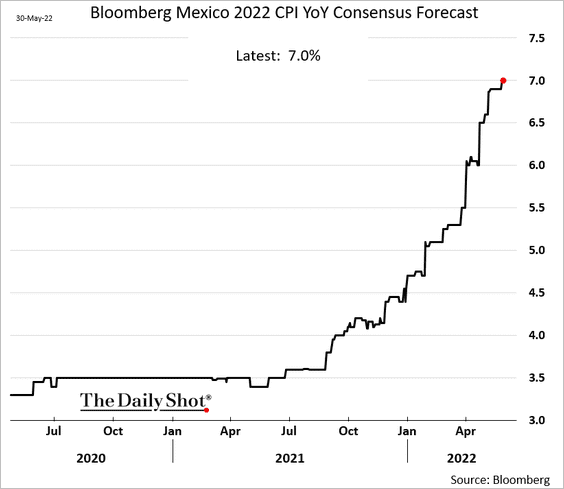
1. Economic forecasts point to stagflation risks in Mexico.
• GDP forecast:
• CPI forecast:
——————–
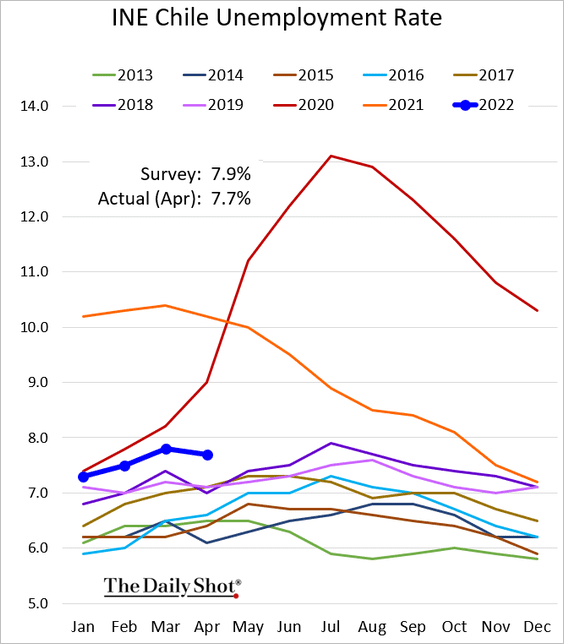
2. Projections for Chile’s 2022 CPI are now above 9%.
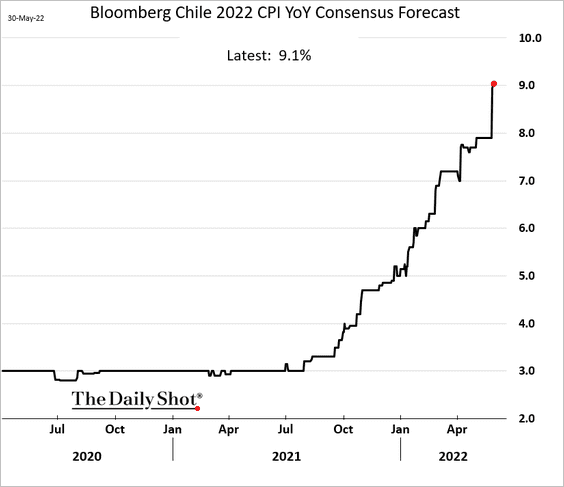
gp
Chile’s unemployment rate was lower than expected in April.
——————–
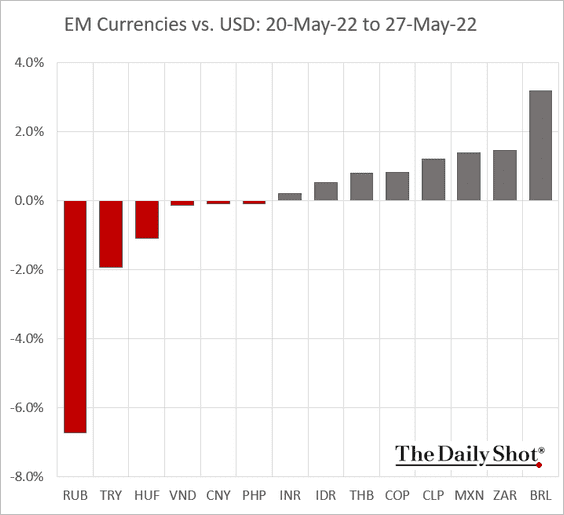
3. LatAm assets outperformed last week.
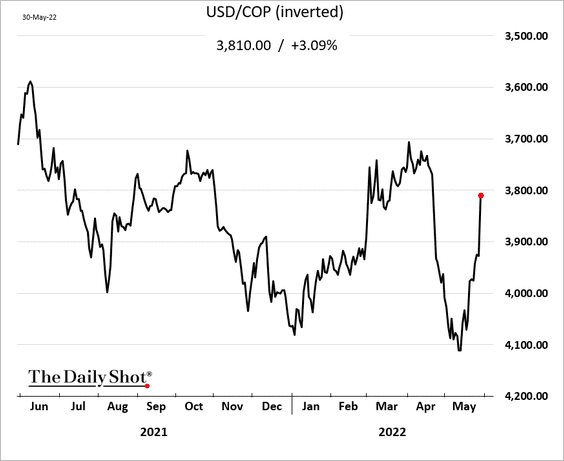
• Currencies:
Here is the Colombian peso.
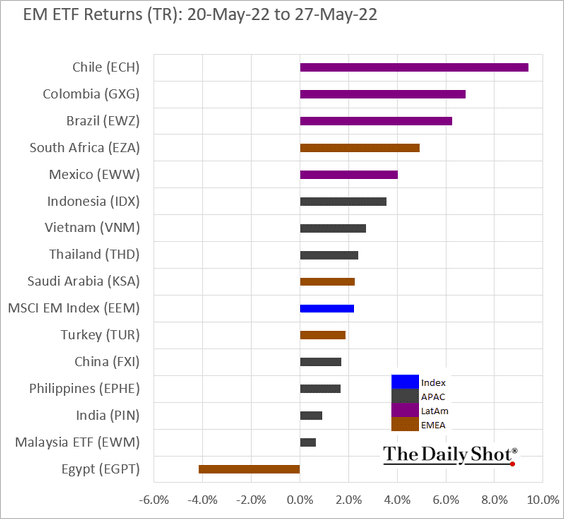
• Equity ETFs (dollar-denominated):
——————–
4. This is how you end up with hyperinflation.
 Source: Bloomberg Read full article
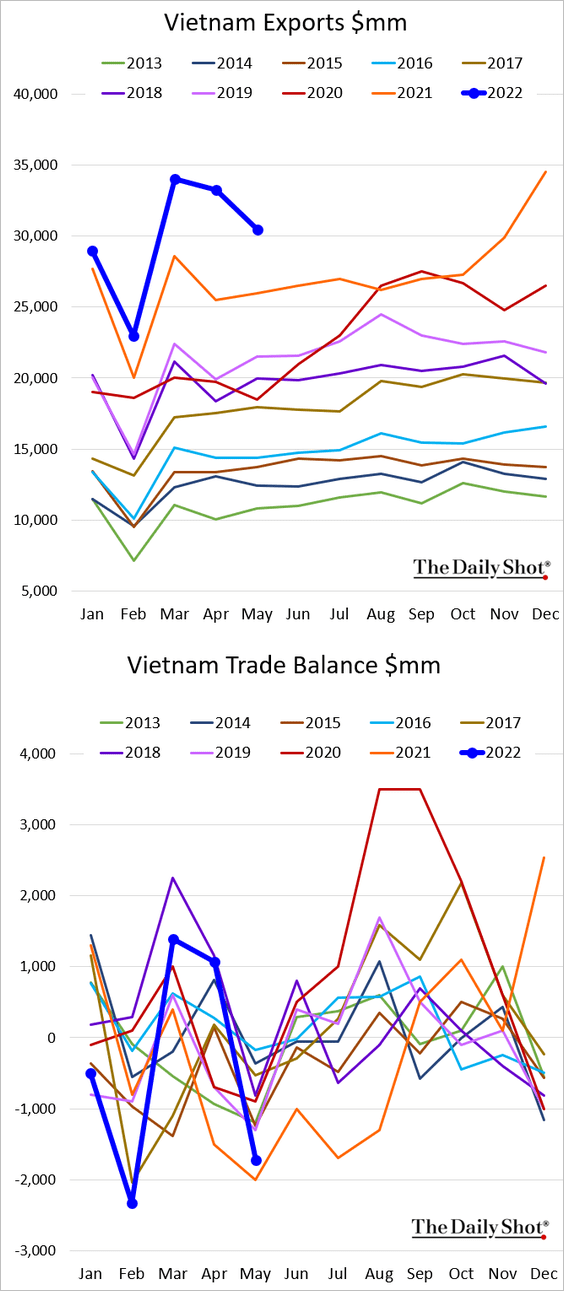
5. Vietnam’s inflation is grinding higher but remains below 3%.
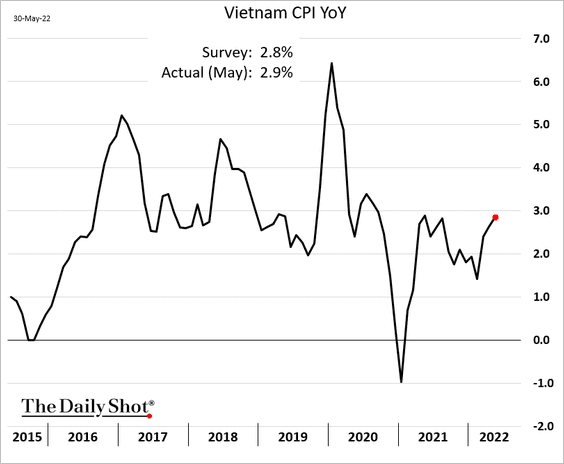
Vietnam’s exports were lower than expected amid soft demand from China.
Back to Index
Cryptocurrency
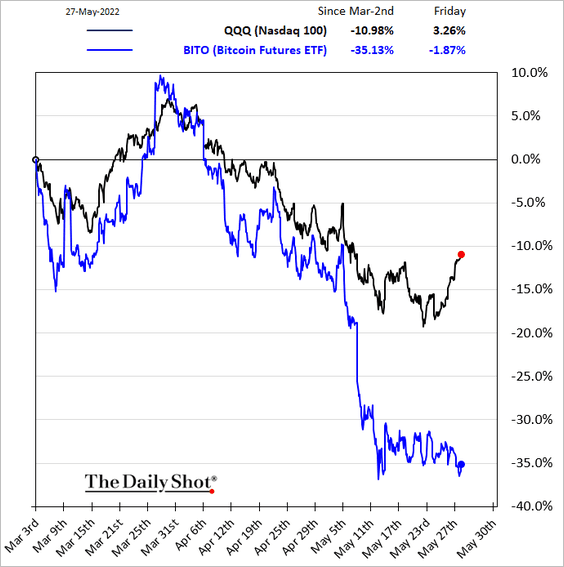
1. Cryptos decoupled from stocks this month.
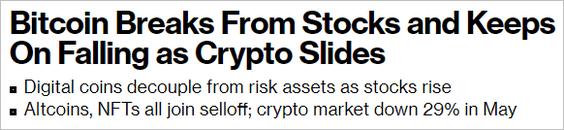 Source: Bloomberg Read full article
——————–
2. This chart shows bitcoin futures positioning by investor type.
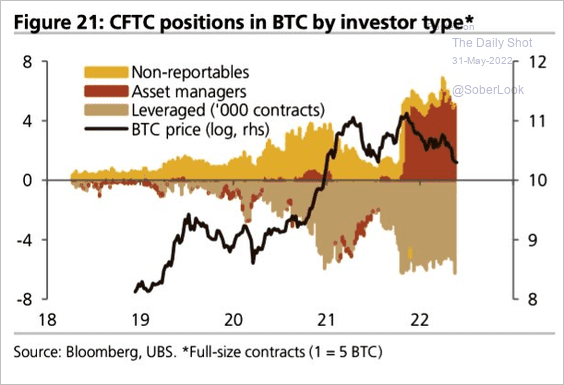 Source: UBS Research
3. For now, bitcoin is holding support above its 200-week moving average.
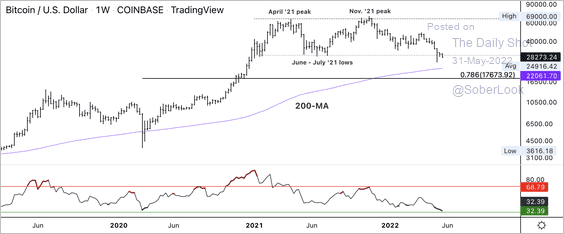 Source: CoinDesk Read full article
4. Bitcoin has recently performed much better outside of normal US trading hours …
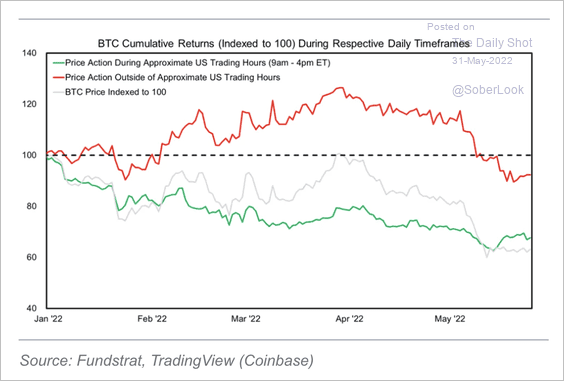 Source: @SeanMFarrell
… but zooming out, especially after the leverage wipeout in May 2021, bitcoin has performed better during US trading hours.
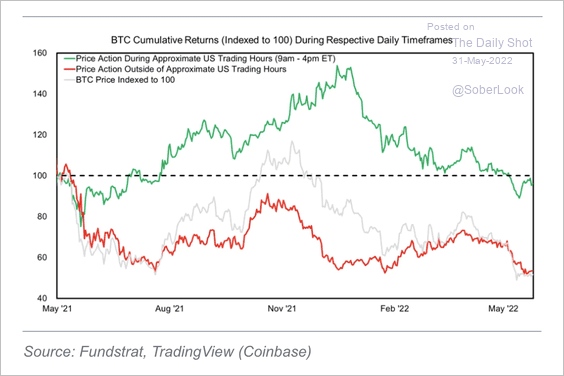 Source: @SeanMFarrell
——————–
5. The slowdown in global cash held in money market funds and savings deposits has coincided with a drop in bitcoin’s price
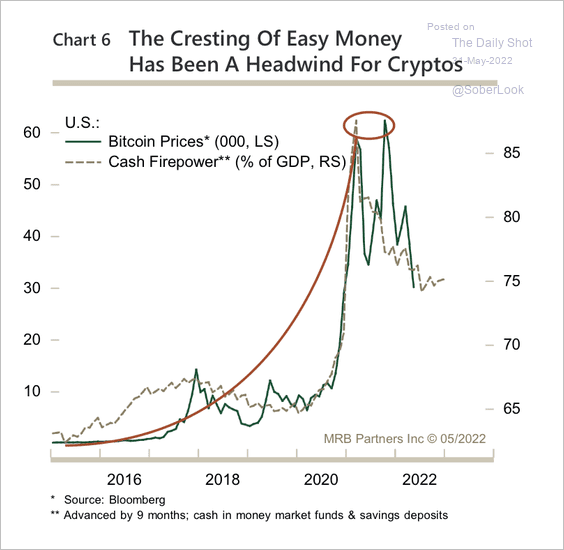 Source: MRB Partners
6. The decline in global negative-yielding debt has also coincided with a drop in bitcoin’s price.
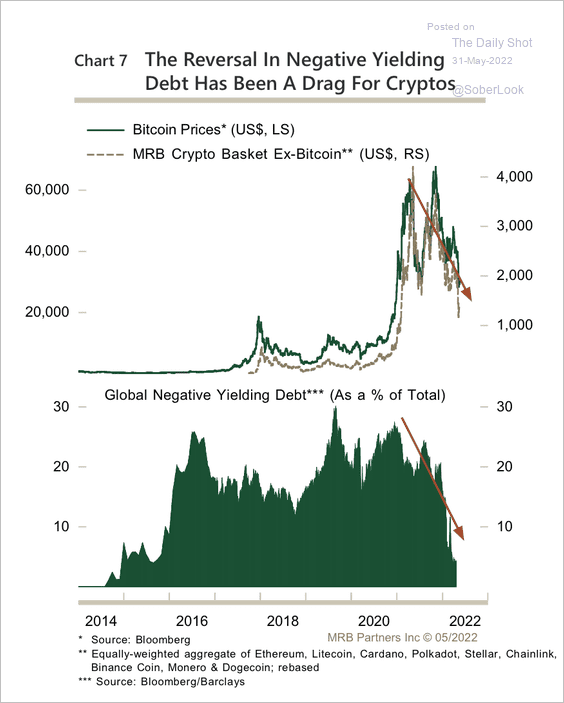 Source: MRB Partners
7. Cryptos appear deeply oversold and could experience a short-term bounce.
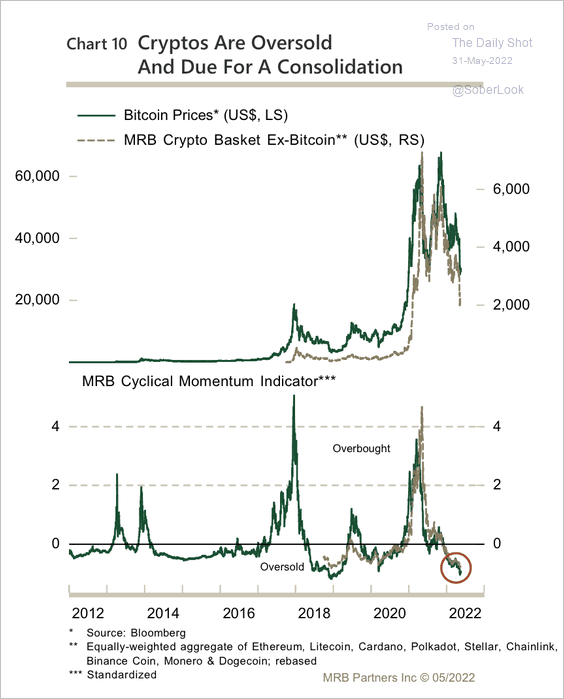 Source: MRB Partners
8. Terra launched Luna 2.0, delivered to eligible customers via airdrop, after the prior failed stablecoin experiment. The new tokens immediately plunged in value as some holders cashed out of any Terra-related products.
 Source: Decrypt Read full article
 Source: @terra_money
 Source: @ashwsbreal
Back to Index
Commodities
1. The recent slowdown in grid infrastructure investment has weighed on copper prices.
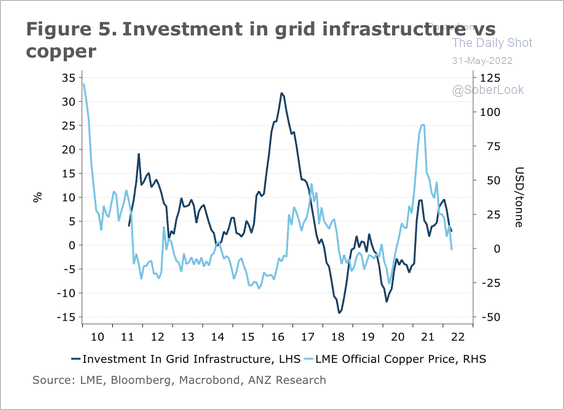 Source: @ANZ_Research
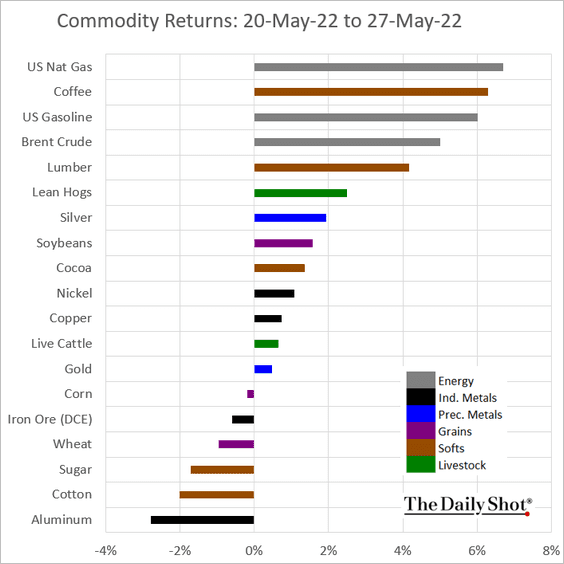
2. This chart shows last week’s performance across commodity markets.
Back to Index
Energy
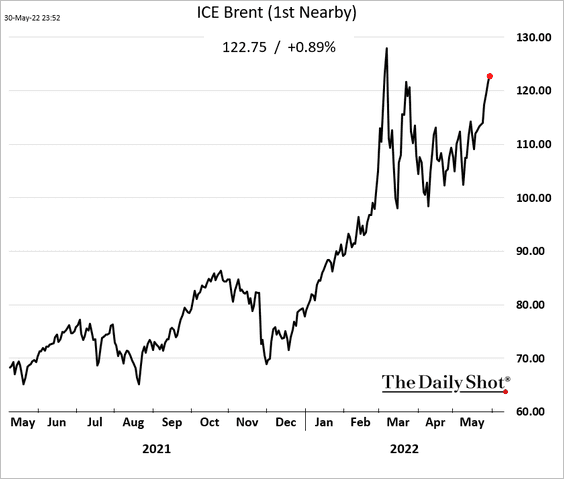
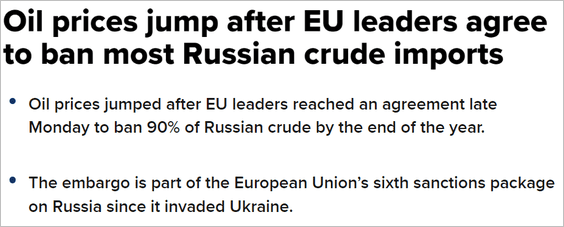
1. Brent crude surged as European leaders agreed to ban some 90% of Russian oil. This price jump, combined with Germany’s CPI report, reignited global inflationary fears.
 Source: CNBC Read full article
Will WTI crude oil rise toward the $145-$150 resistance zone?
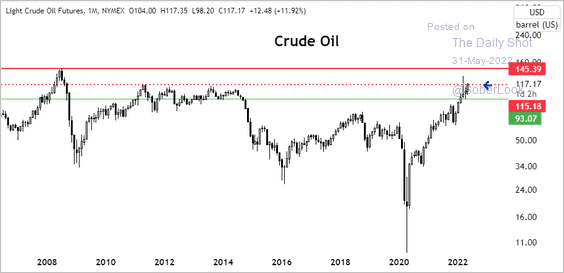 Source: Aazan Habib; Paradigm Capital
——————–
2. The expected decline in Russia’s oil output will keep the market in deficit.
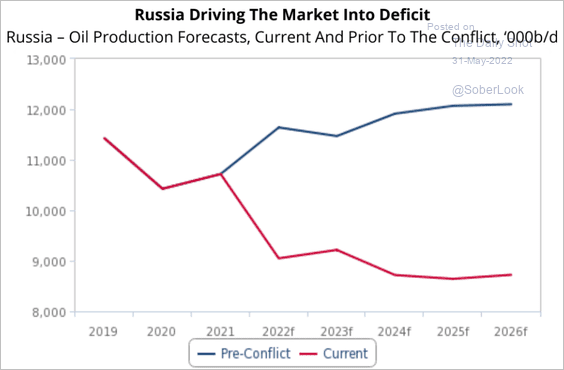 Source: Fitch Solutions Macro Research
Back to Index
Equities
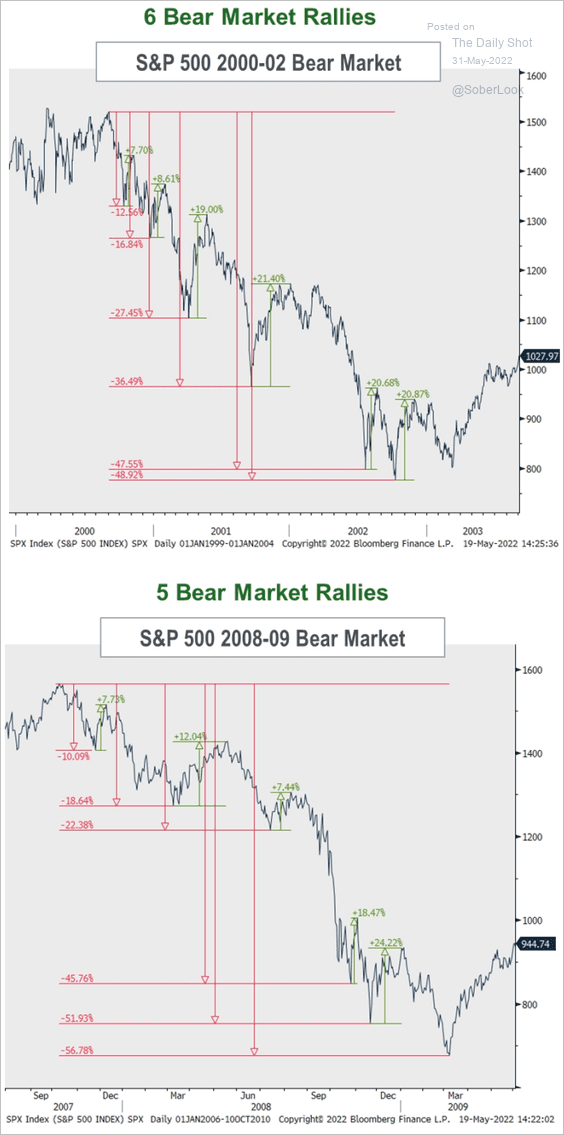
1. After a period of relentless declines, equities advanced sharply last week.
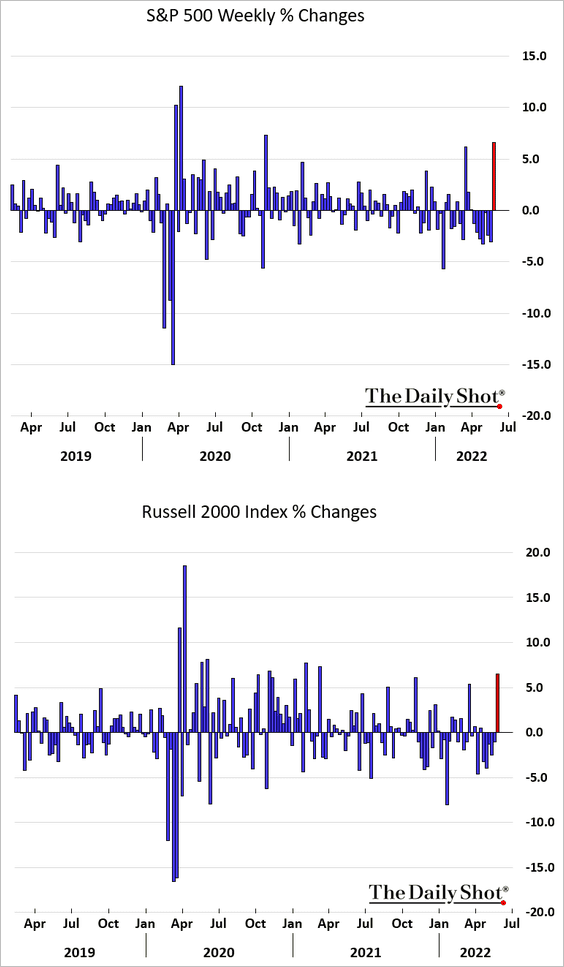
A bear-market bounce?
 Source: Piper Sandler
——————–
2. Inflationary concerns are back as crude oil prices surge, pushing up bond yields. The rebound in yields is a risk for growth stocks.
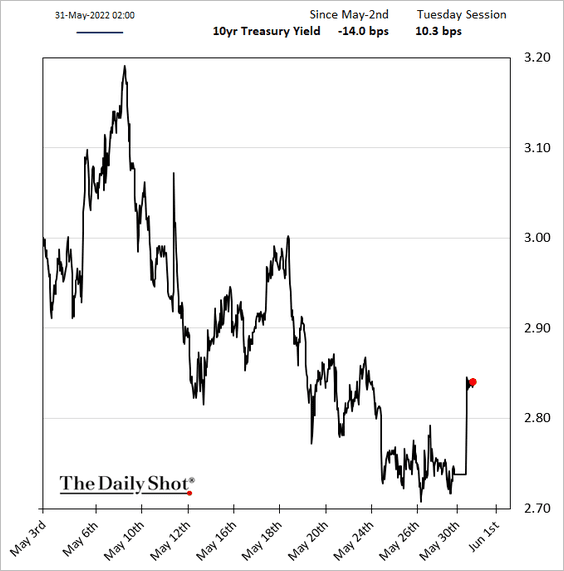
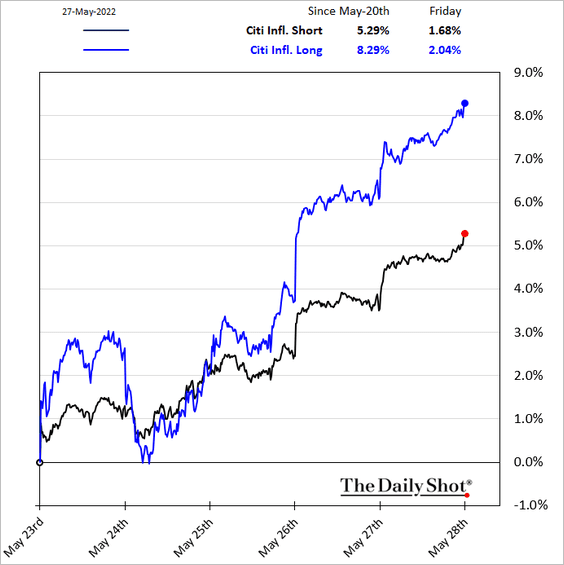
Inflation bets are making a comeback.
——————–
3. A move back to the long-term trend in the P/E ratio of the S&P 500 would take the index down to 3,550 from Friday’s close of 4,158.
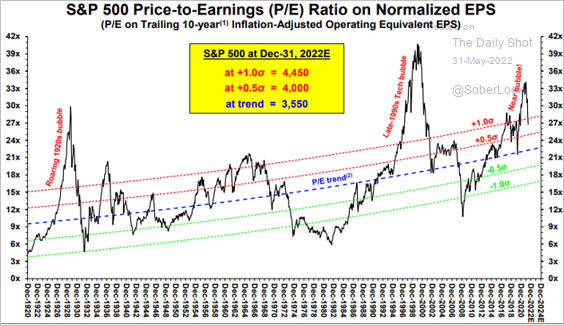 Source: Stifel
4. Markets have been skeptical of rising earnings estimates.
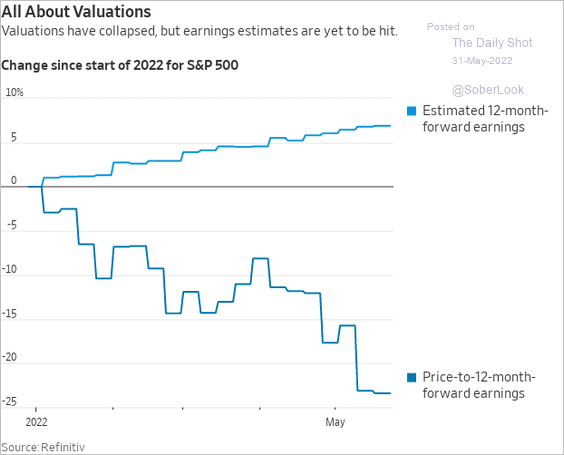 Source: @WSJ Read full article
• The Nasdaq 100 earnings forecasts saw substantial downward revisions recently.
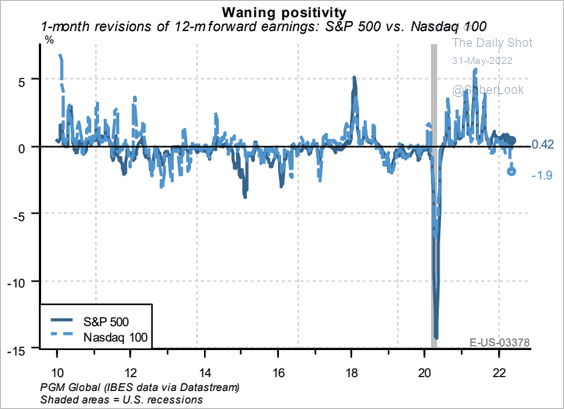 Source: PGM Global
——————–
5. The valuation spread between expensive and value stocks is back at more realistic levels (and there is more room to tighten).
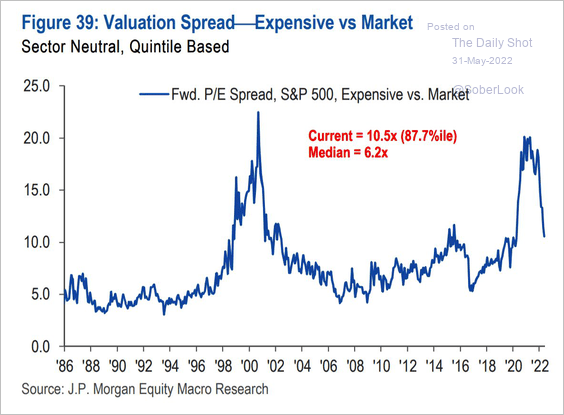 Source: JP Morgan Research; @WallStJesus
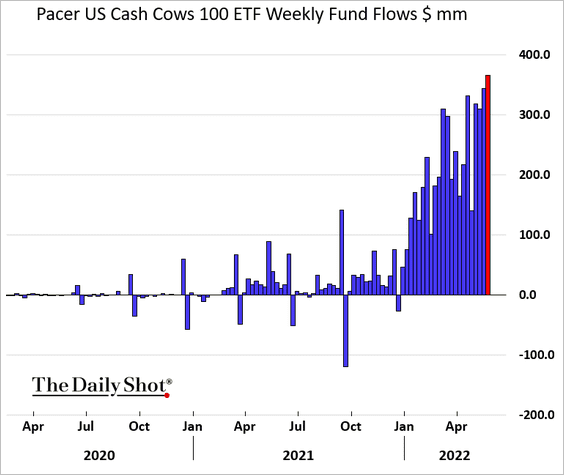
6. Cash-flowing businesses are in demand. A fund that focuses on US companies with high free cash flow yields has been outperforming, …
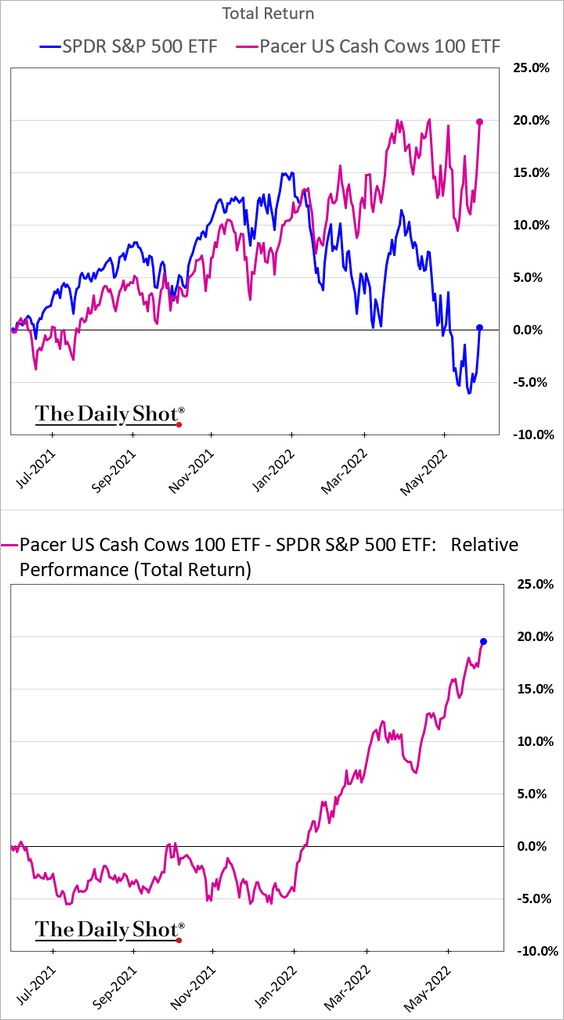
… and getting substantial fund inflows.
——————–
7. US dividend-focused funds have seen significant inflows in recent months.
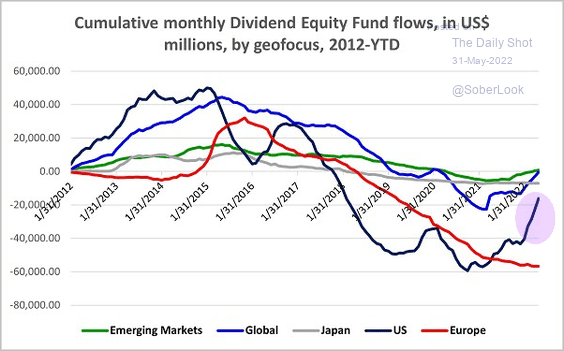 Source: EPFR Global Navigator
8. More stocks are making new 52-week highs than lows again, which is a sign of improving market breadth.
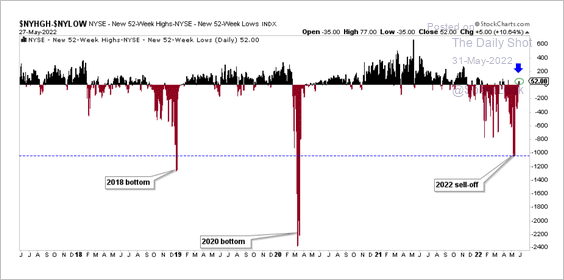 Source: Aazan Habib; Paradigm Capital
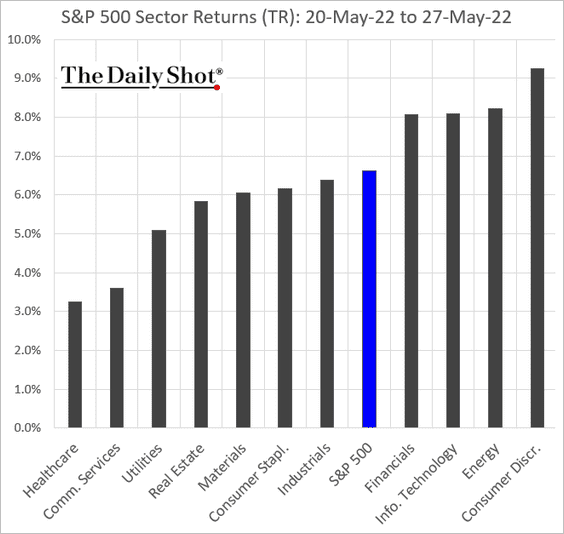
9. Next, we have some performance data.
• Last week’s returns by sector:
This chart shows sector contributions to the S&P 500 performance over the past month.
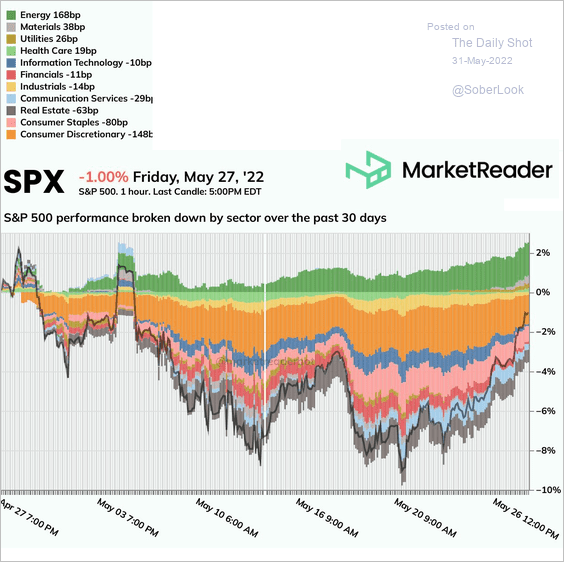 Source: @marketreaderbot
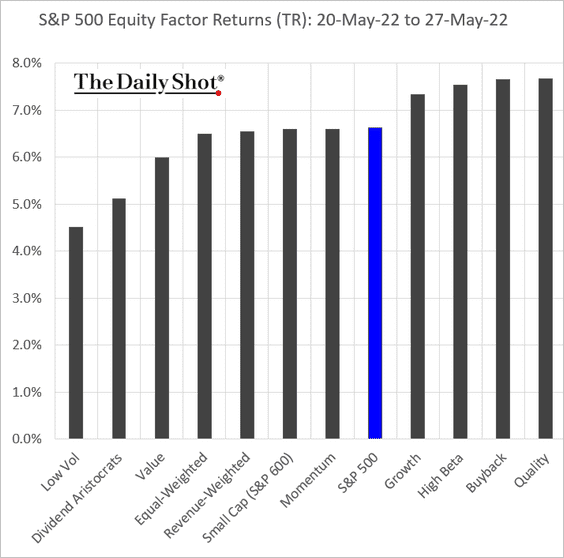
• Last week’s returns by equity factor:
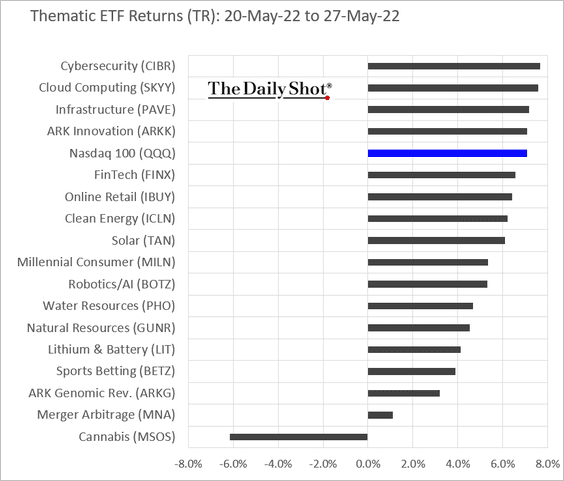
• Thematic ETFs:
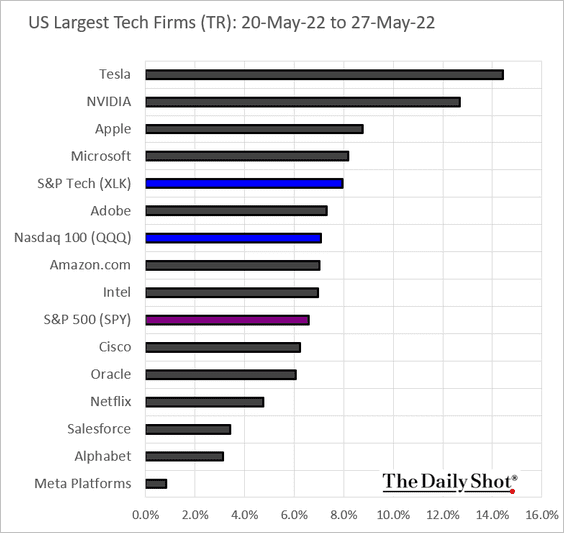
• The largest US tech firms:
Back to Index
Credit
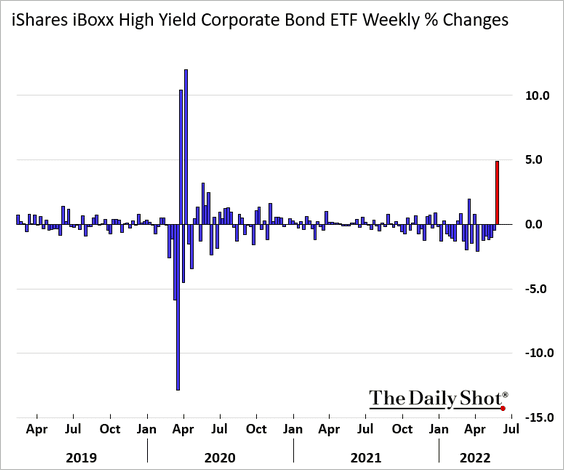
1. High-yield bonds saw a massive rally last week.
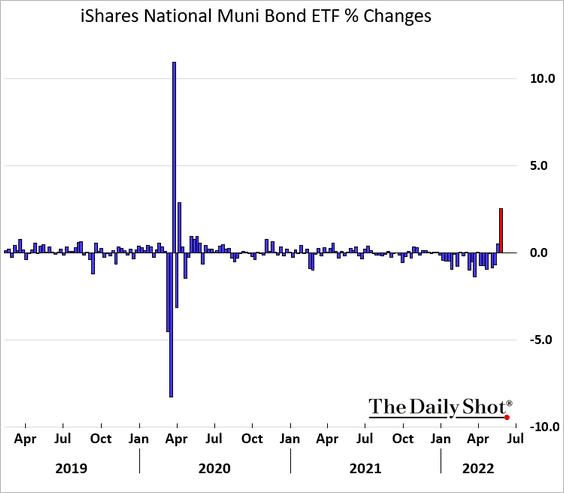
2. Munis also rallied sharply.
Separately, high-yield muni issuers have been pushing out their maturities.
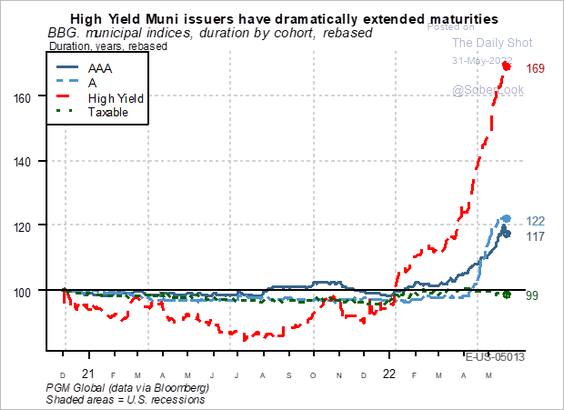 Source: PGM Global
——————–
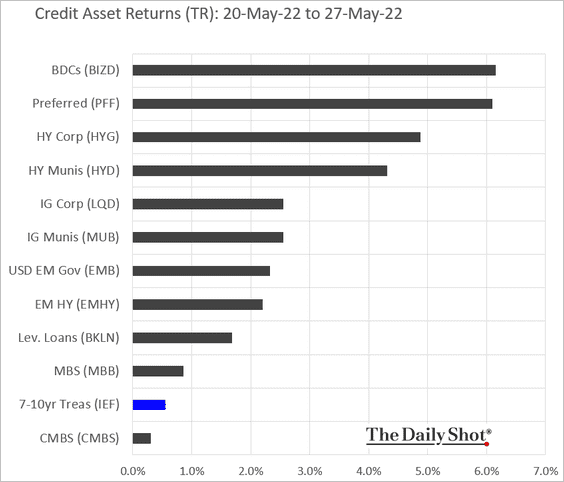
3. Here is last week’s performance across credit categories.
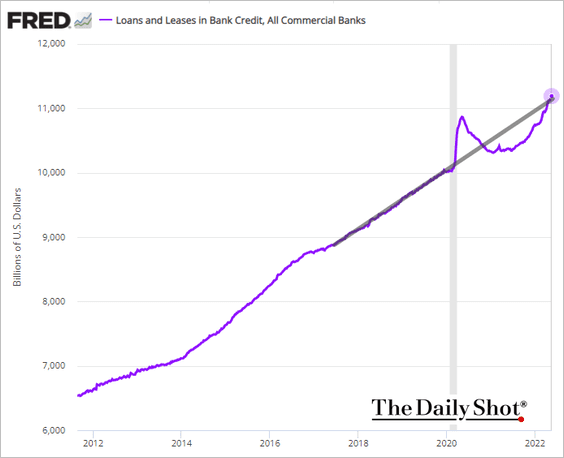
4. US bank loan balances are back at the pre-COVID trend.
5. Next, we have some data on leveraged finance issuance.
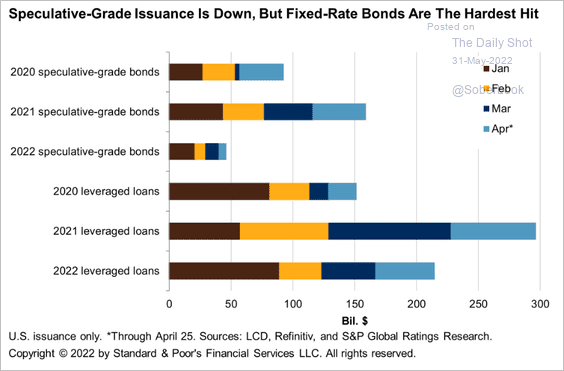 Source: S&P Global Ratings
Back to Index
Rates
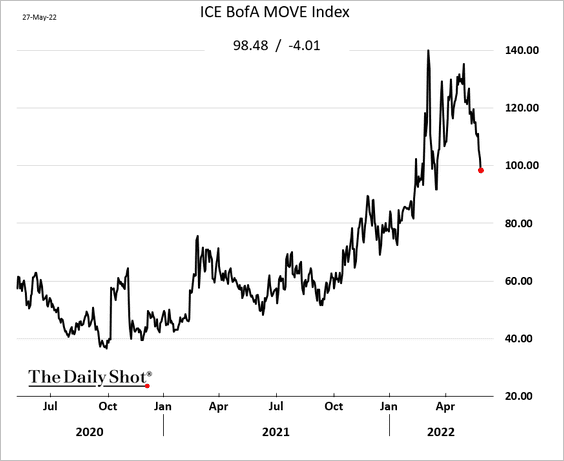
1. The Treasury market implied volatility index continues to move lower. Will the rekindled inflation fears halt the decline?
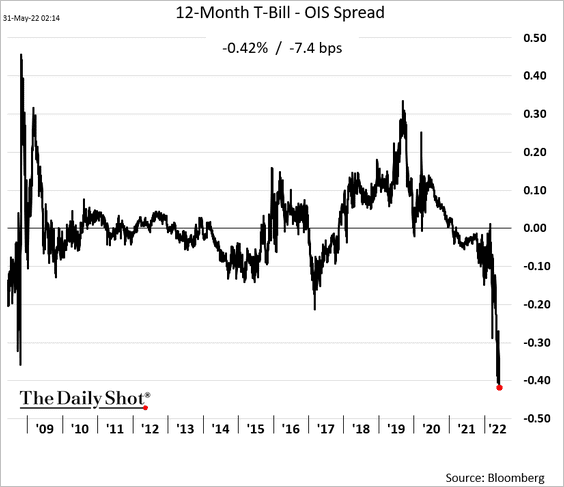
2. T-bills remain in high demand. Here is the 12-month bill – OIS spread.
3. The iShares TIPS bond ETF (TIP) is starting to decline relative to the iShares 7-10 year Treasury bond ETF (IEF).
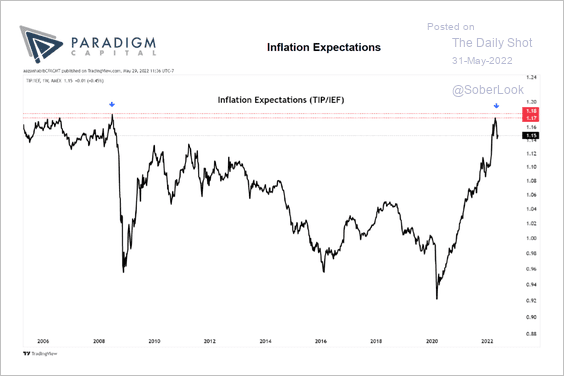 Source: Aazan Habib; Paradigm Capital
4. Historically, after stocks and Treasuries decline together, bonds tend to rebound.
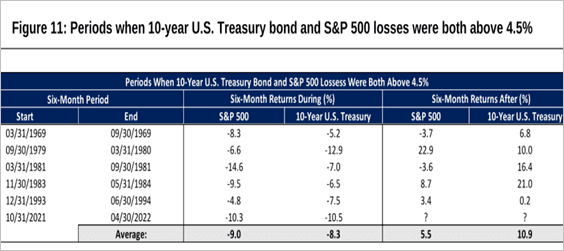 Source: Citi Private Bank
Back to Index
Global Developments
1. Let’s start with a forecast for excess household savings across the G4 economies.
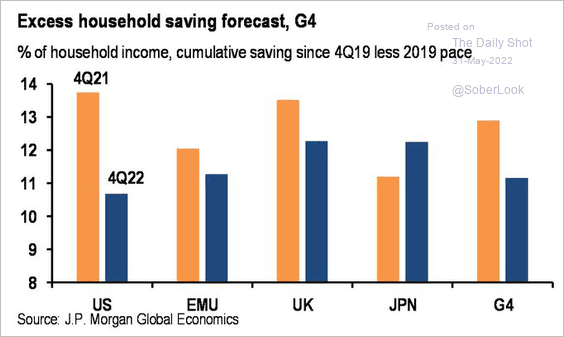 Source: JP Morgan Research; @carlquintanilla
2. How much have financial conditions tightened this year?
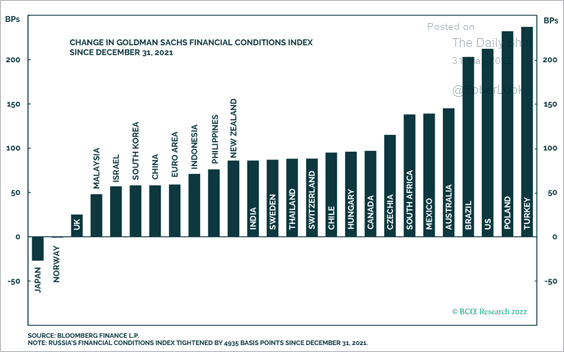 Source: BCA Research
3. Labor markets have been tight in advanced economies.
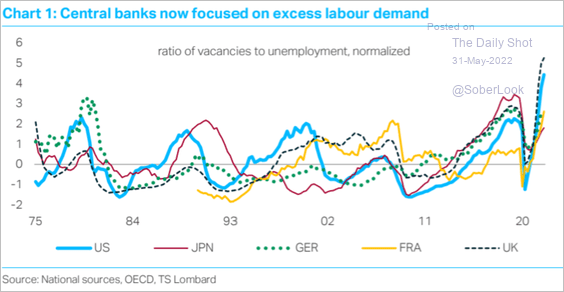 Source: TS Lombard
4. Global late-cycle pressures are rising, albeit with greater differentiation across countries, according to Fidelity.
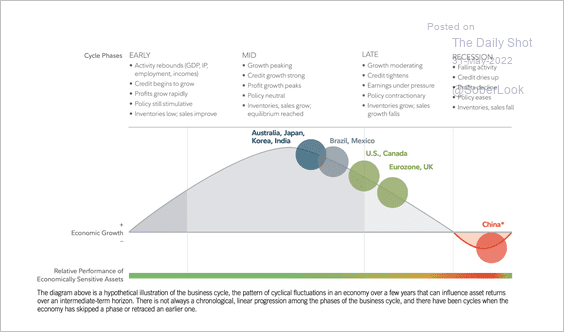 Source: Fidelity Investments
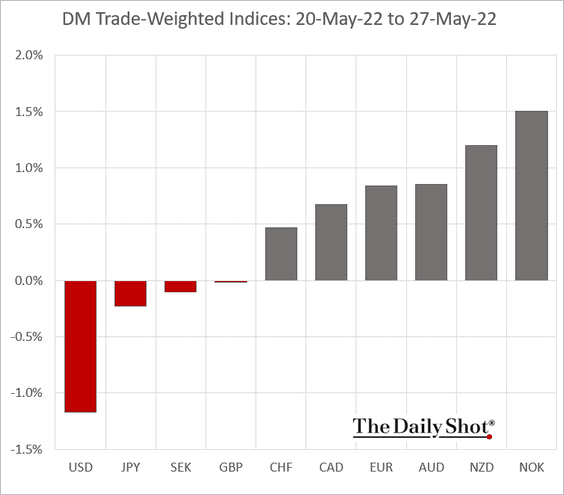
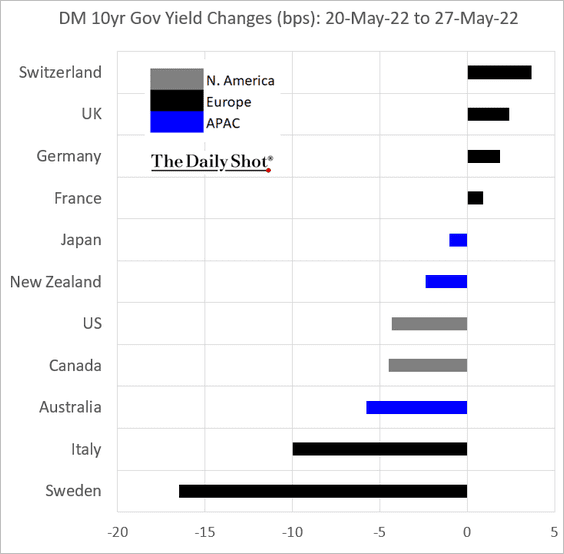
5. Finally, we have last week’s performance data for currencies and bonds.
• Trade-weighted currency indices:
• Sovereign bond yields:
——————–
Food for Thought
1. Attrition rates across 38 US industries/sub-industries:
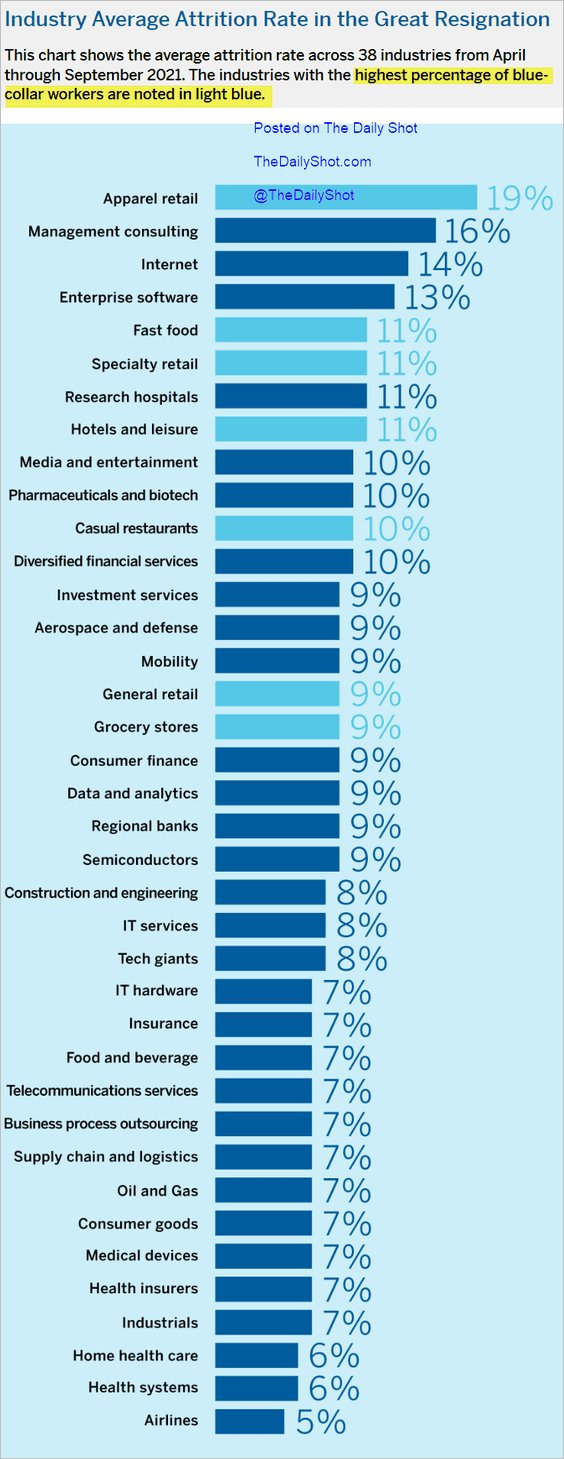 Source: MIT SMR Read full article
Top predictors of attrition:
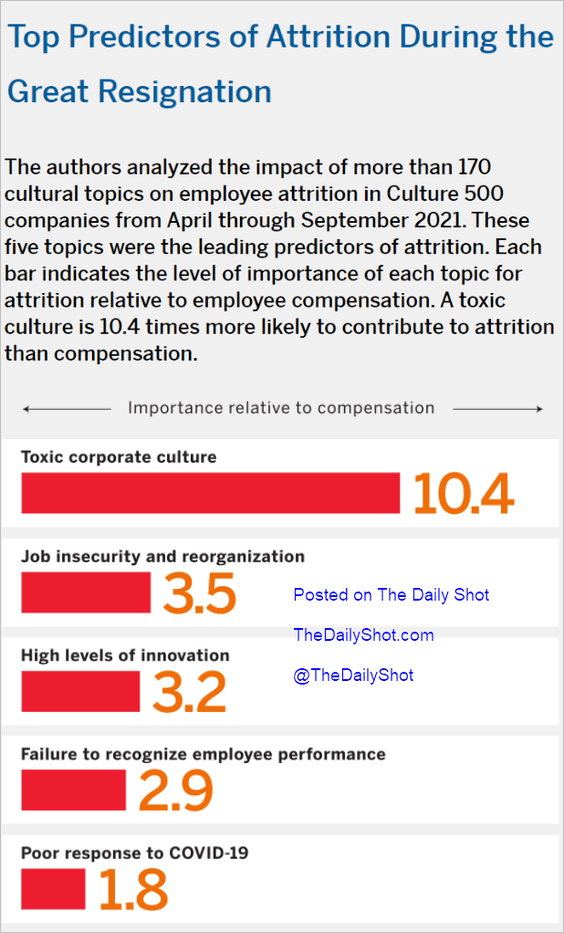 Source: MIT SMR Read full article
——————–
2. Anti-Asian bias in the US:
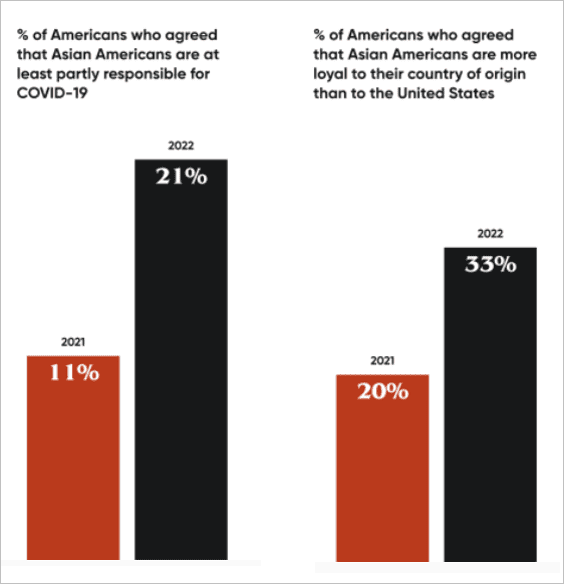 Source: Brookings Read full article
3. Percentage of US women obtaining abortions:
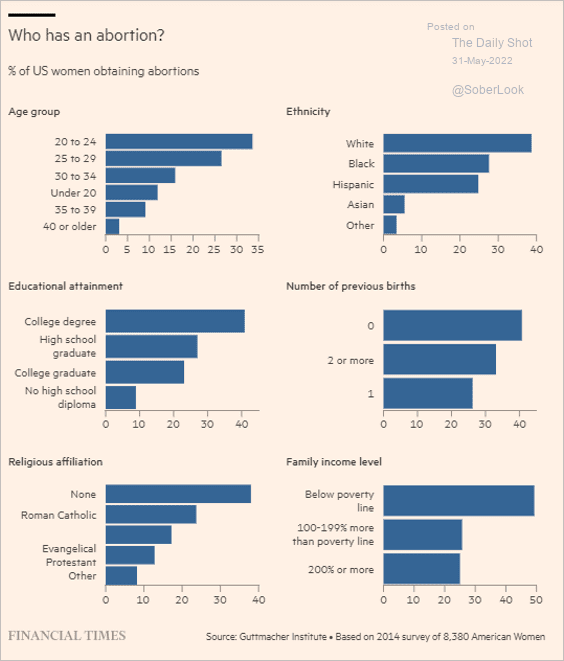 Source: @financialtimes Read full article
4. Global renewable energy capacity additions:
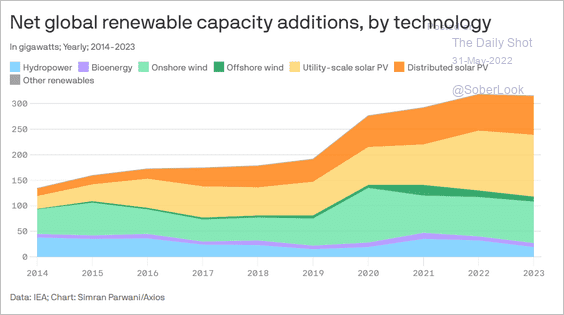 Source: @axios Read full article
5. Medicaid spending per enrollee:
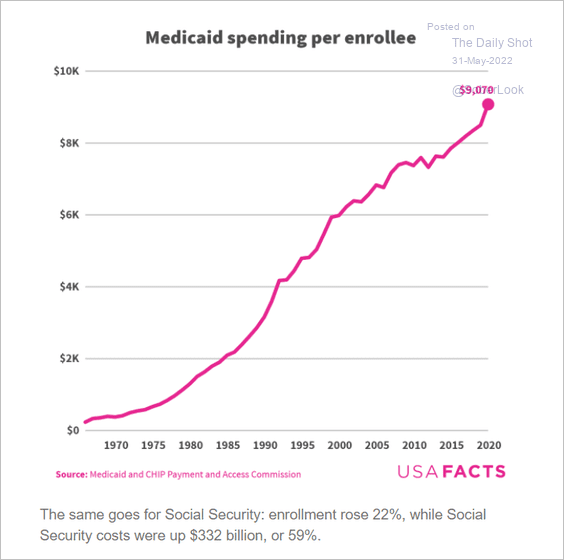 Source: USAFacts
6. Willingness to buy secondhand products:
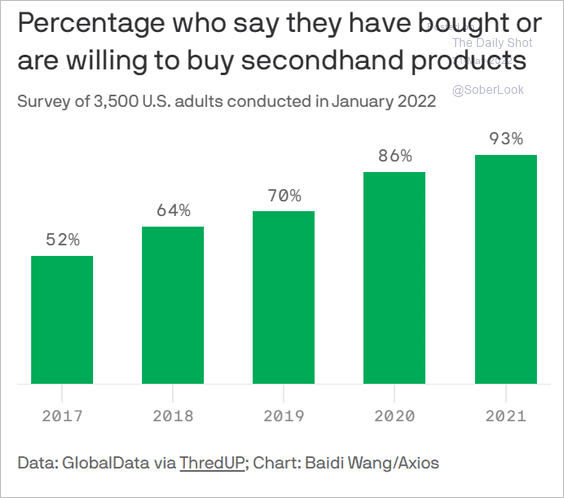 Source: @axios Read full article
7. Damage to Ukrainian infrastructure:
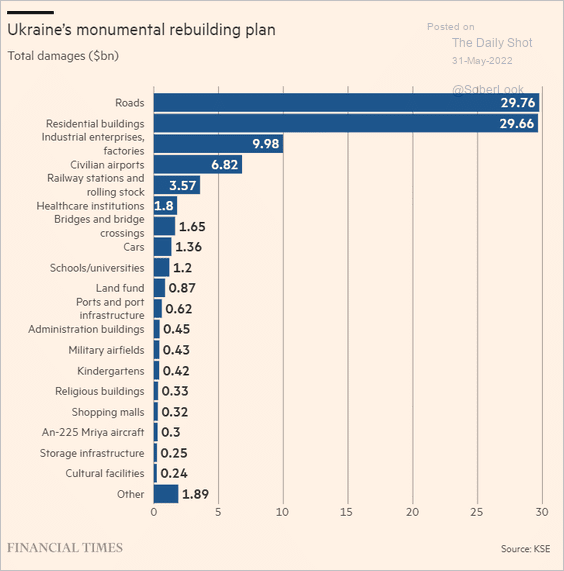 Source: @financialtimes Read full article
8. The distribution of global GDP over the past 2,000 years:
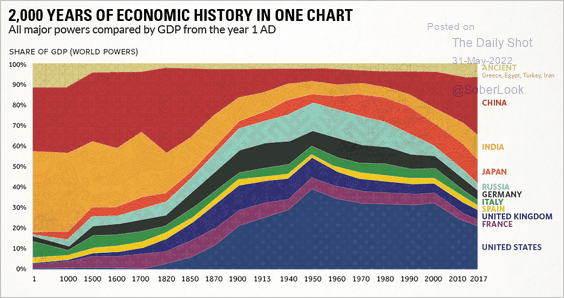 Source: Visual Capitalist Read full article
——————–
Back to Index