The Daily Shot: 30-Jun-22
• The United States
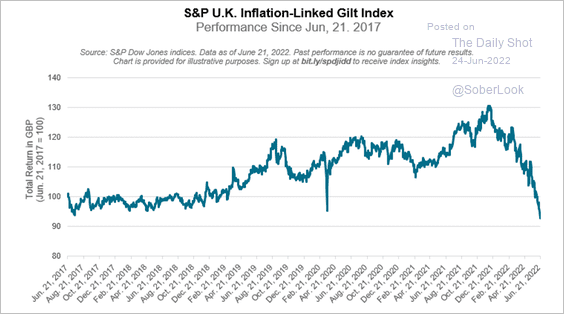
• The United Kingdom
• The Eurozone
• Europe
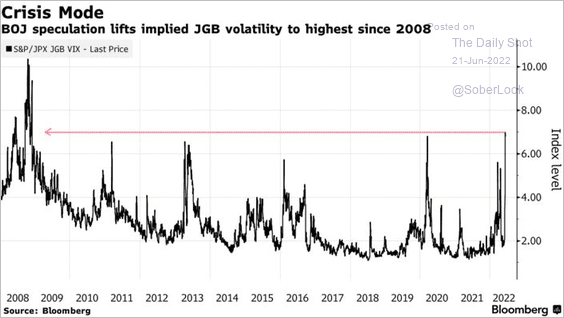
• Japan
• Asia – Pacific
• China
• Emerging Markets
• Cryptocurrency
• Energy
• Equities
• Credit
• Rates
• Global Developments
• Food for Thought
The United States
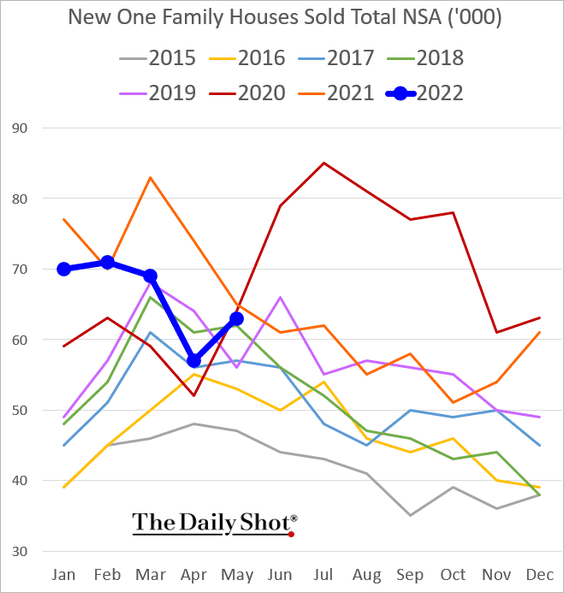
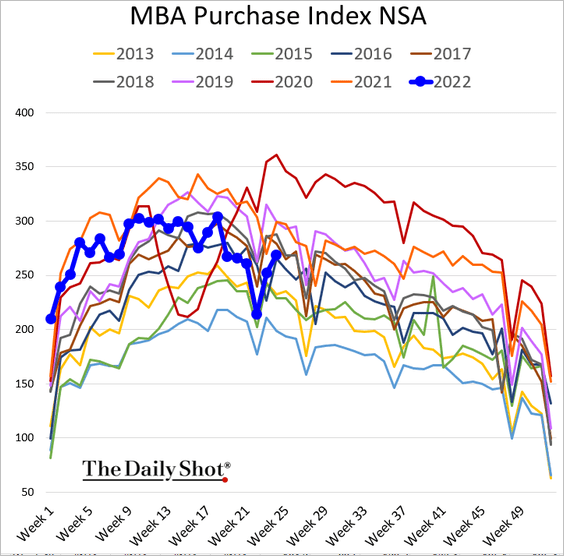
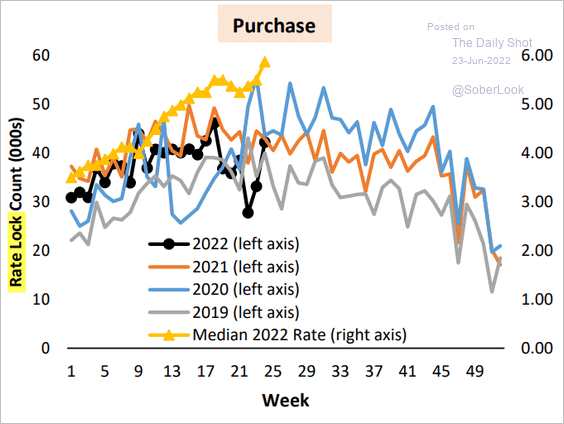
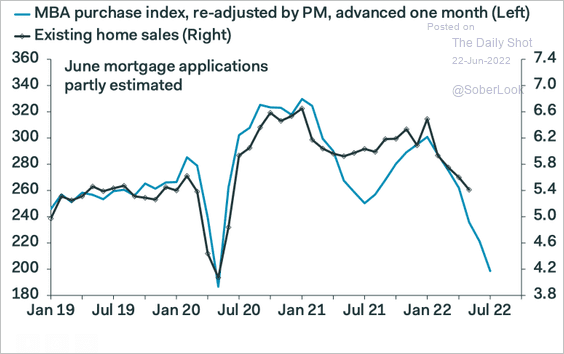
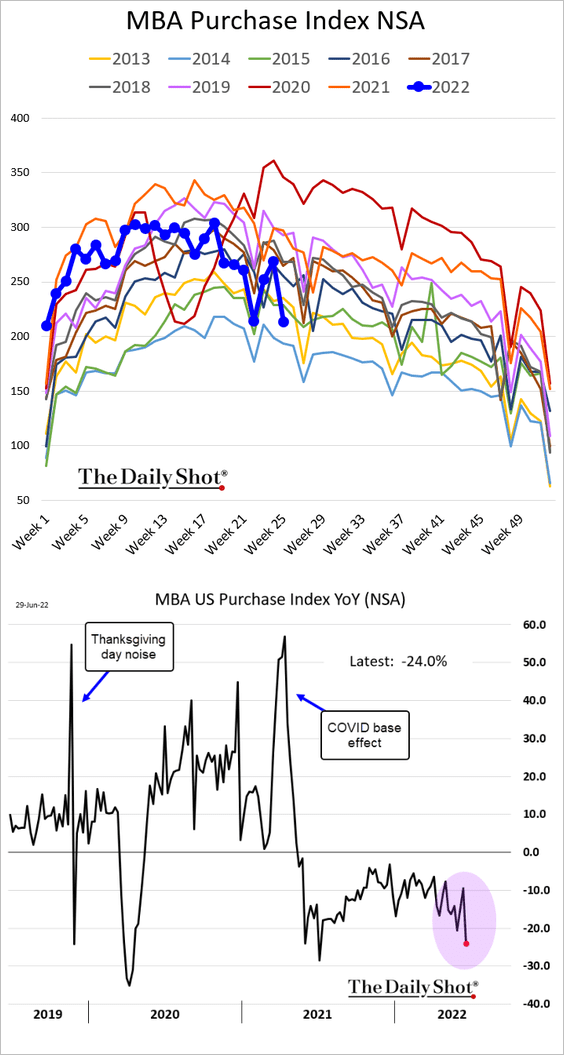
1. Mortgage applications to purchase a home dropped sharply last week and are now down 24% vs. last year.
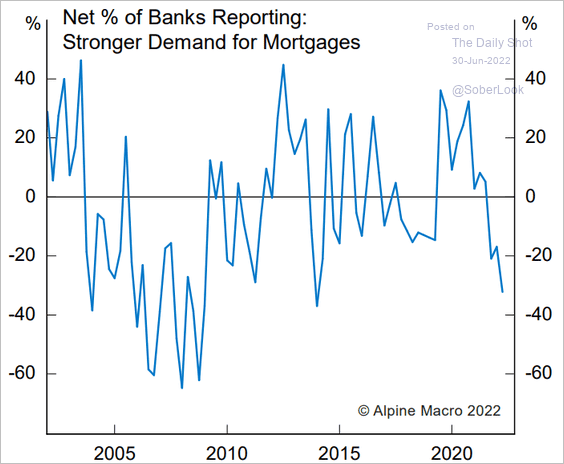
• Banks have been reporting softer demand for mortgages.
 Source: Alpine Macro
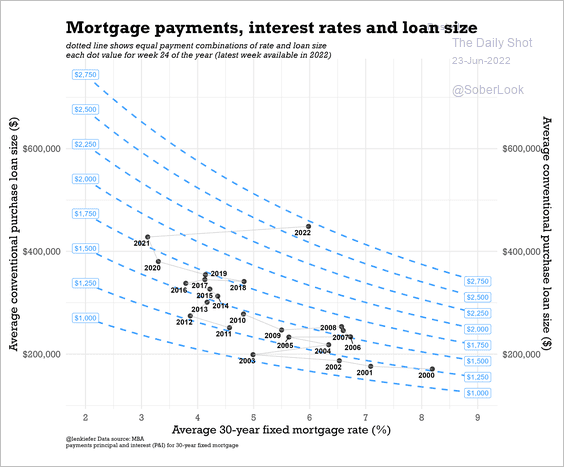
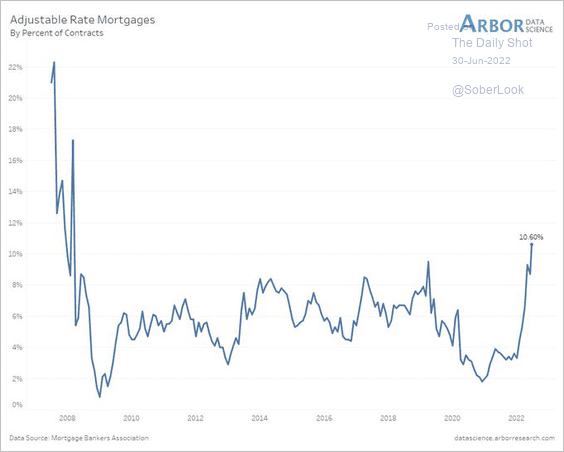
• A higher percentage of borrowers have been tapping adjustable-rate mortgages to reduce initial monthly payments.
 Source: @LizAnnSonders, @DataArbor, @MBAMortgage
——————–
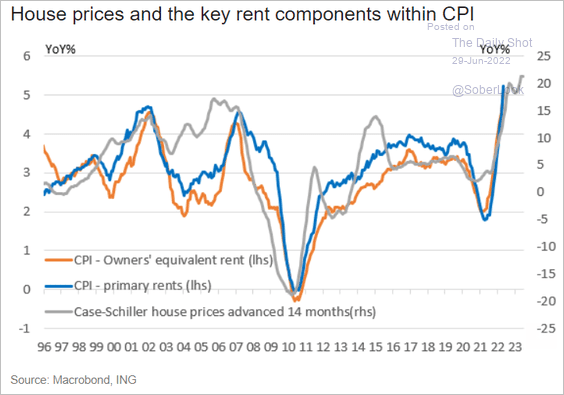
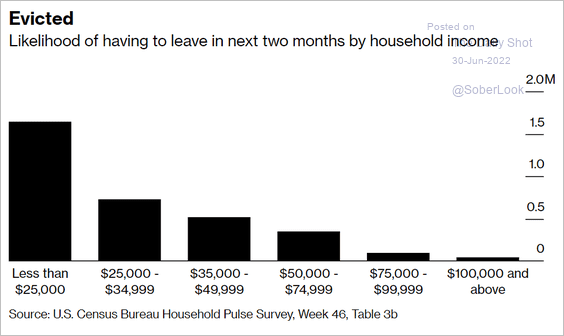
2. More low-income households surveyed by the Census Bureau are behind on rent as of early June.
 Source: @atanzi, @markets Read full article
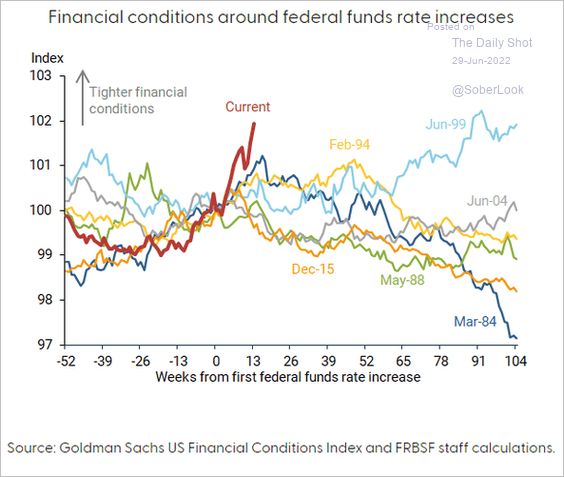
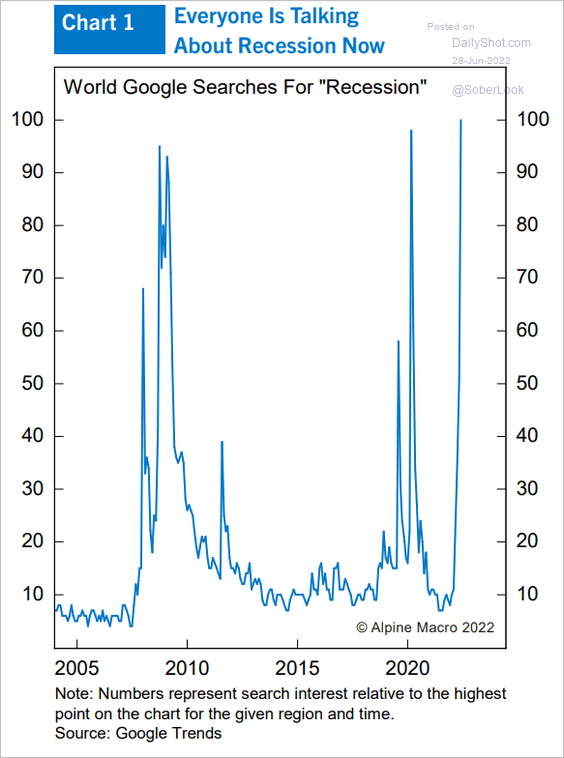
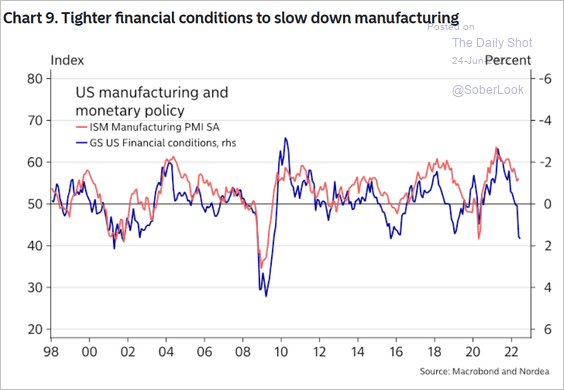
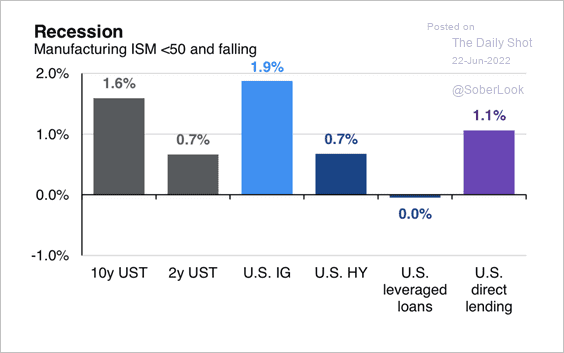
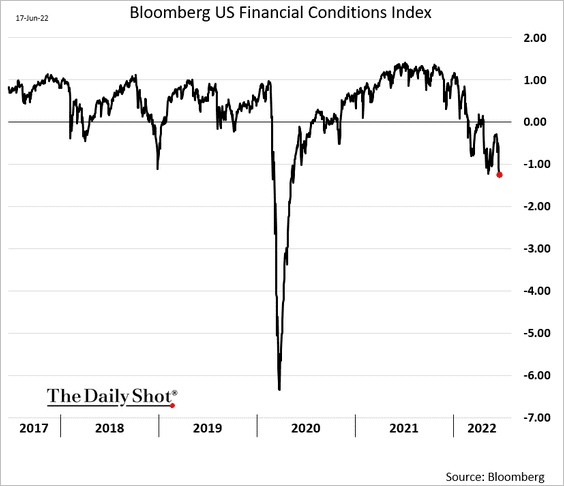
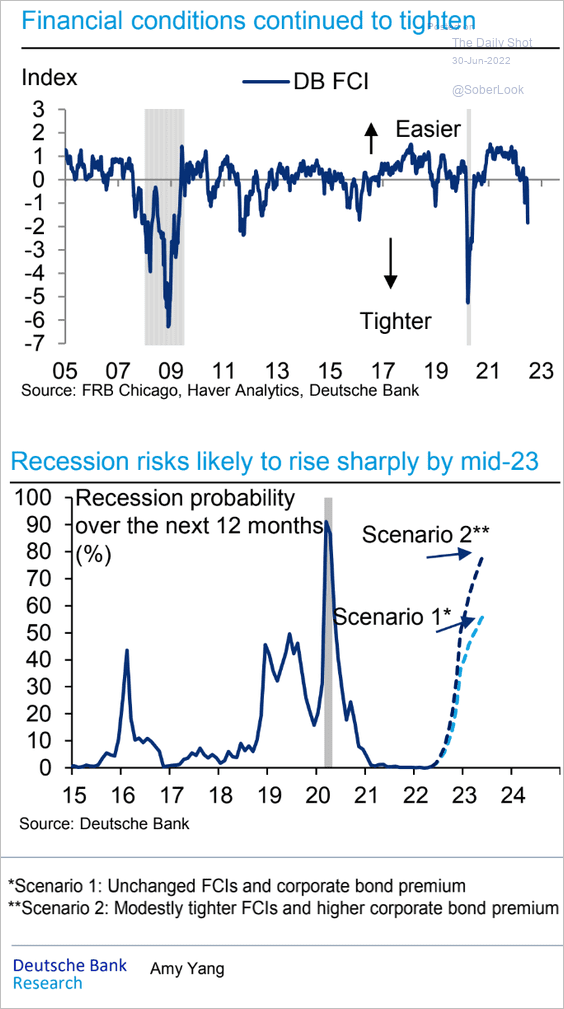
3. Tight financial conditions will substantially boost recession risks by mid-2023, according to Deutsche Bank.
 Source: Deutsche Bank Research
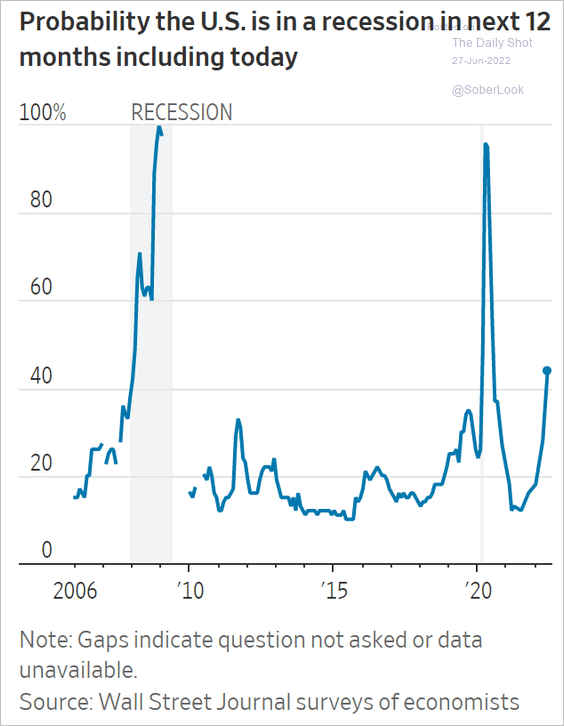
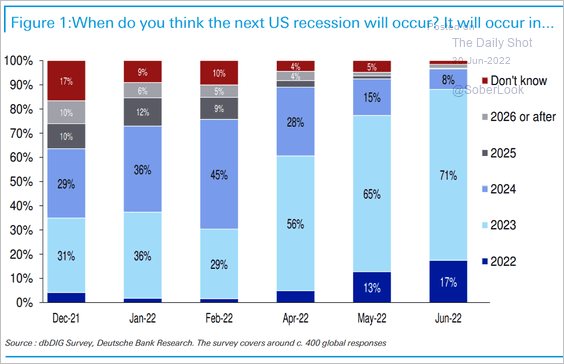
• A majority of institutional investors expect a recession to occur next year.
 Source: Deutsche Bank Research
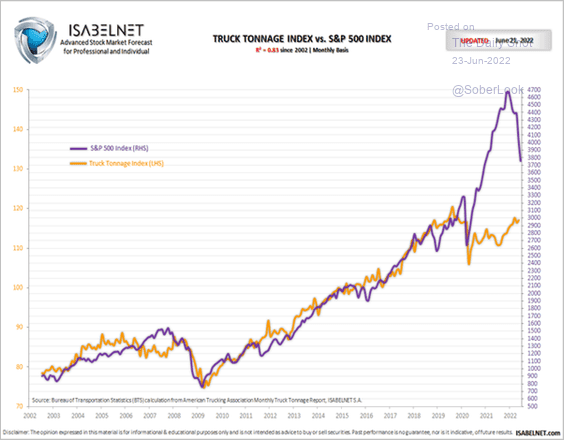
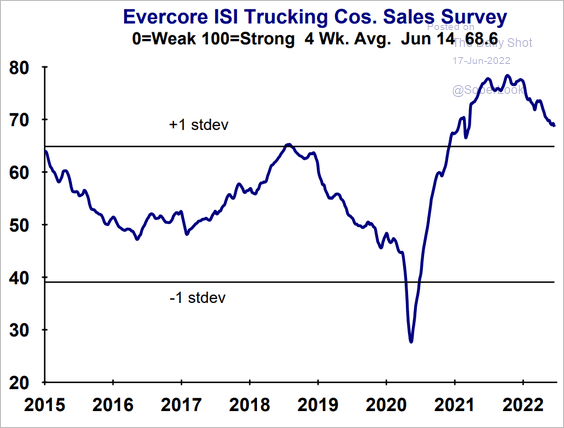
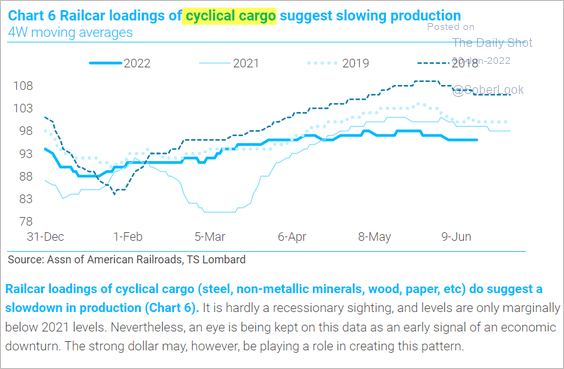
• Cyclical cargo railcar loadings are indicating a slowdown.
 Source: TS Lombard
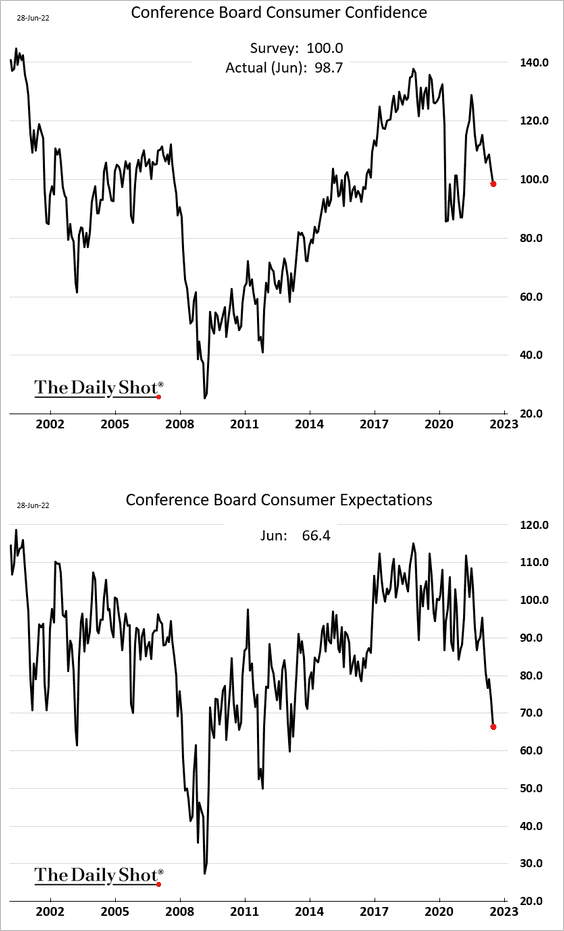
• The spread between the Conference Board’s consumer expectations and current conditions is signaling a recession.
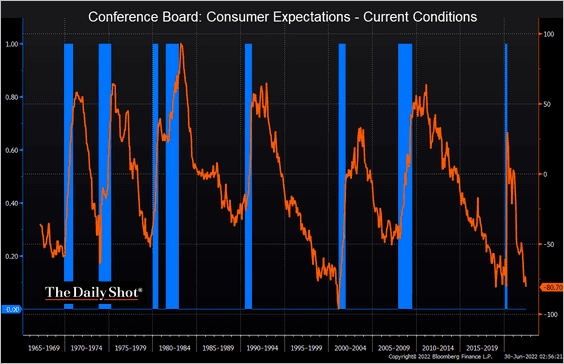 Source: @TheTerminal, Bloomberg Finance L.P.
——————–
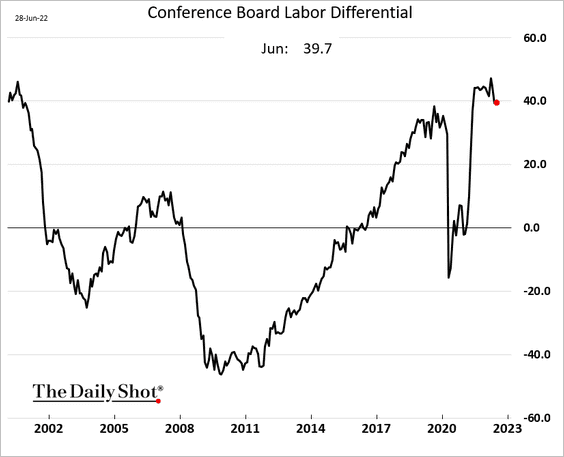
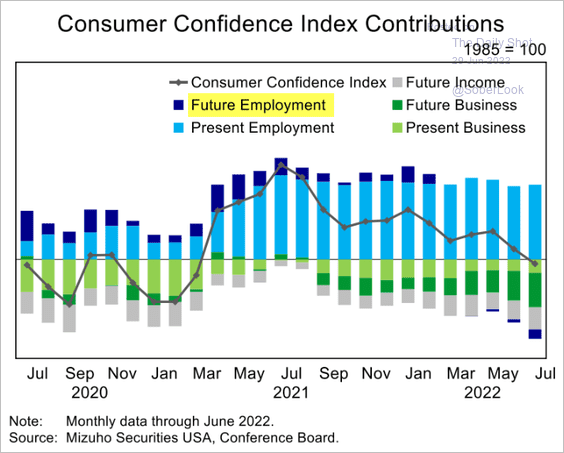
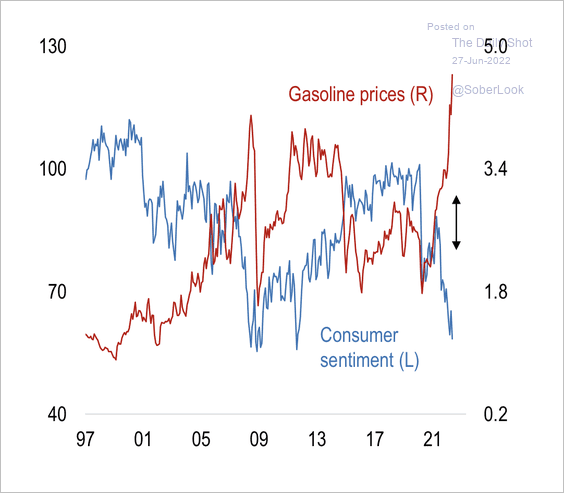
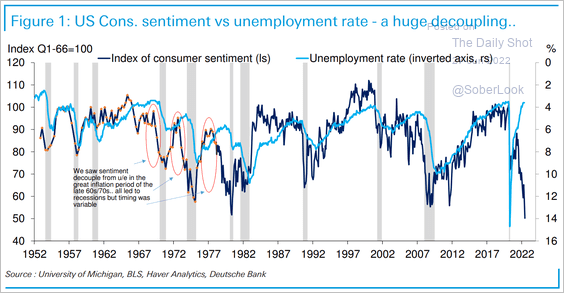
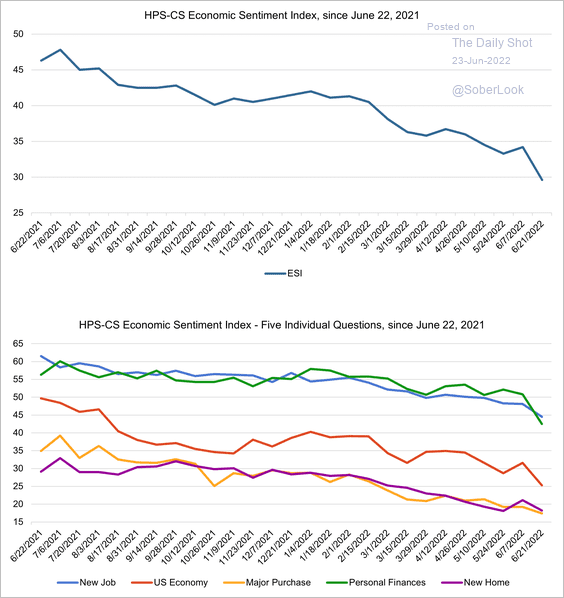
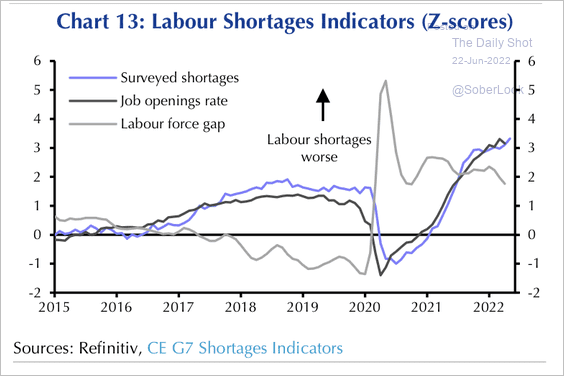
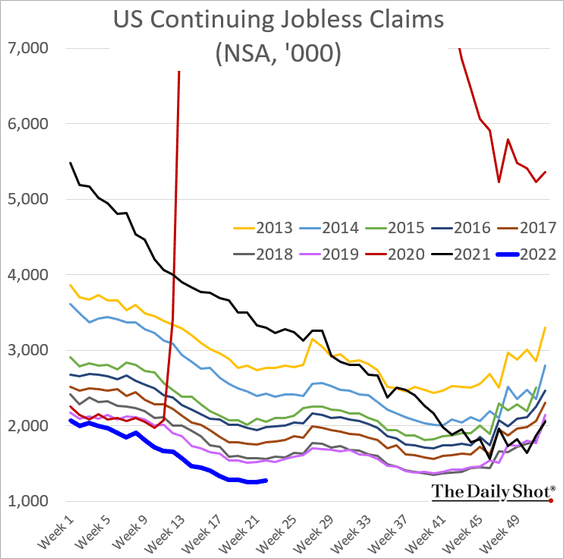
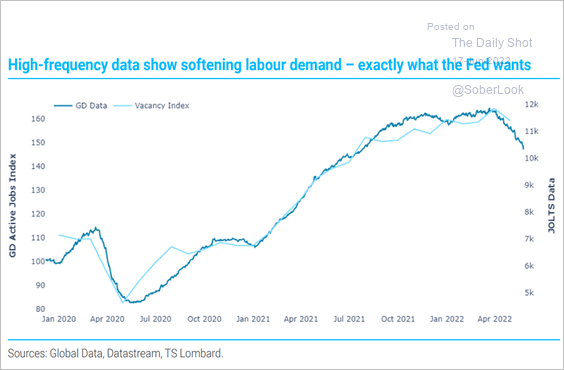
4. Households are beginning to show concerns about the labor market.
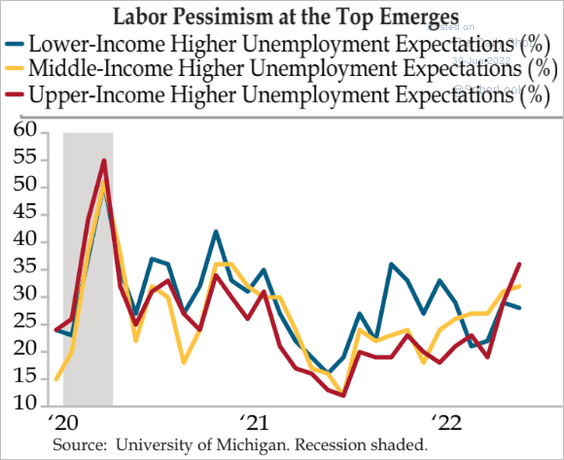 Source: Quill Intelligence
Food service job openings growth has slowed.
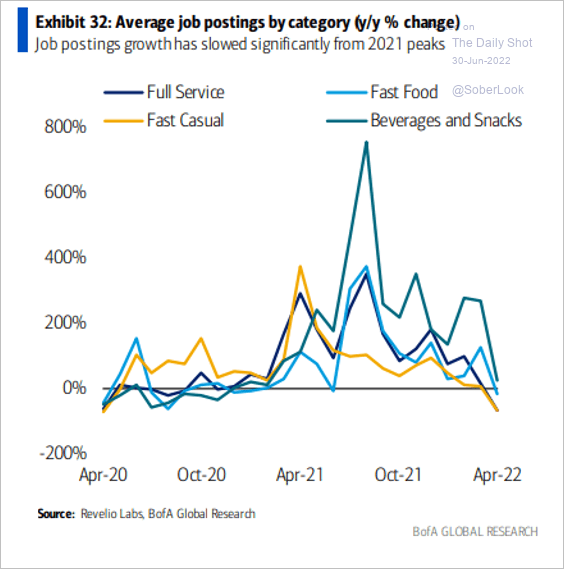 Source: BofA Global Research; @MikeZaccardi
——————–
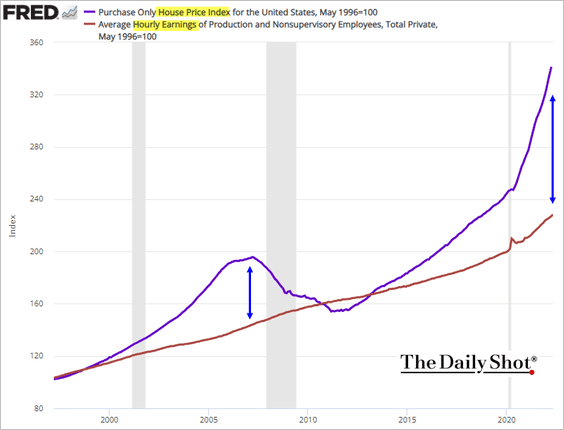
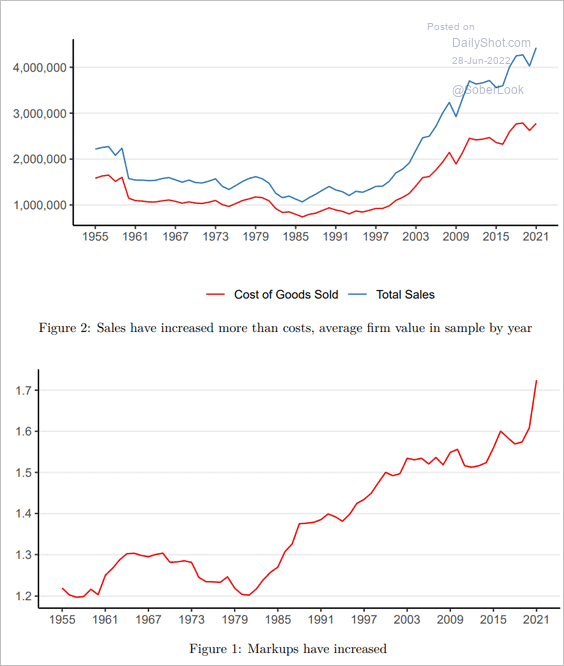
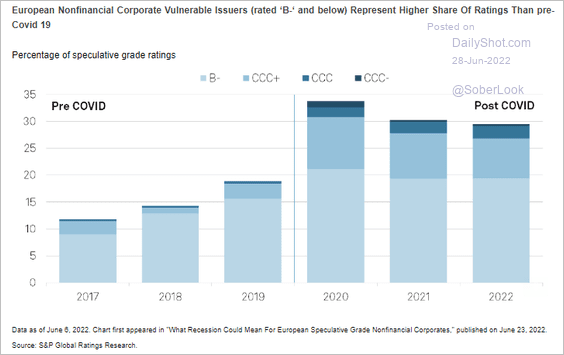
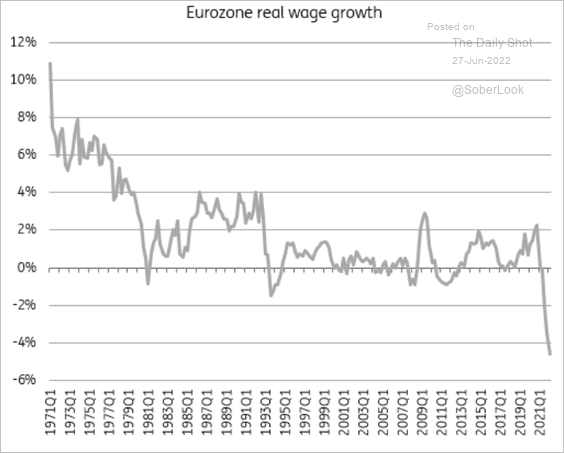
5. Real compensation costs are now well below pre-COVID levels.
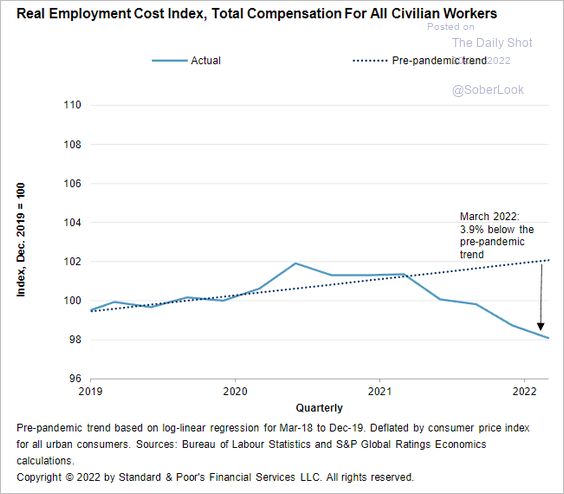 Source: S&P Global Ratings
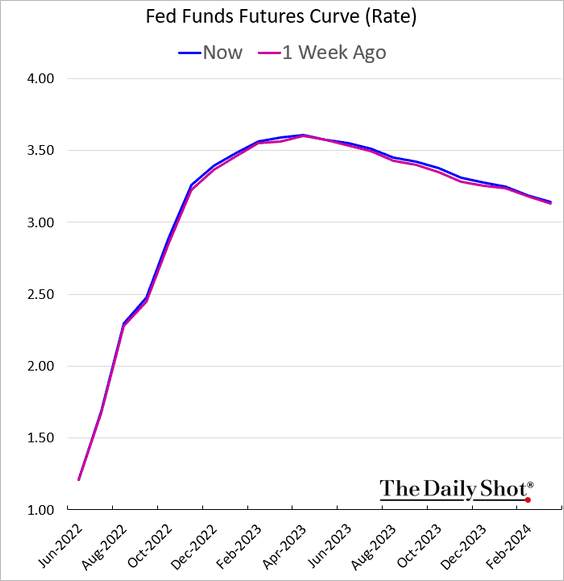
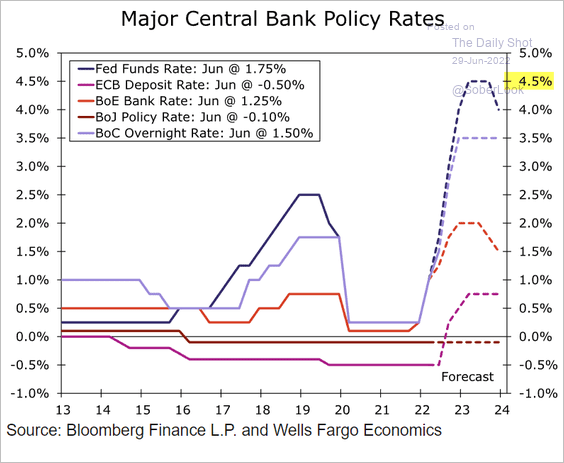
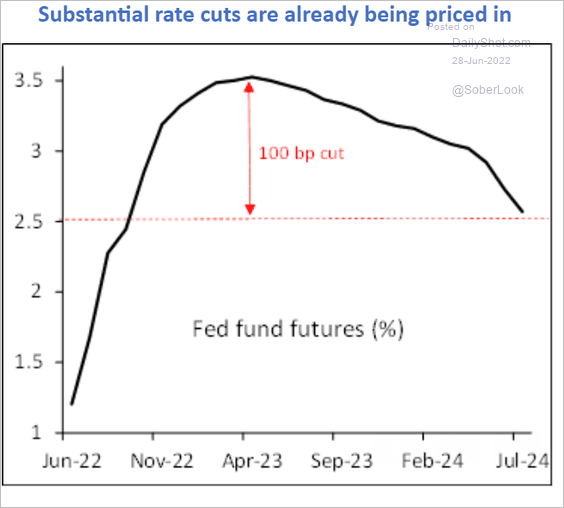
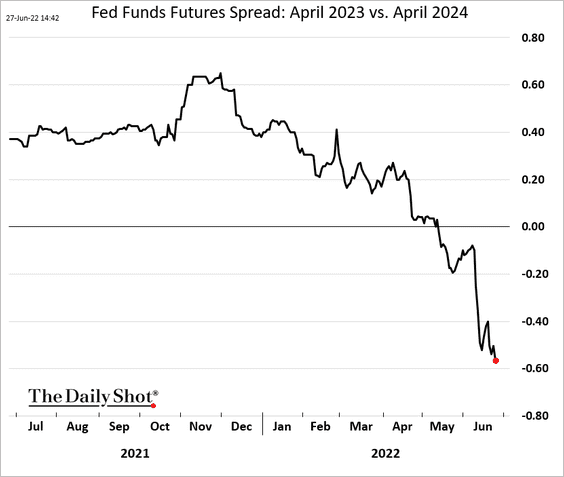
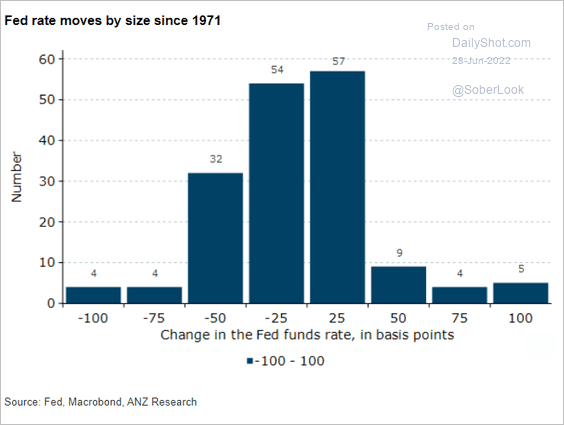
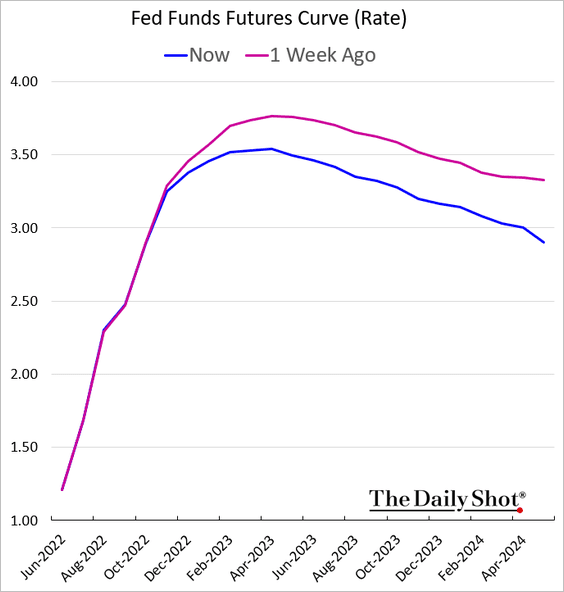
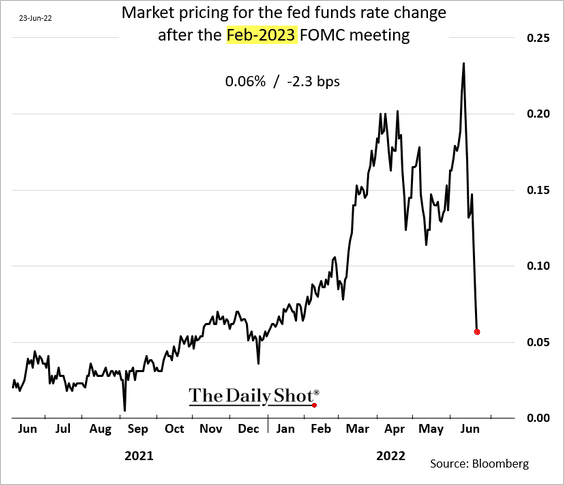
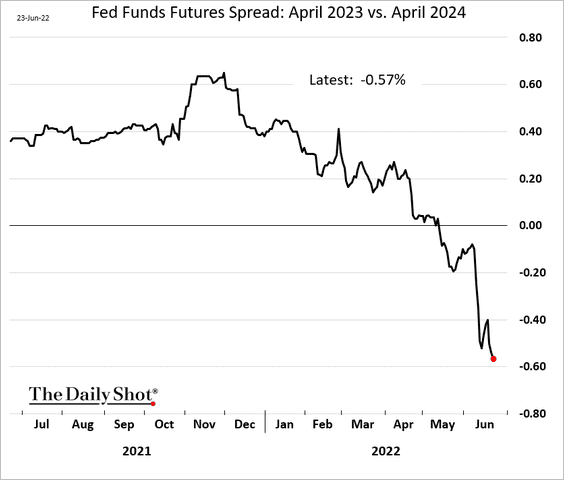
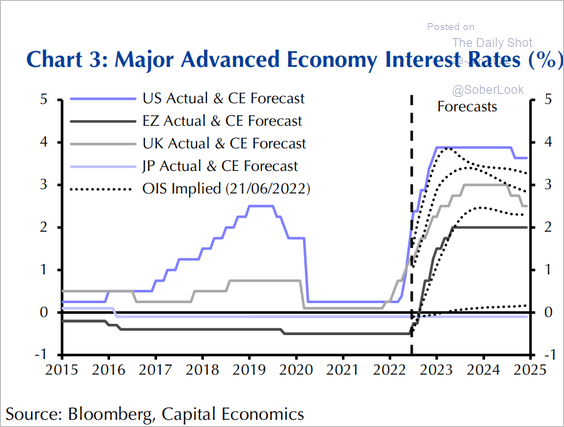
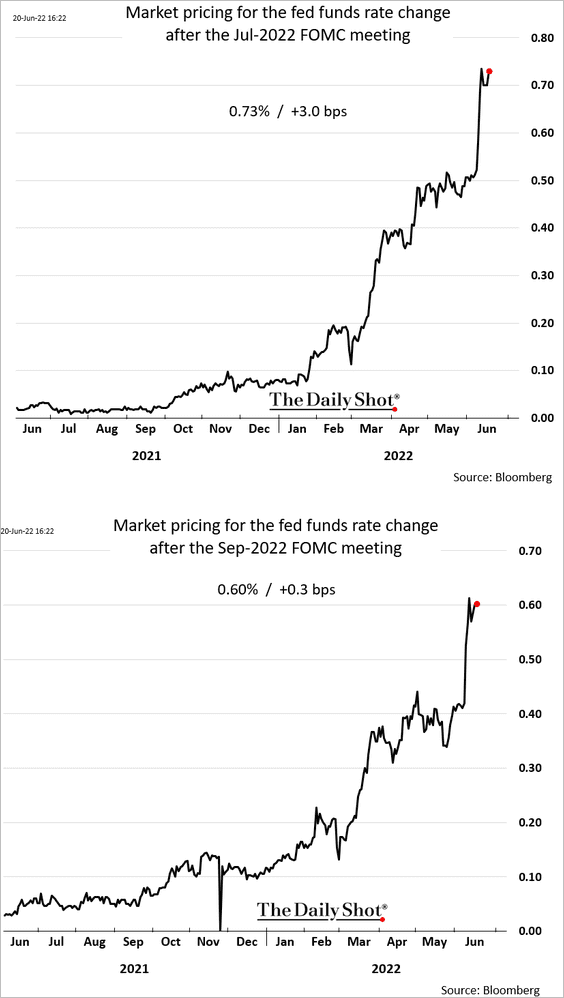
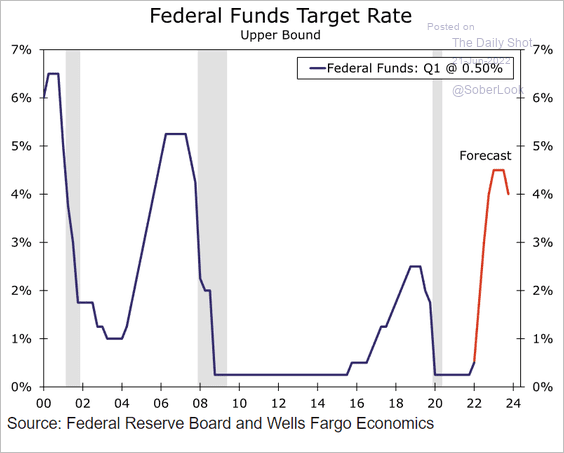
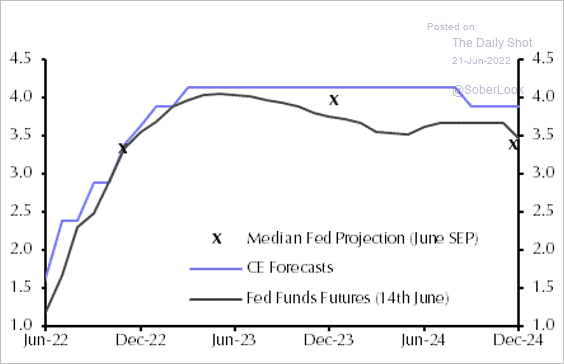
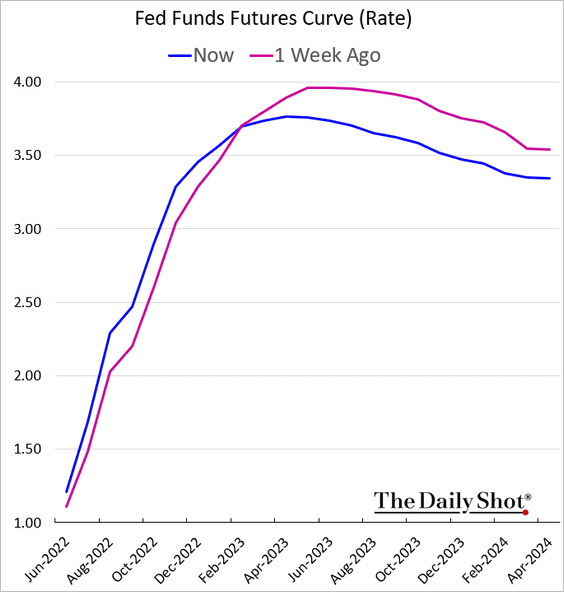
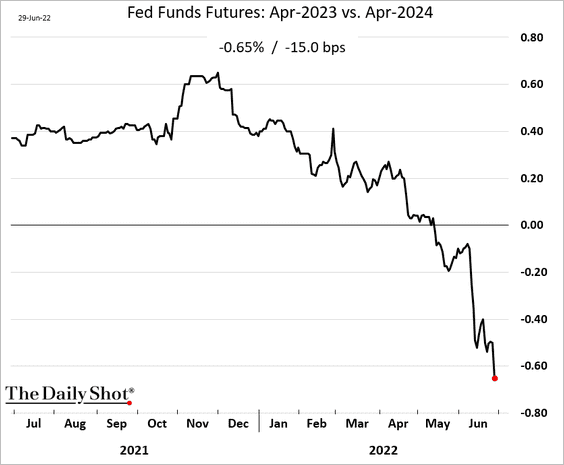
6. The market is pricing bigger Fed rate cuts starting in the first half of next year.
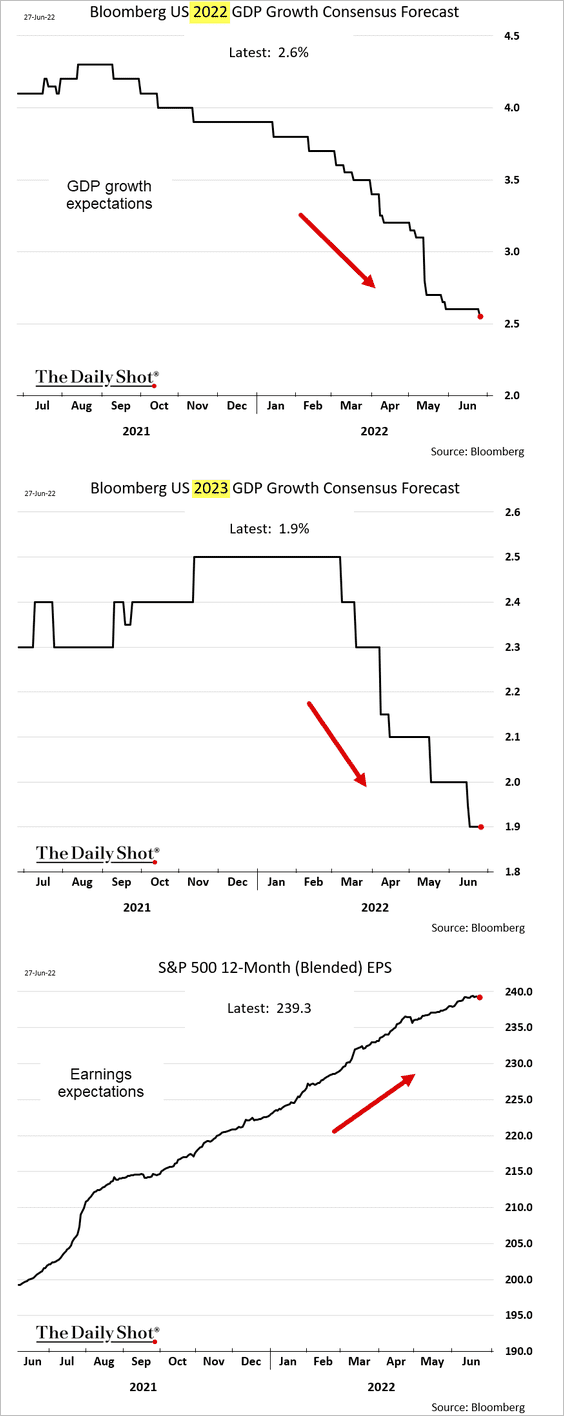
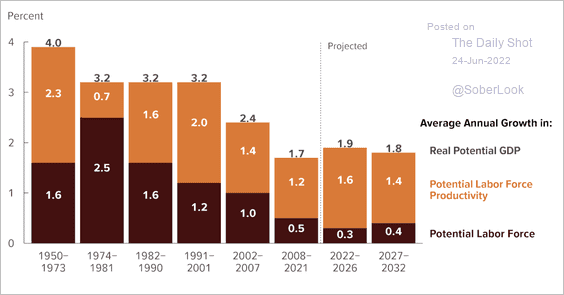
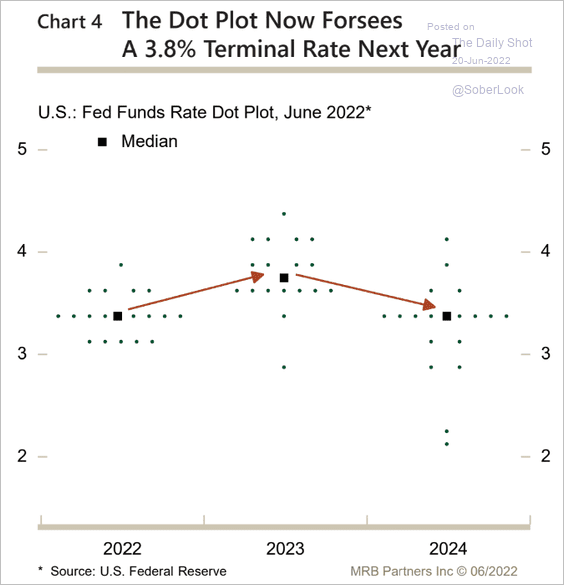
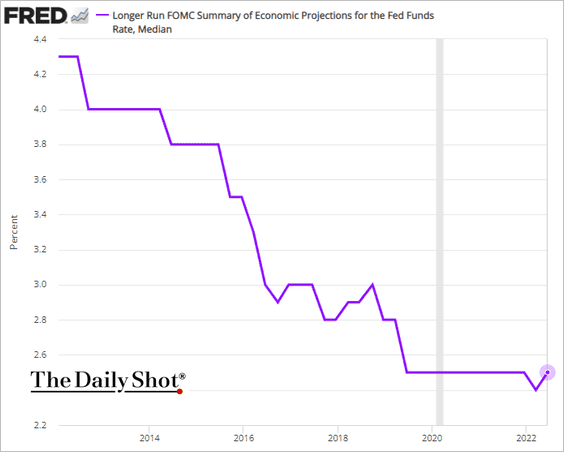
7. Market pricing for the real neutral rate reflects deteriorating longer-term potential GDP growth (see comment from Piper Sandler).
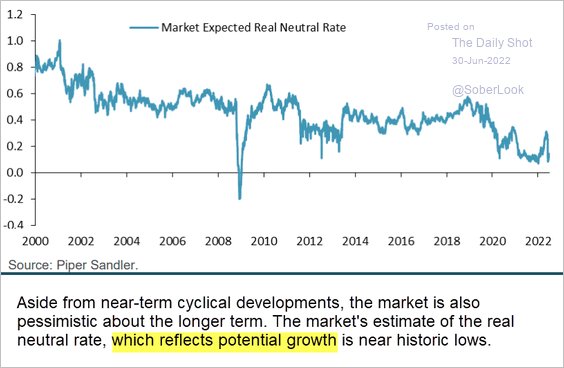 Source: Piper Sandler
Back to Index
The United Kingdom
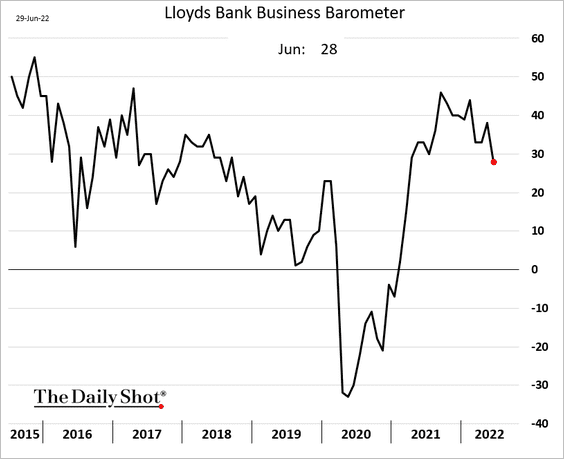
1. The Lloyds business sentiment index is rolling over.
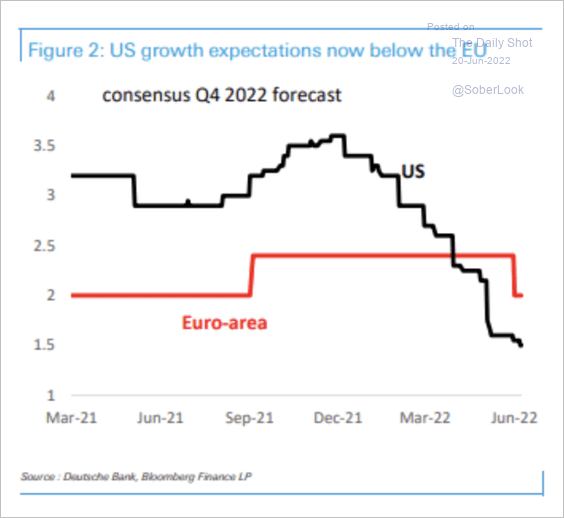
2. ANZ Research cut its GDP forecast to 3.6% this year, flattened by base effects. ANZ also sees below potential growth of 1% next year.
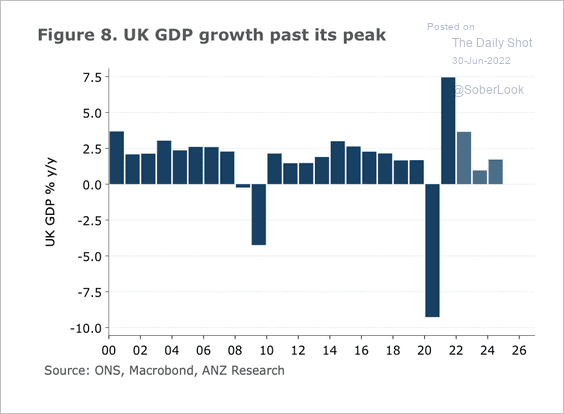 Source: @ANZ_Research
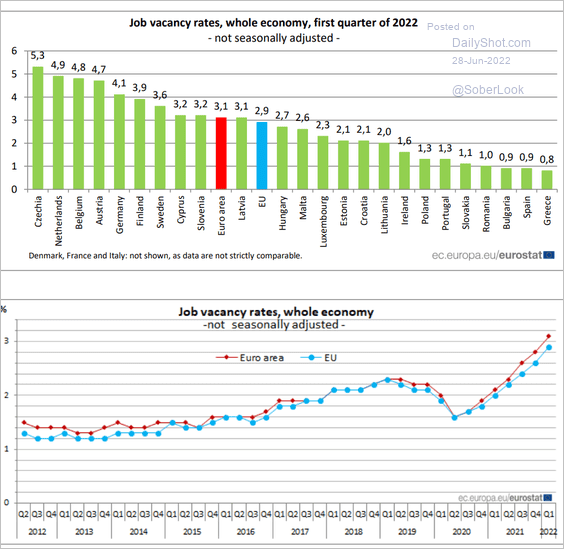
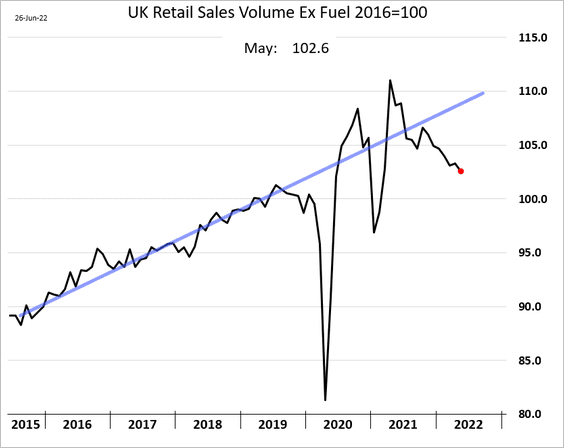
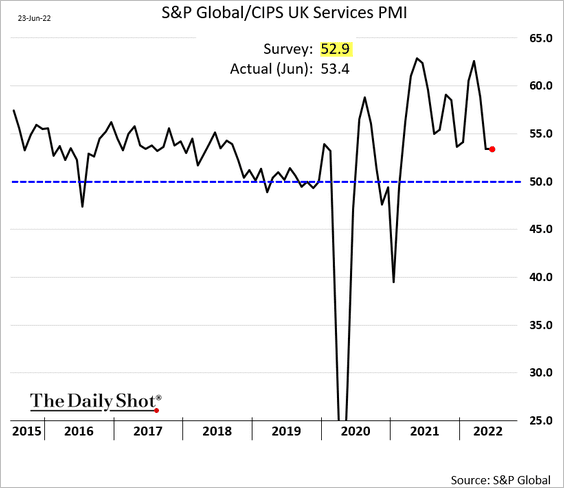
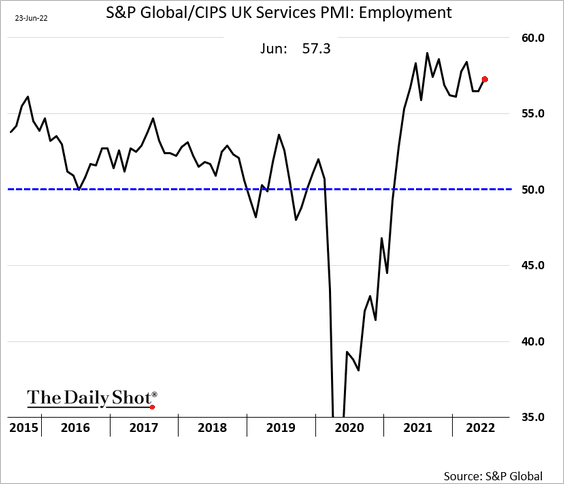
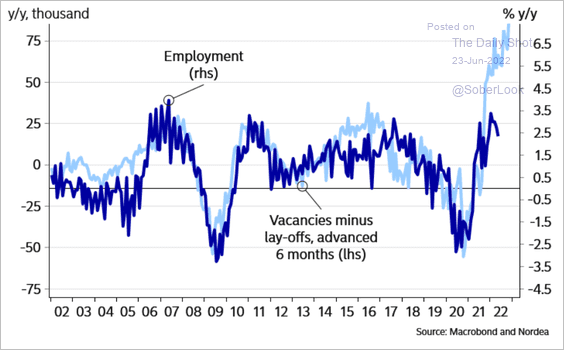
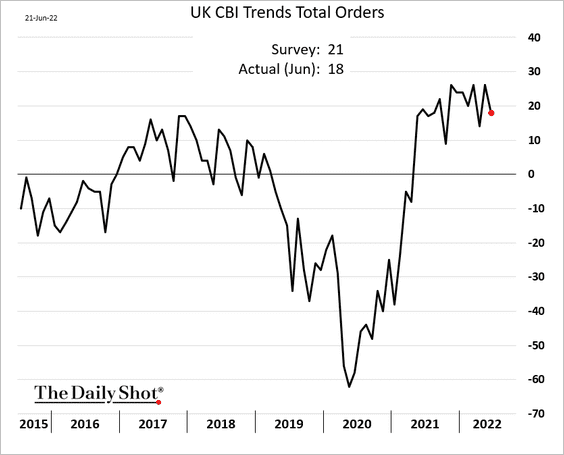
3. Labor demand is moderating.
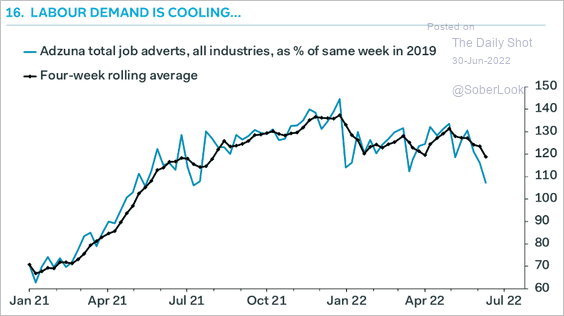 Source: Pantheon Macroeconomics
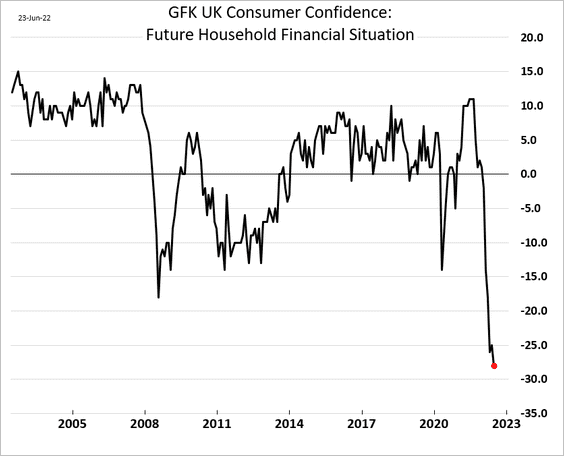
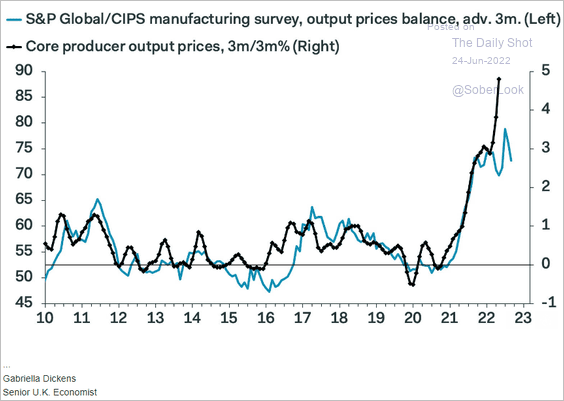
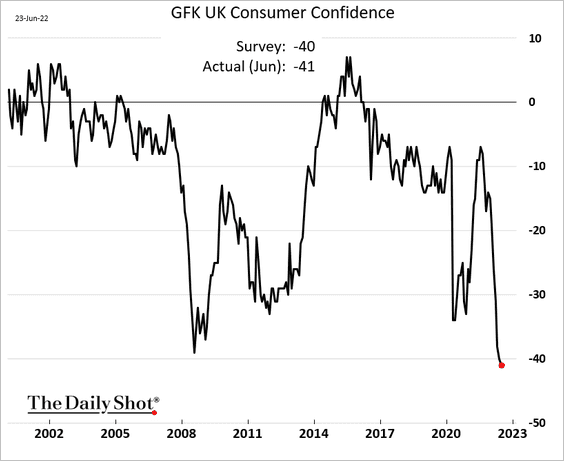
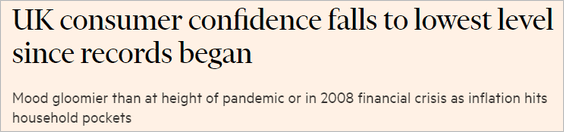
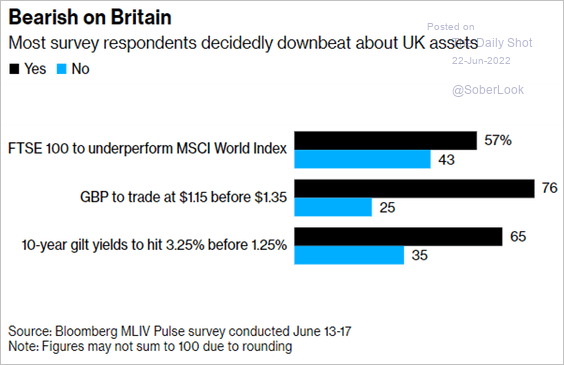
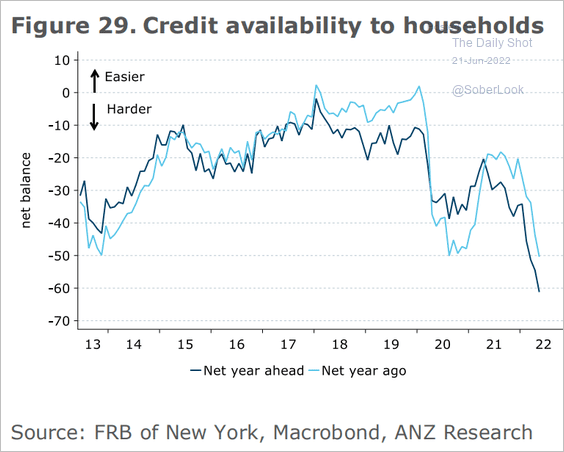
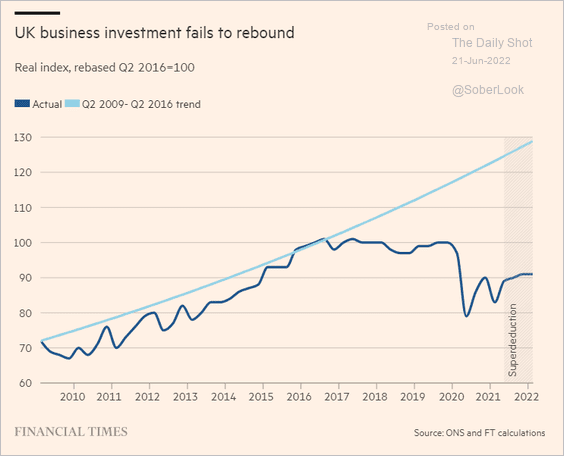
4. This trend is unlikely to continue, given higher rates and awful consumer sentiment.
 Source: @financialtimes Read full article
Back to Index
The Eurozone
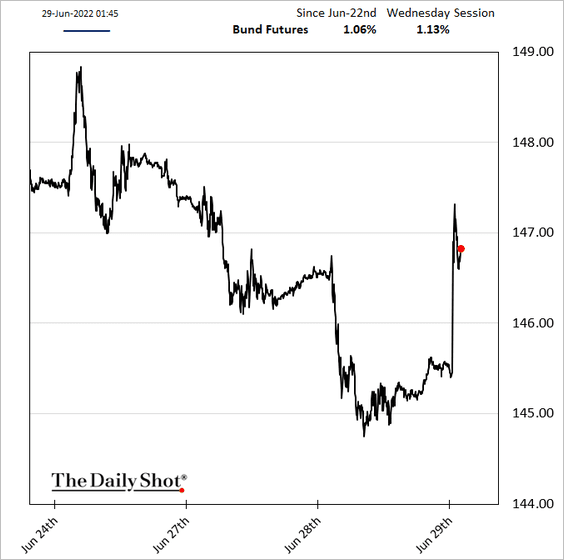
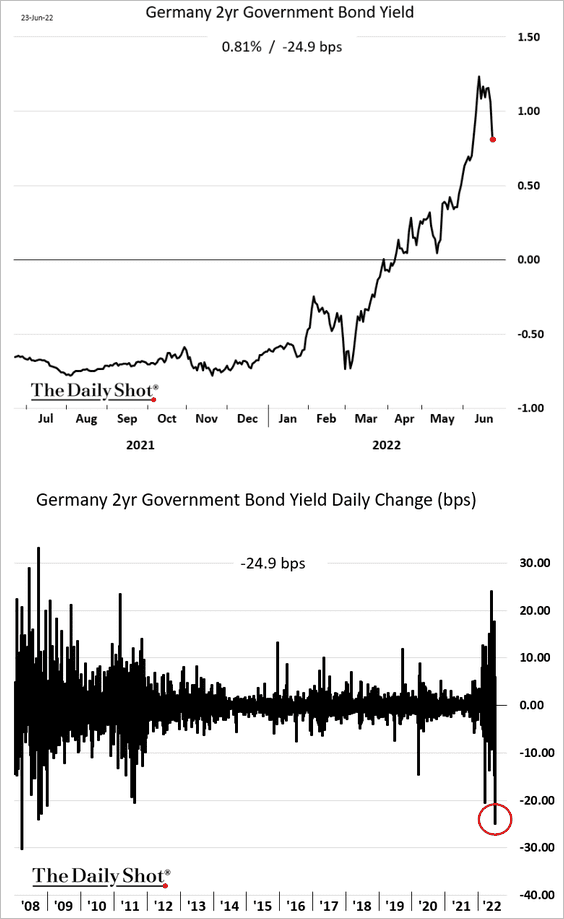
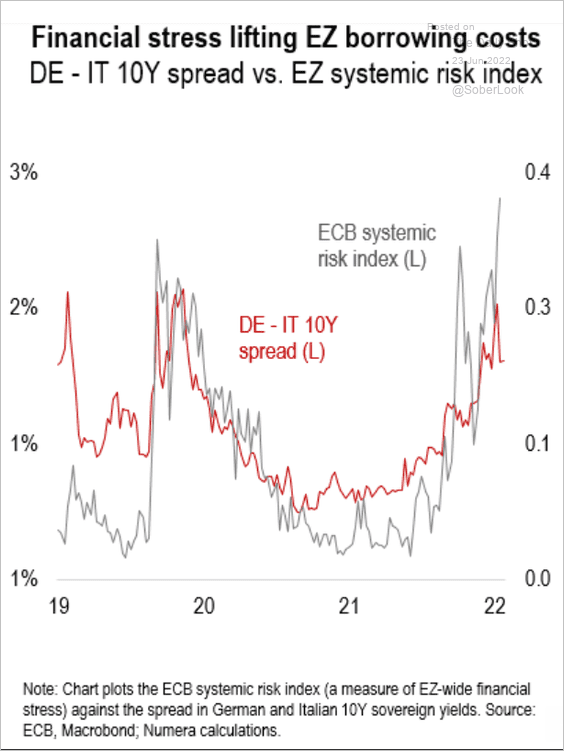
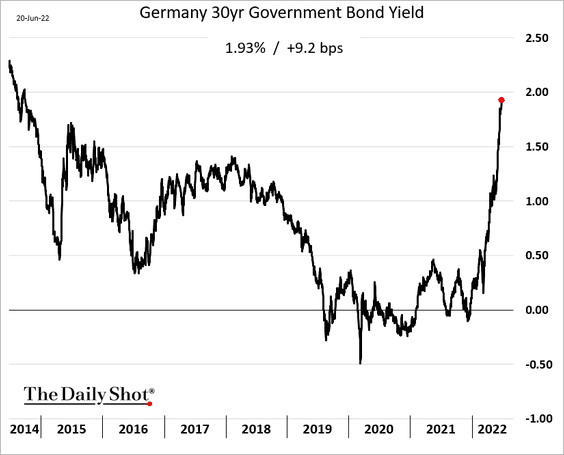
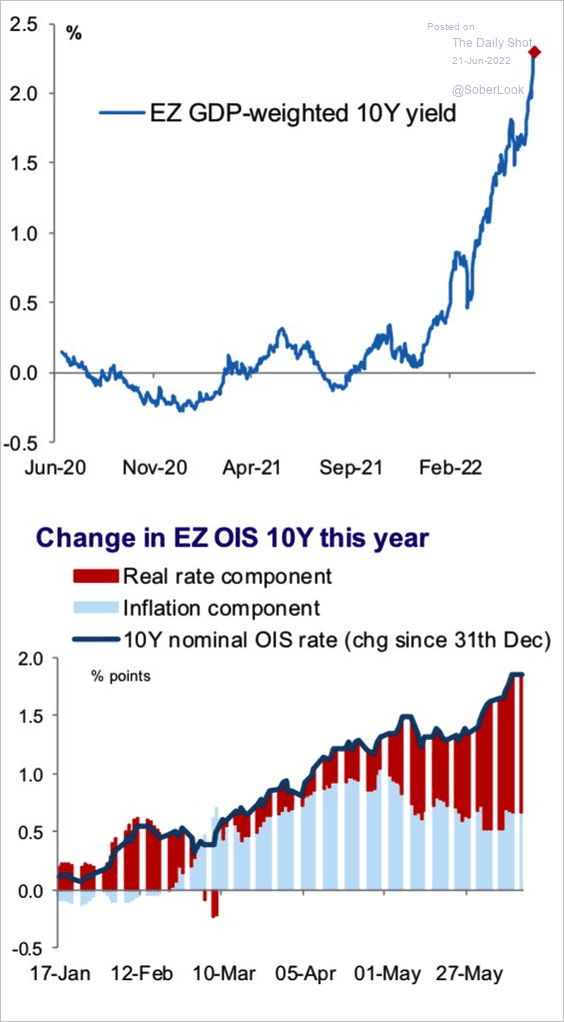
1. Bund yields are sharply lower as global recession risks climb.
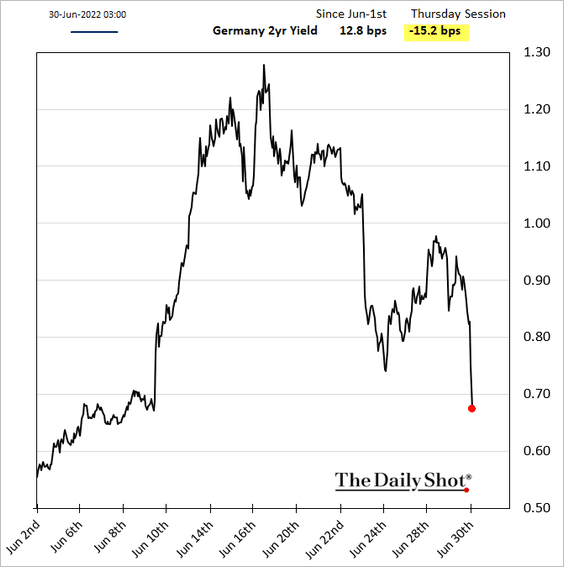
DAX is down as well amid risk-off sentiment.
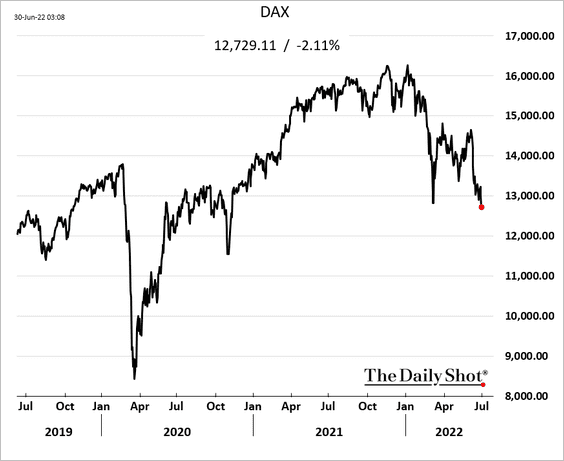
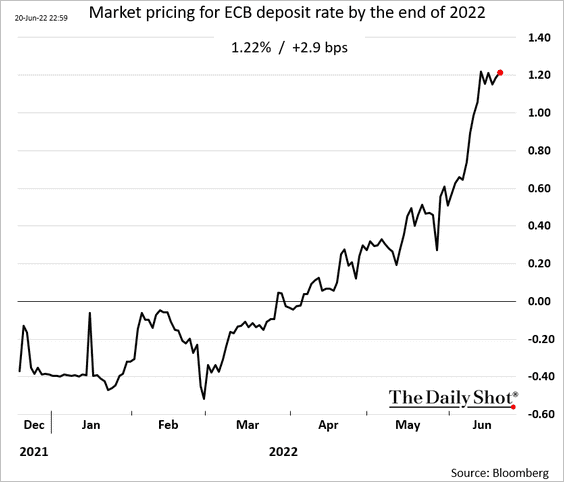
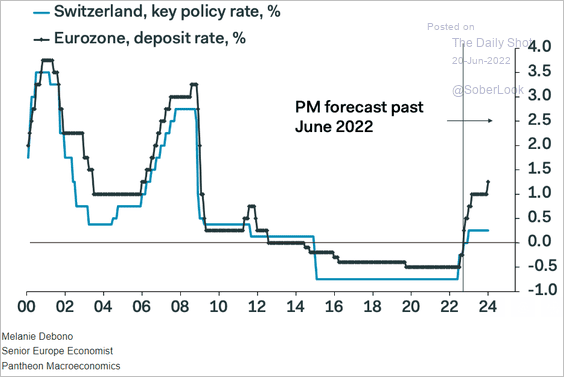
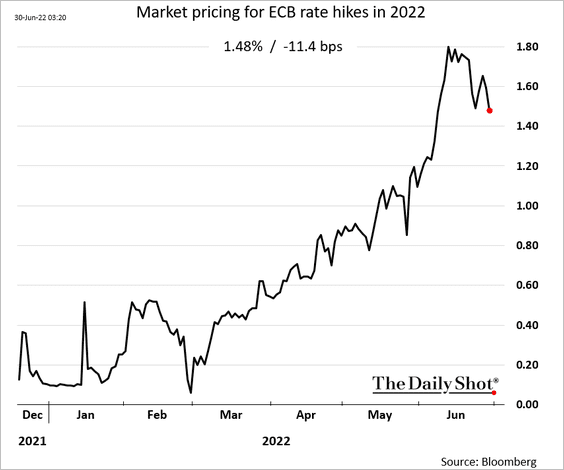
Market pricing for the ECB rate hikes this year has been moderating in recent days.
——————–
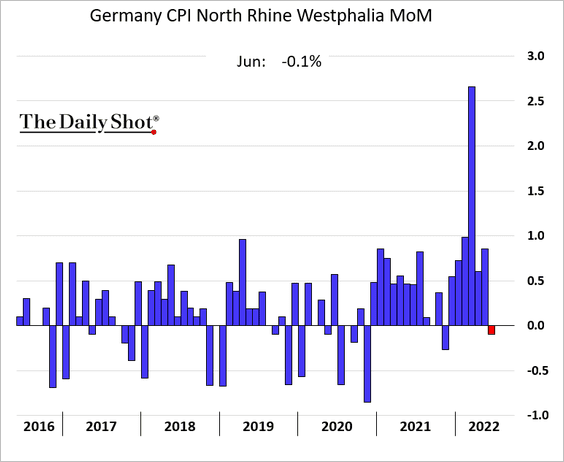
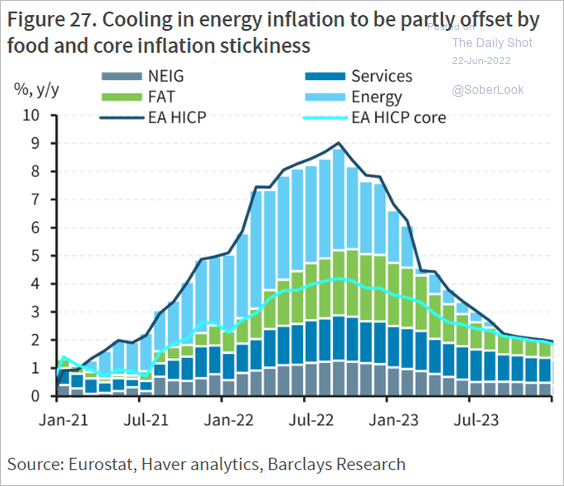
2. German inflation came in below forecasts.
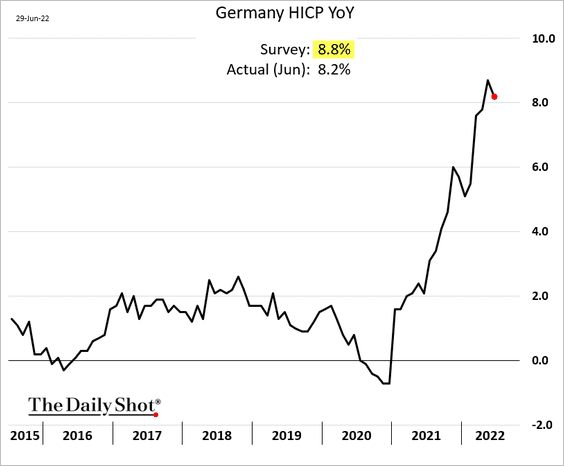
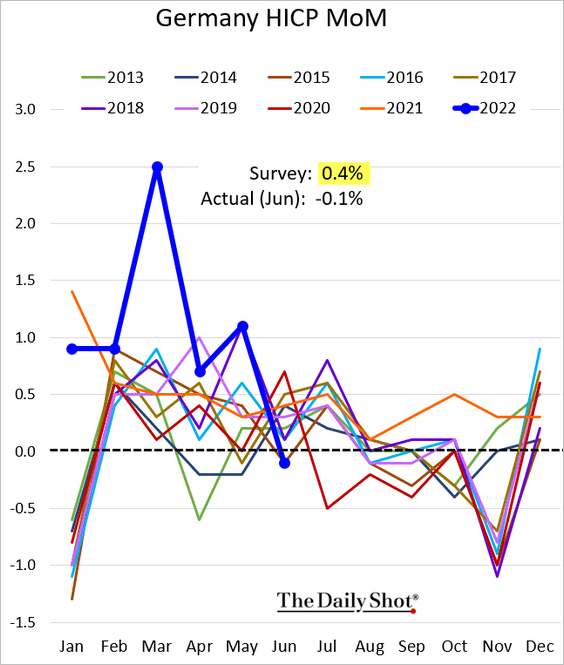
But this is no cause for celebration – the decline was due to temporary government relief measures.
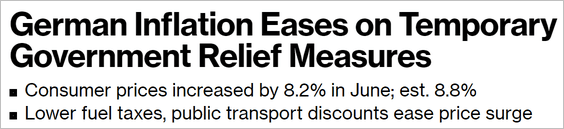 Source: Bloomberg Read full article
Pantheon Macroeconomics: – For some reason, the consensus failed to adequately factor-in two one-off inflation-depressing fiscal measures; the fuel duty cut and the introduction of discounted rail fare-the nine-euro ticket-weighing on both the headline and core.
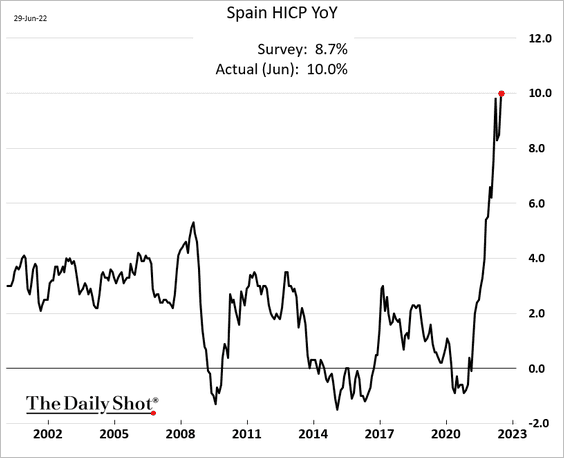
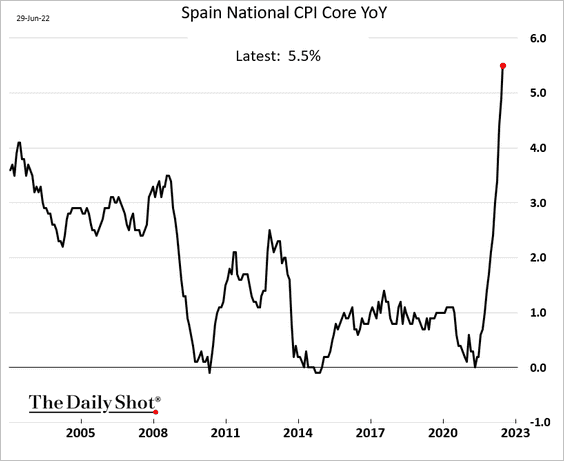
Spain’s inflation continues to surge, hitting 10% this month.
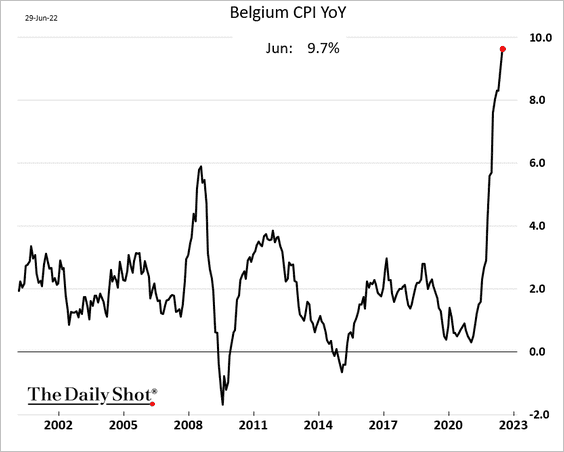
And here is the Belgian CPI.
——————–
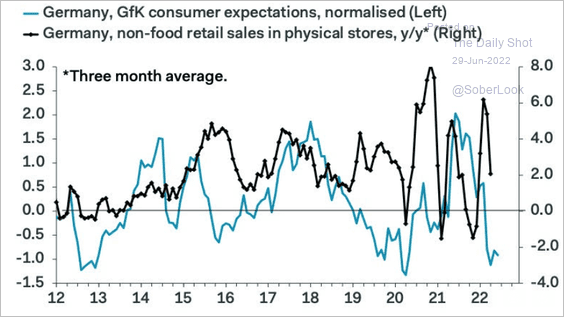
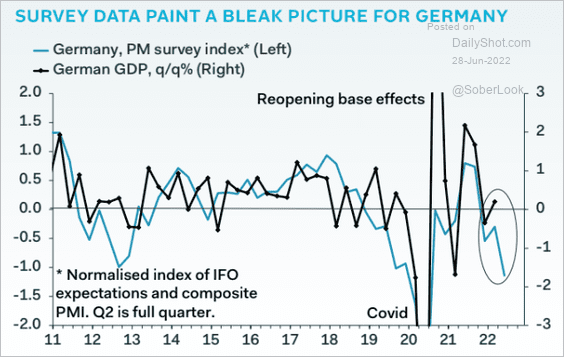
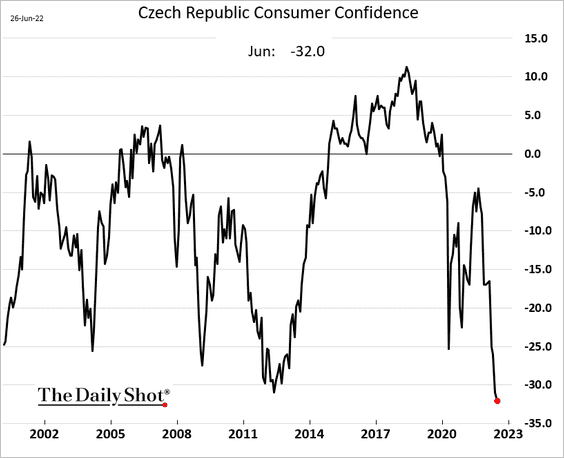
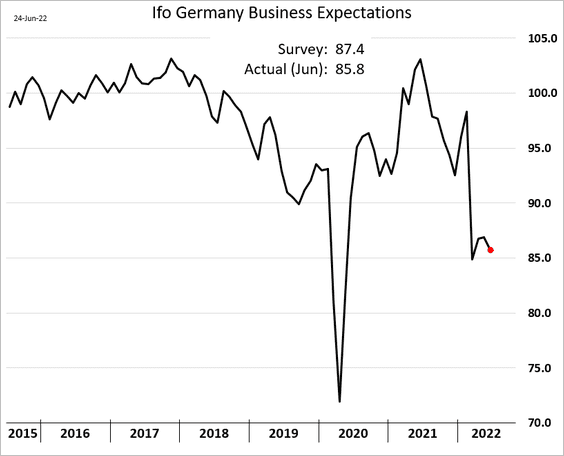
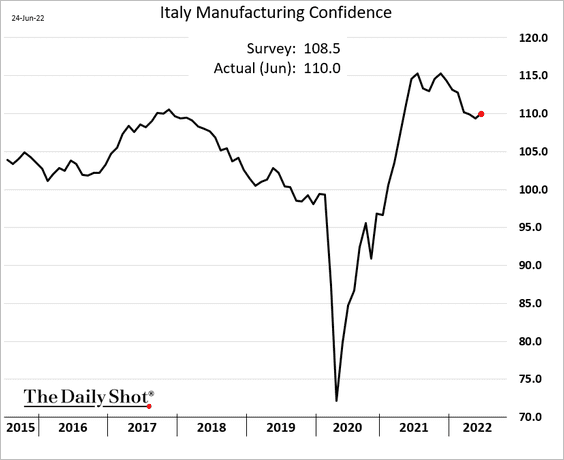
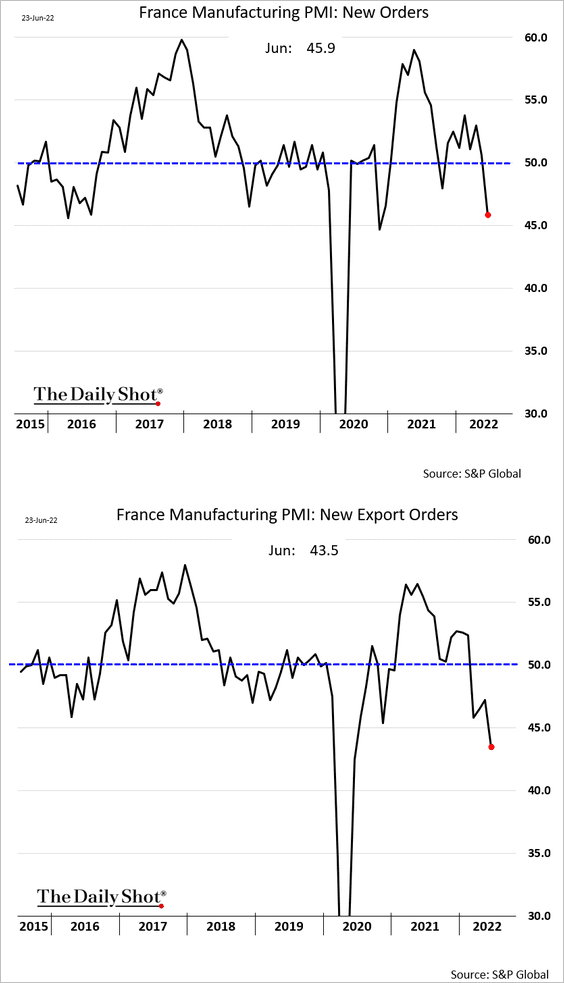
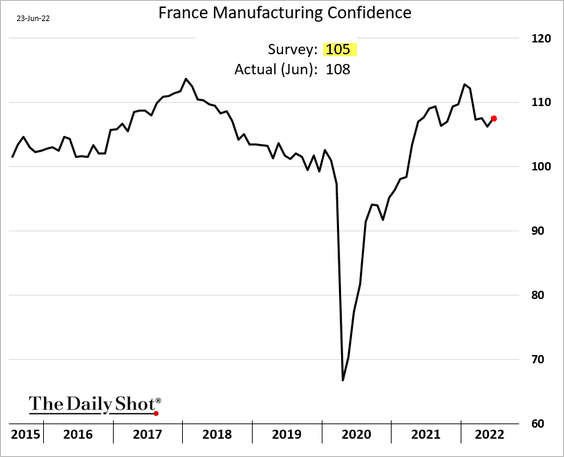
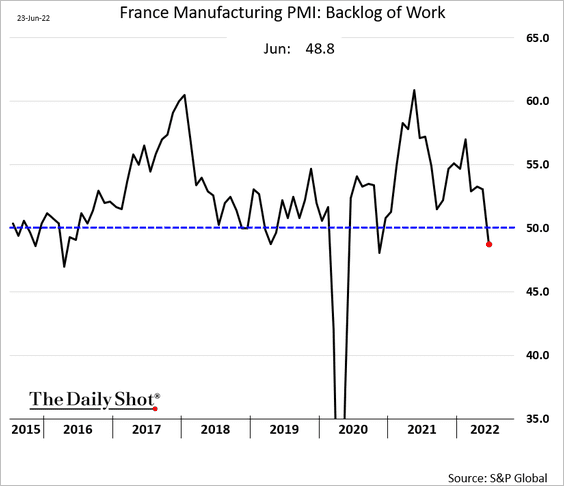
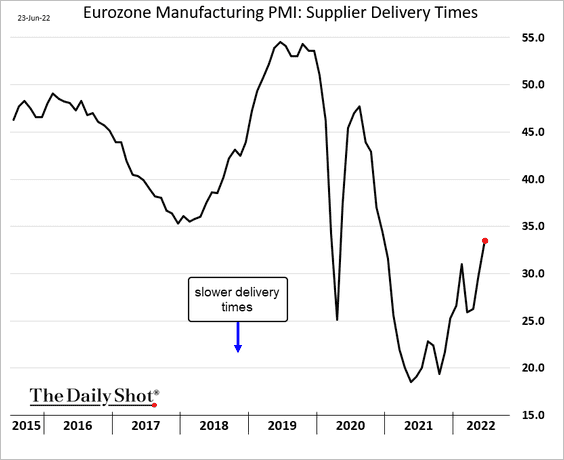
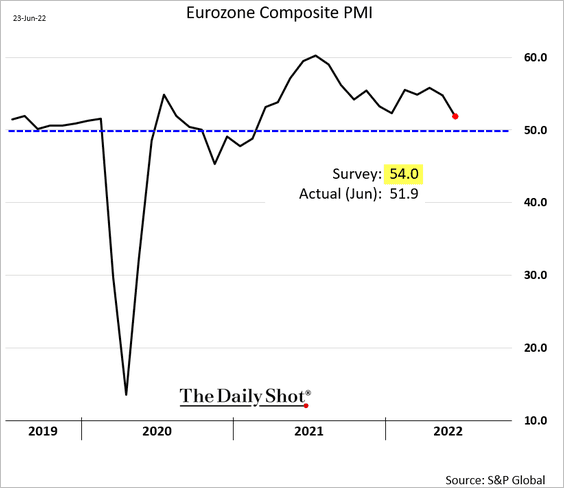
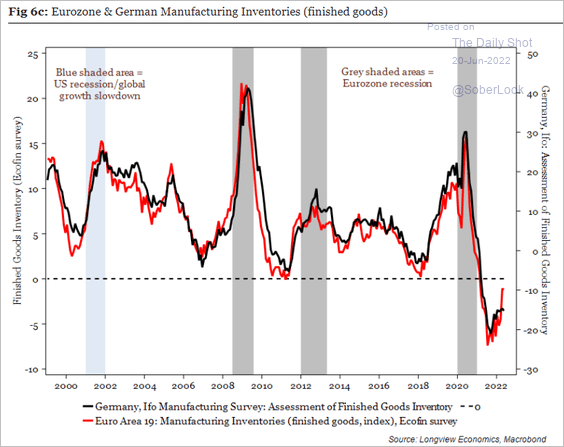
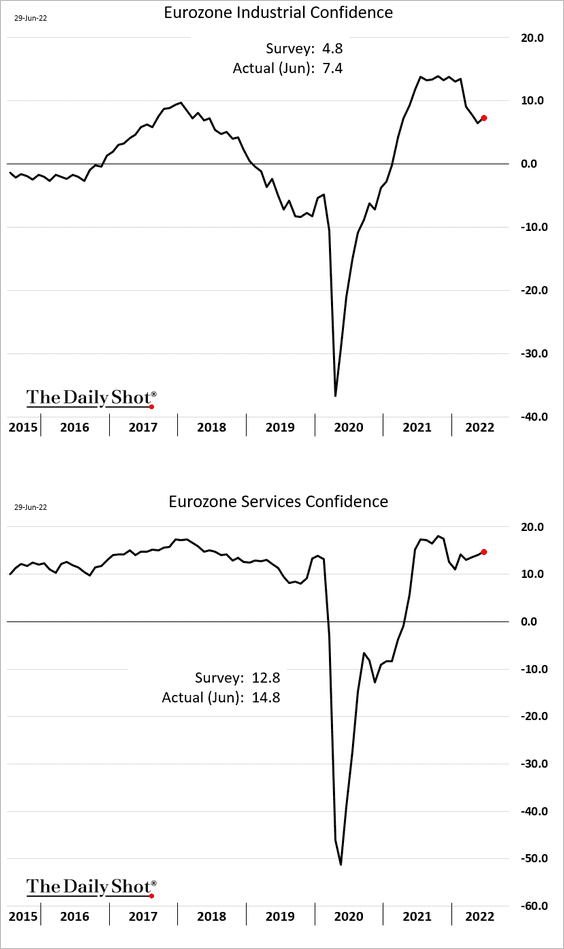
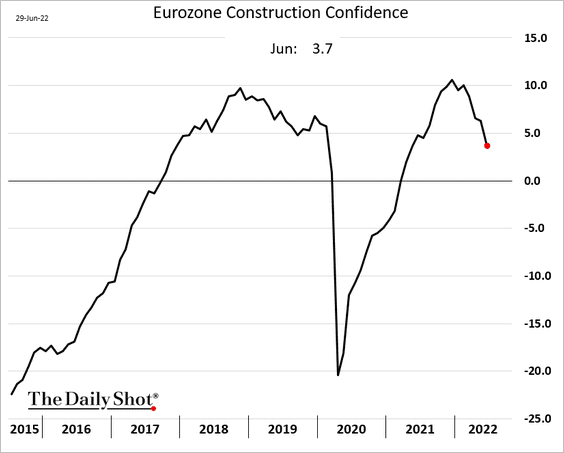
3. Generally, business confidence has been holding up well.
But construction sentiment is rolling over.
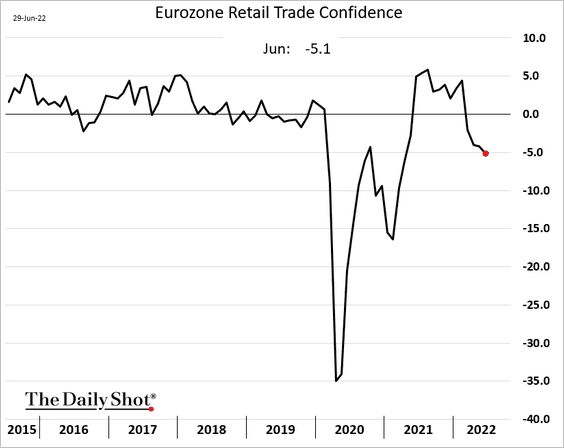
And retailers are reporting weaker conditions.
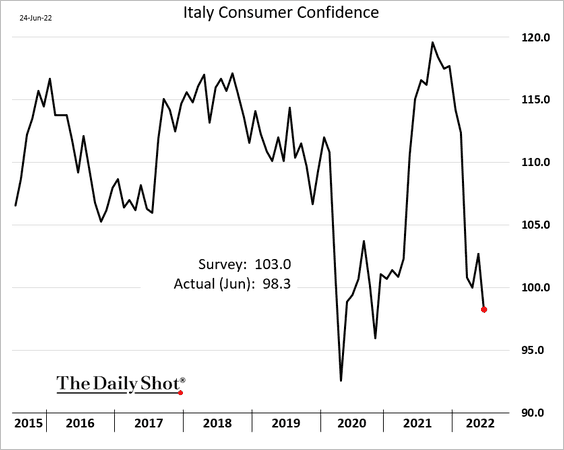
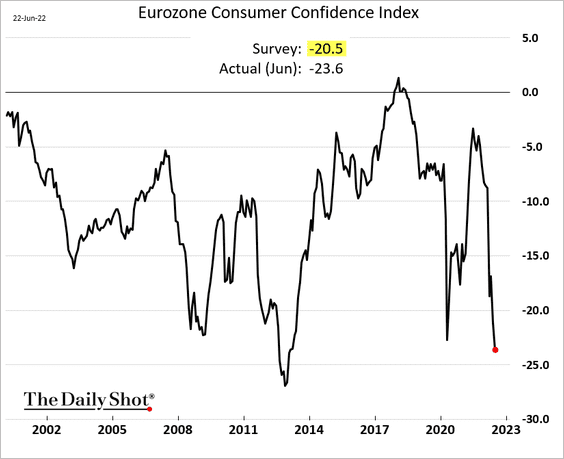
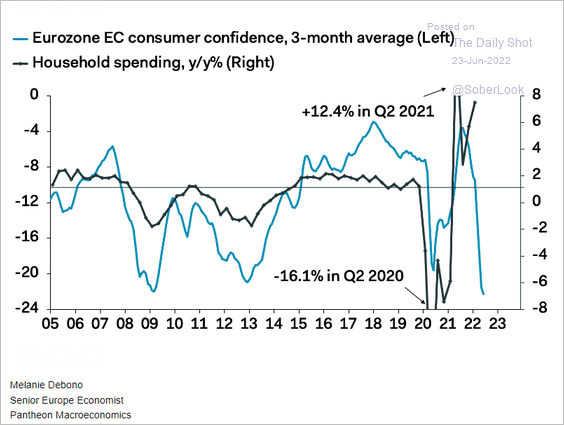
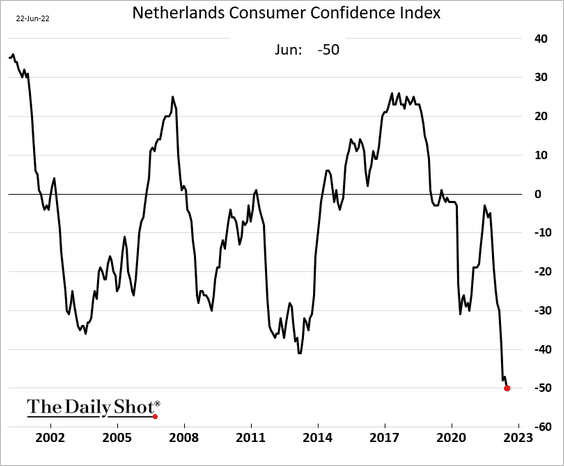
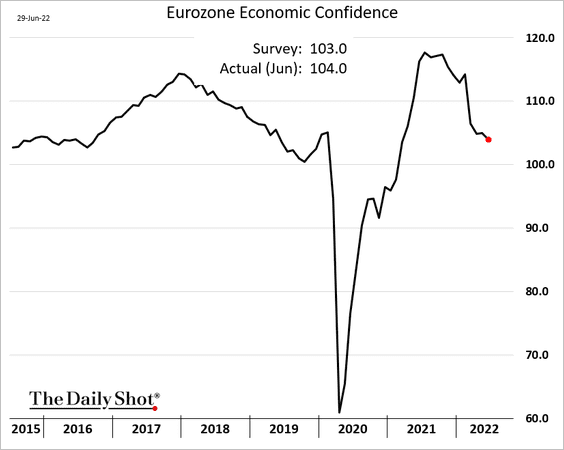
Below is the overall economic confidence, which includes consumer sentiment.
Back to Index
Europe
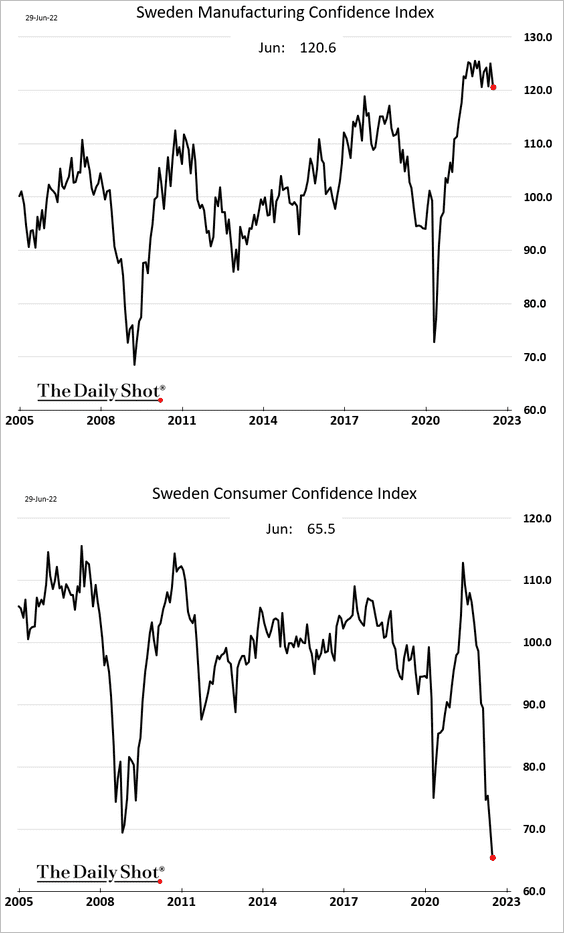
1. Let’s begin with Sweden.
• Confidence indicators:
• Household inflation expectations:
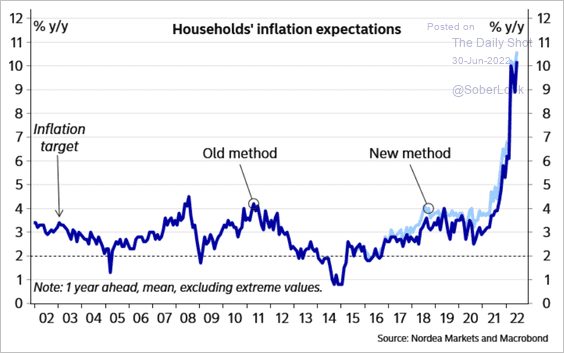 Source: Nordea Markets
• Retail sales (2 charts):
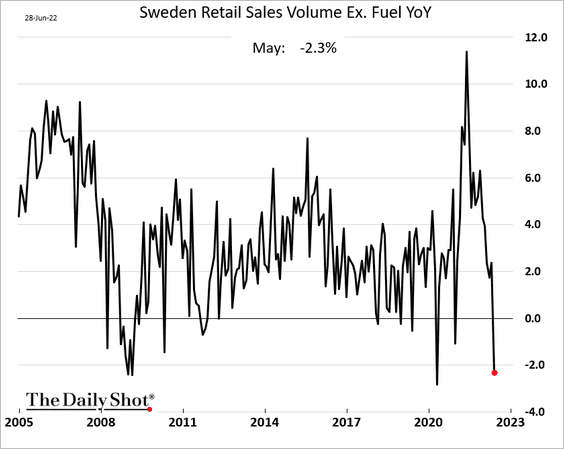
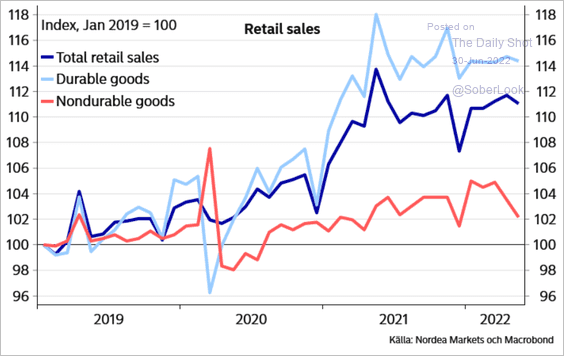 Source: Nordea Markets
——————–
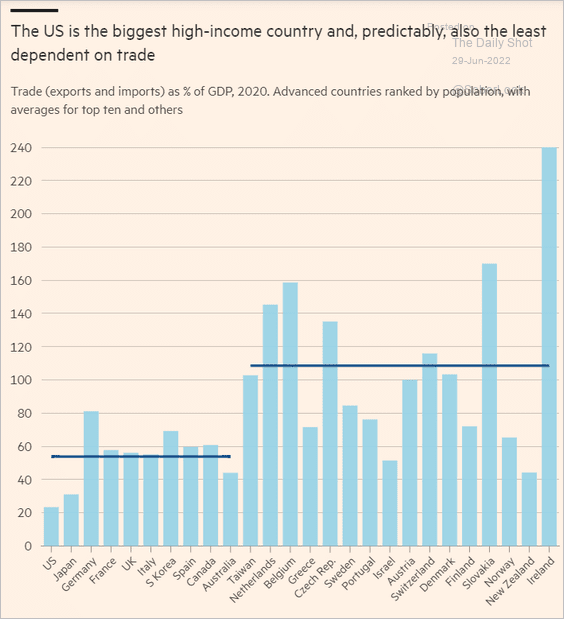
2. How important is tourism for EU economies?
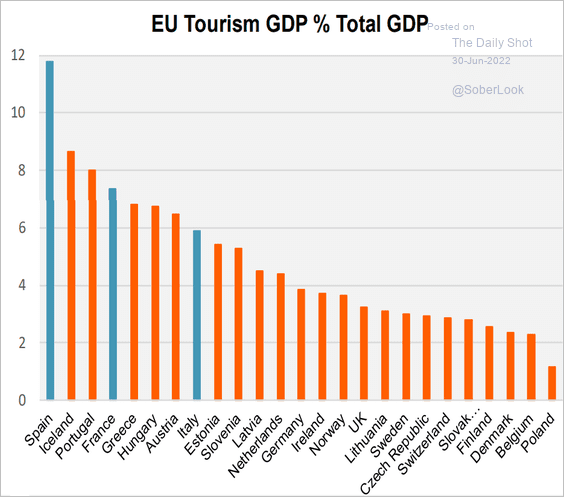 Source: Piper Sandler
Back to Index
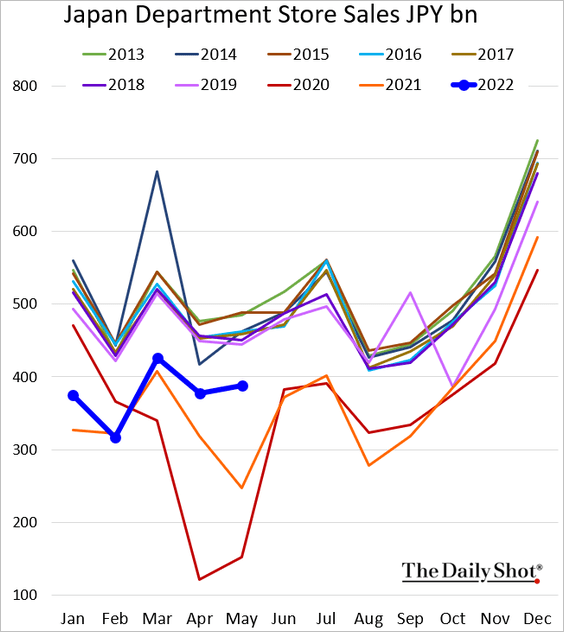
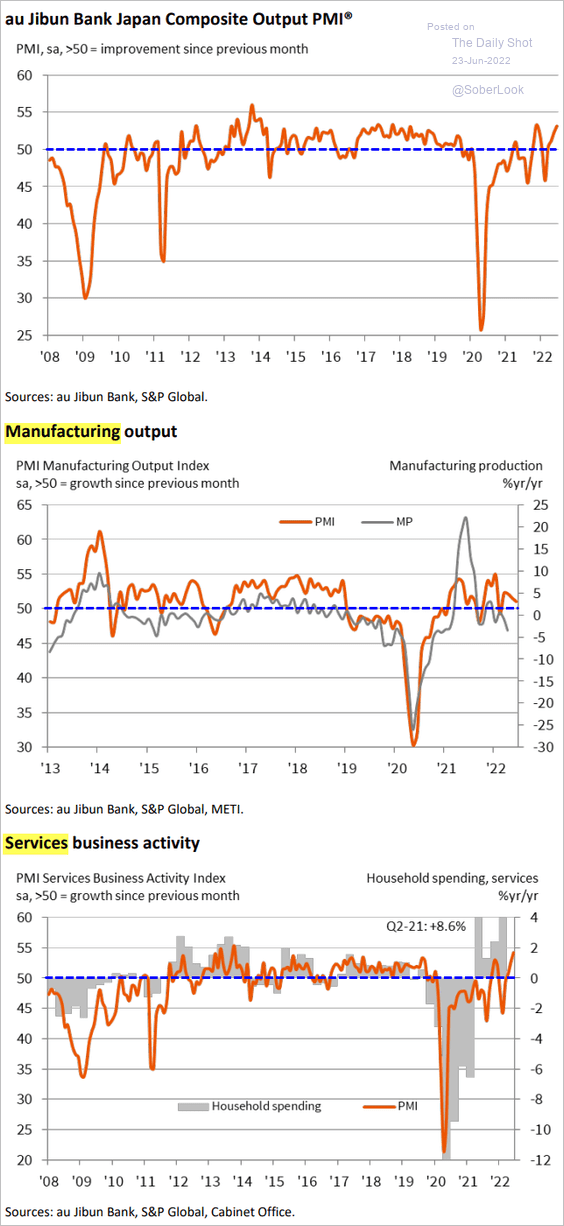
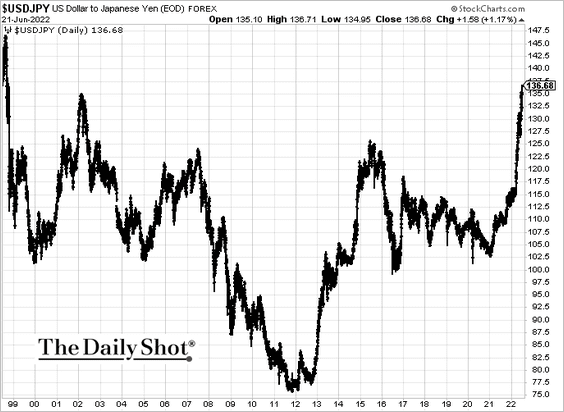
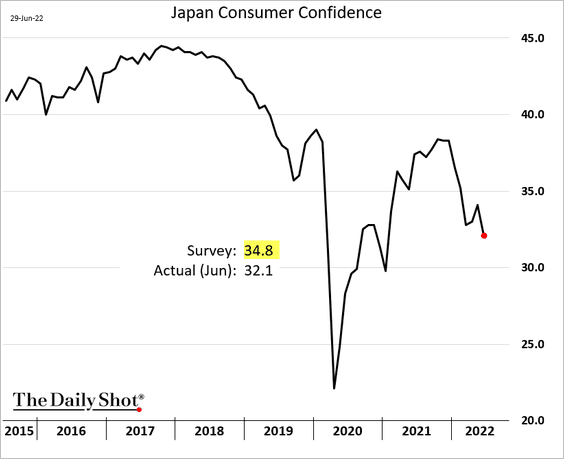
Japan
1. Consumer confidence continues to weaken.
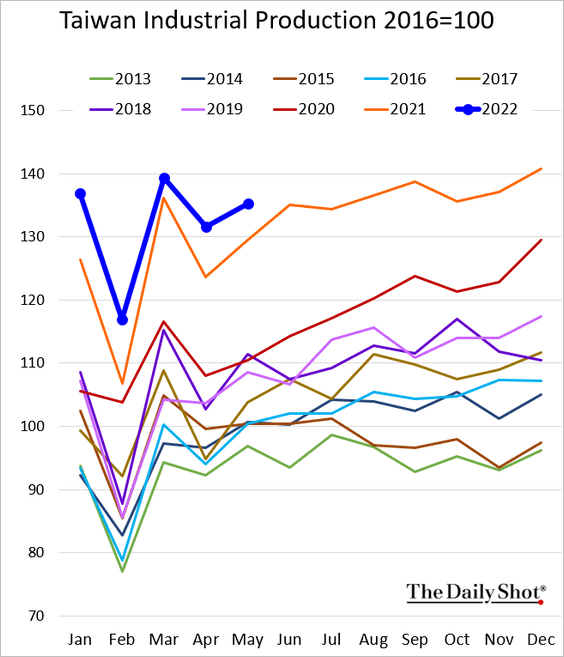
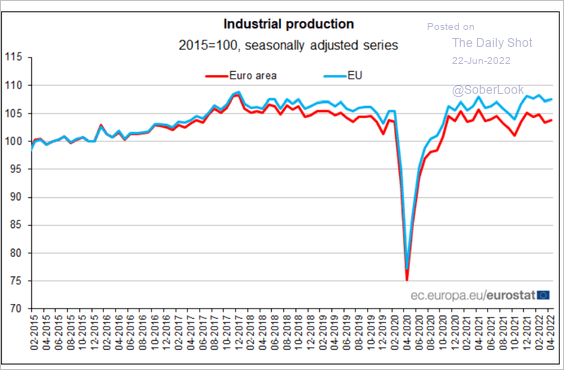
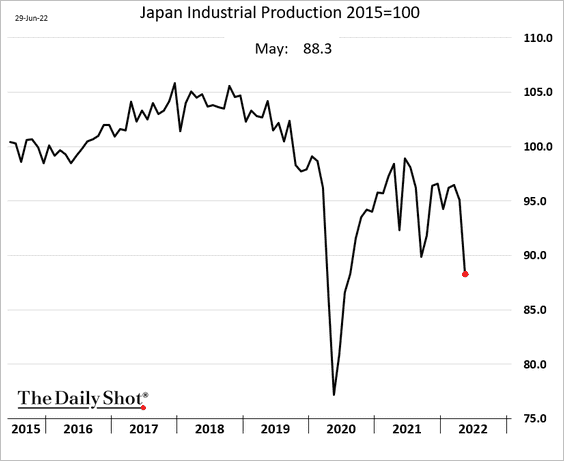
2. Industrial production tanked in May due to China’s lockdowns.
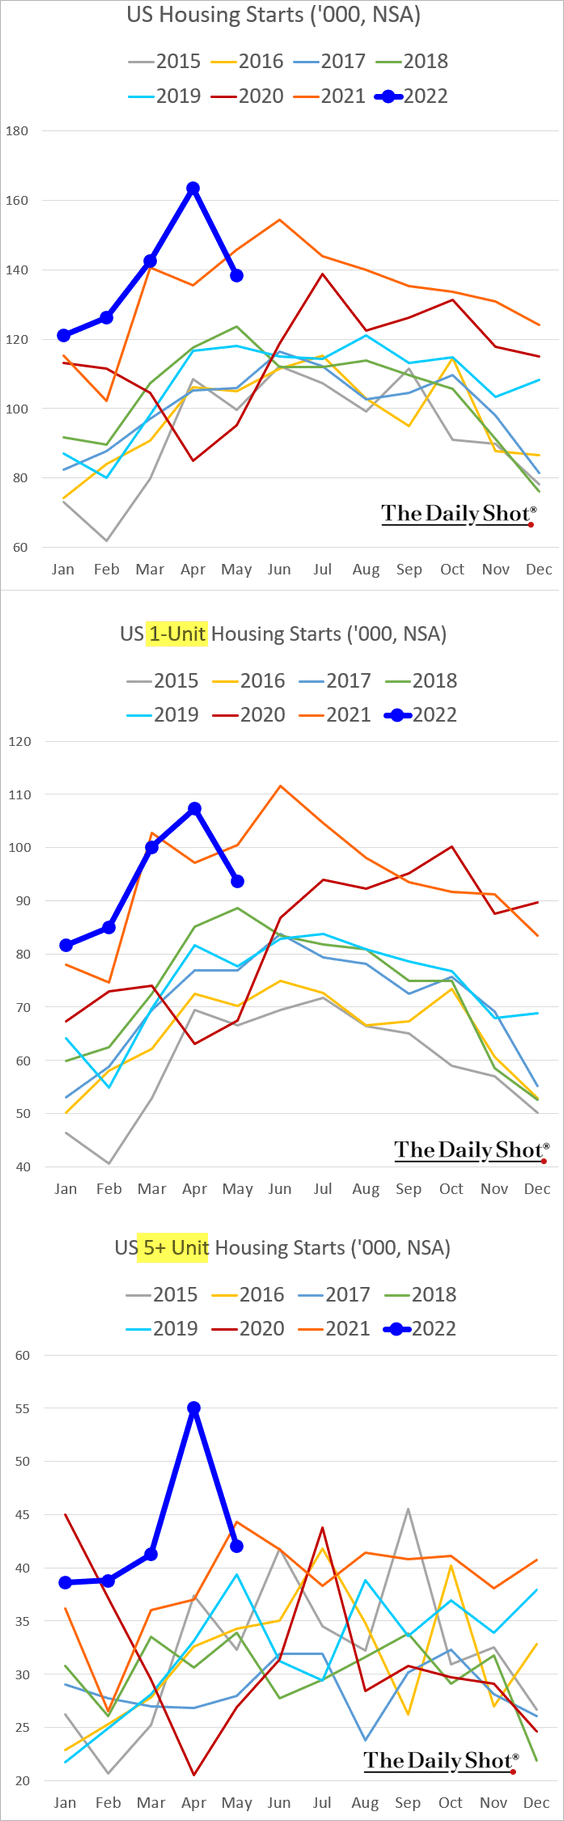
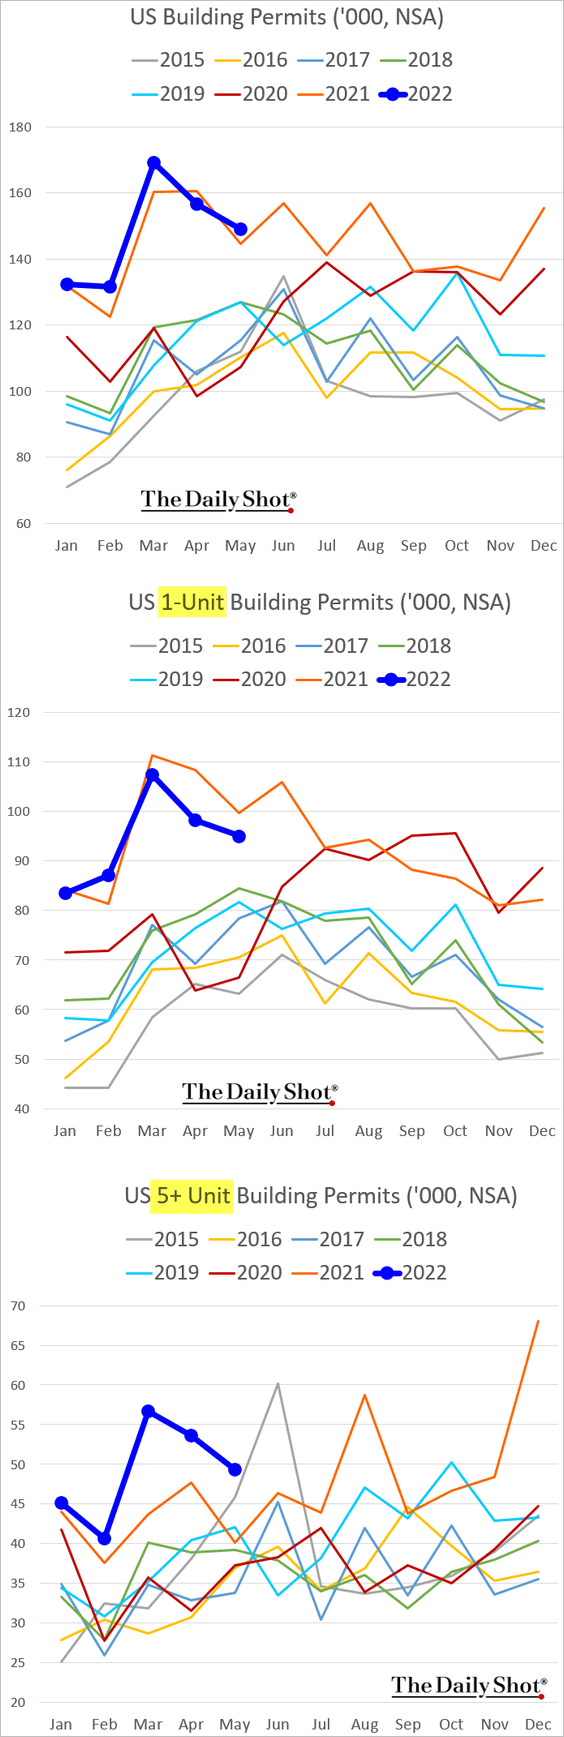
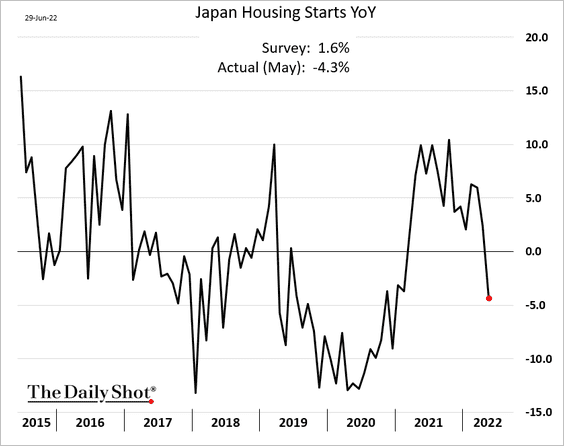
3. Housing starts surprised to the downside.
Back to Index
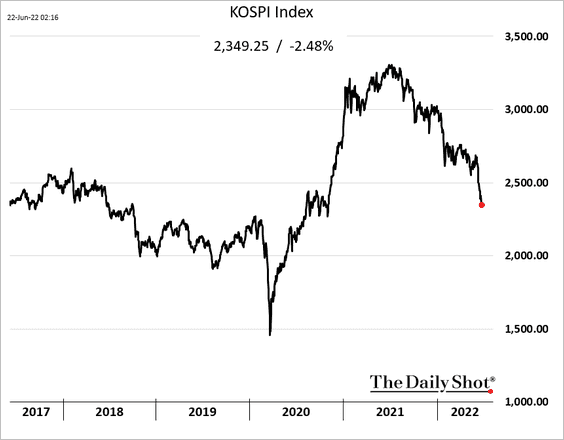
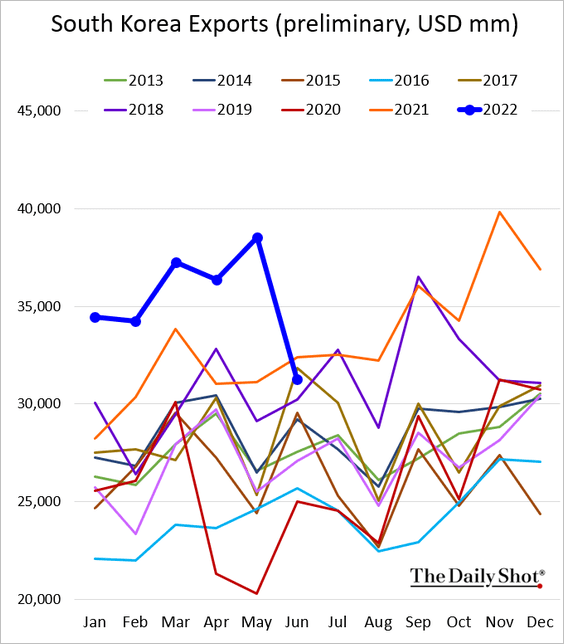
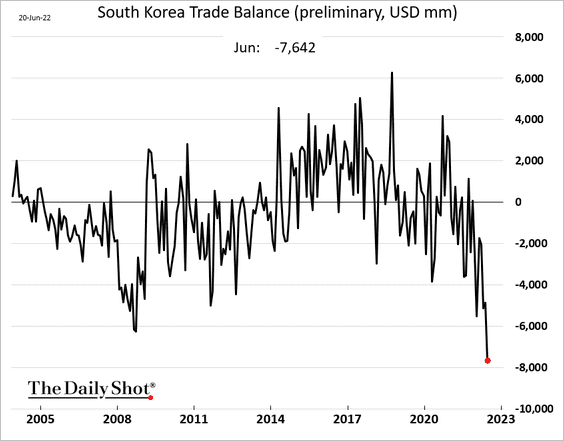
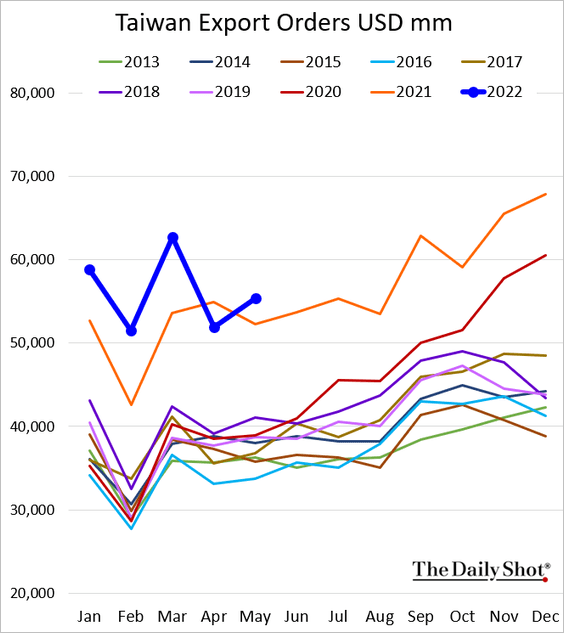
Asia – Pacific
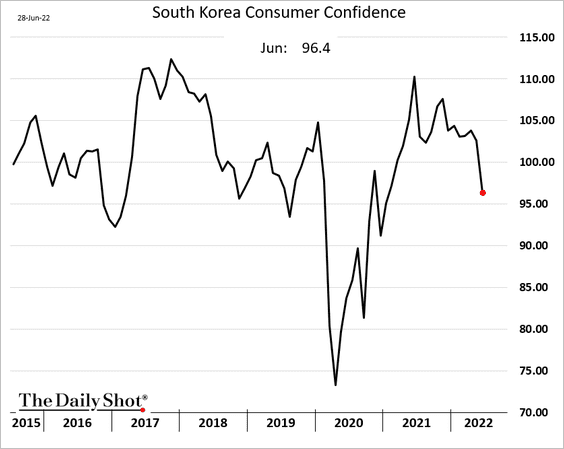
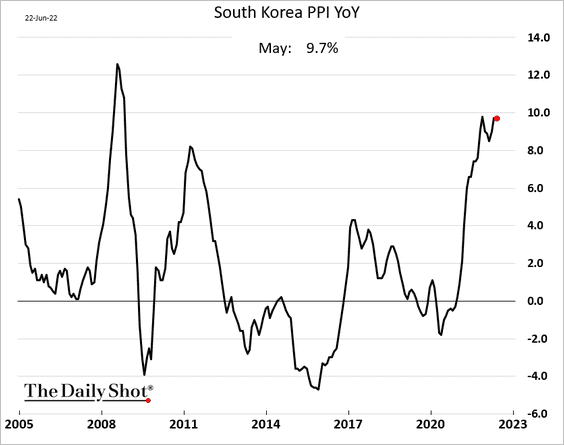
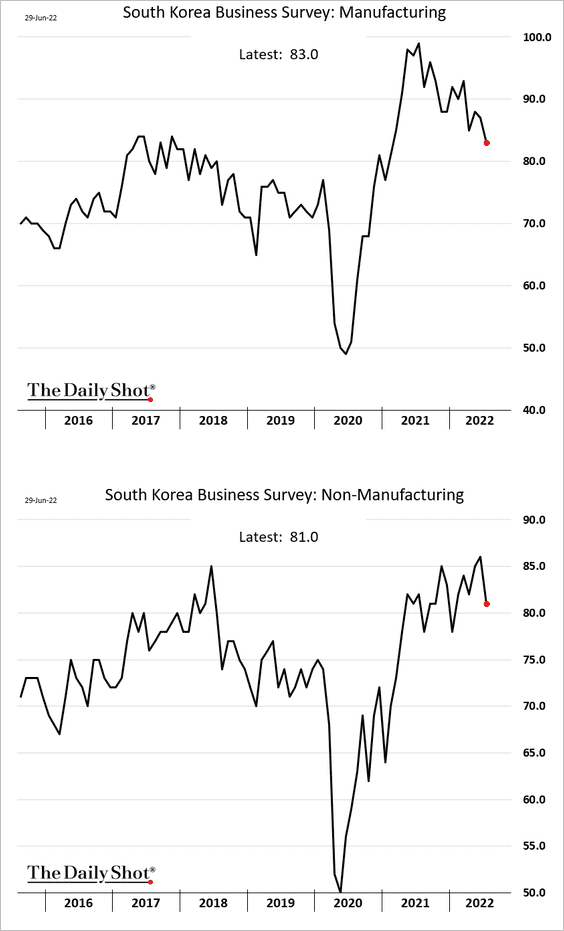
1. South Korea’s business surveys are softer this month.
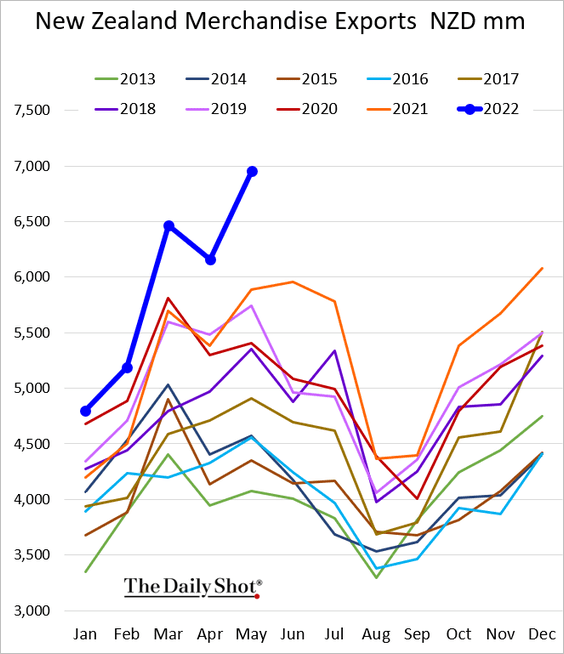
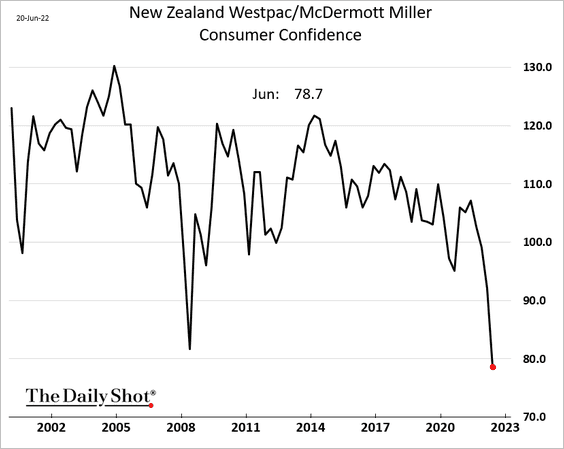
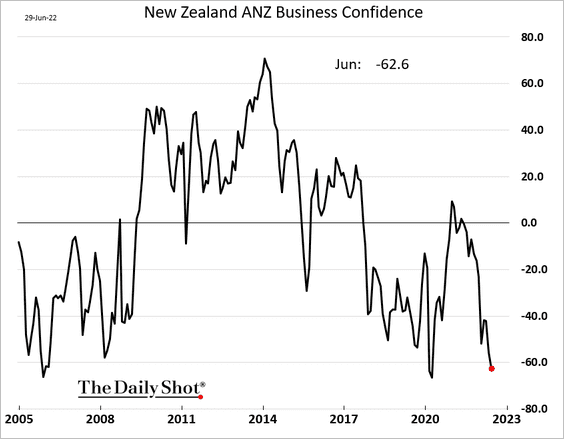
2. New Zealand’s business confidence continues to deteriorate.
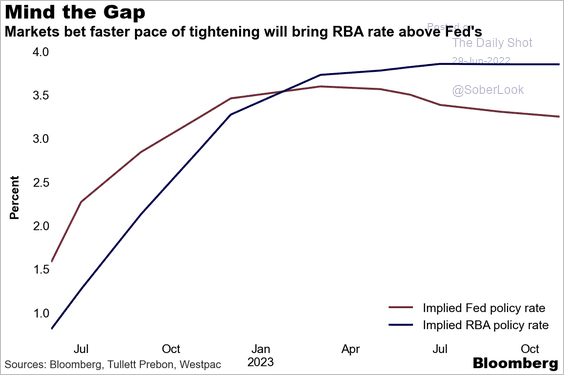
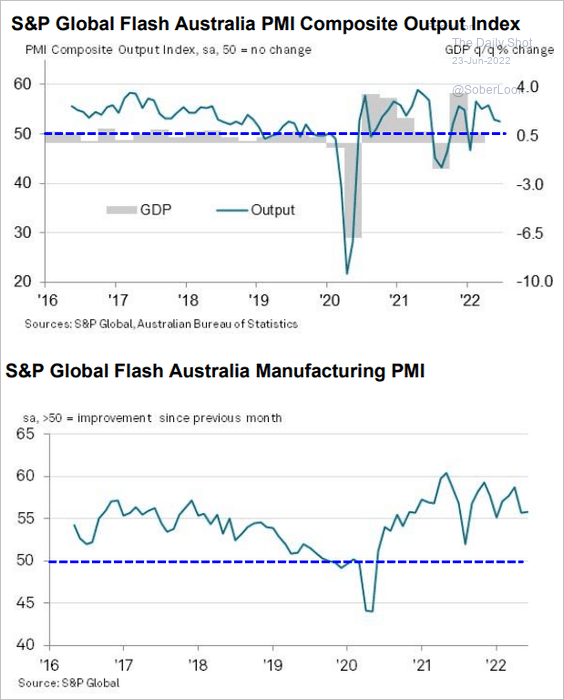
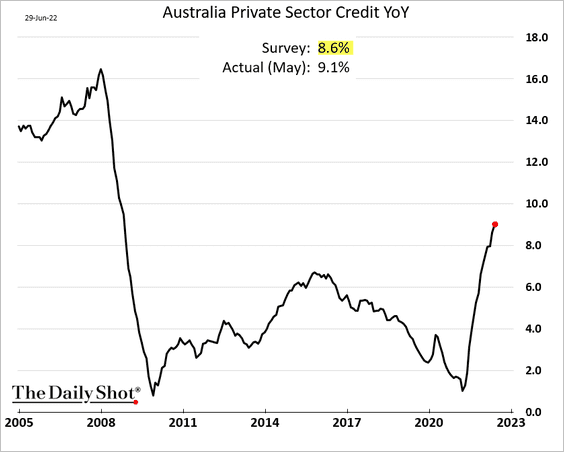
3. Australia’s credit growth surprised to the upside.
Back to Index
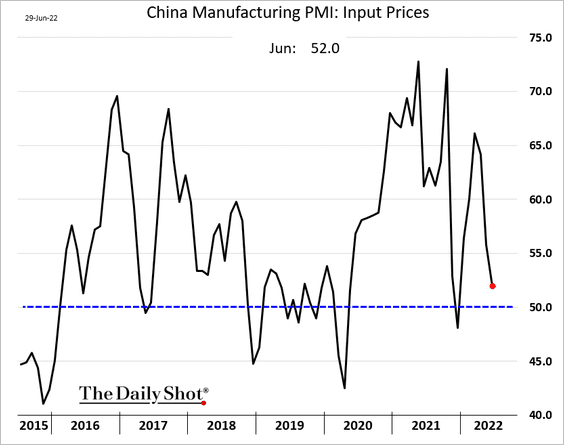
China
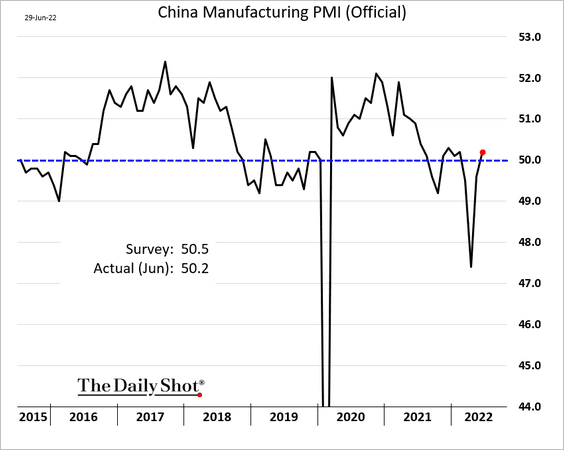
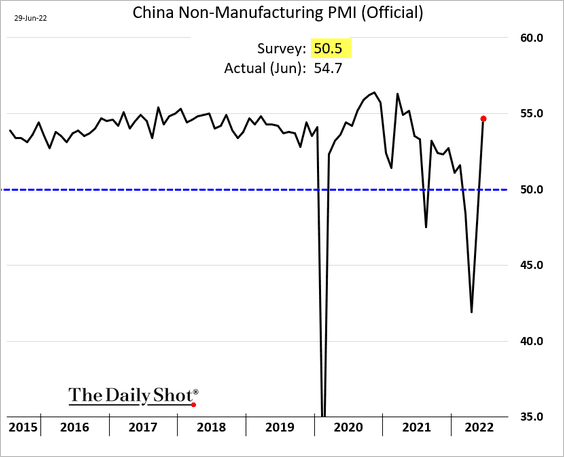
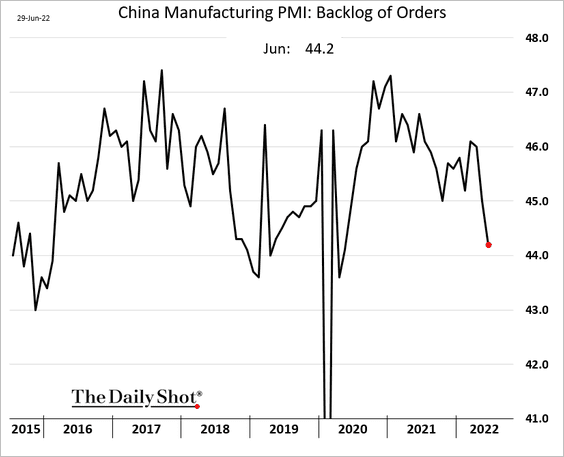
1. The official PMI report showed business returning to growth.
• Manufacturing:
• Non-manufacturing:
Factory input price gains are slowing, …
… and order backlogs are easing.
——————–
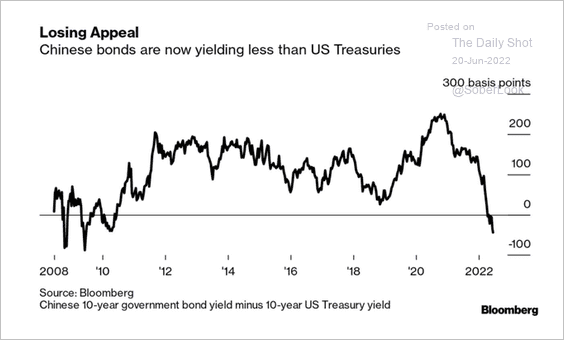
2. Diverging monetary policy paths resulted in China’s bonds sharply outperforming Treasuries.
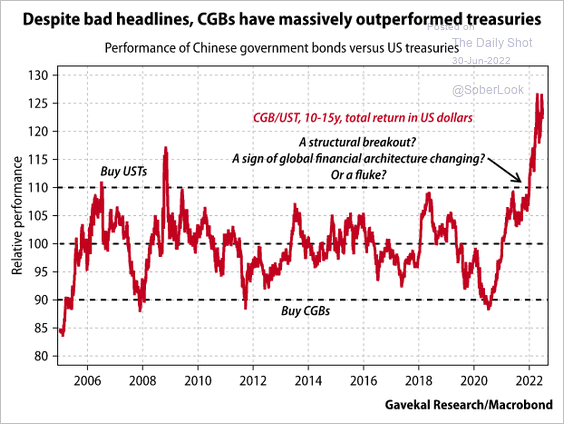 Source: Gavekal Research
3. Urban unemployment remains elevated.
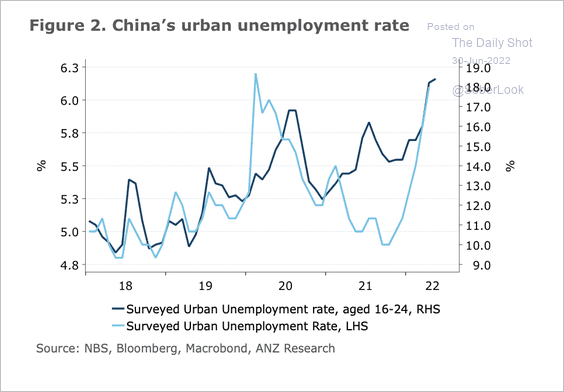 Source: @ANZ_Research
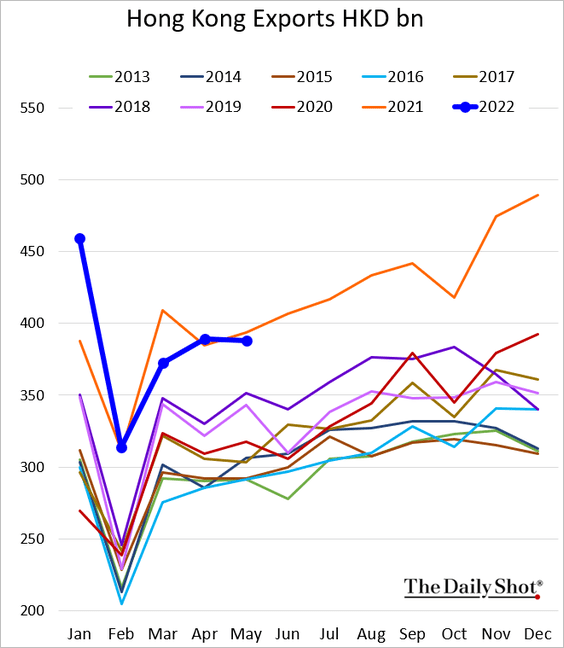
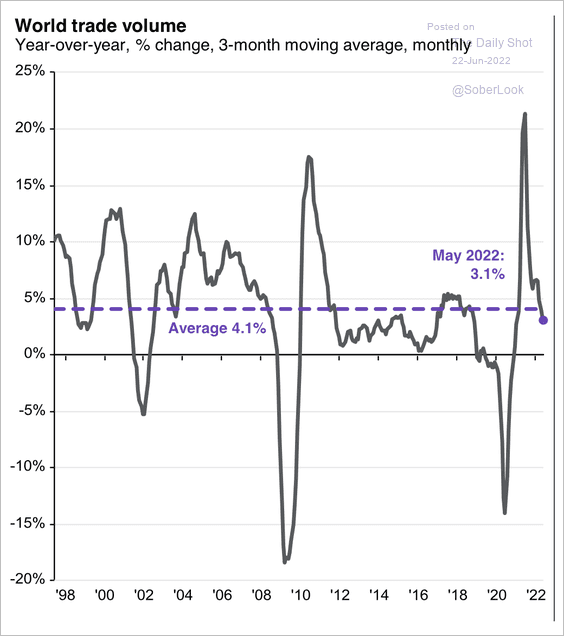
4. China’s foreign trade growth in high-tech products has been slowing.
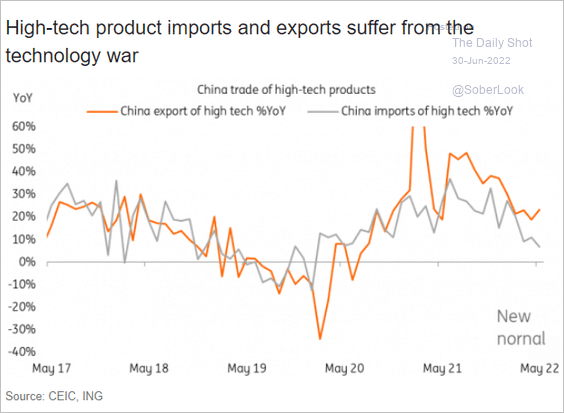 Source: ING
Back to Index
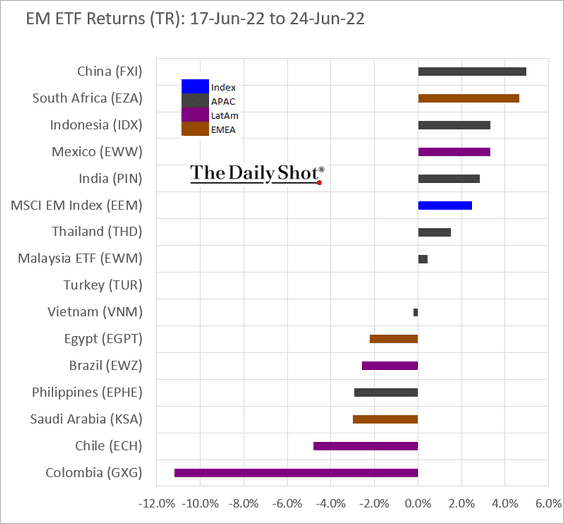
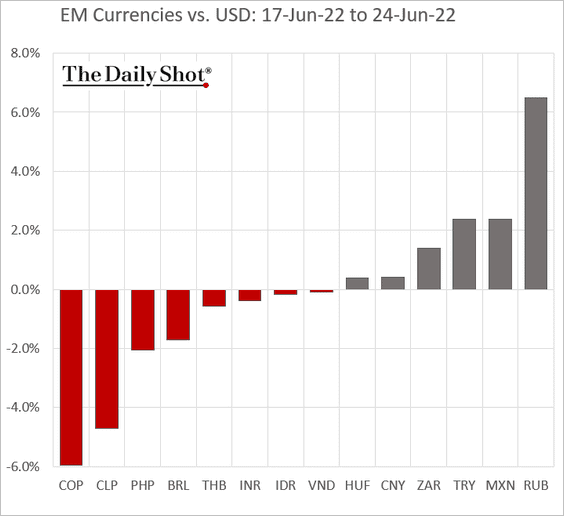
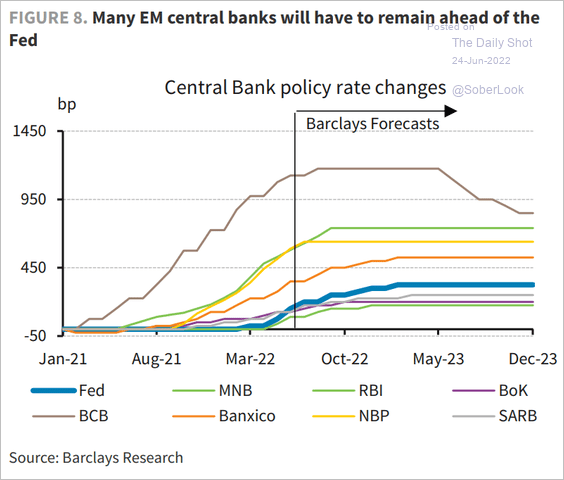
Emerging Markets
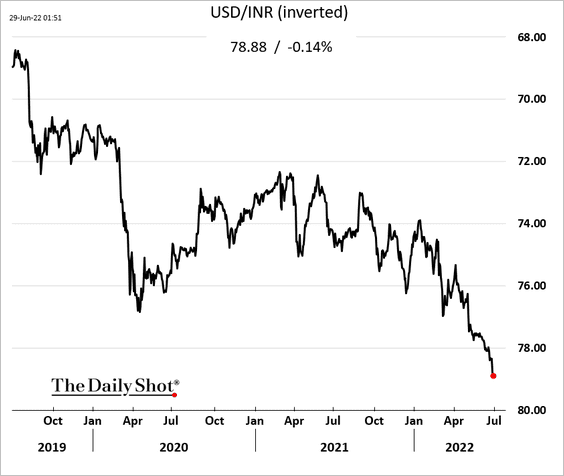
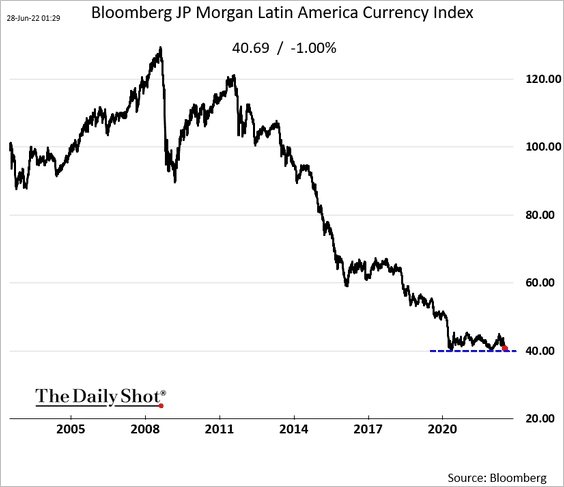
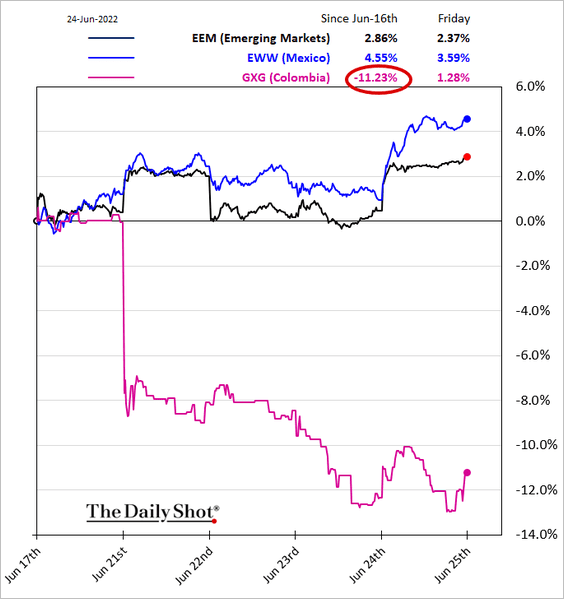
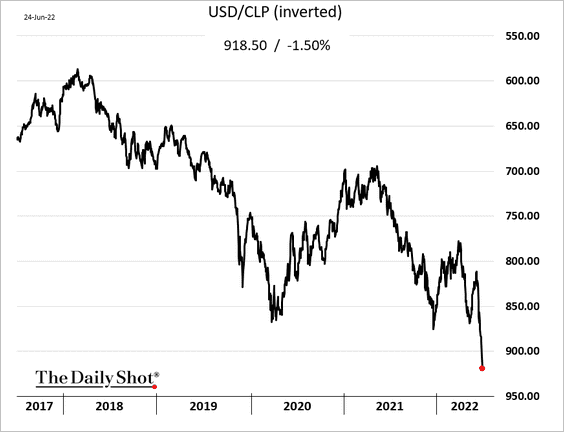
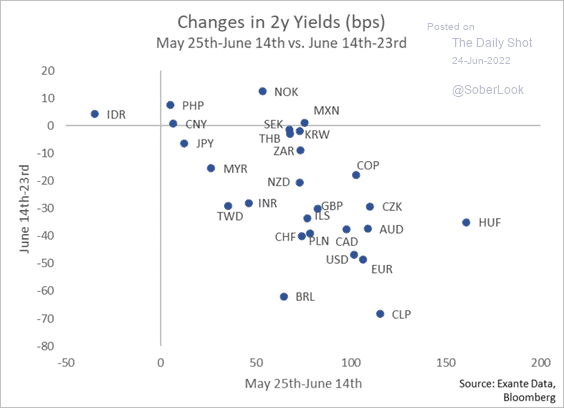
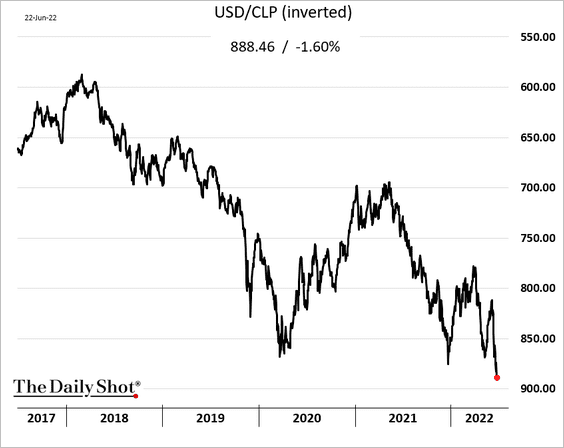
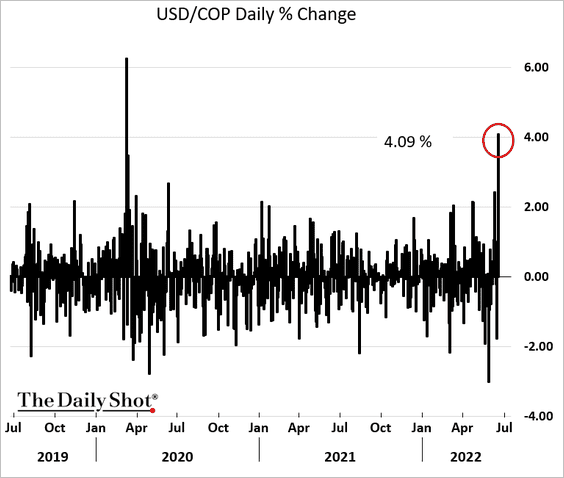
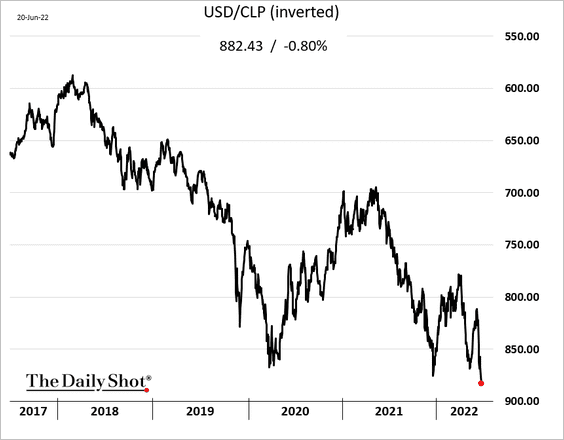
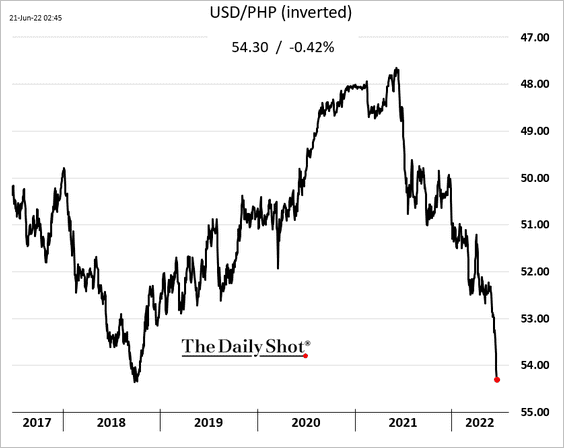
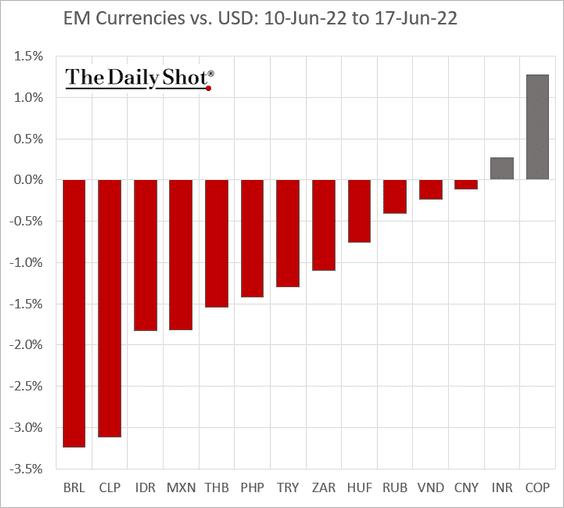
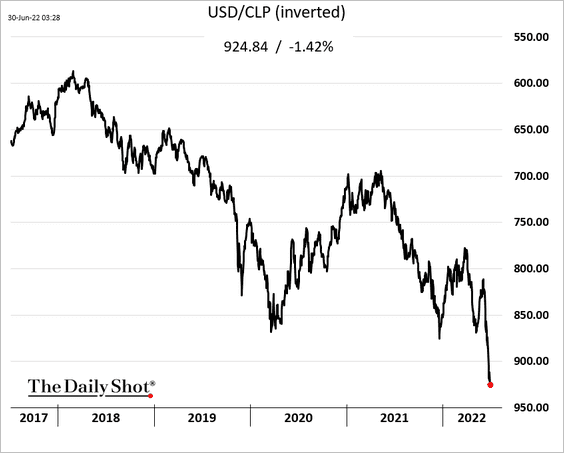
1. The Chilean peso continues to sink.
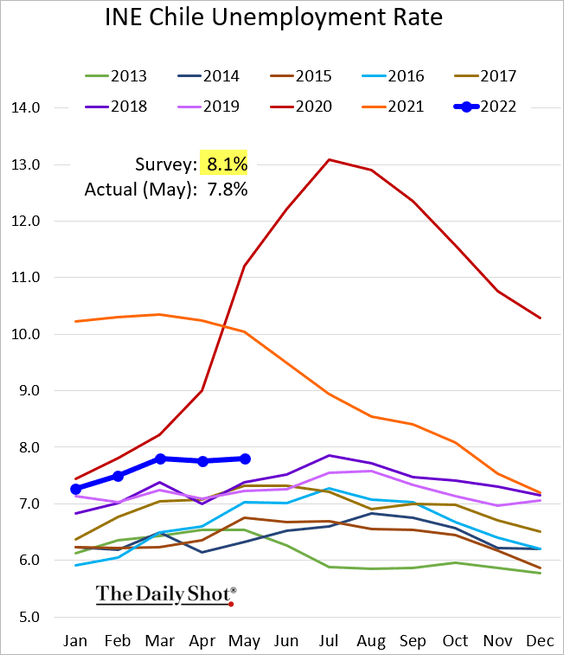
Chile’s unemployment rate was lower than expected in May.
——————–
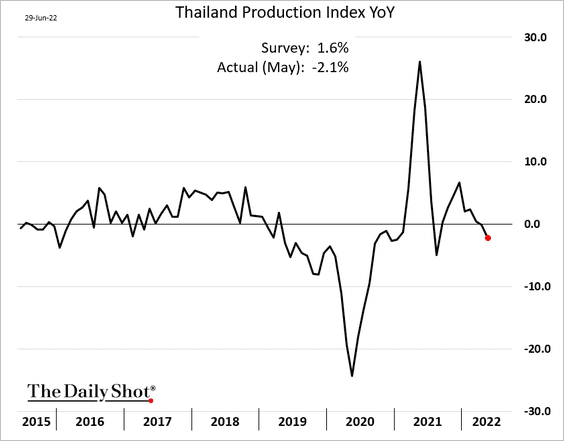
2. Thai manufacturing production declined on supply shortages due to China’s lockdown.
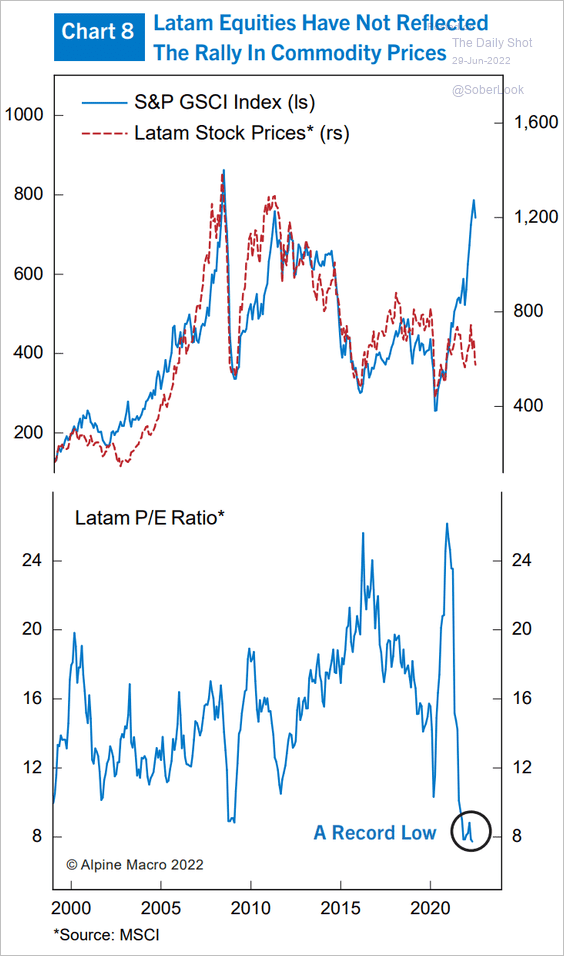
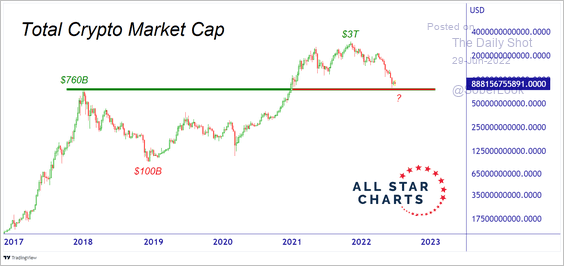
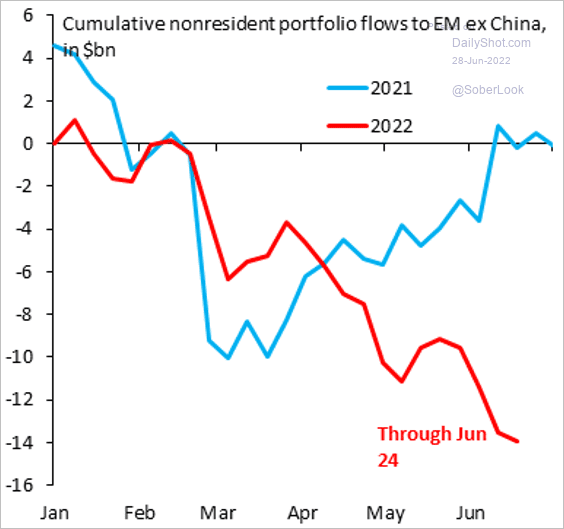
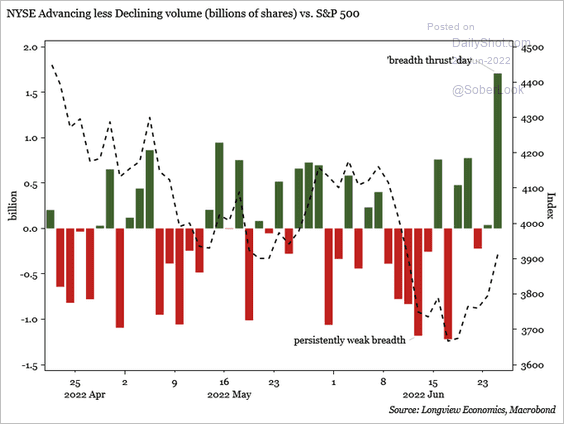
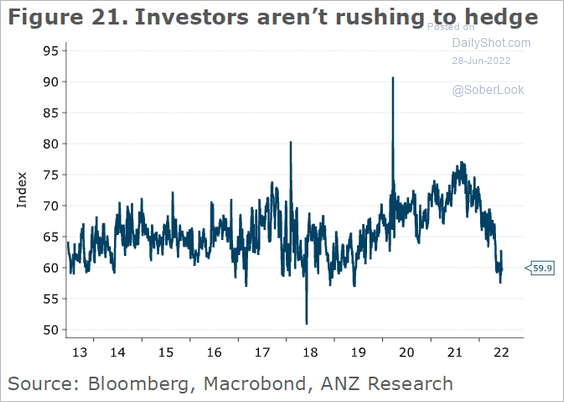
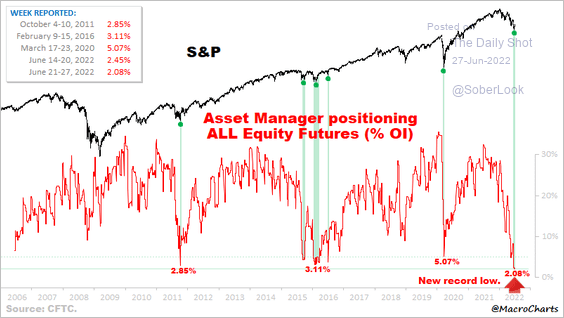
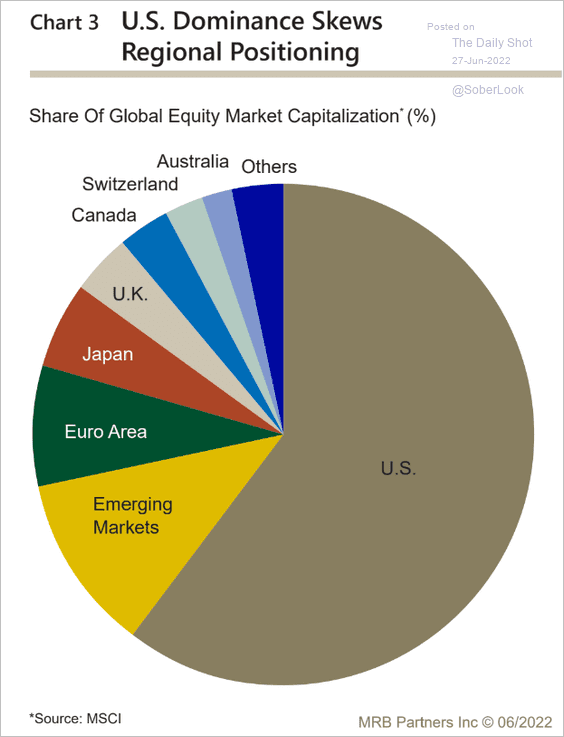
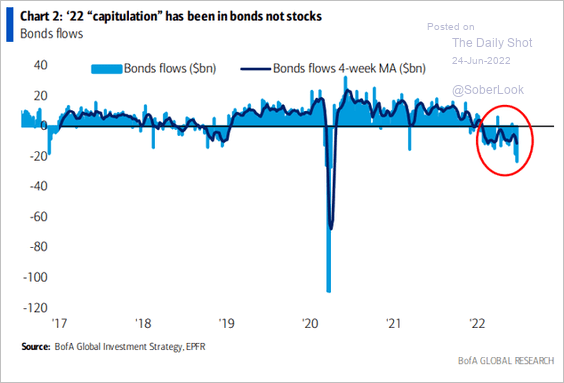
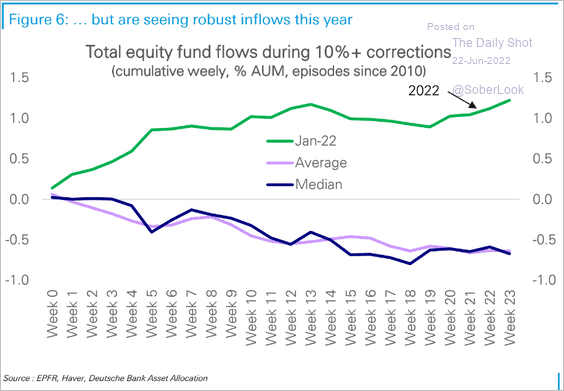
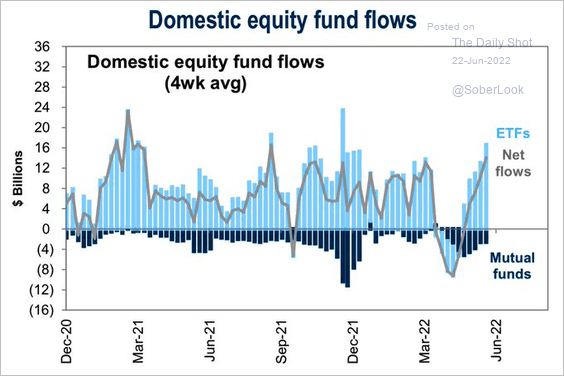
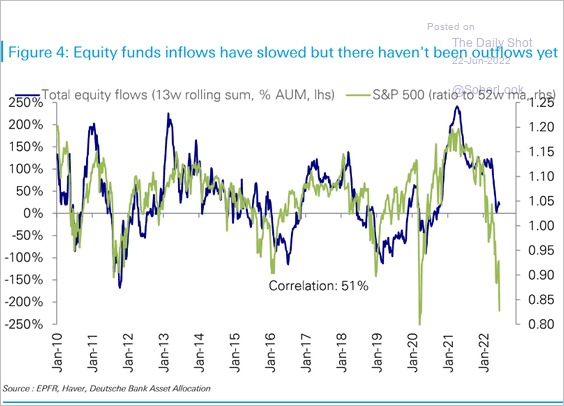
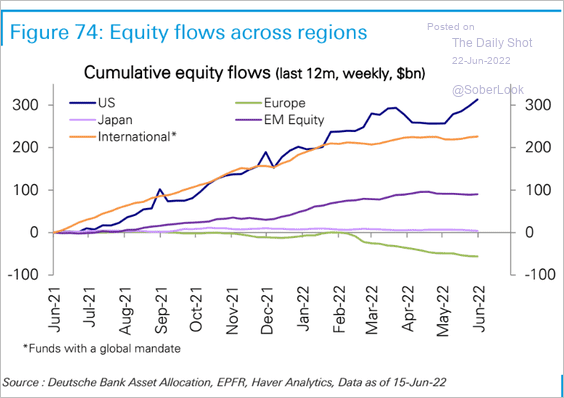
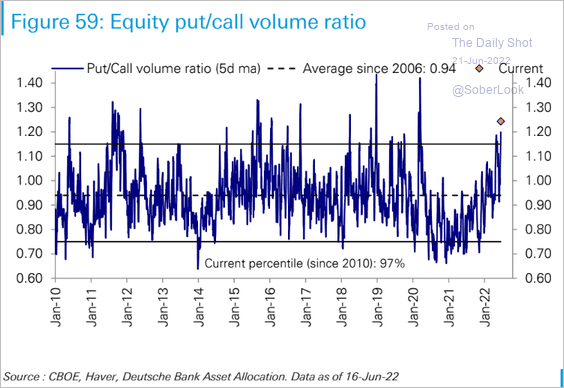
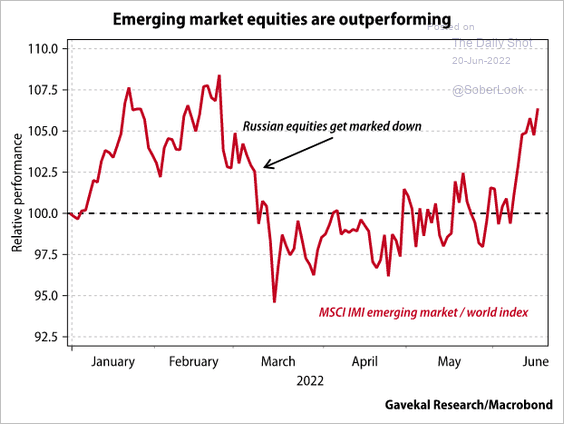
3. No equity market capitation yet?
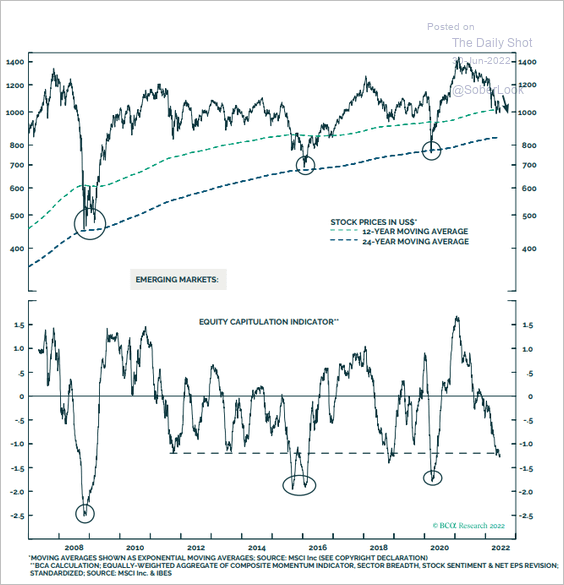 Source: BCA Research
Back to Index
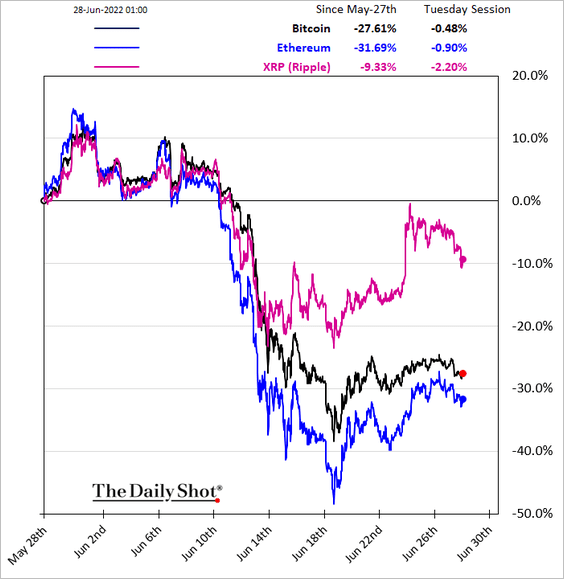
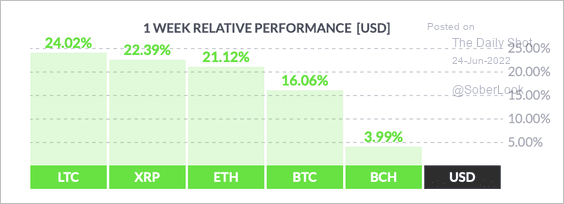
Cryptocurrency
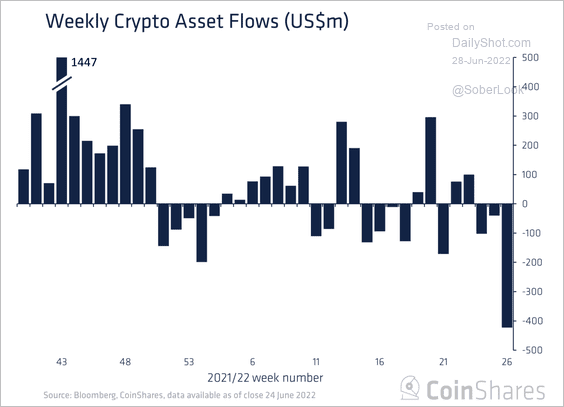
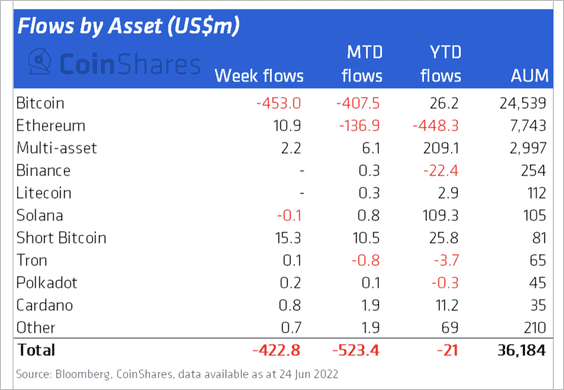
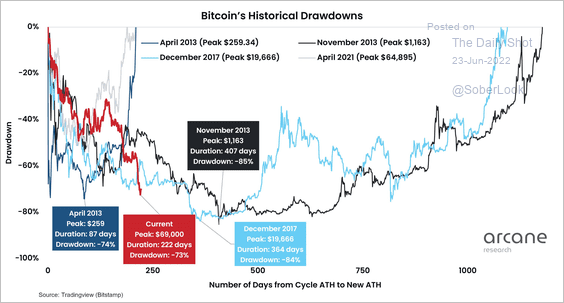
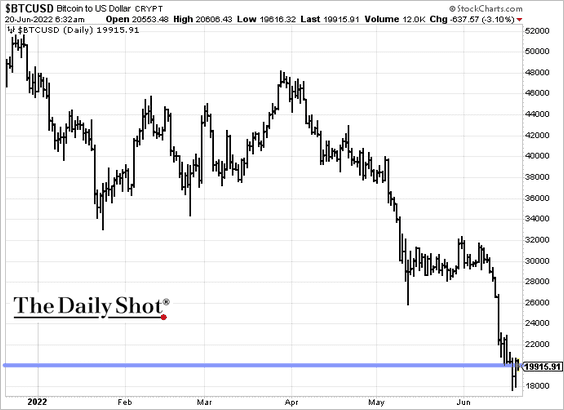
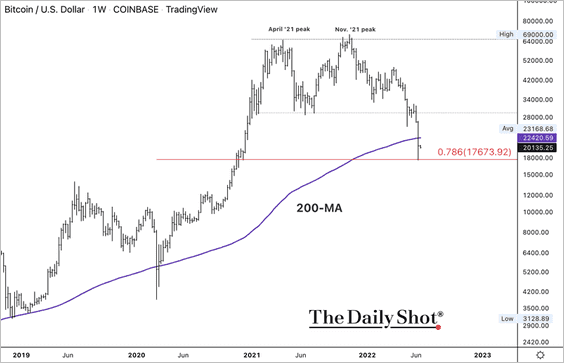
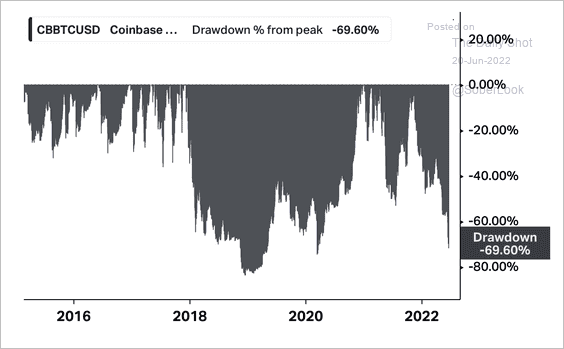
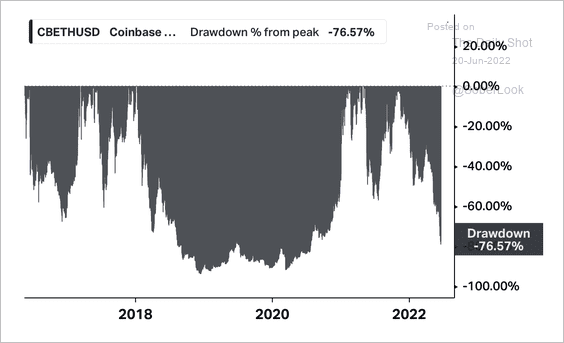
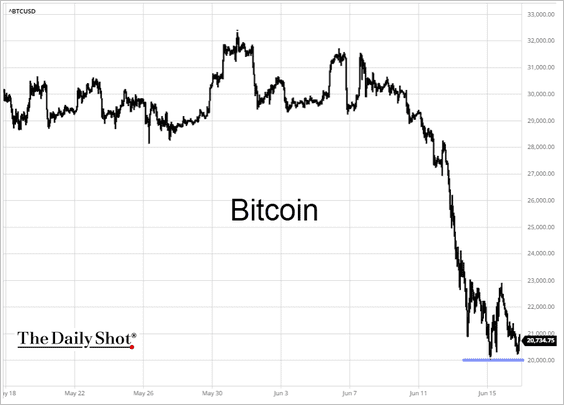
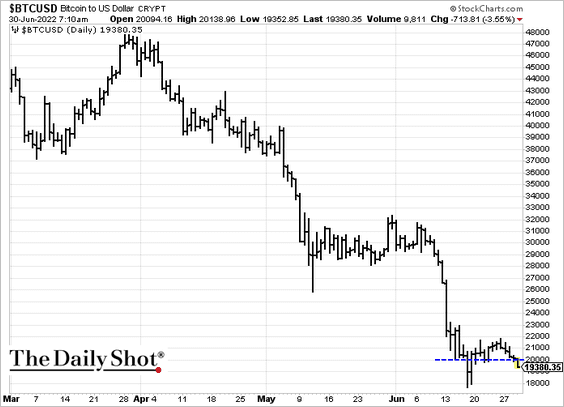
1. Bitcoin is back below $20k.
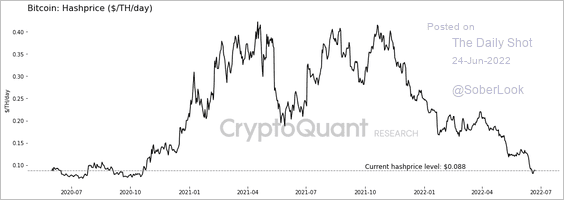
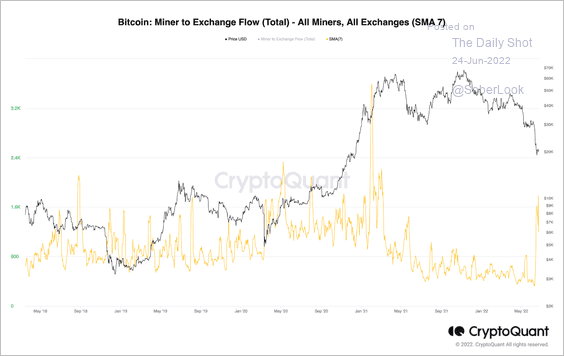
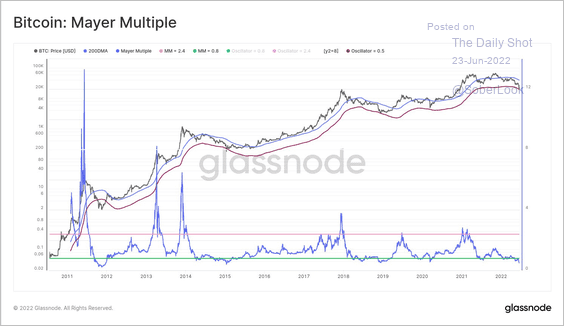
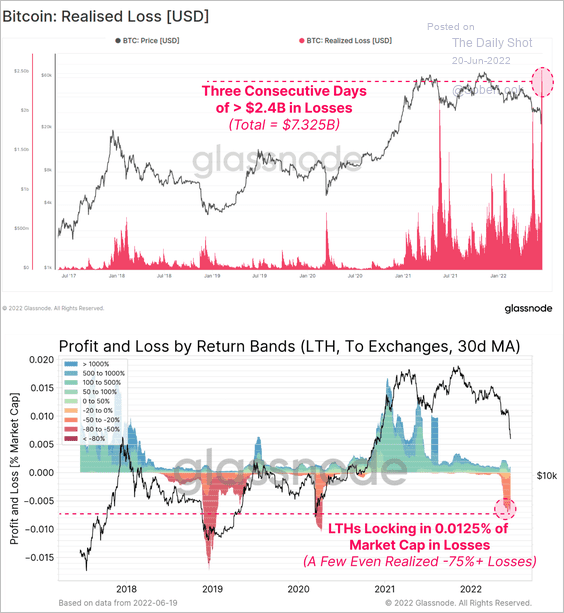
2. Bitcoin miners who have been under income stress lately are in full distribution mode, selling an estimated 3,000-4,000 BTC per month.
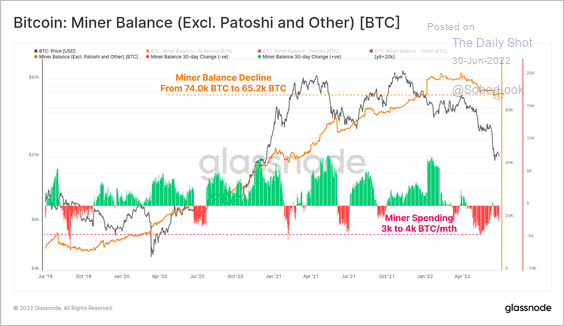 Source: @glassnode
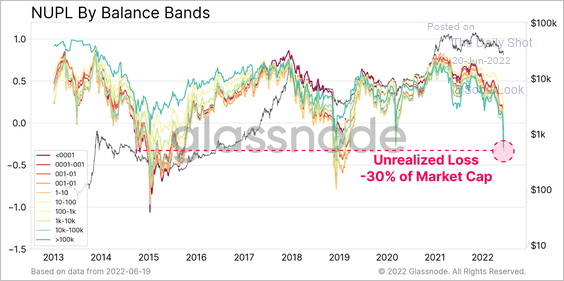
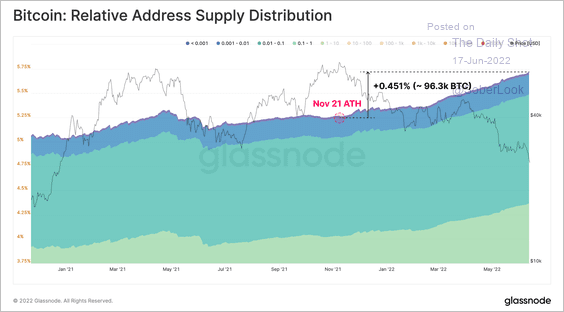
3. Large bitcoin investors (holding more than 1,000 BTC) have added to their balances during the recent sell-off. These holders account for roughly 45% of total BTC supply and have not yet capitulated.
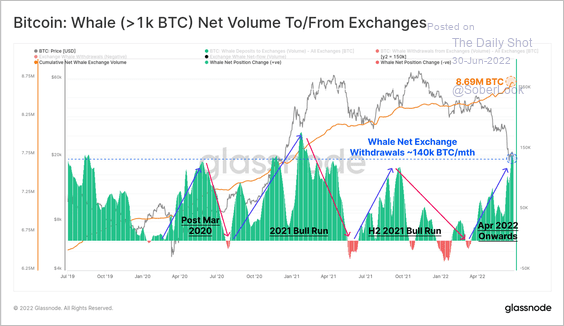 Source: @glassnode
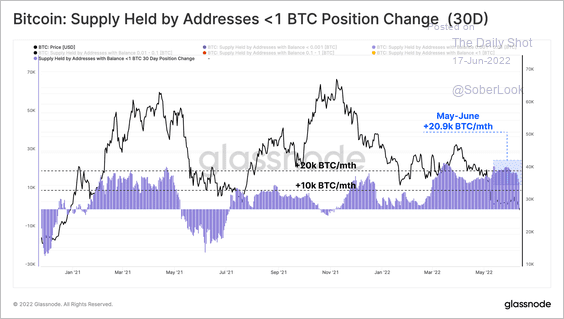
The same is true for smaller bitcoin holders.
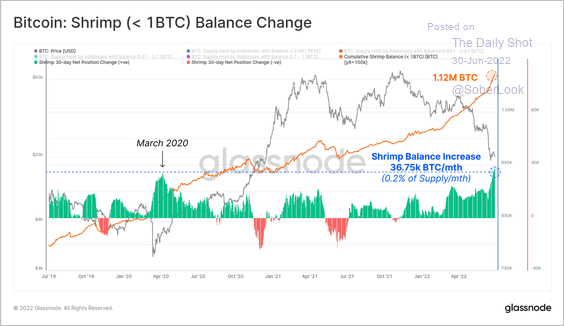 Source: @glassnode
——————–
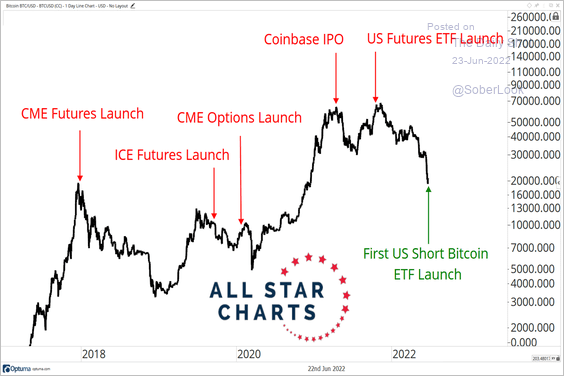
4. Grayscale is planning to sue the SEC after its bid for a spot-based bitcoin ETF was rejected.
 Source: CoinDesk Read full article
The Grayscale Bitcoin Trust’s (GBTC) discount has narrowed over the past week.
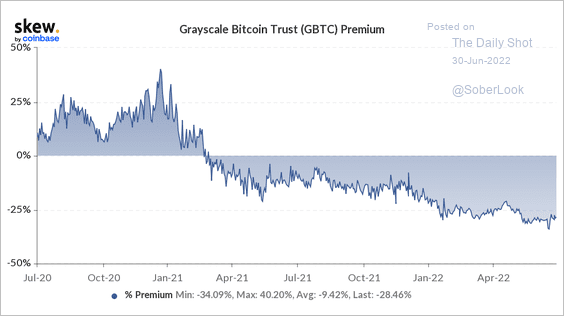 Source: Skew
Back to Index
Energy
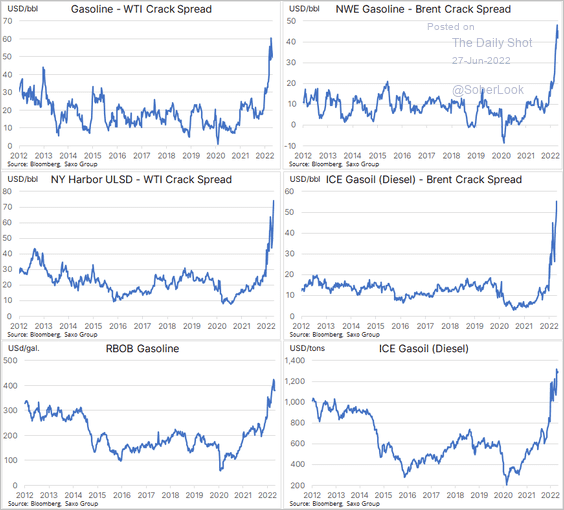
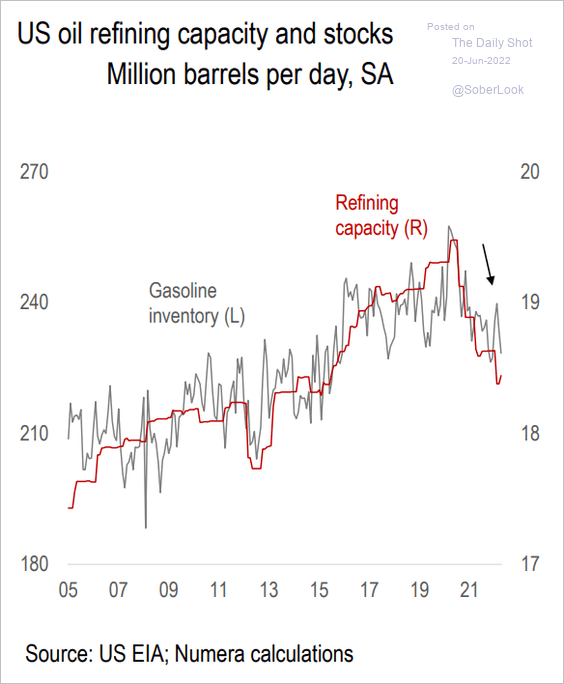
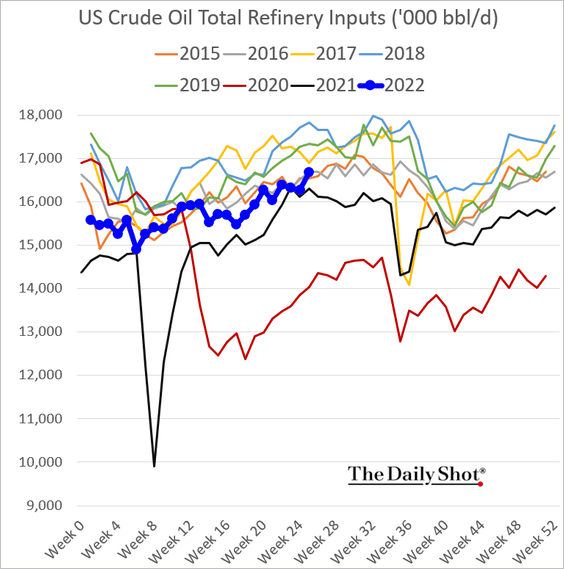
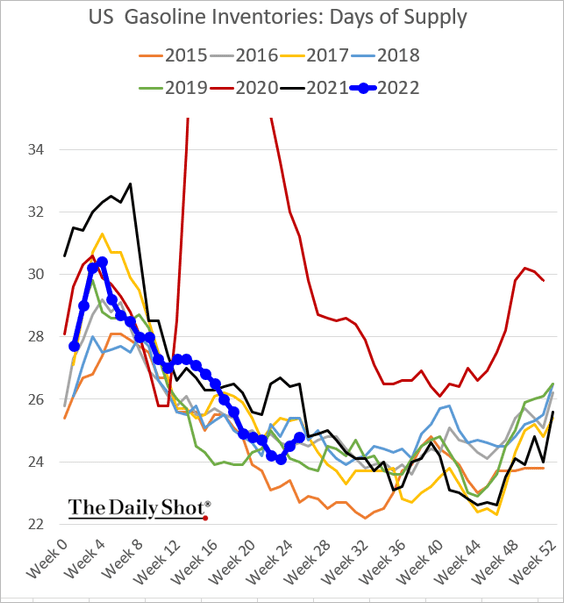
1. US refinery inputs are firmer.
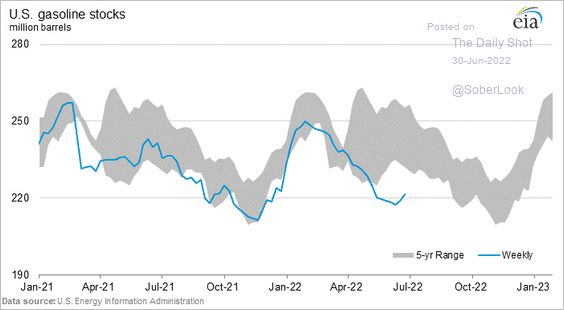
And gasoline inventories are starting to recover (2 charts).
——————–
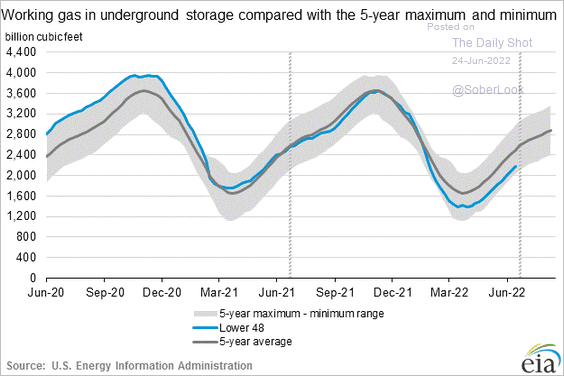
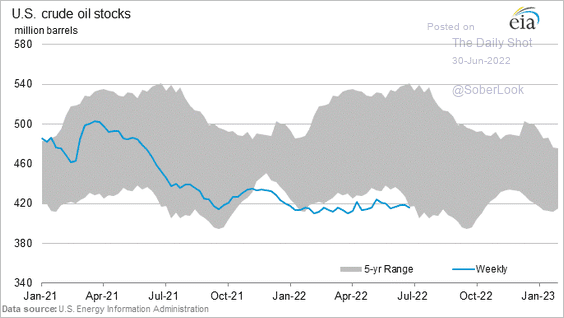
2. US oil inventories are nearing the 5-year range.
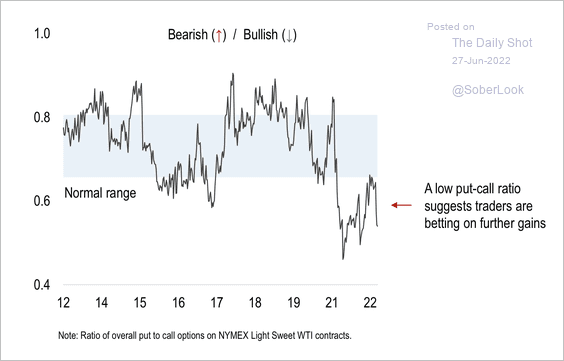
3. Open interest in Brent and WTI futures hit a 7-year low.
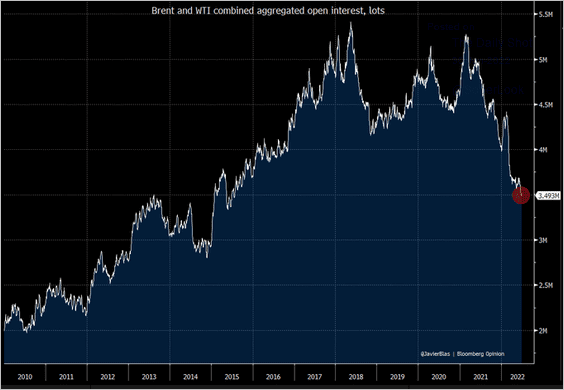 Source: @JavierBlas
Back to Index
Equities
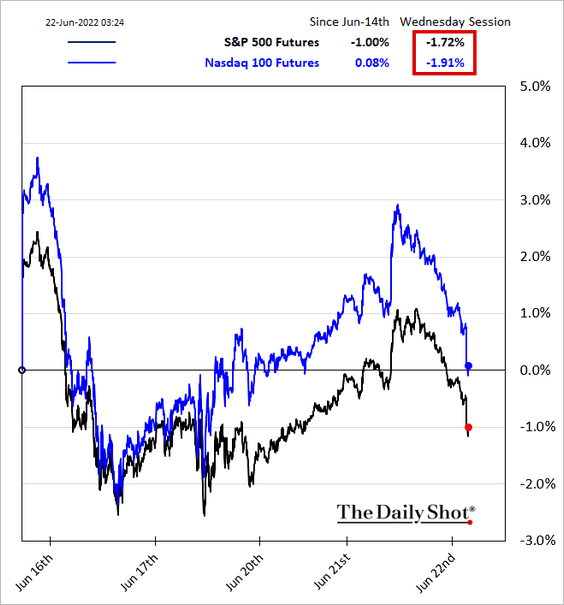
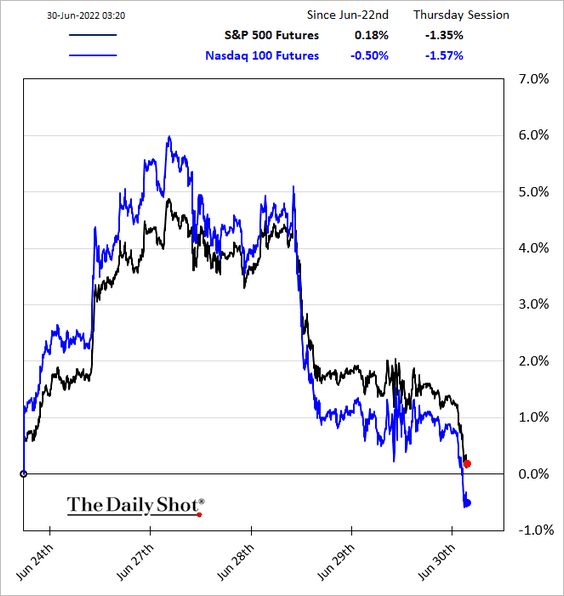
1. Stock futures are heavy this morning as recession risks mount.
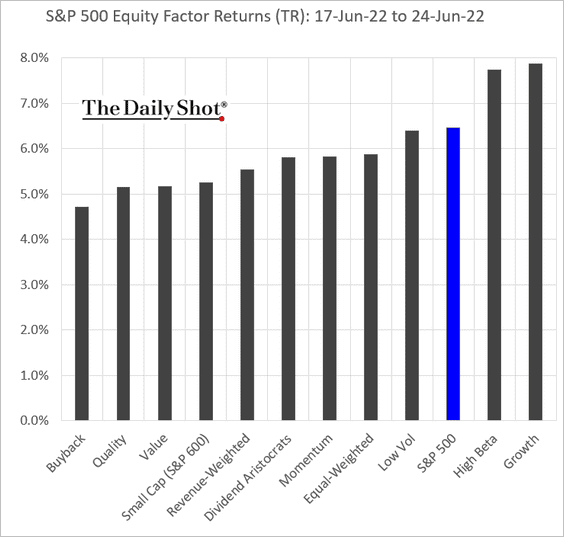
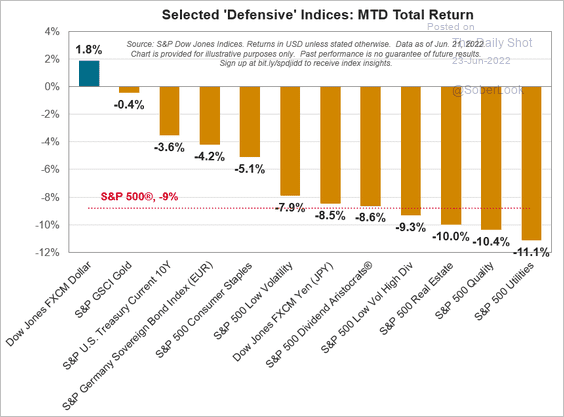
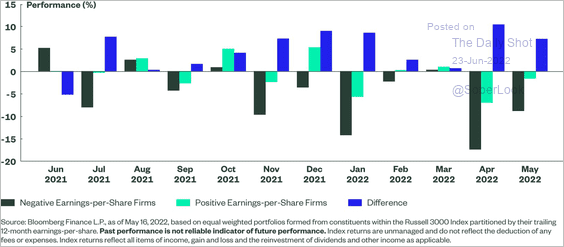
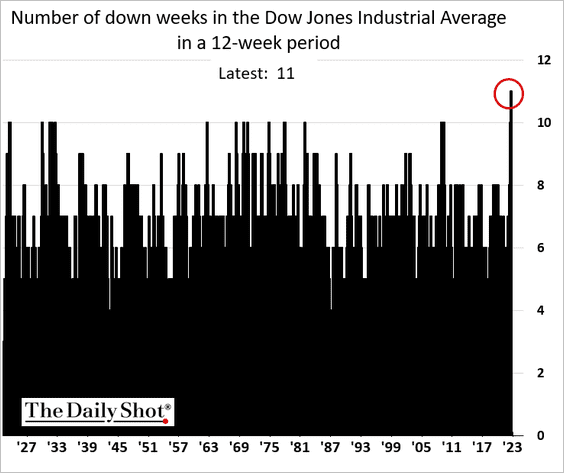
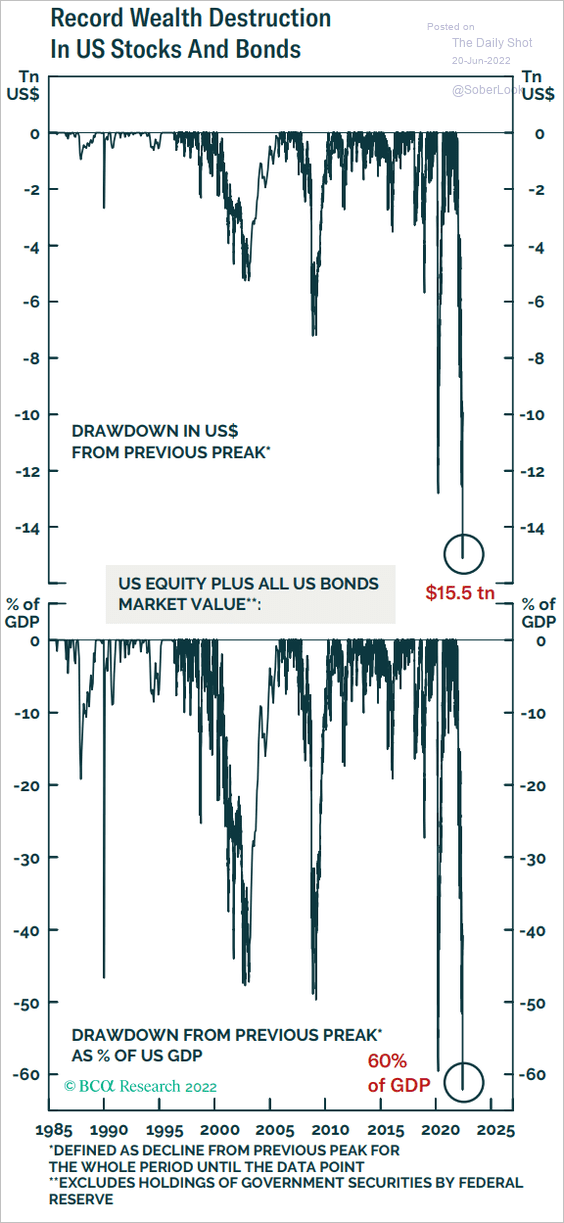
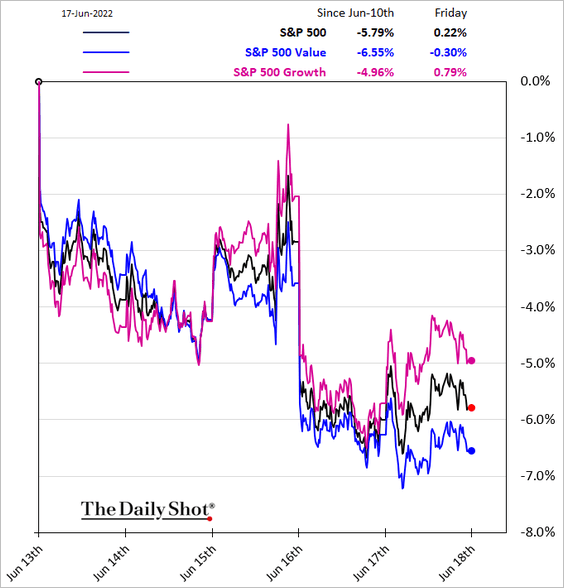
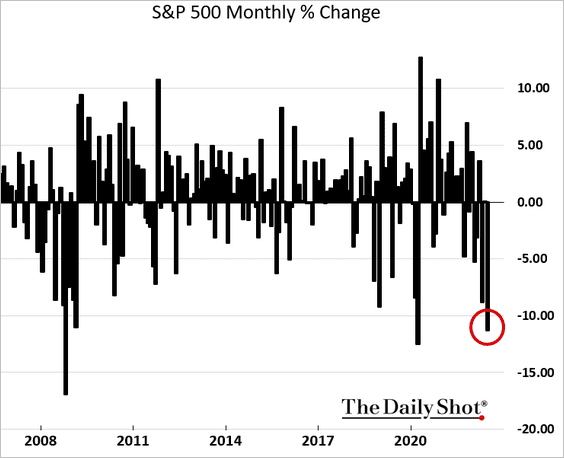
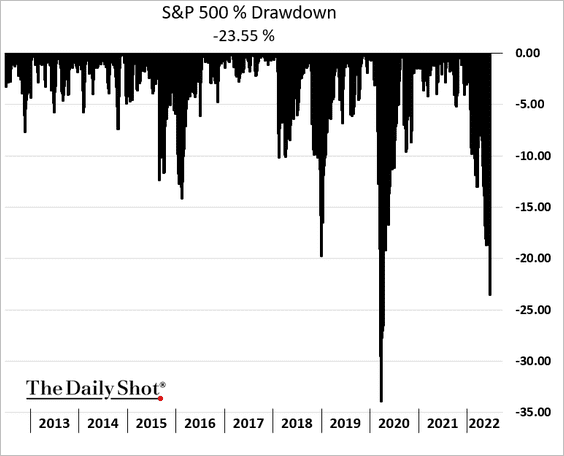
2. It has been a difficult first half of the year for stocks.
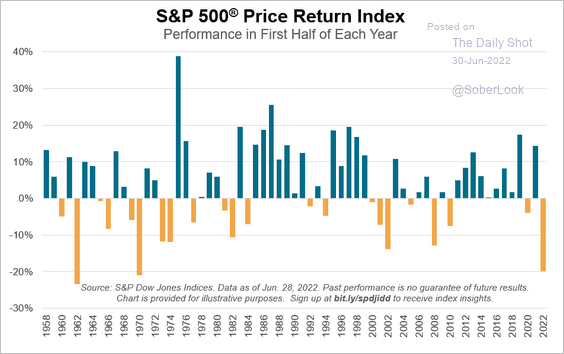 Source: S&P Dow Jones Indices
Here are the US equity market value drawdowns as a share of GDP.
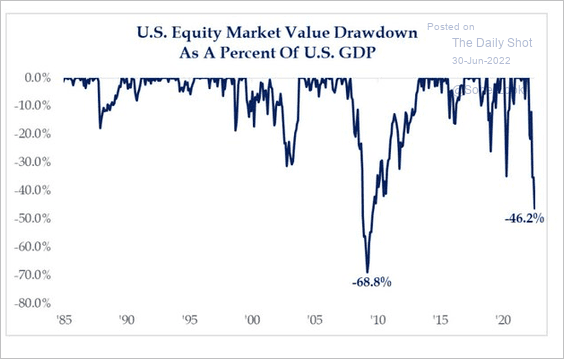 Source: @strategasasset
——————–
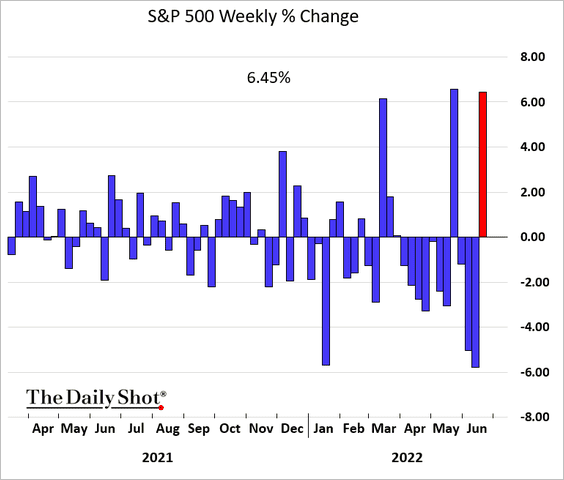
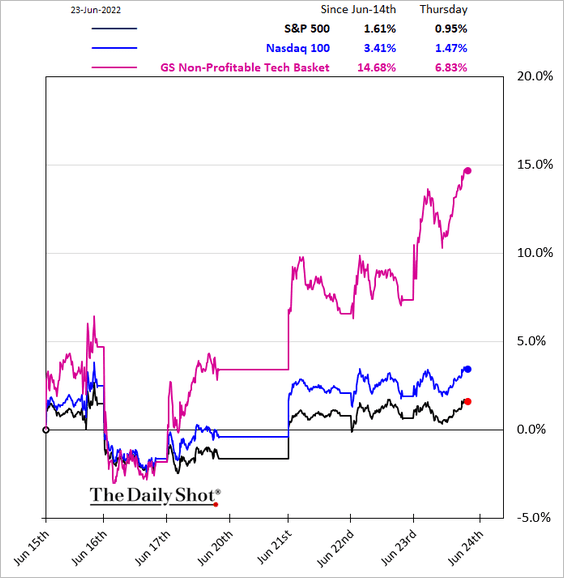
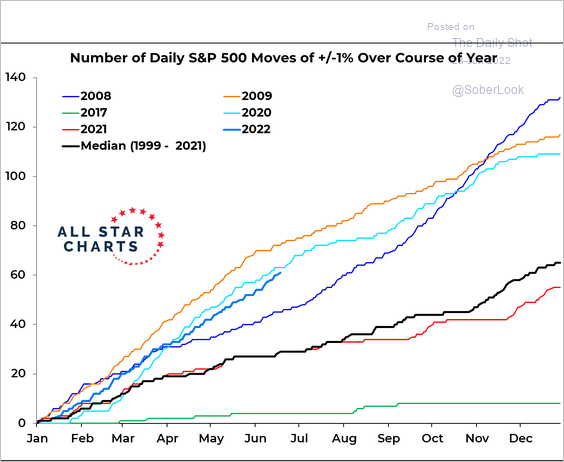
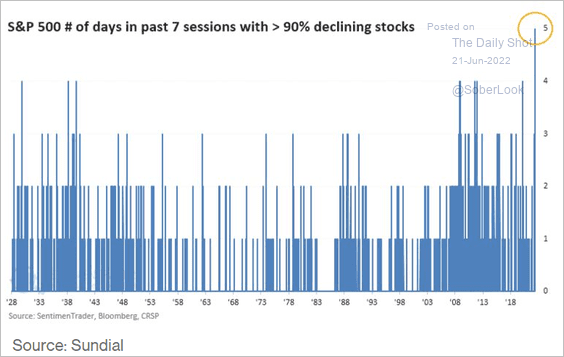
3. We’ve had a very volatile 5-week period.
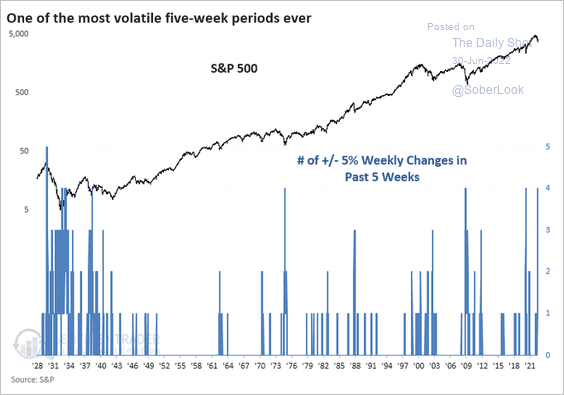 Source: @sentimentrader, @JasonGoepfert
4. Will the S&P 500 break below the 3-year moving average?
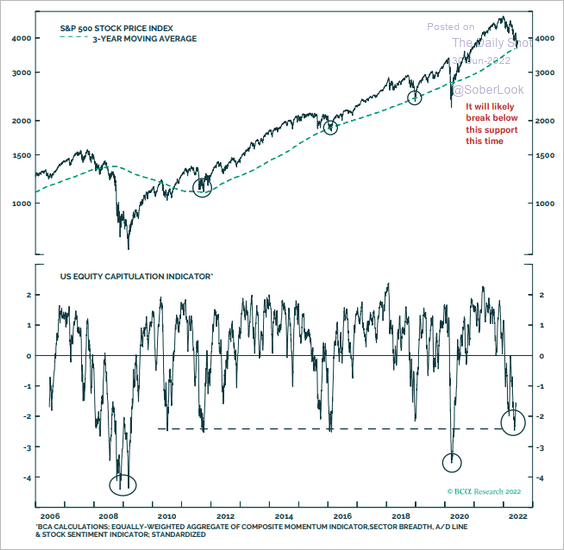 Source: BCA Research
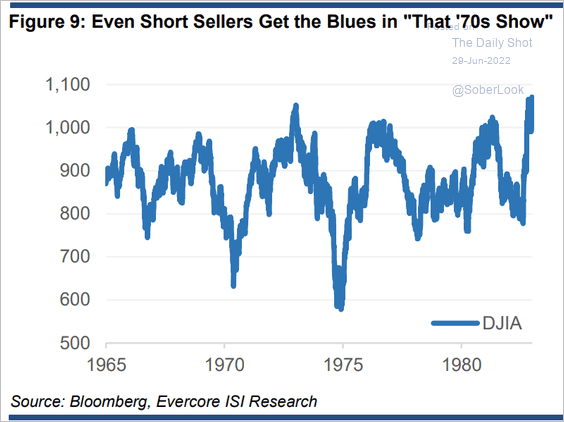
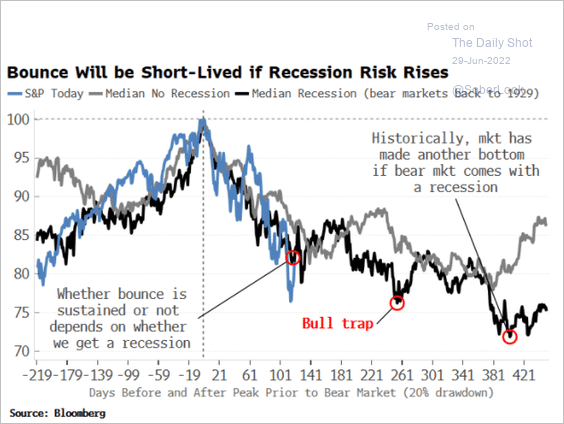
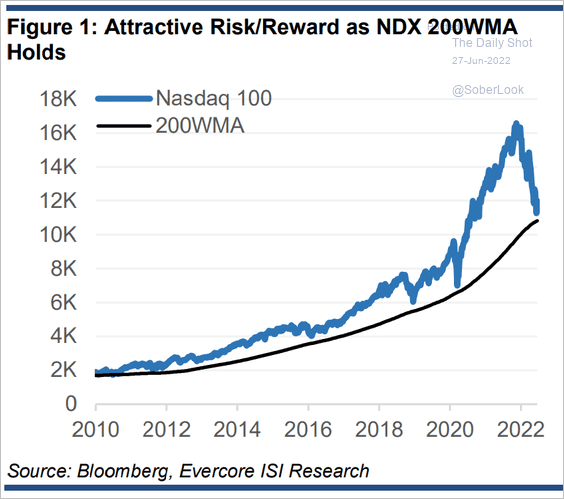
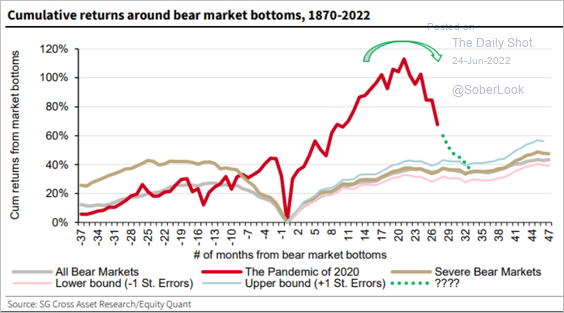
5. How extensive can bear market rallies get?
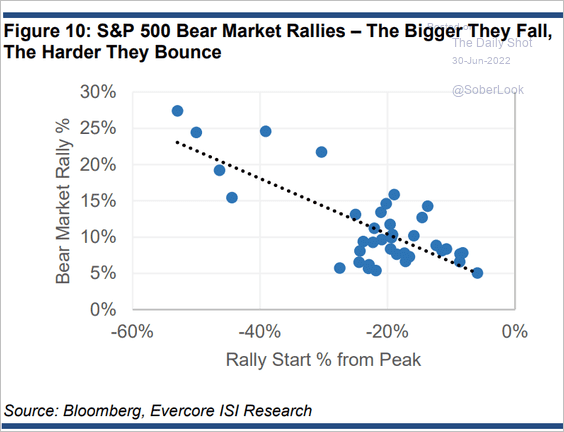 Source: Evercore ISI Research
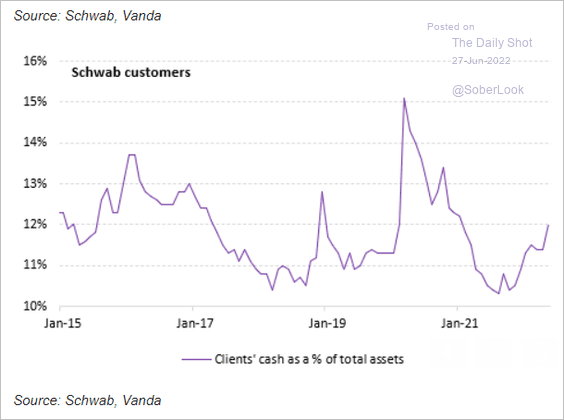
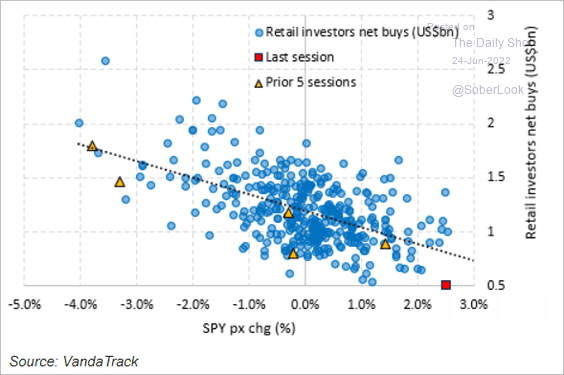
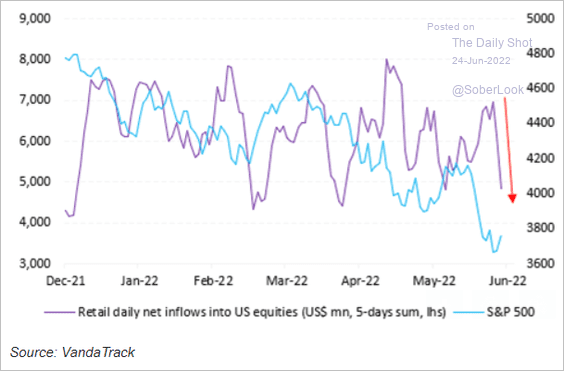
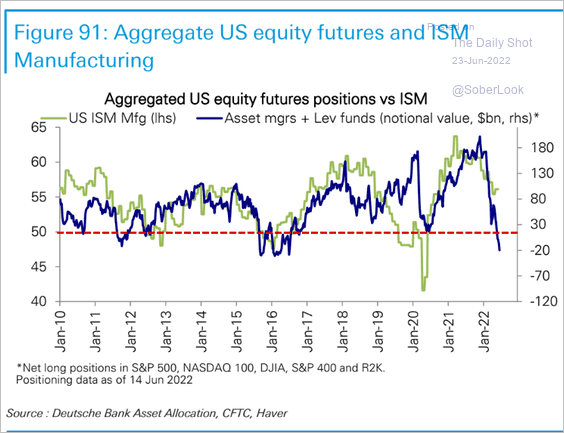
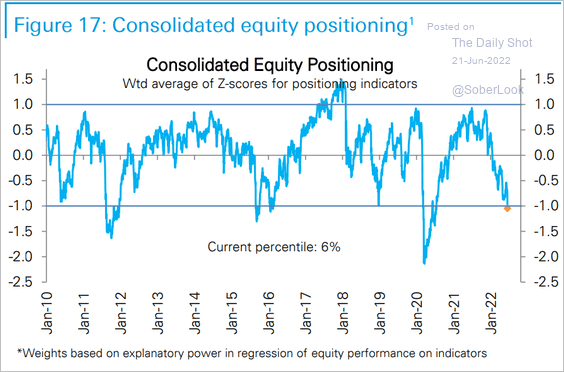
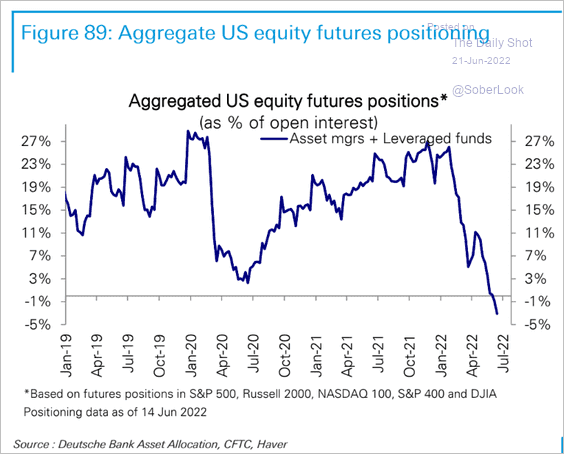
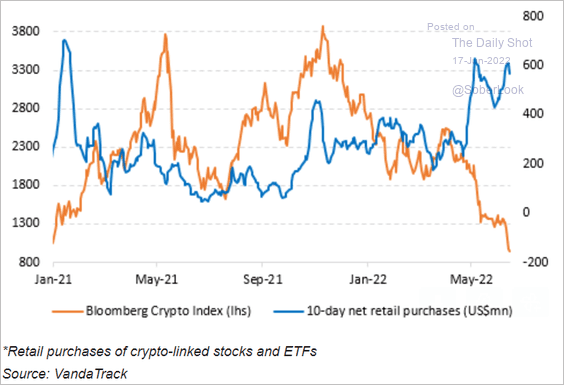
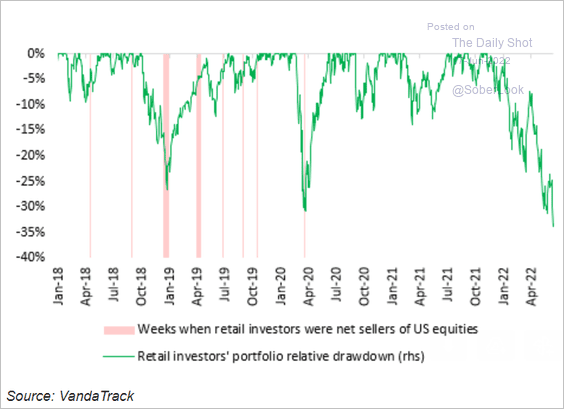
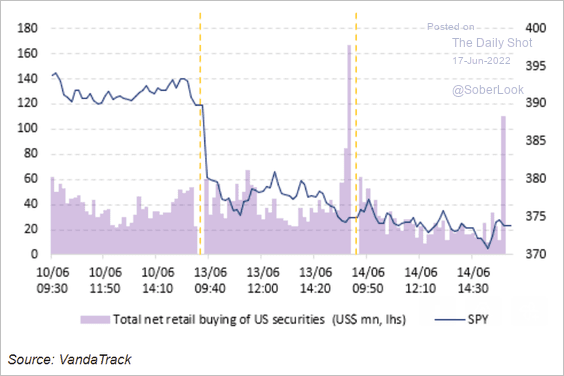
6. Retail investors continue to buy the dip, but it’s not enough to offset institutional sales.
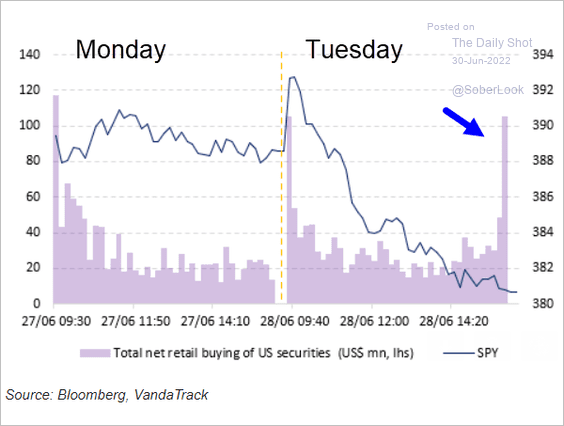 Source: Vanda Research
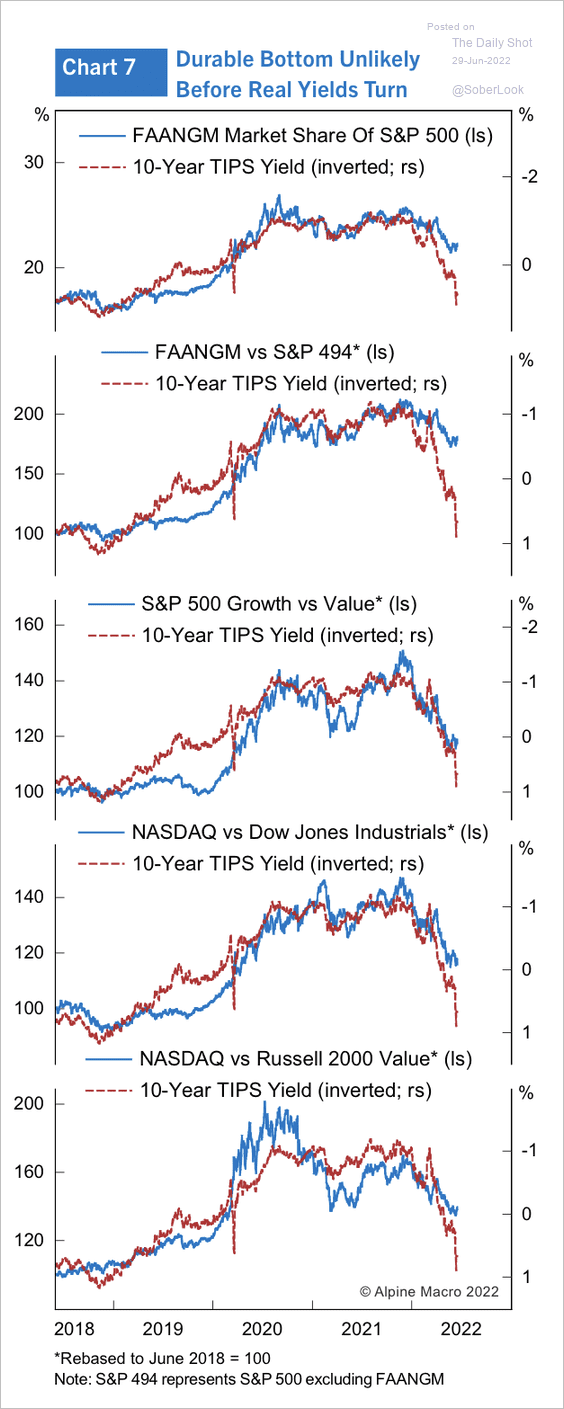
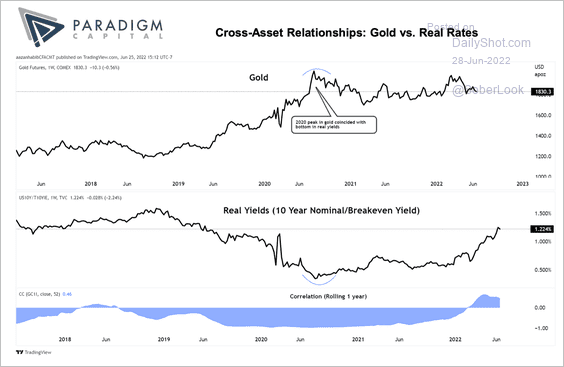
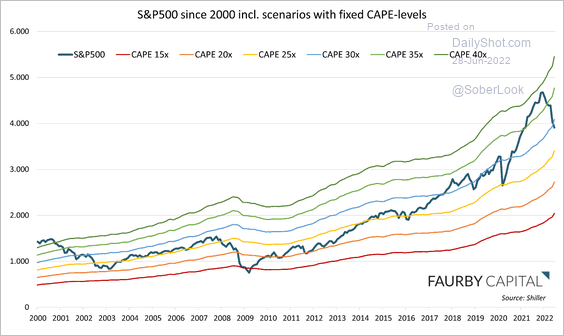
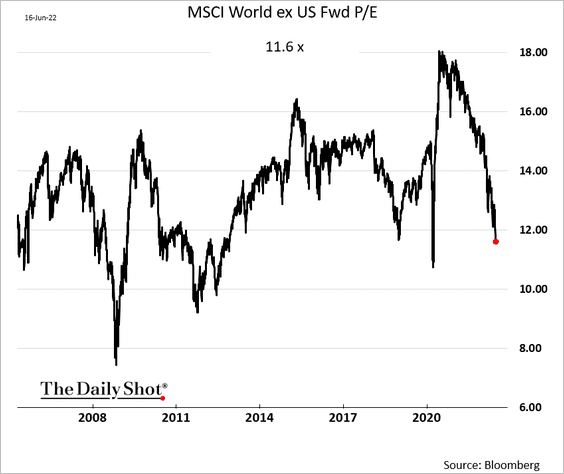
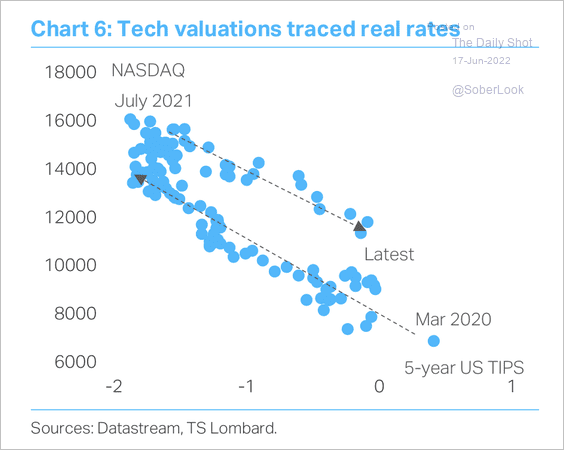
7. Global equity valuations have been linked to US real rates.
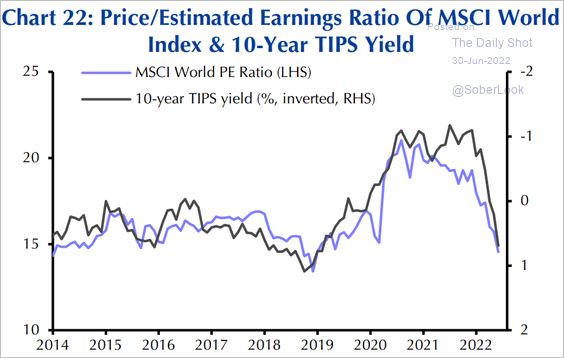 Source: Capital Economics
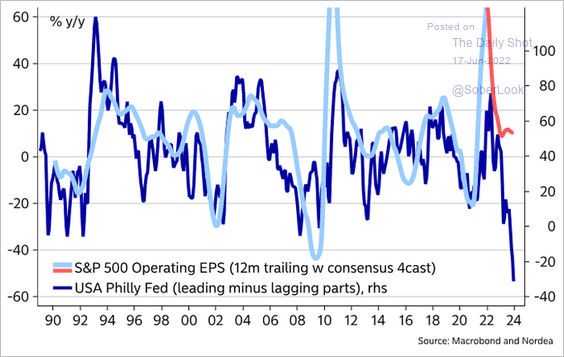
8. Sales growth and inflation tend to be correlated.
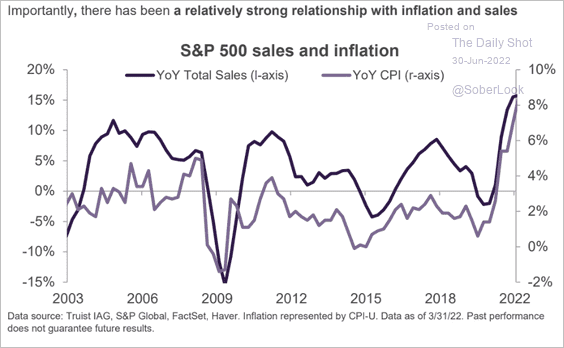 Source: Truist Advisory Services
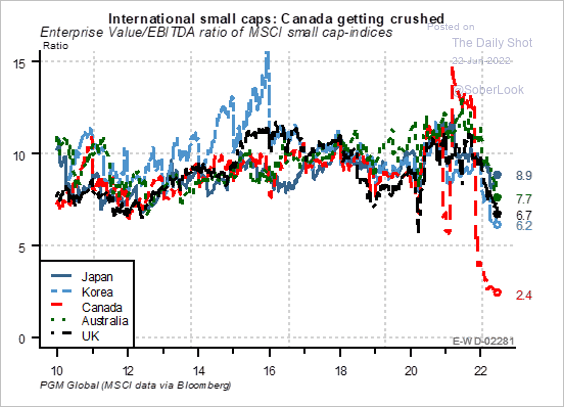
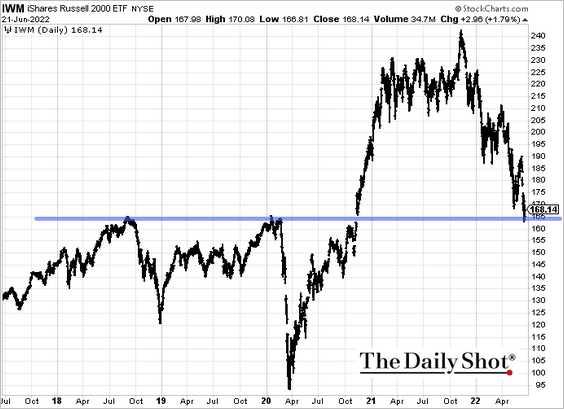
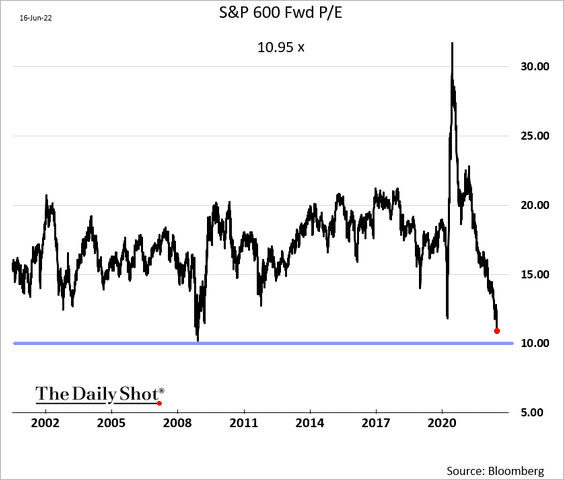
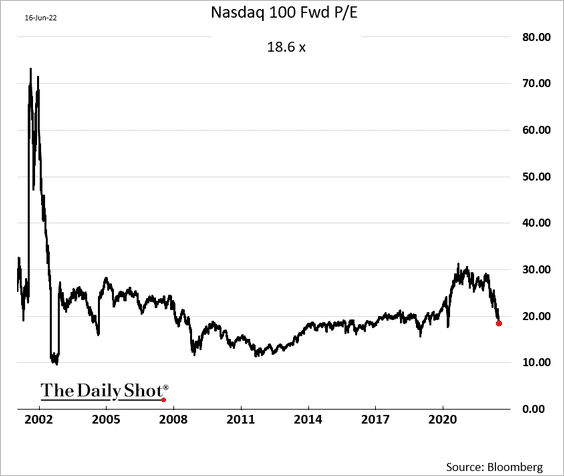
9. Small and mid-cap shares continue to trade at a substantial discount to large caps.
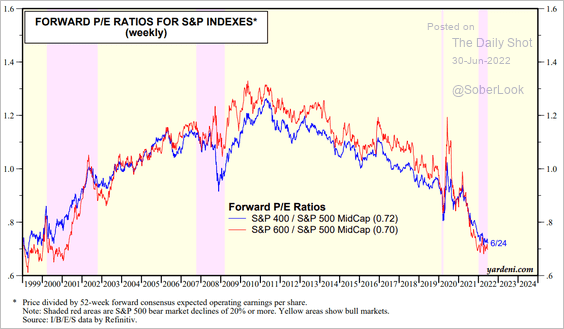 Source: Yardeni Research
The selloff in credit points to downside risks for small caps.
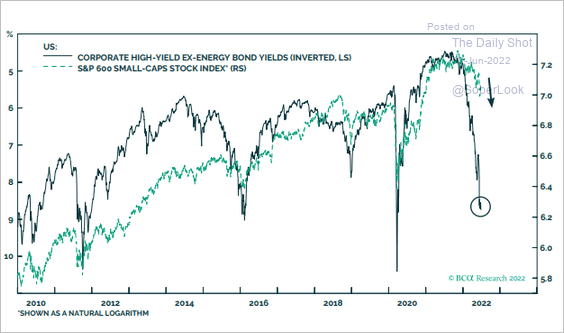 Source: BCA Research
——————–
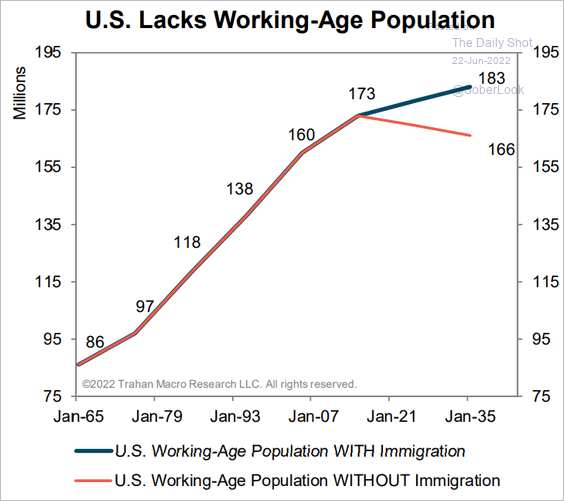
10. Almost a third of financial industry employees started working after the financial crisis.
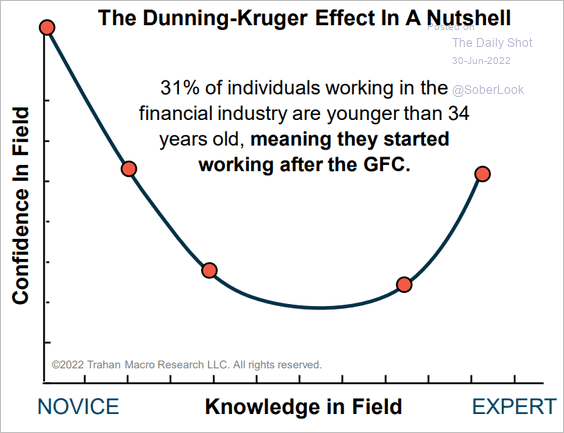 Source: Trahan Macro Research
Back to Index
Credit
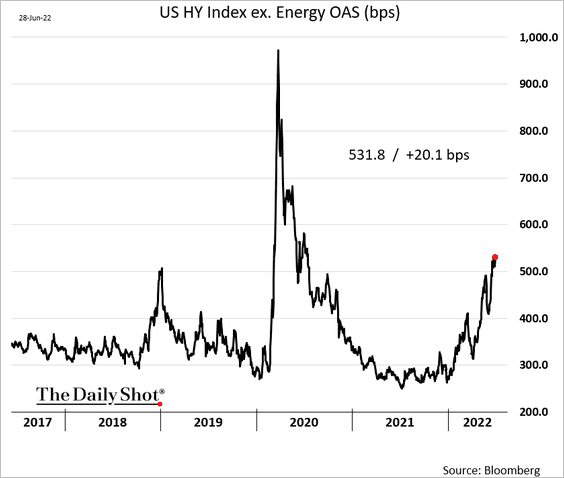
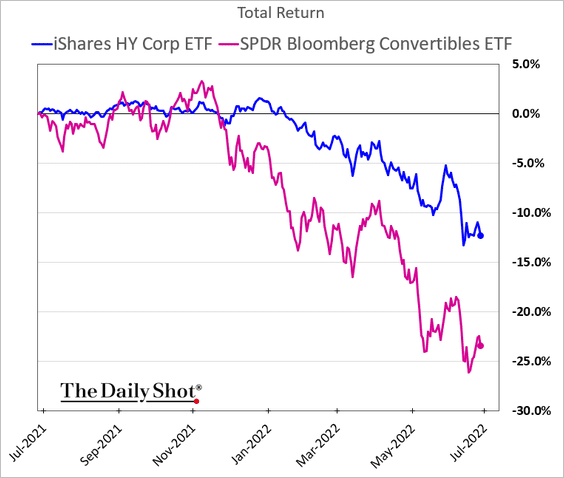
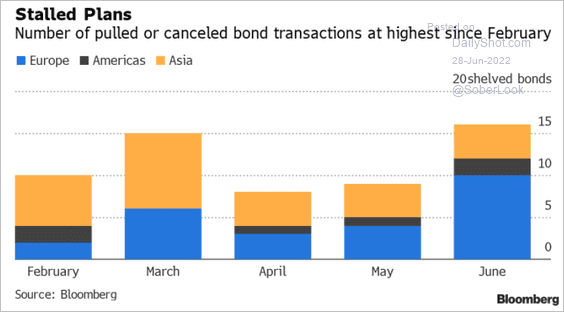
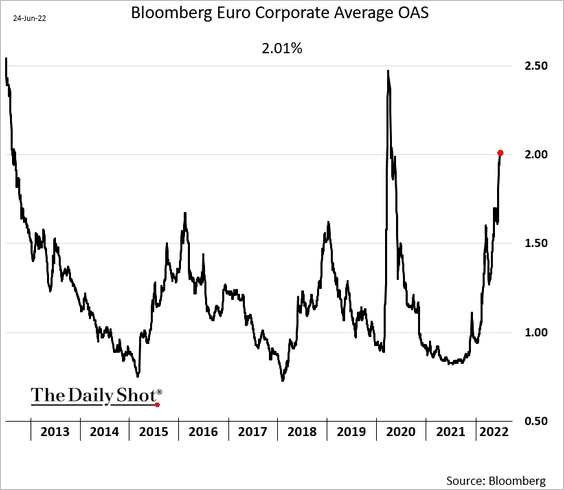
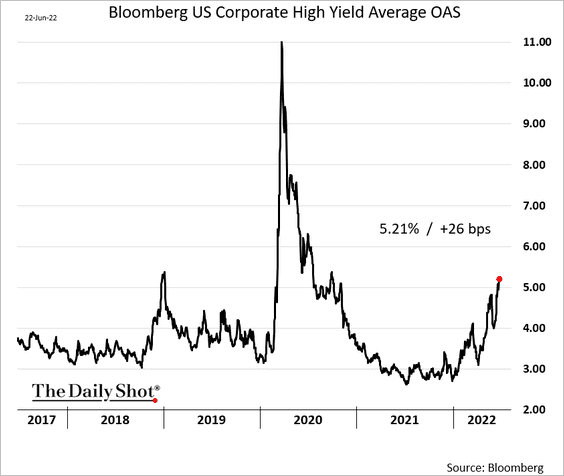
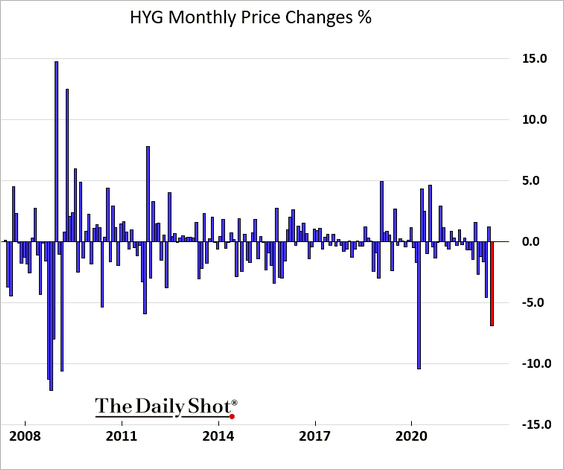
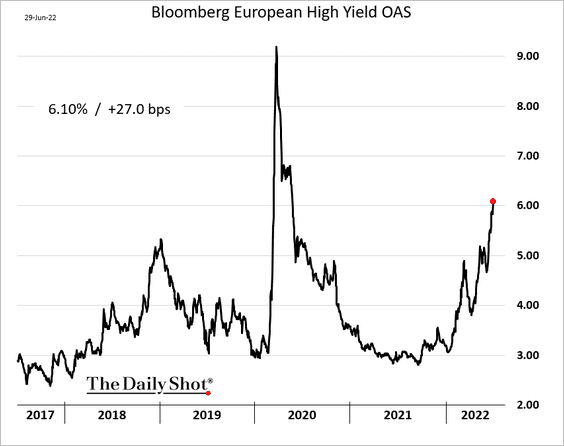
1. European high-yield debt markets are struggling.
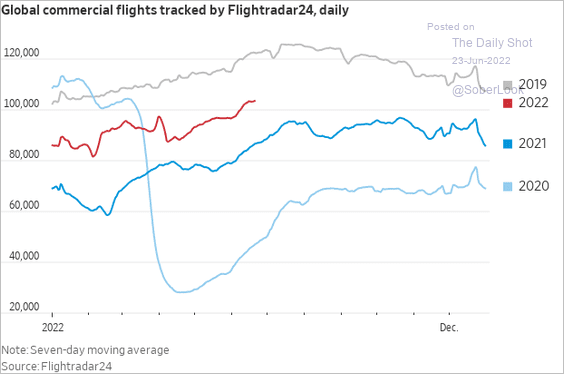
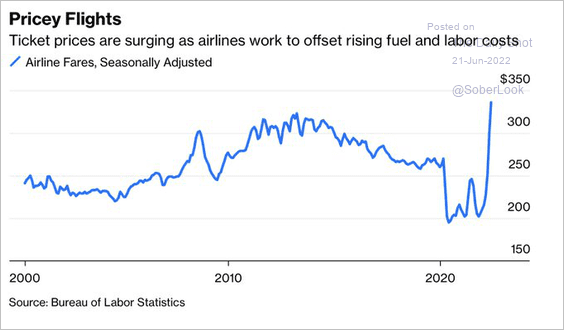
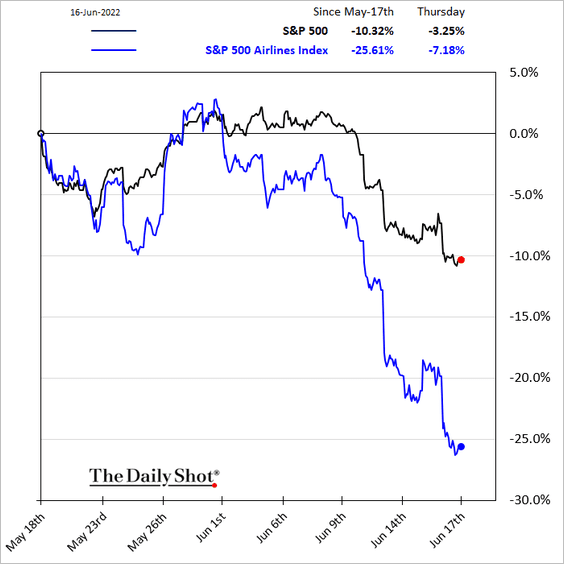
2. Airline bonds have been selling off.
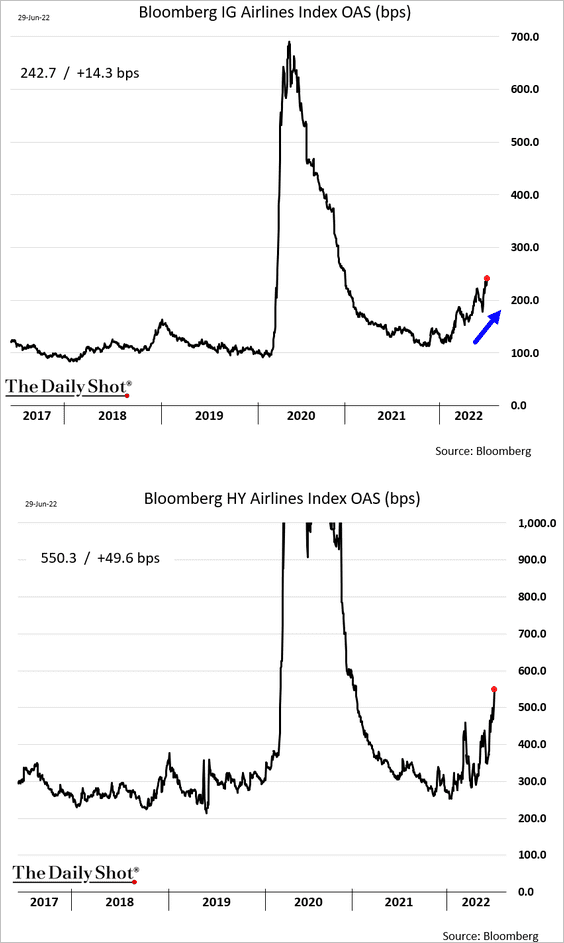
 Source: Bloomberg Law Read full article
——————–
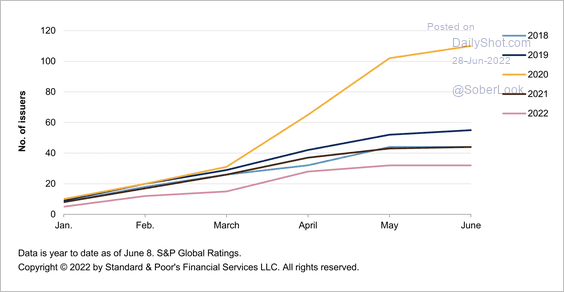
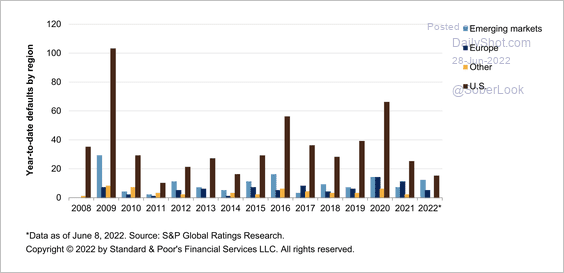
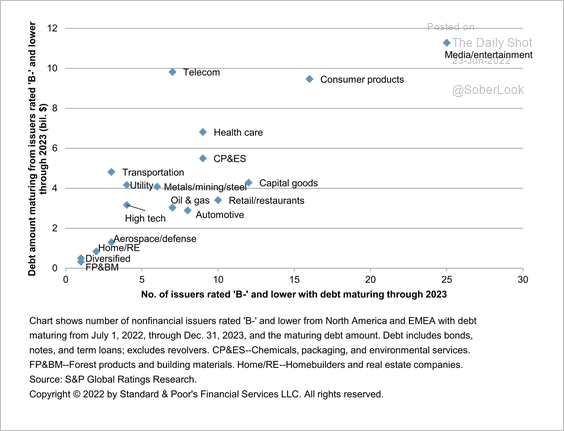
3. This scatterplot shows the amount of B- debt maturing through the end of 2023 vs. the number of issuers.
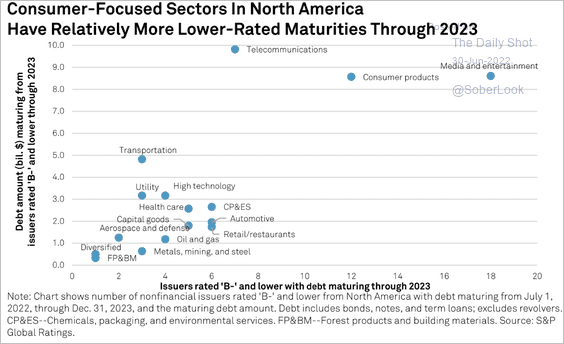 Source: S&P Global Ratings
Back to Index
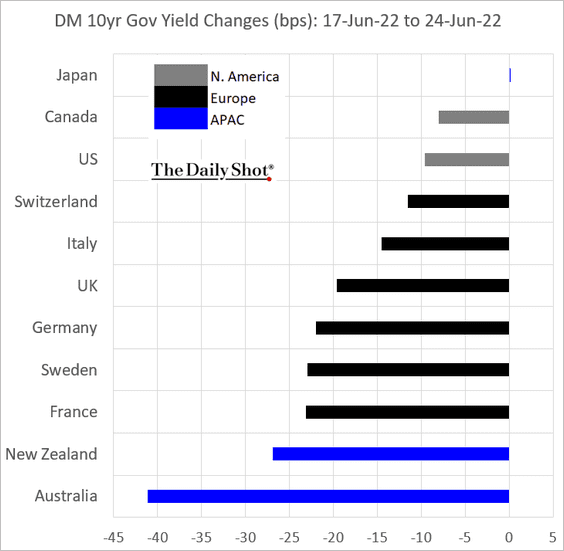
Rates
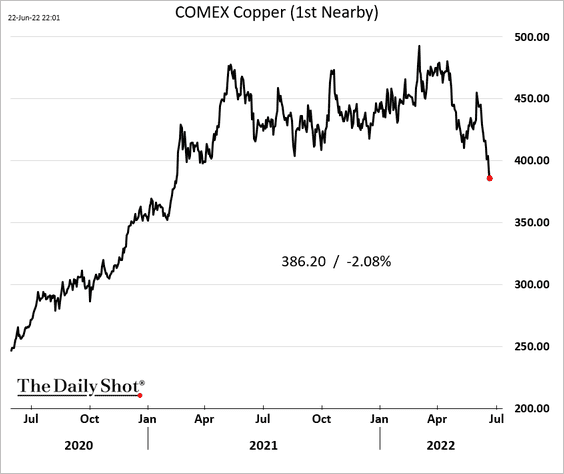
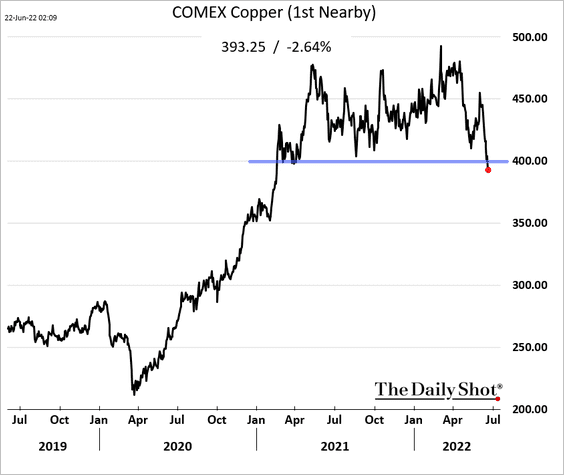
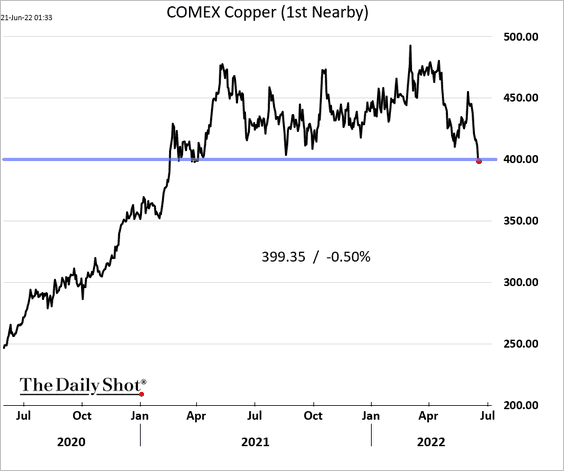
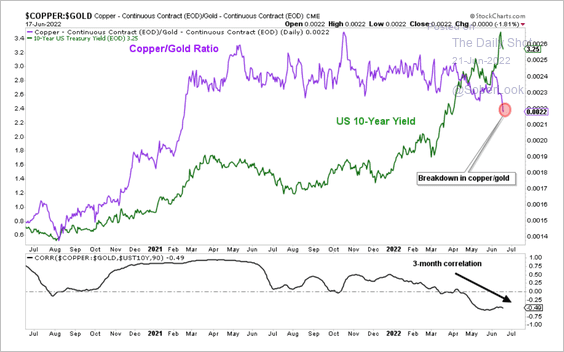
1. The copper-to-gold ratio is pricing in slower growth. Will Treasury yields follow?
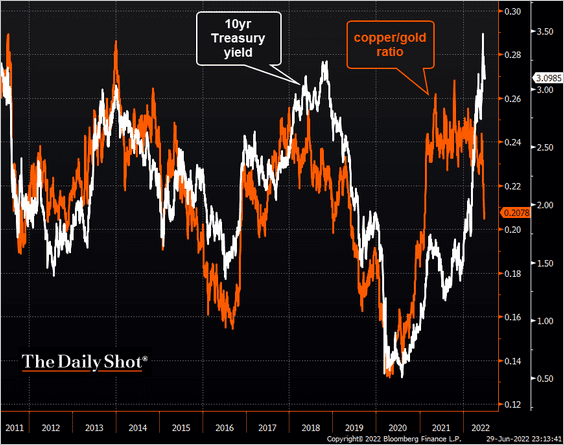 Source: @TheTerminal, Bloomberg Finance L.P.
2. This has been the worst start of the year for Treasuries since 1788.
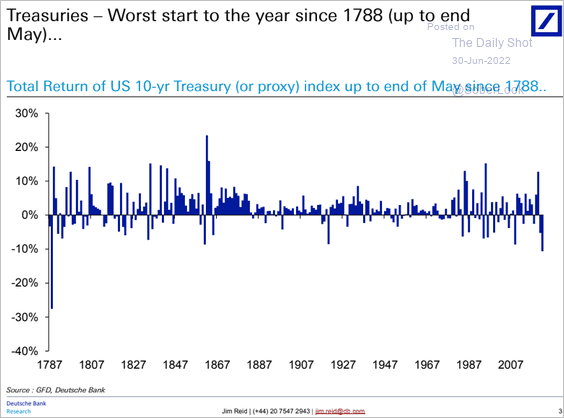 Source: Deutsche Bank Research
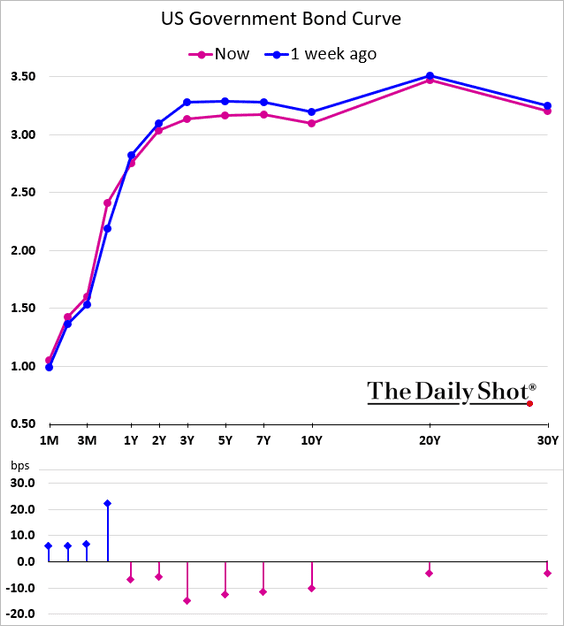
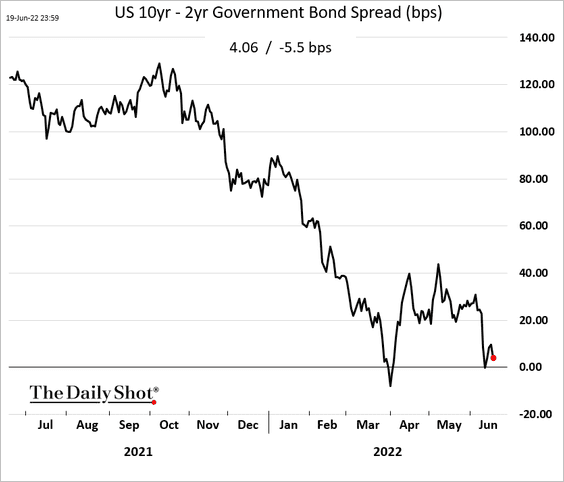
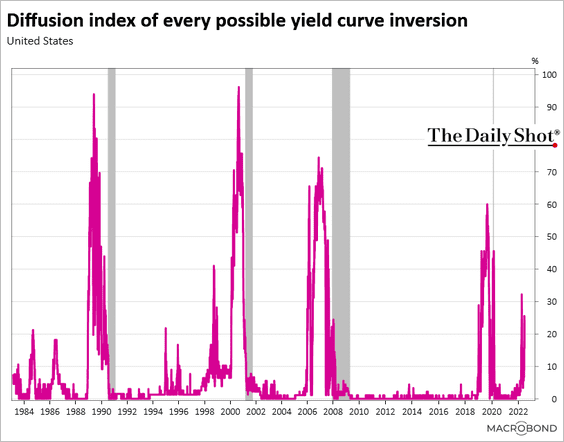
3. The Treasury curve is rapidly flattening between the 1-year and the 10-year maturities.
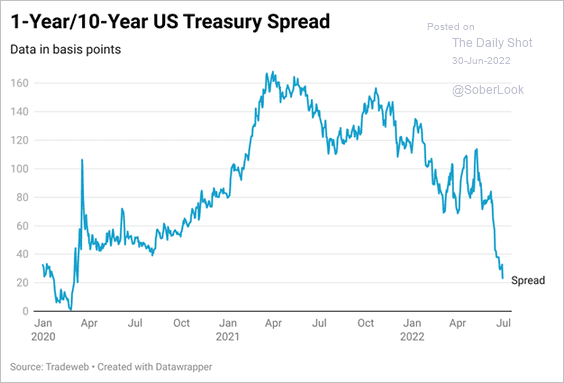 Source: Tradeweb
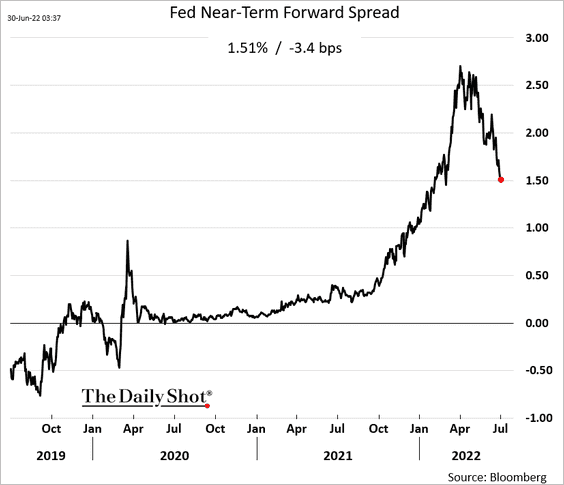
Here is another leading indicator: the Fed’s near-term forward spread.
——————–
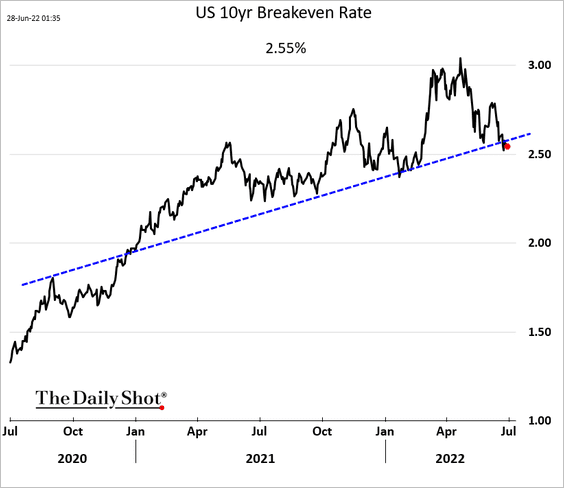
4. The iShares TIPS Bond ETF (TIP) is testing resistance relative to the iShares 7-10 Year Treasury Bond ETF (IEF).
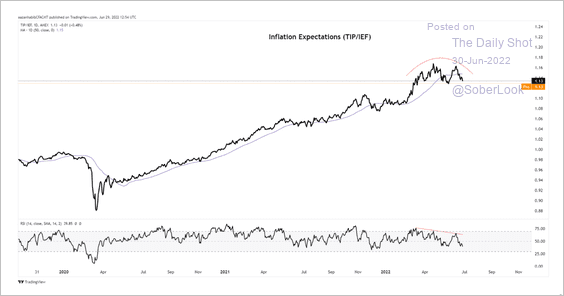 Source: Azan Habib; Paradigm Capital
Back to Index
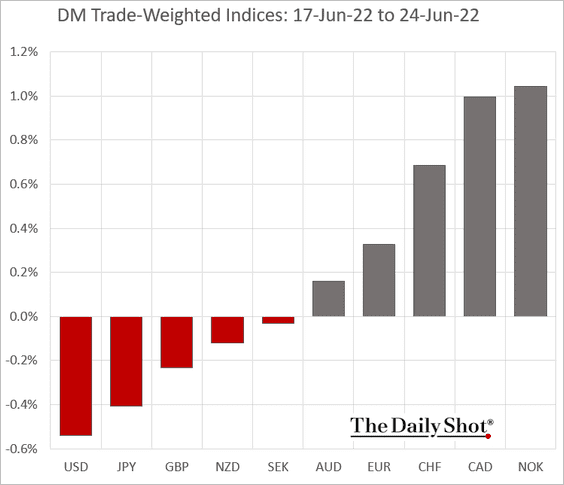
Global Developments
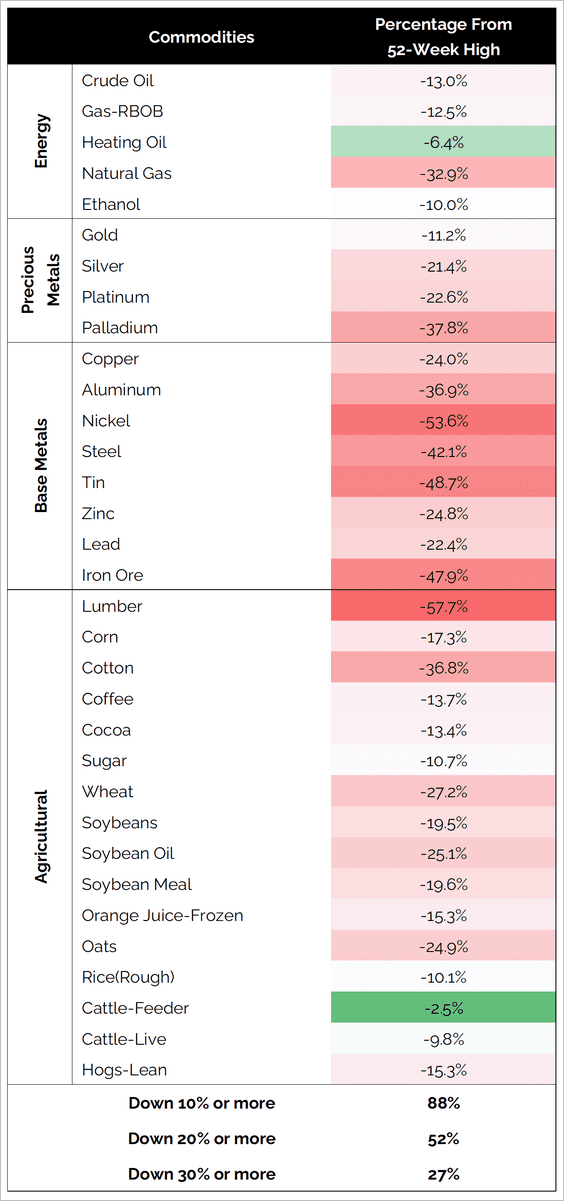
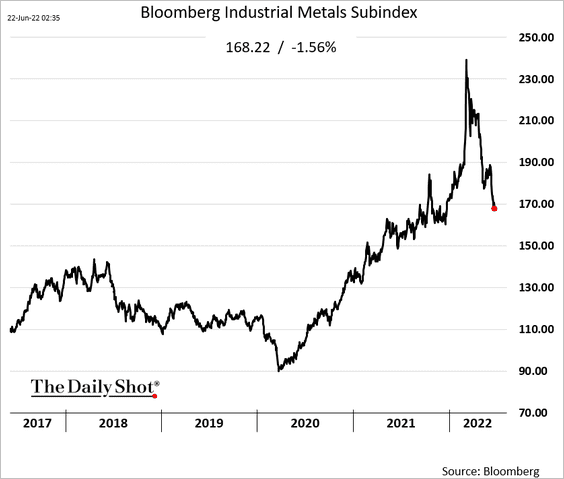
1. Commodities and the dollar are up this year. Everything else is down.
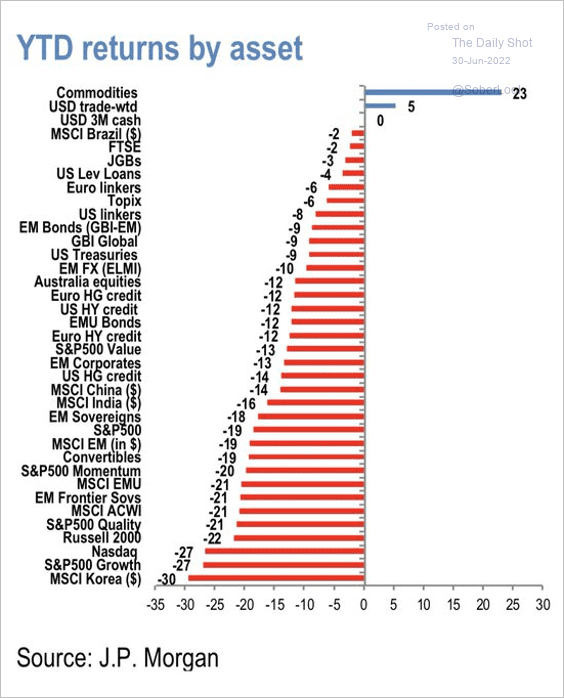 Source: JP Morgan Research; @Scutty
2. Traders have been boosting bets on the US dollar index futures.
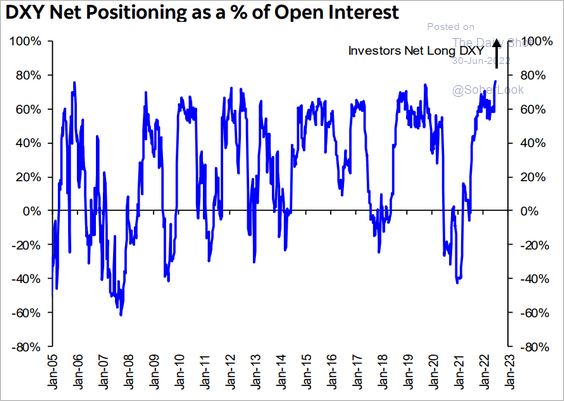 Source: Hugo Ste-Marie, Portfolio & Quantitative Strategy Global Equity Research, Scotia Capital
Historically, the dollar has weakened when the equity market has troughed, typically around the midpoint of a US recession.
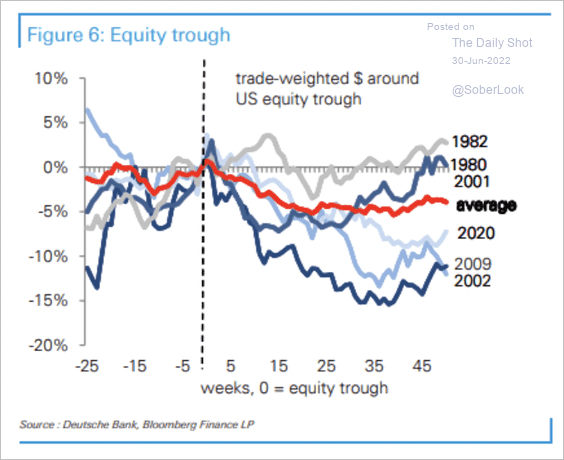 Source: Deutsche Bank Research
——————–
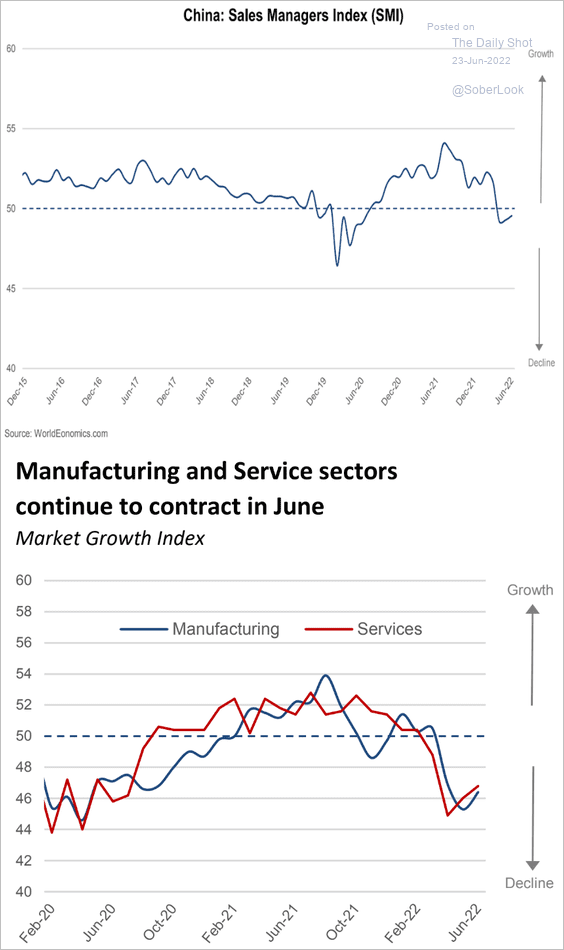
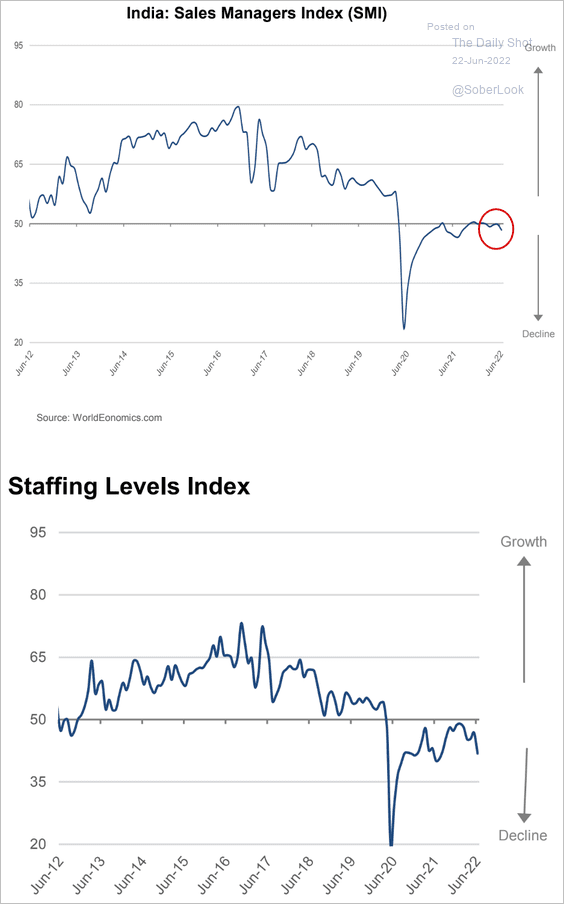
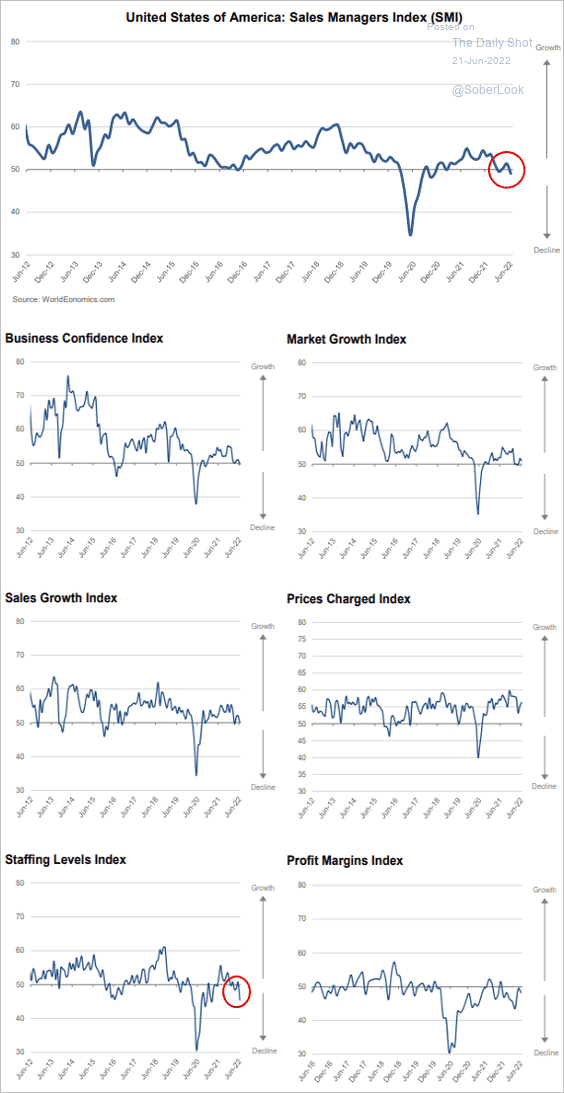
3. The June SMI report from World Economics shows global business activity entering contraction territory.
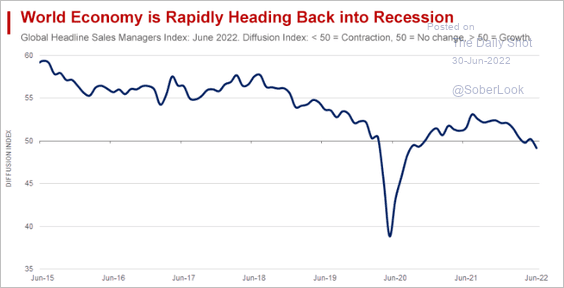 Source: World Economics
——————–
Food for Thought
1. Using a bike as a primary mode of transportation for short trips:
![]() Source: @financialtimes Read full article
Source: @financialtimes Read full article
2. City liveability rankings by region:
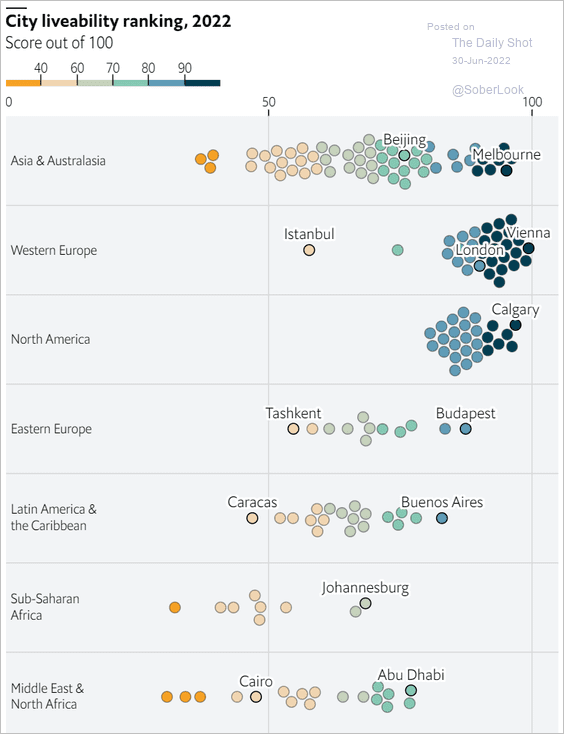 Source: The Economist Read full article
3. Spending on pharmaceuticals:
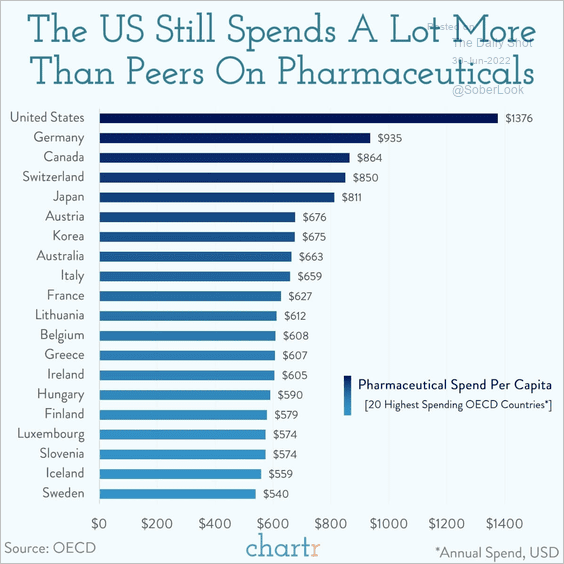 Source: @chartrdaily
4. Medication abortions as a share of total US abortions:
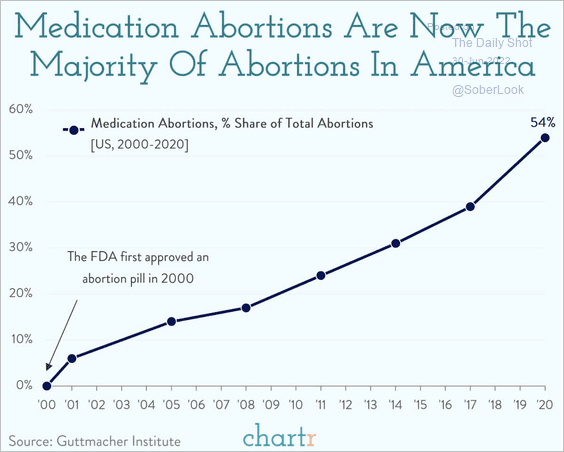 Source: @chartrdaily
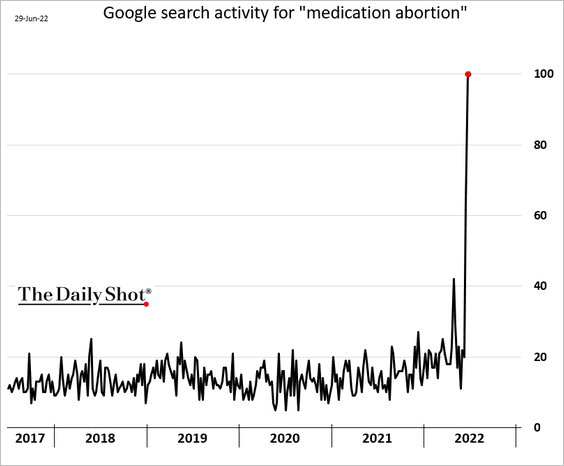
Google search activity for “medication abortion”:
——————–
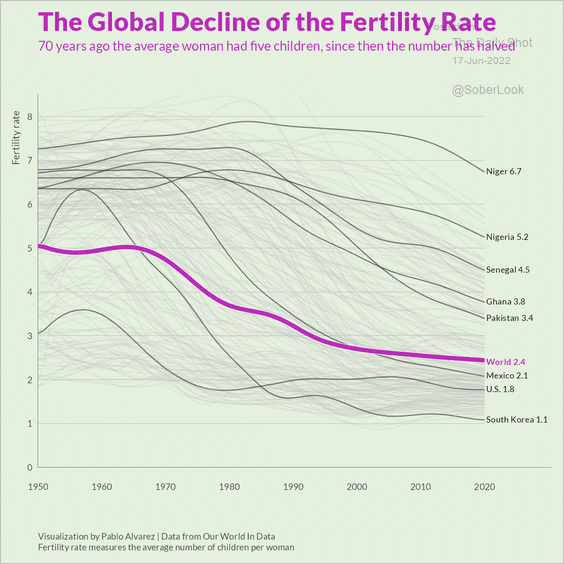
5. Share of childcare done by men and fertility rates:
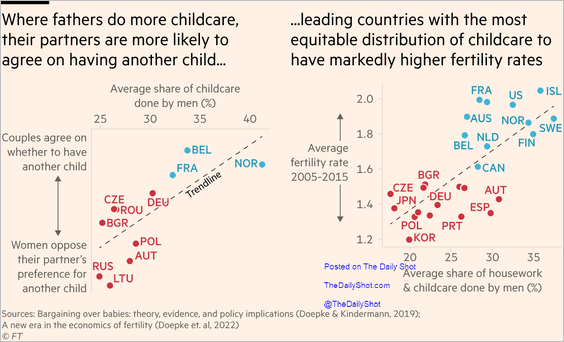 Source: @financialtimes Read full article
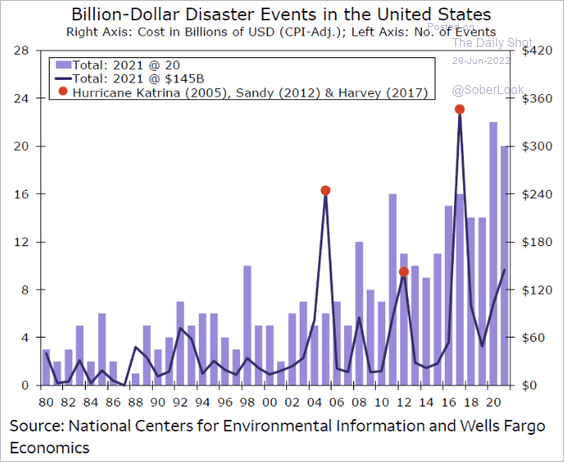
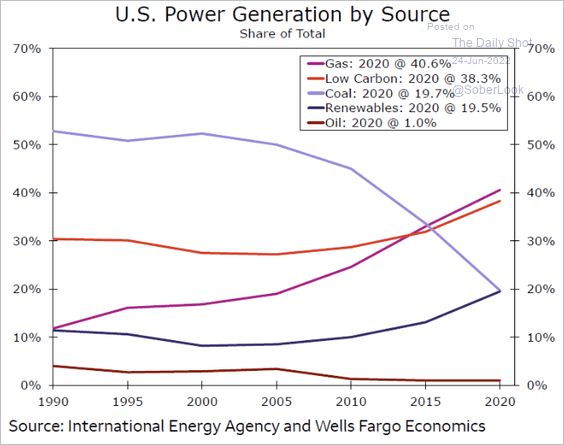
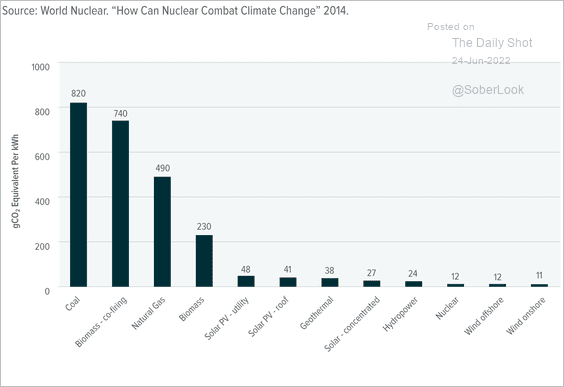
6. Global emissions by category:
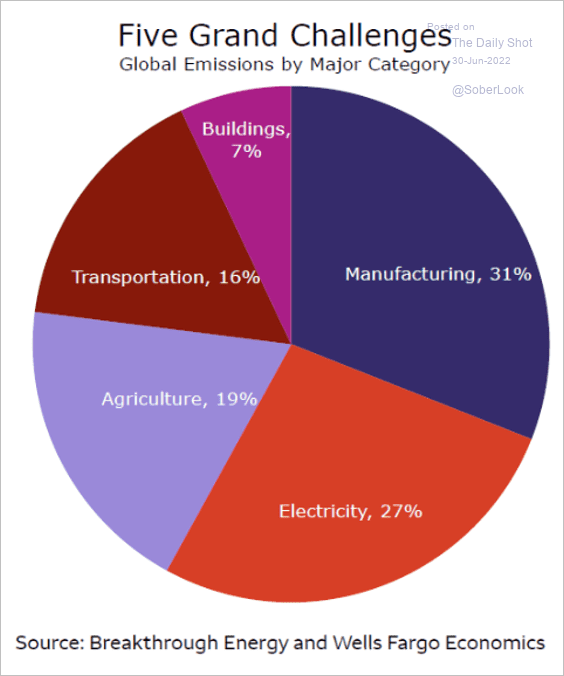 Source: Wells Fargo Securities
7. Betting markets’ probabilities for the 2024 Republican presidential nomination:
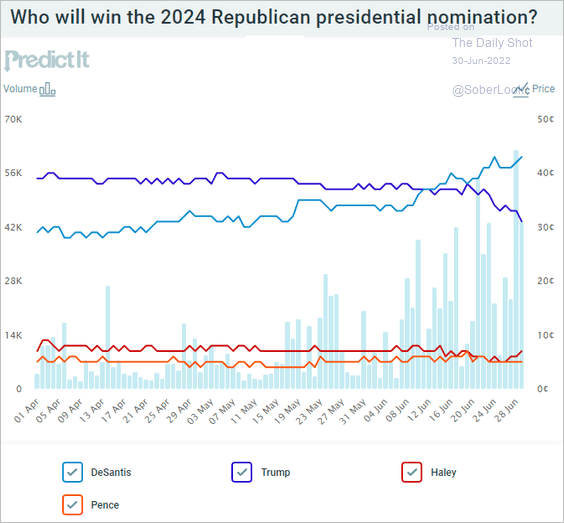 Source: @PredictIt
8. Best UK music act of the last 50 years:
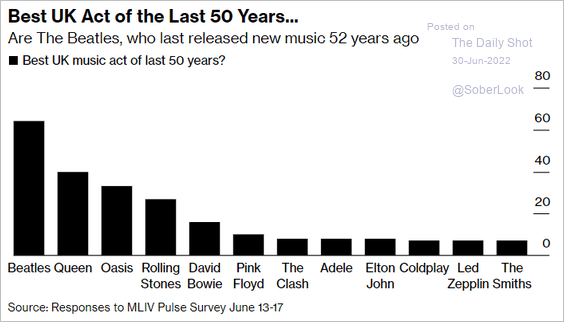 Source: @markets Read full article
——————–
Back to Index