
The Daily Shot: 01-Jun-22
• The United States
• Canada
• The United Kingdom
• The Eurozone
• Asia – Pacific
• China
• Emerging Markets
• Cryptocurrency
• Commodities
• Energy
• Equities
• Rates
• Global Developments
• Food for Thought
The United States
1. The Conference Board’s consumer confidence index was firmer than expected this month.
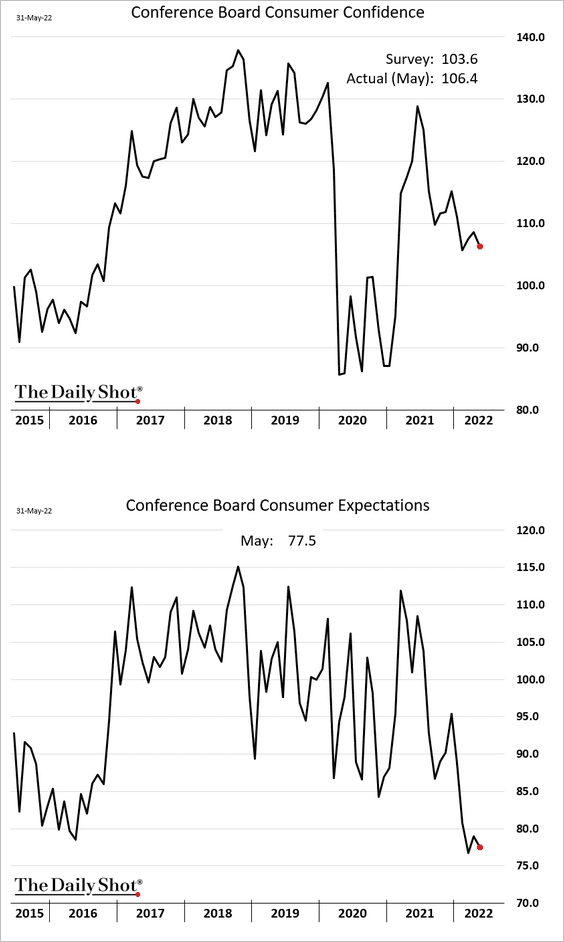
The gap between this index and the one from the University of Michigan continues to widen.
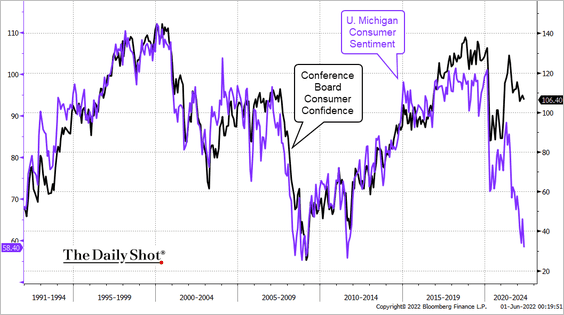 Source: @TheTerminal, Bloomberg Finance L.P.
Separately, the economic confidence index from Gallup hit the lowest level since the Financial Crisis.
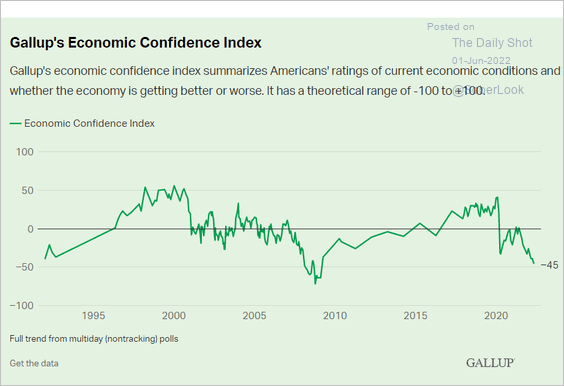 Source: Gallup
——————–
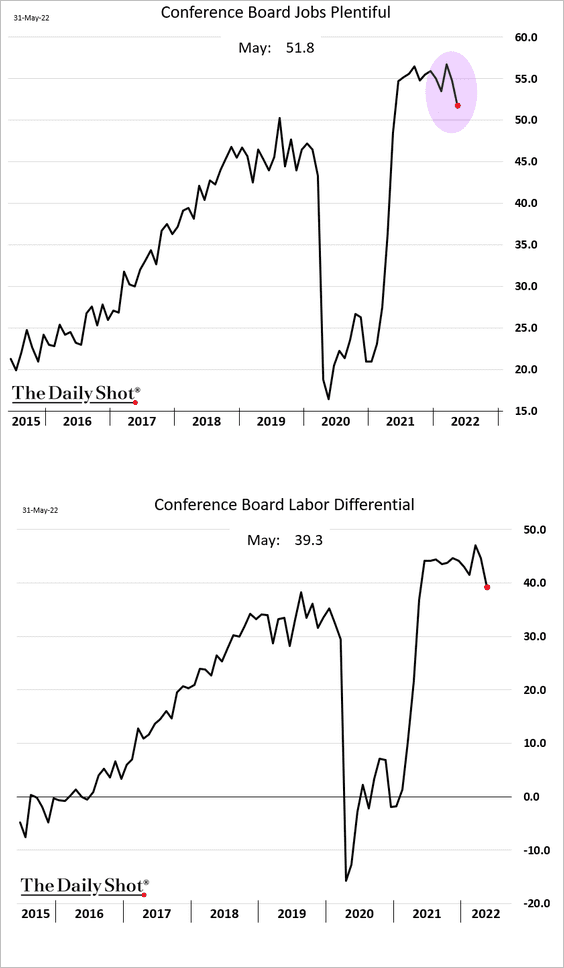
2. Various indicators point to slowing demand for labor.
• The Conference Board’s “jobs plentiful” index and the labor differential (“plentiful” – “hard to get”) hit the lowest level in a year (although both indicators are still very strong).
• Job openings are expected to ebb (2 charts).
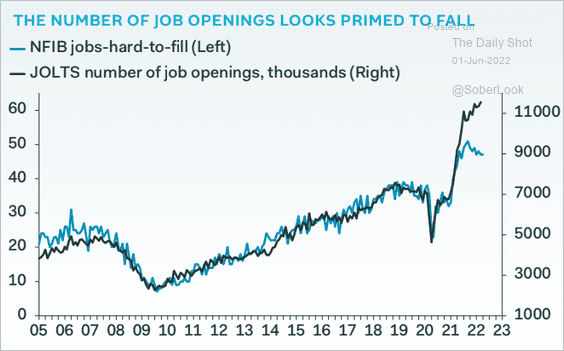 Source: Pantheon Macroeconomics
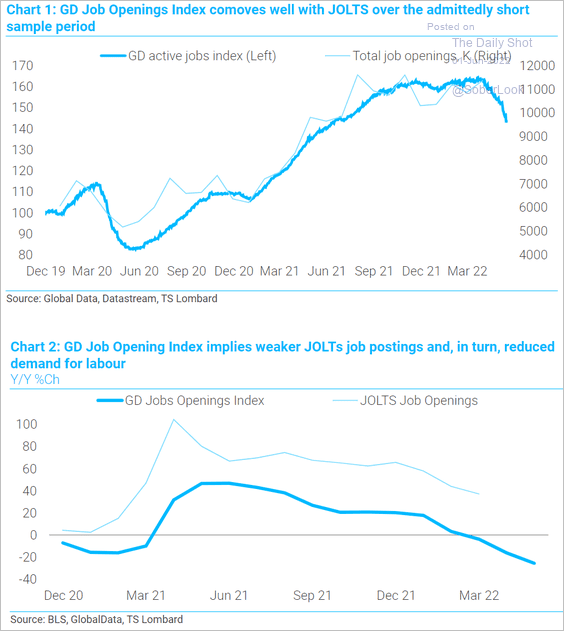 Source: TS Lombard
• Deteriorating small business sentiment suggests that hiring will slow.
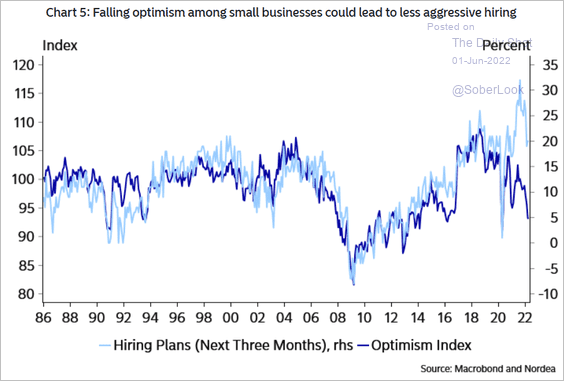 Source: Nordea Markets
——————–
3. This chart shows labor force participation changes by age vs. pre-COVID levels.
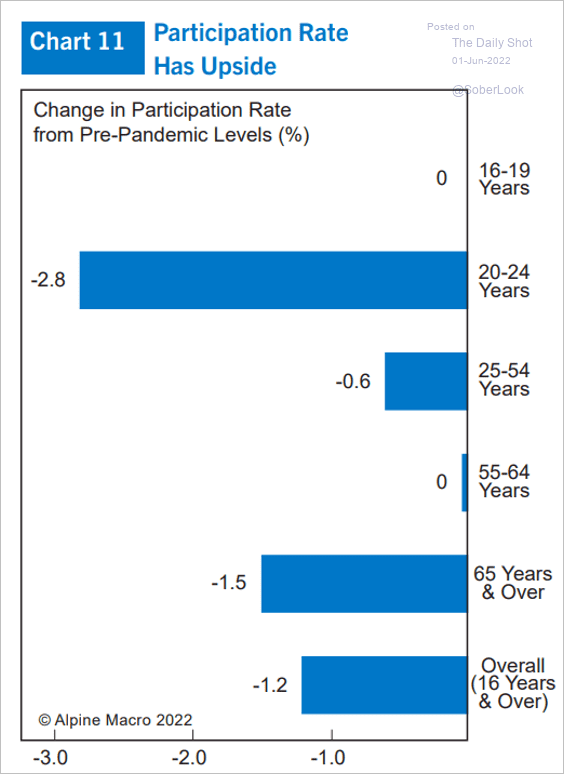 Source: Alpine Macro
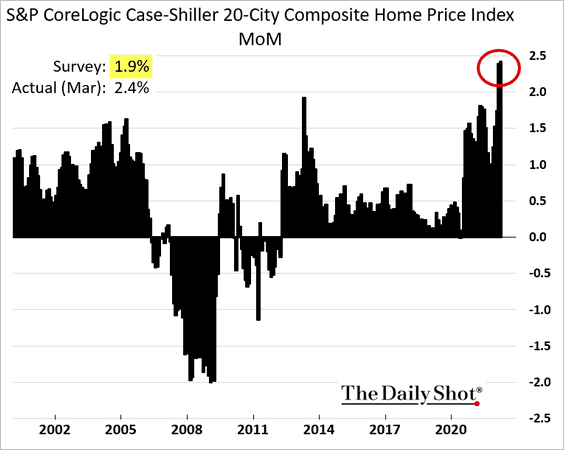
4. Next, we have some updates on the housing market.
• Home price appreciation hit a record high in March, exceeding 21%. This was likely the peak.

Here are the monthly price gains.
• Higher mortgage rates point to moderating home price appreciation.
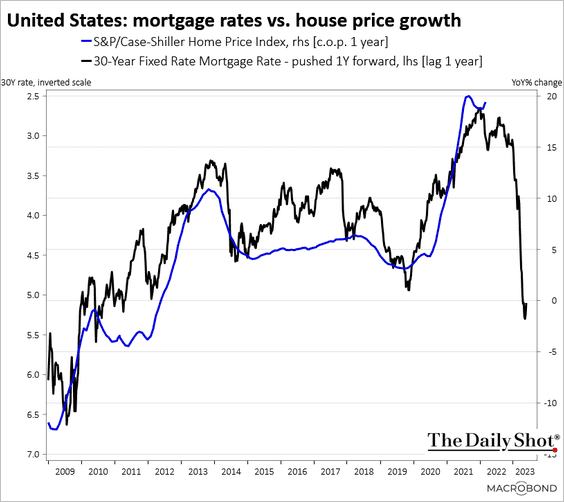 Source: Chart and data provided by Macrobond
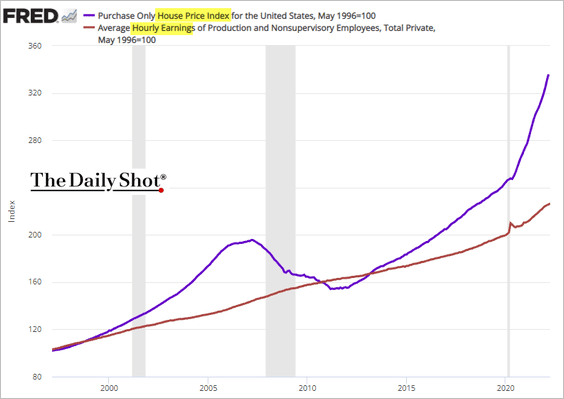
• The gap between home prices and wages continues to widen. This was sustainable when mortgage rates dipped below 3%, but not now.
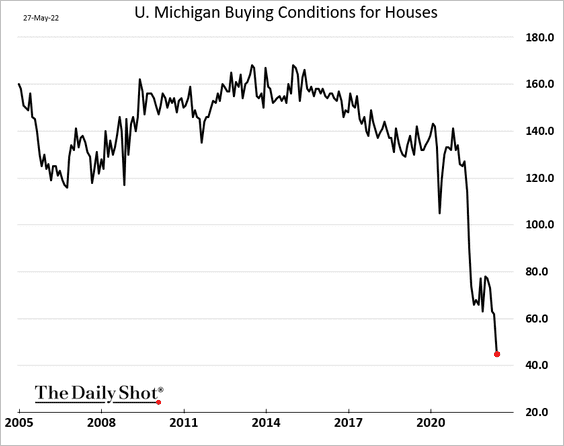
• The U. Michigan index of buying conditions for houses (based on consumer sentiment) has collapsed.
• Housing demand continues to ease, …
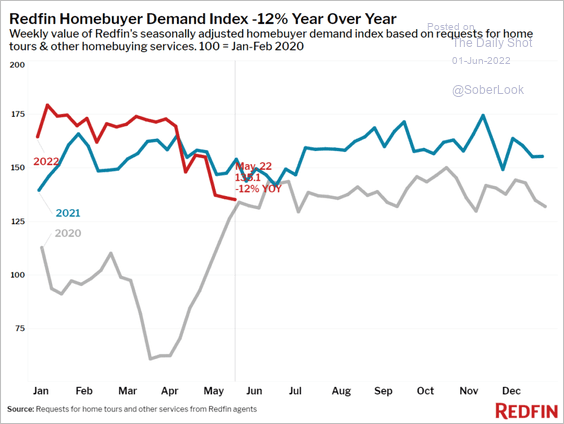 Source: Redfin
… forcing more sellers to cut prices.
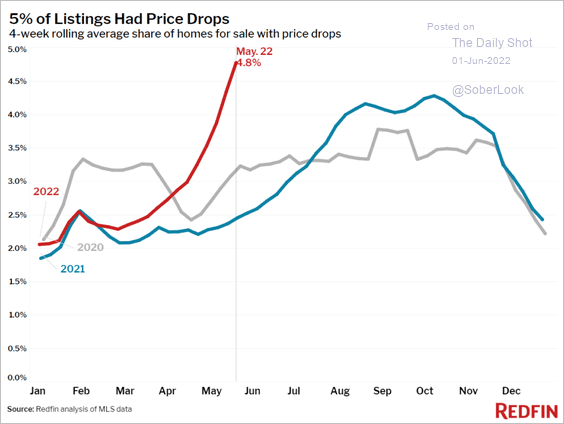 Source: Redfin
• Homebuilder sales are falling quickly, according to Evercore ISI.
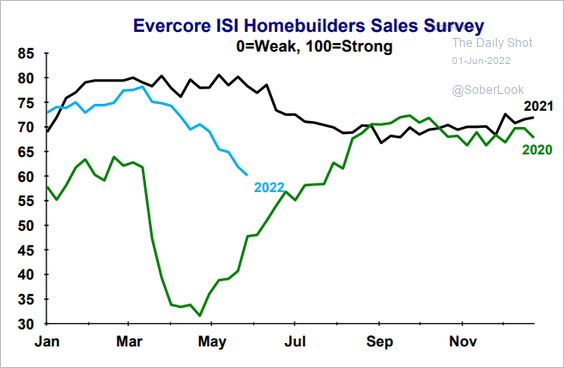 Source: Evercore ISI Research
——————–
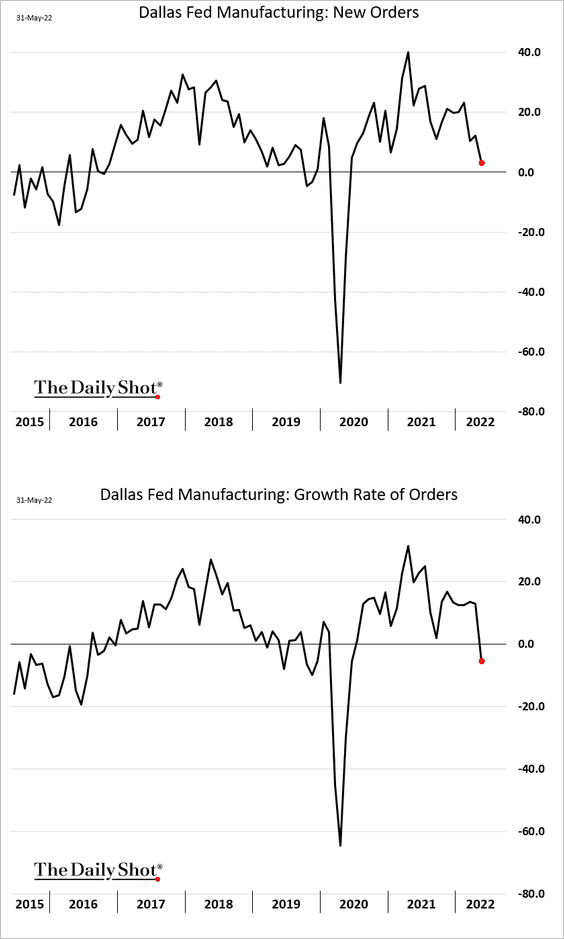
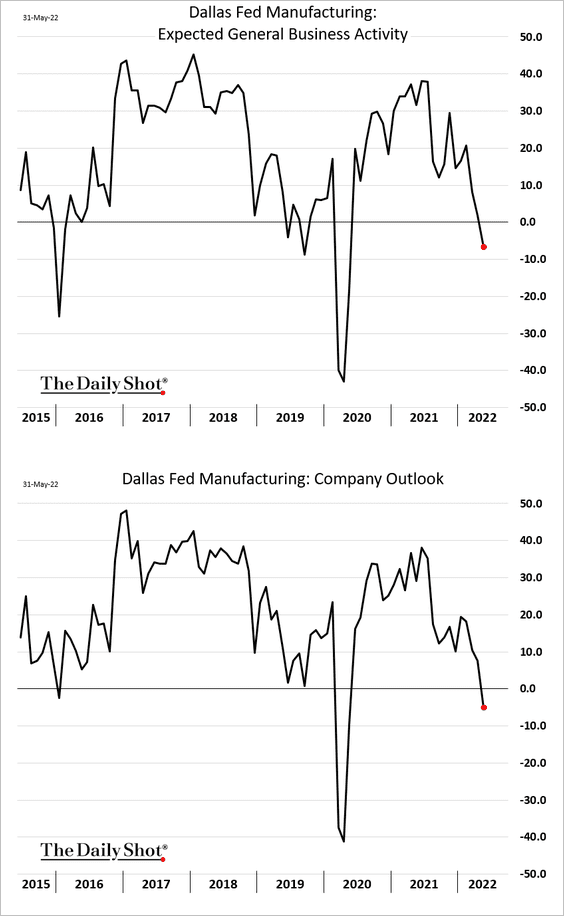
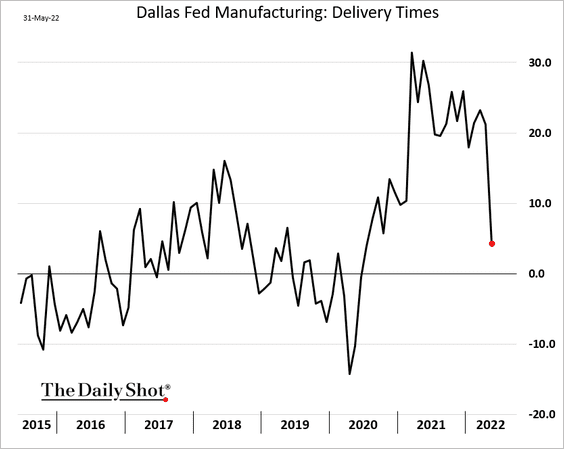
5. The Dallas Fed’s regional manufacturing index showed slowing factory activity in May.
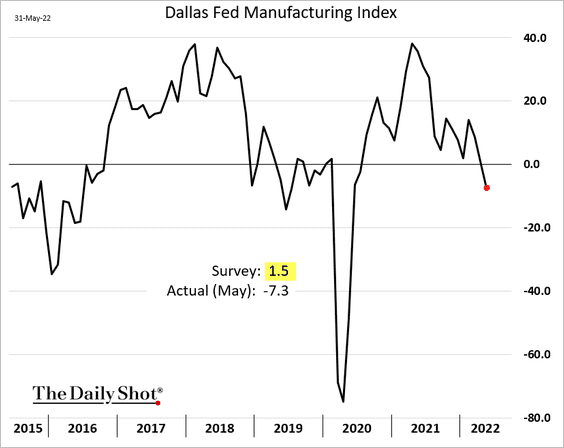
• Demand has been weakening.
• Business outlook has deteriorated.
• Supply bottlenecks are rapidly disappearing.
Separately, the regional Fed manufacturing reports point to a substantial decline in the ISM Manufacturing PMI (at the national level).
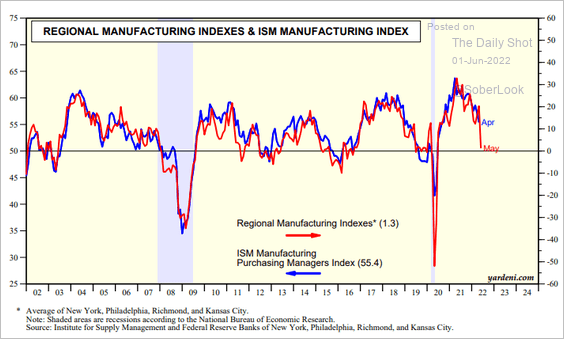 Source: Yardeni Research
——————–
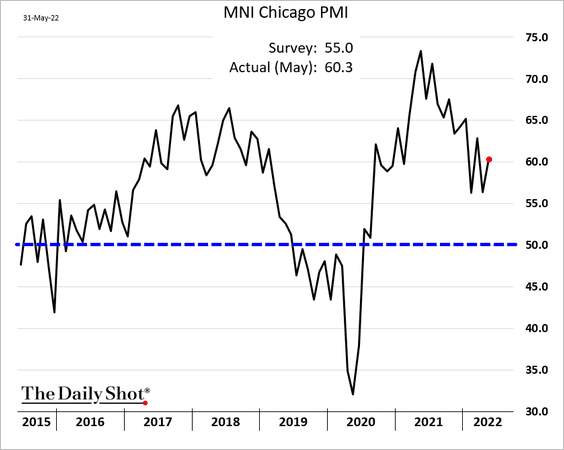
6. The Chicago PMI index was stronger than expected, with Midwest business activity holding up well in May.
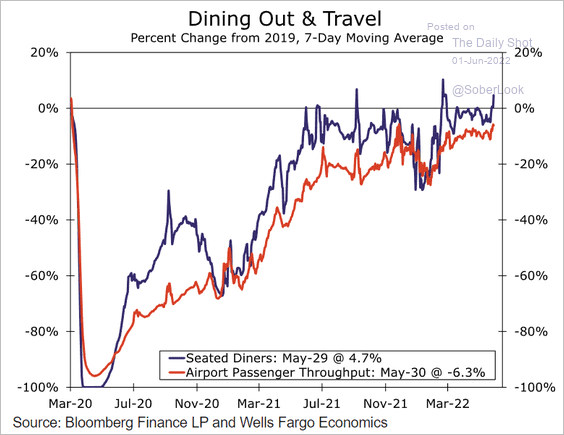
7. Mobility has been improving.
 Source: Wells Fargo Securities
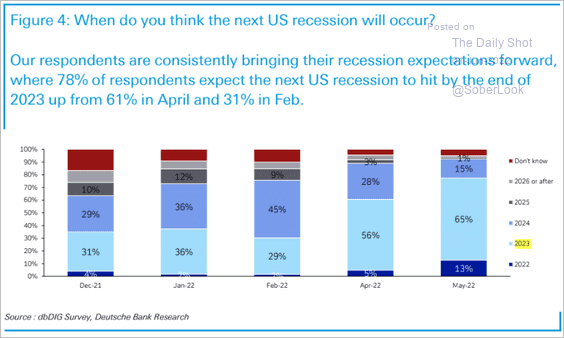
8. When should we expect the next recession? Here is a survey from Deutsche Bank.
 Source: Deutsche Bank Research
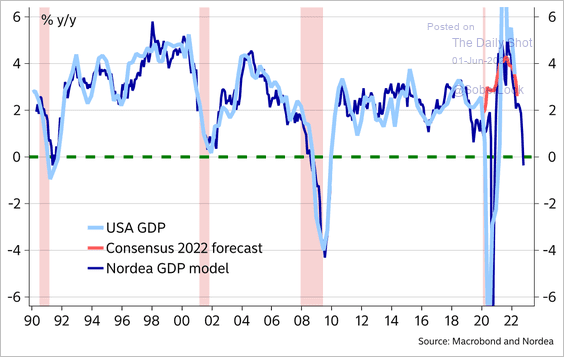
Nordea’s GDP model signals a recession within a year.
 Source: @MikaelSarwe
Back to Index
Canada
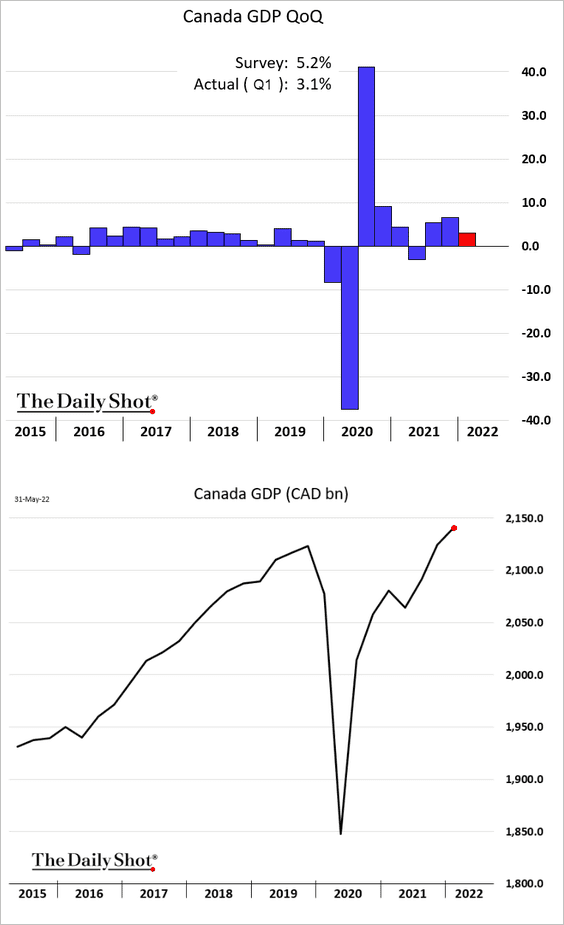
1. The Q1 GDP report was a bit disappointing.
2. Canada’s labor market recovery continues to outpace the US.
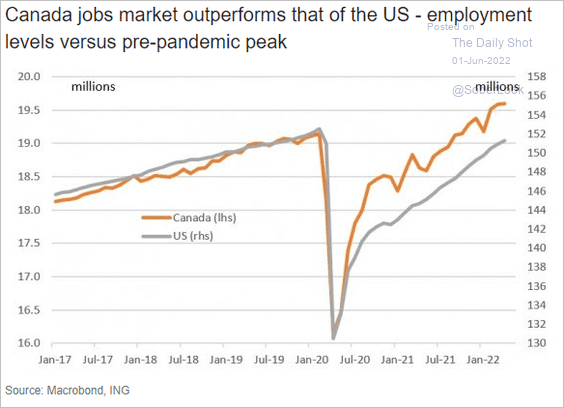 Source: ING
Back to Index
The United Kingdom
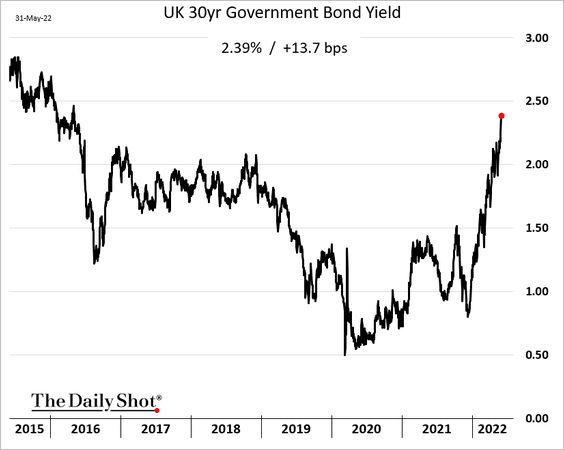
1. Longer-dated gilt yields are surging.
 Source: Nasdaq Read full article
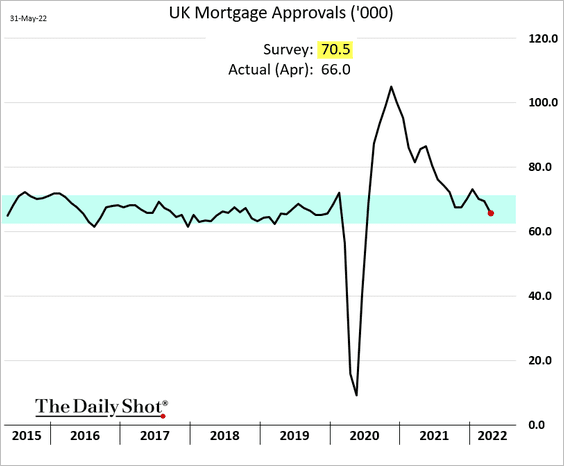
2. Consumer credit growth was firmer than expected in April.

But mortgage approvals continue to ease.
——————–
3. Households keep adding to their savings.
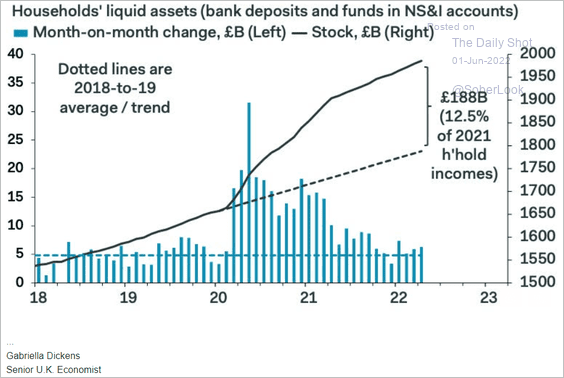 Source: Pantheon Macroeconomics
4. Labor market participation remains depressed.
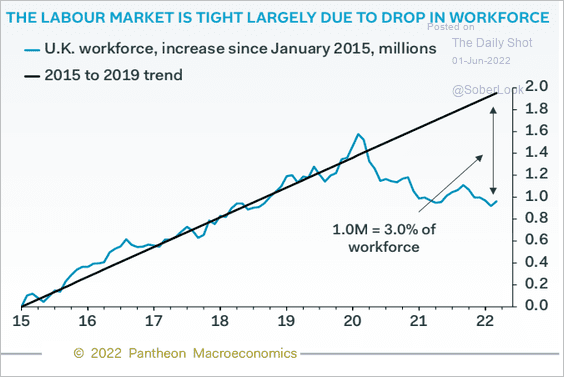 Source: Pantheon Macroeconomics
This chart shows the breakdown of inactivity, by reason.
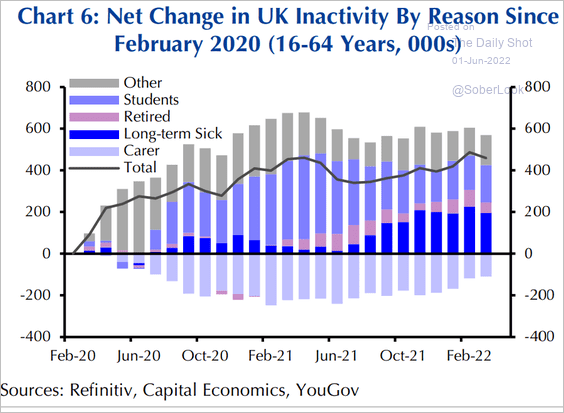 Source: Capital Economics
Back to Index
The Eurozone
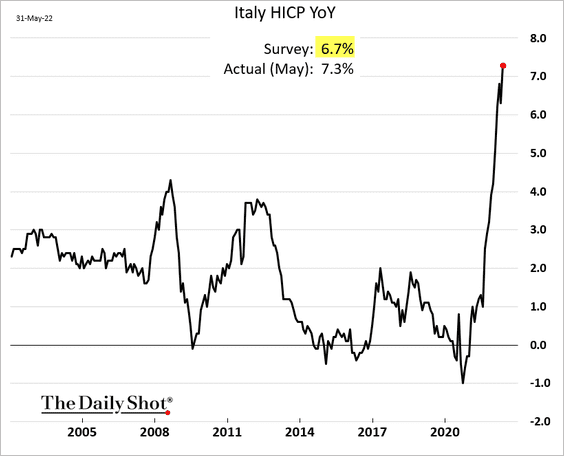
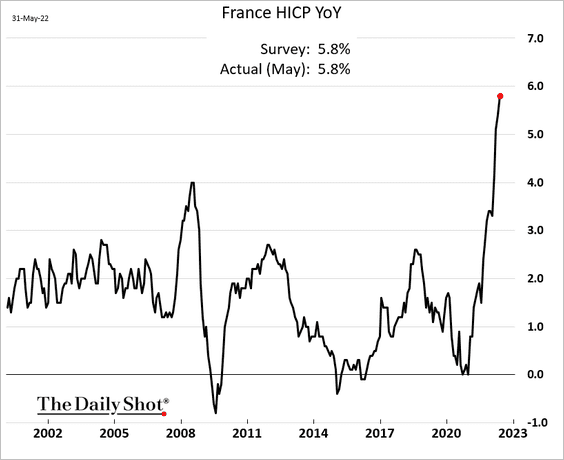
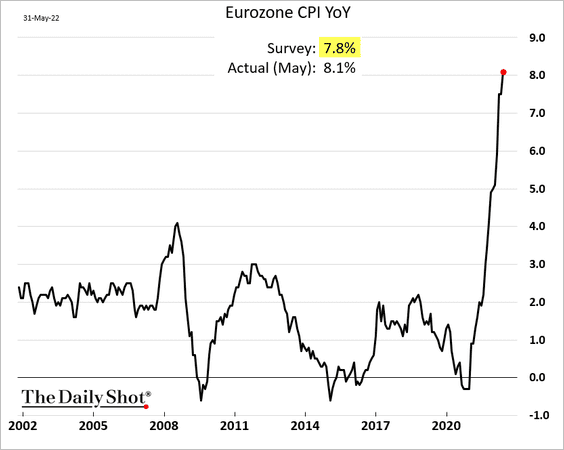
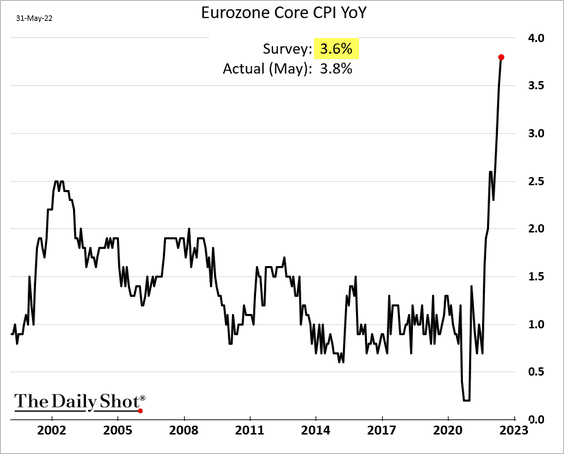
1. Inflation reports continue to show extreme price pressures, with CPI data surprising to the upside.
• Italy:
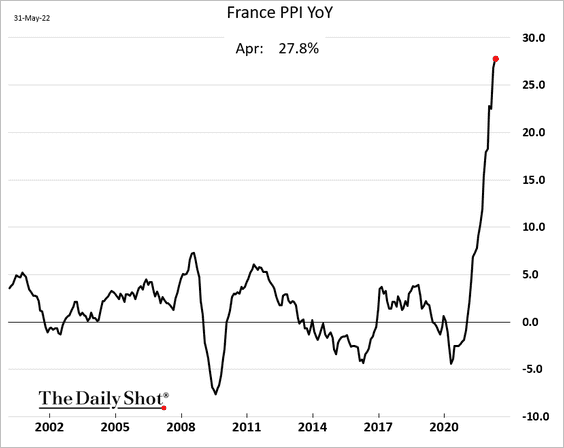
• France:
• The Eurozone headline CPI:
• The Eurozone core CPI:
Here are the contributions.
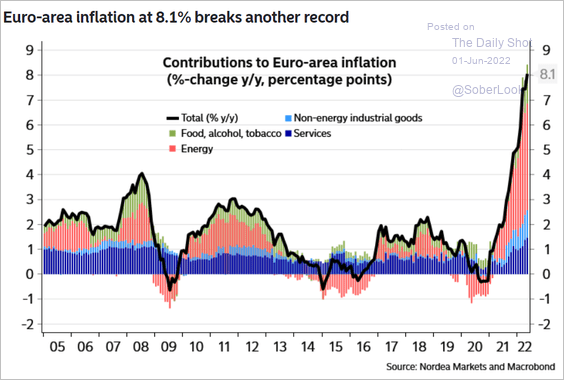 Source: Nordea Markets
And this chart shows the number of CPI components rising faster than 4%.
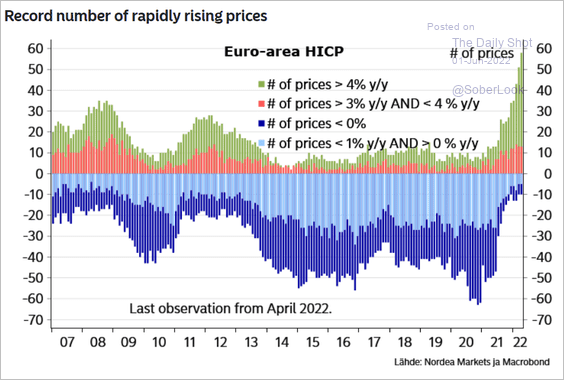 Source: Nordea Markets
2. The ECB’s inflation forecast is once again way off the mark.
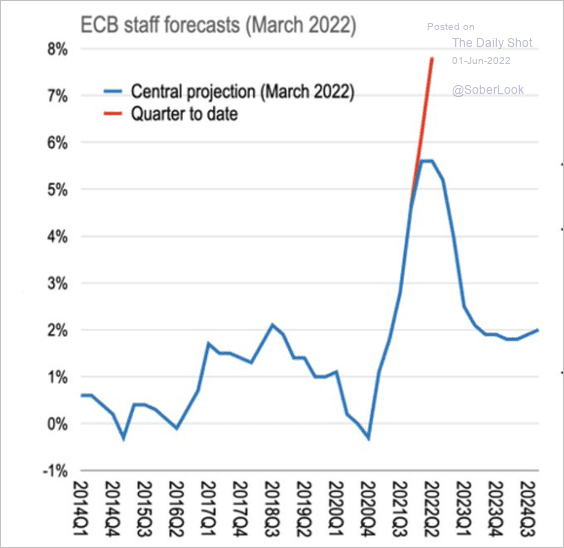 Source: @jnordvig, @ExanteData, @GeneralTheorist
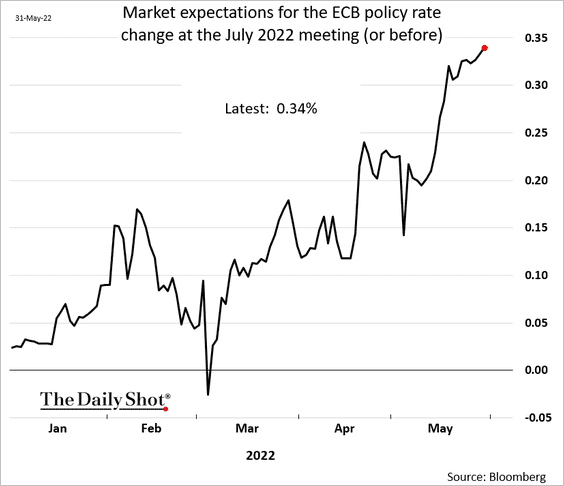
The market is now pricing in a 0.34% rate hike in July (higher probability of a 50 bps hike).
——————–
3. French consumer spending on goods continues to deteriorate. Is France in a recession?
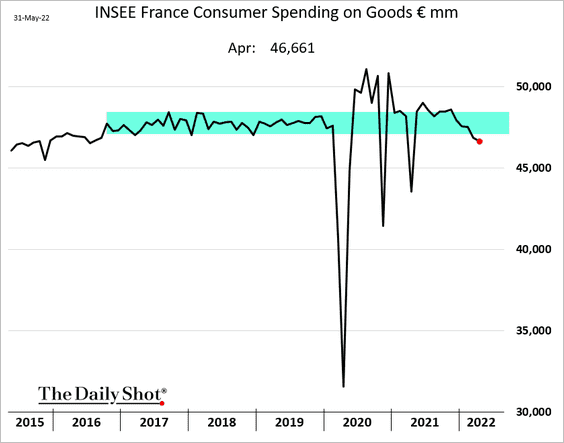
 Source: ING Read full article
By the way, here is the French PPI.
——————–
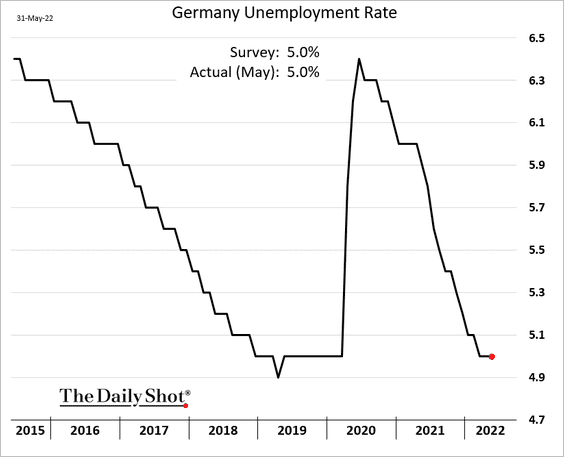
4. Germany’s unemployment rate is holding at 5%.
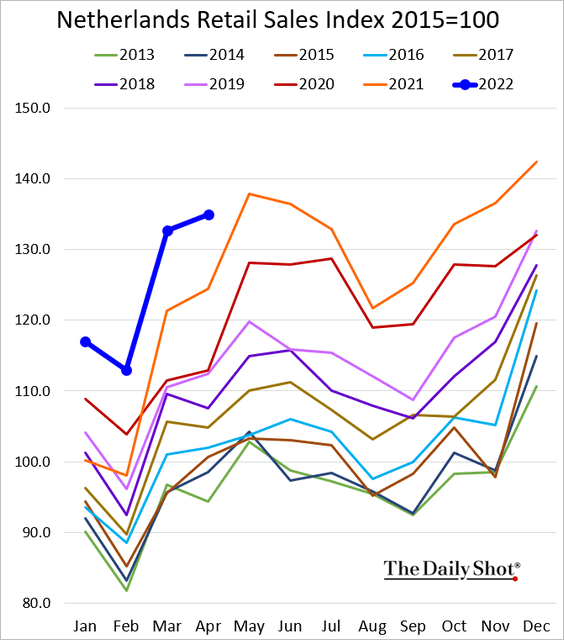
5. Dutch retail sales were strong in April.
Back to Index
Asia – Pacific
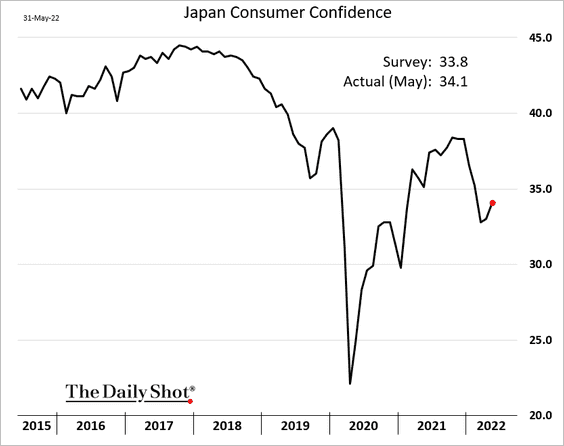
1. Japan’s consumer confidence improved last month.
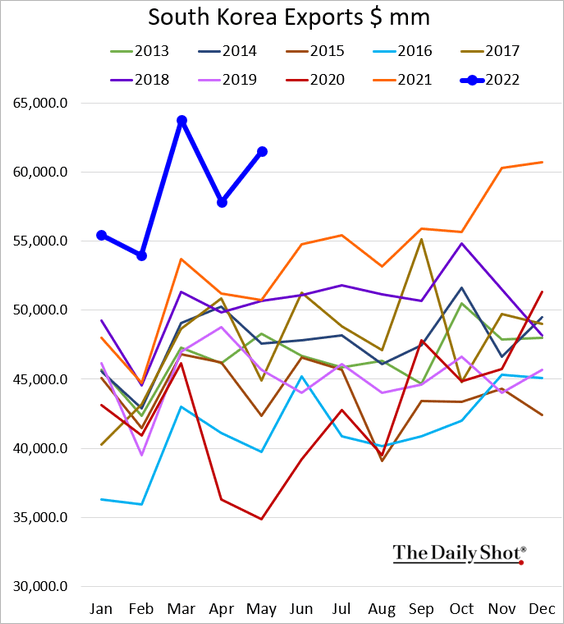
2. South Korea’s exports jumped in May.
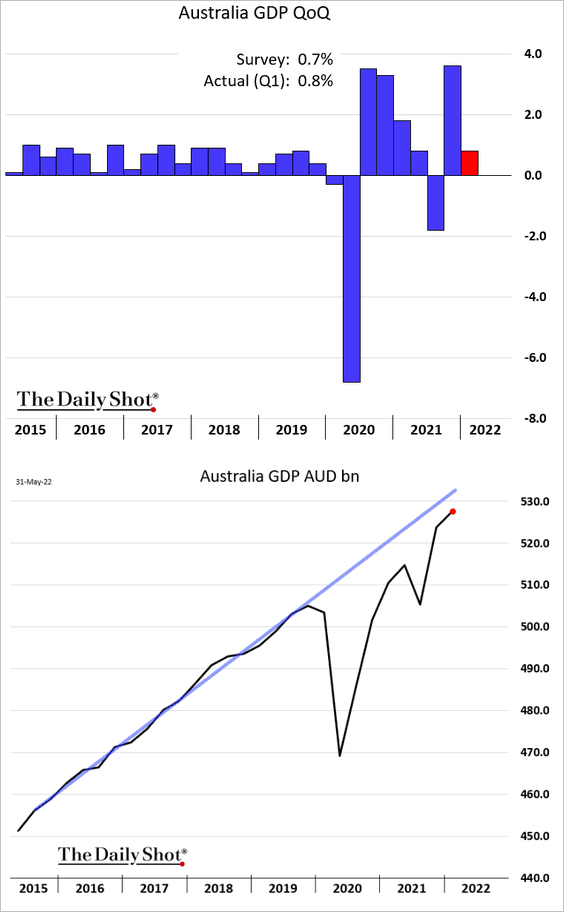
3. Australia’s Q1 GDP growth was a bit firmer than expected.
Back to Index
China
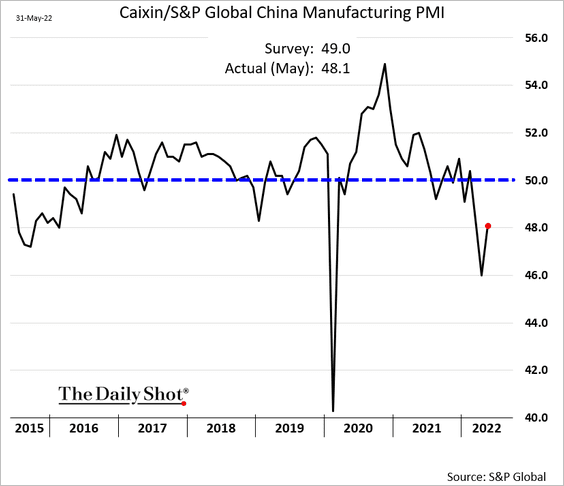
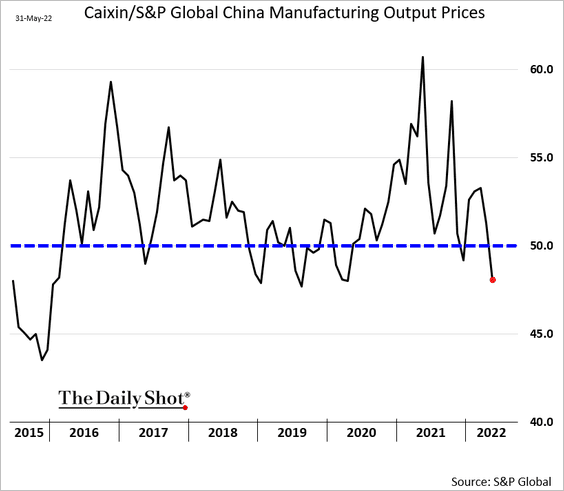
1. Ths Caixin Manufacturing PMI showed that factory activity was still very weak in May (below estimates).
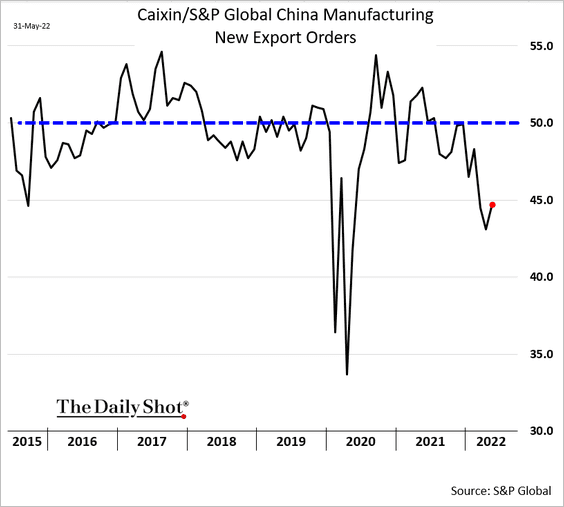
Export orders continue to deteriorate.
Price pressures have dissipated.
——————–
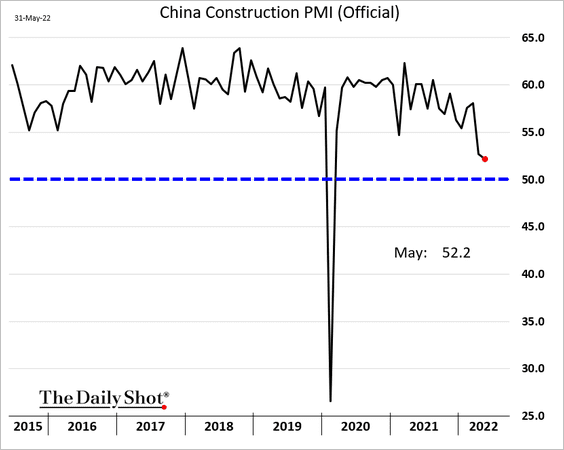
2. Construction activity is still in growth mode, according to official PMI data, but has been slowing rapidly.
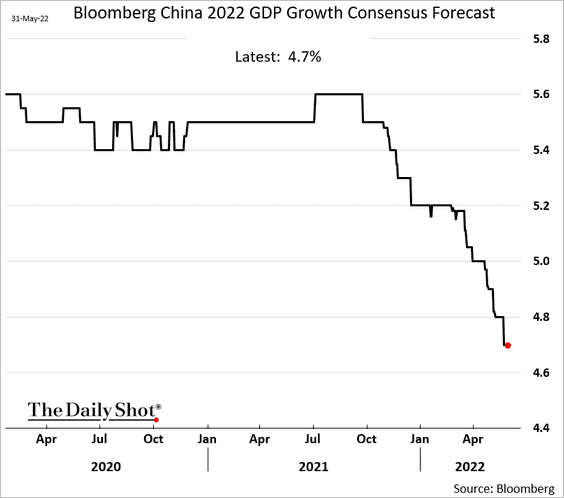
3. Economists continue to downgrade their GDP growth projections for 2022.
4. Exposure to Chinese assets via UCITS ETFs has grown significantly over the past five years.
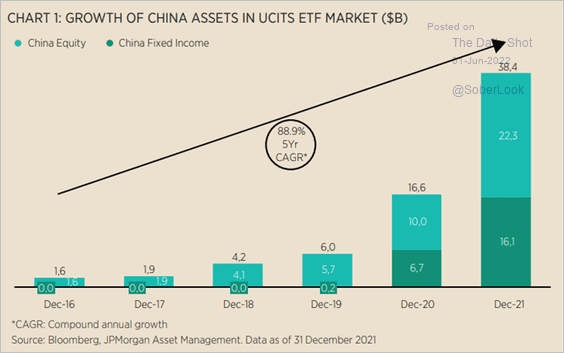 Source: J.P. Morgan Asset Management
5. The sector composition of China’s benchmark onshore equity index has shifted toward consumption and innovation, and away from export-oriented sectors such as industrial and manufacturing.
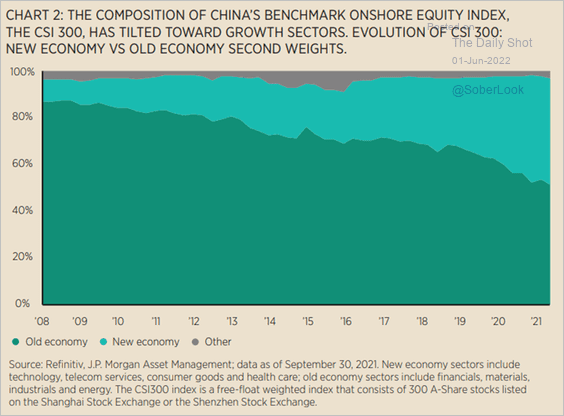 Source: J.P. Morgan Asset Management
6. With uncertainty elevated, companies shifted to short-term financing.
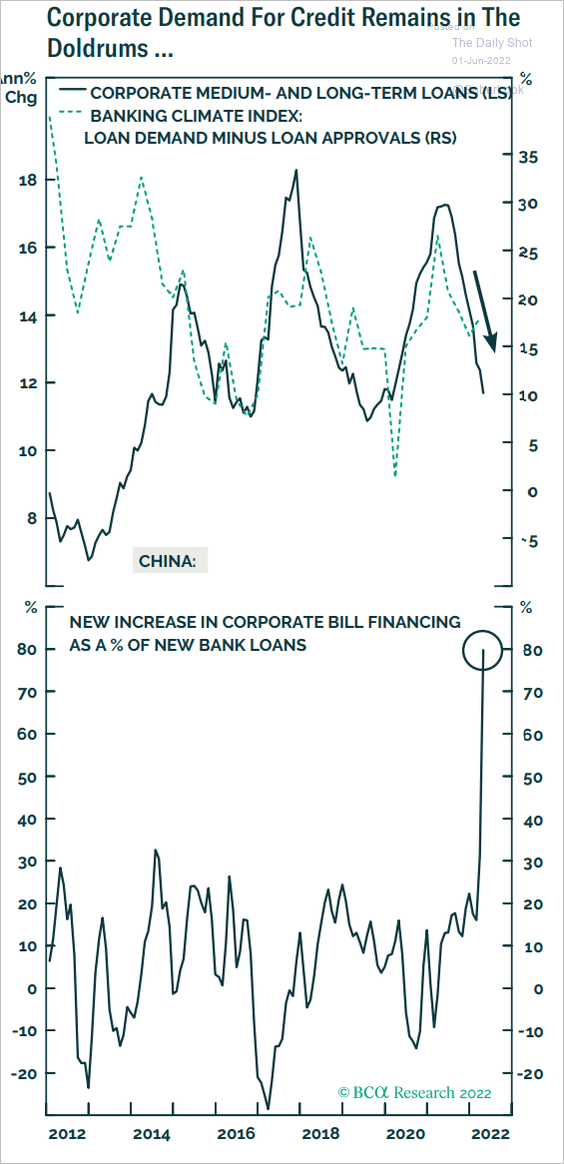 Source: BCA Research
Back to Index
Emerging Markets
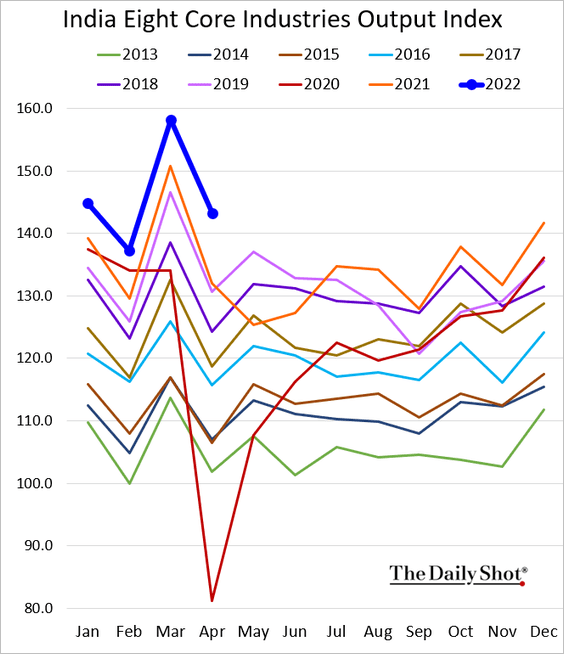
1. India’s core industries’ activity held up well in April.
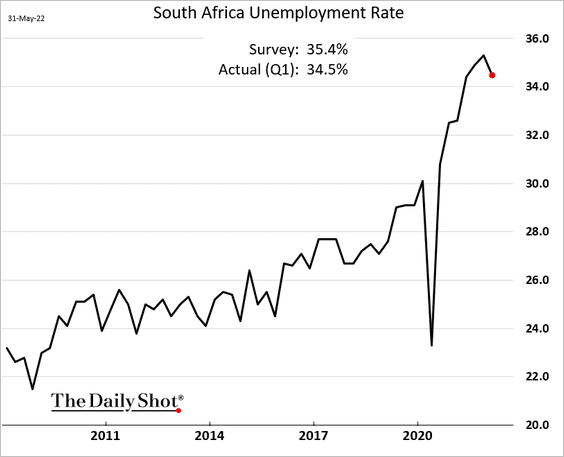
2. South Africa’s unemployment appears to have peaked.
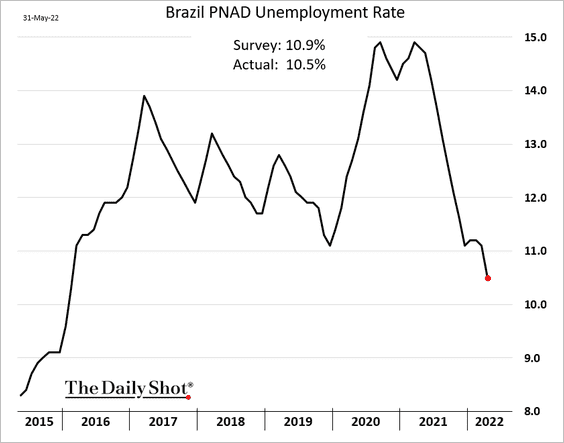
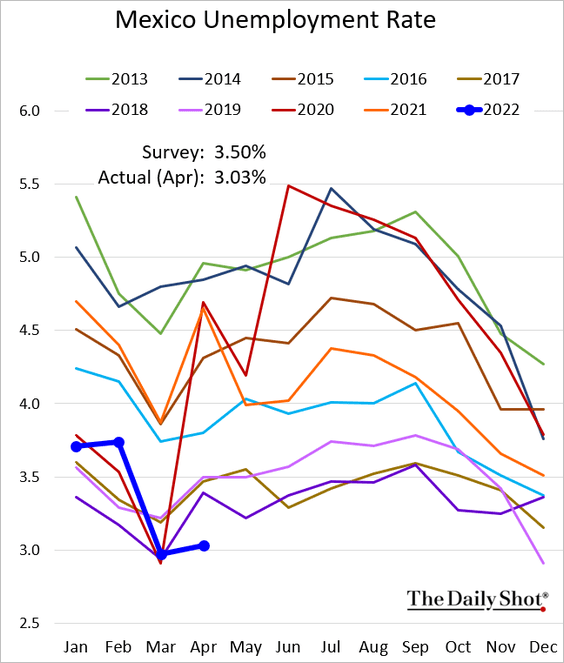
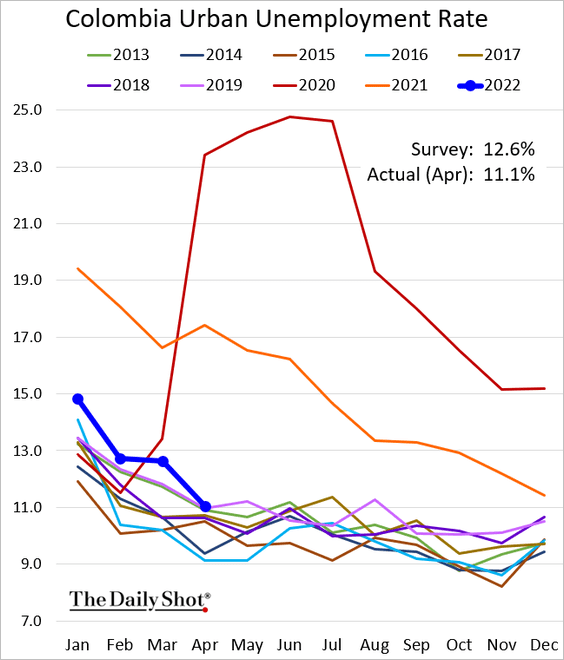
3. LatAm labor markets continue to improve.
• Brazil’s unemployment rate:
• Mexico’s unemployment (very low):
• Colombia’s unemployment rate (back at 2019 levels):
——————–
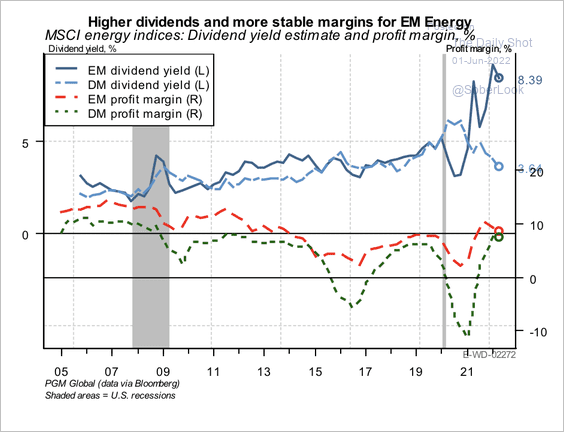
4. EM energy stocks have lagged the upside in oil prices.
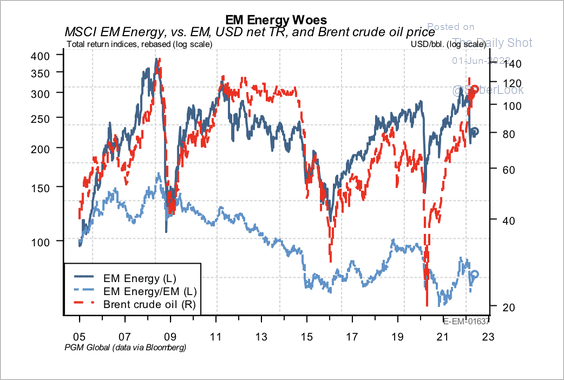 Source: PGM Global
EM energy stocks have higher dividends and more stable margins relative to their developed market peers.
 Source: PGM Global
Back to Index
Cryptocurrency
1. Bitcoin’s weekend price bounce above $30K triggered a rise in short liquidations.
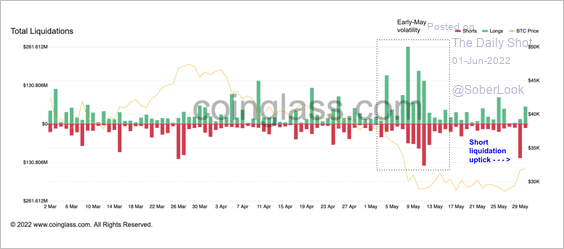 Source: Coinglass Read full article
2. Bitcoin’s market cap relative to the total crypto market cap has declined. That’s partly because of the growth of other digital assets over the years.
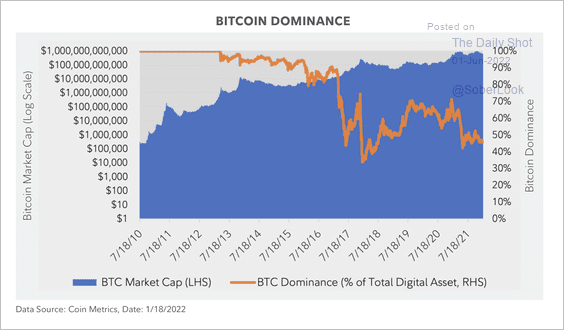 Source: Fidelity Digital Assets
Fidelity views bitcoin as a monetary good.
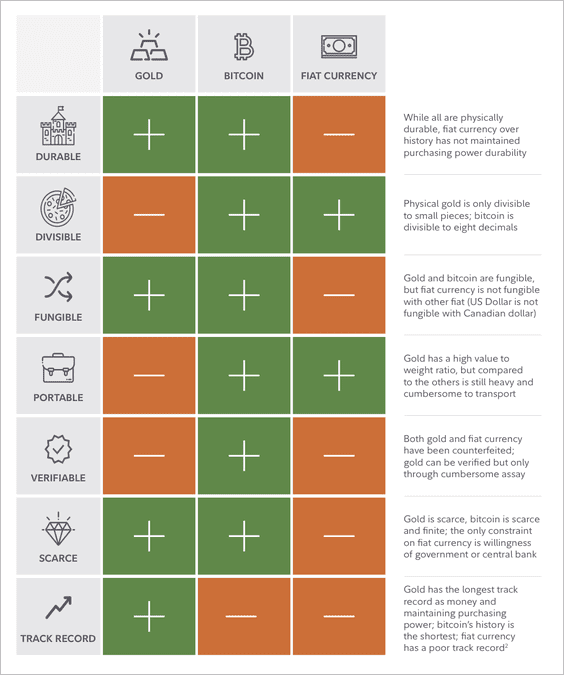 Source: Fidelity Digital Assets
Back to Index
Commodities
1. Wheat tumbled on news from Russia.
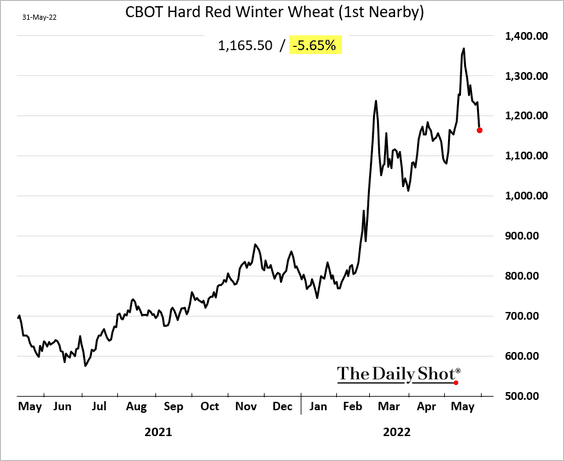
 Source: Reuters Read full article
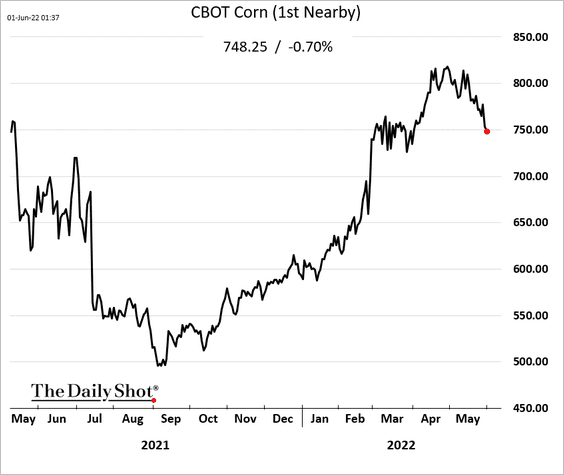
Corn is also rolling over.
This chart shows the planting conditions for US grains.
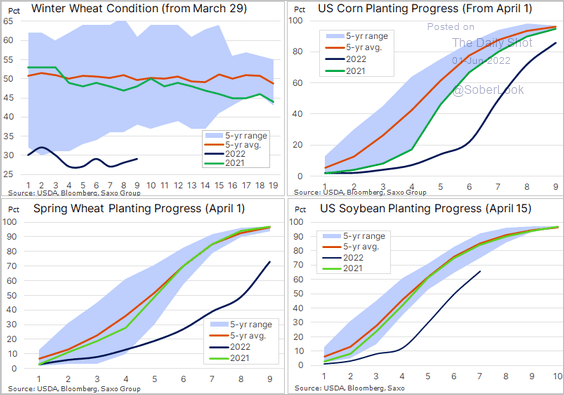 Source: @Ole_S_Hansen
——————–
2. Speculators have reduced their net-long positions in gold futures. Meanwhile, gold holdings among ETFs are stabilizing.
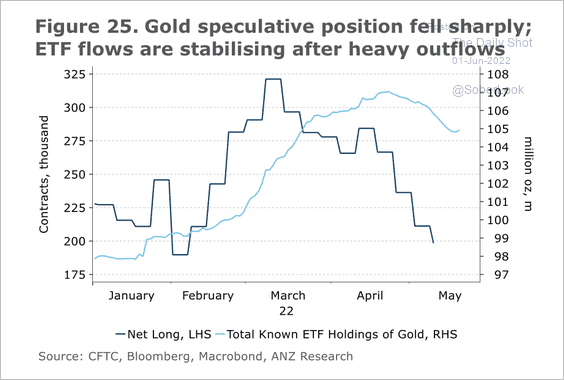 Source: @ANZ_Research
3. Iron ore exports from Brazil and Australia are recovering.
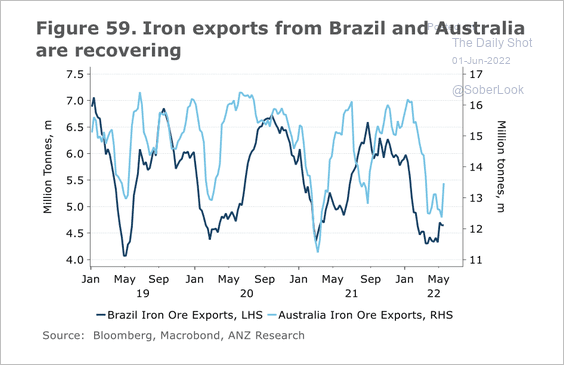 Source: @ANZ_Research
Back to Index
Energy
1. Brent held resistance at $125/bbl.
 Source: @TheTerminal, Bloomberg Finance L.P.
Oil is trading at a substantial premium to “fair value,” according to Numera Analytics.
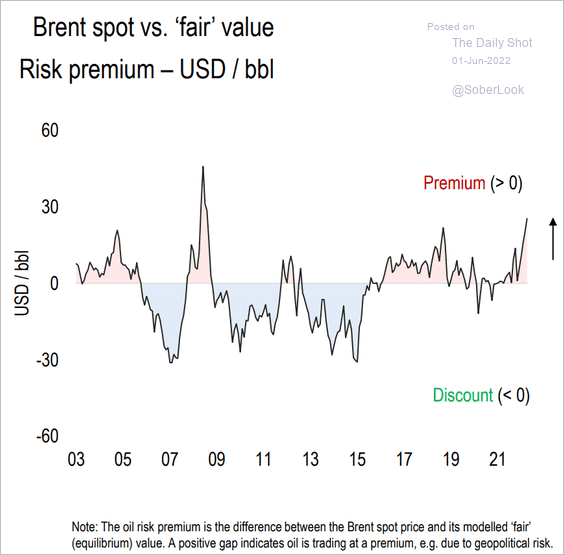 Source: Numera Analytics
——————–
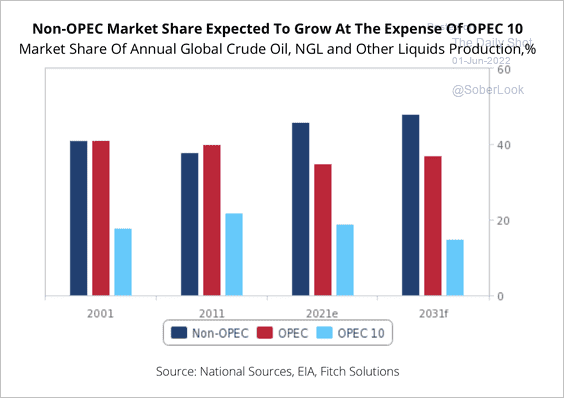
2. US oil production growth is expected to exceed OPEC+ growth over the next decade.
 Source: Fitch Solutions Macro Research
The 10 non-OPEC producers making up OPEC+ could see their share of global oil production shrink over the next decade.
 Source: Fitch Solutions Macro Research
——————–
3. Russia has been shifting its oil customer base.
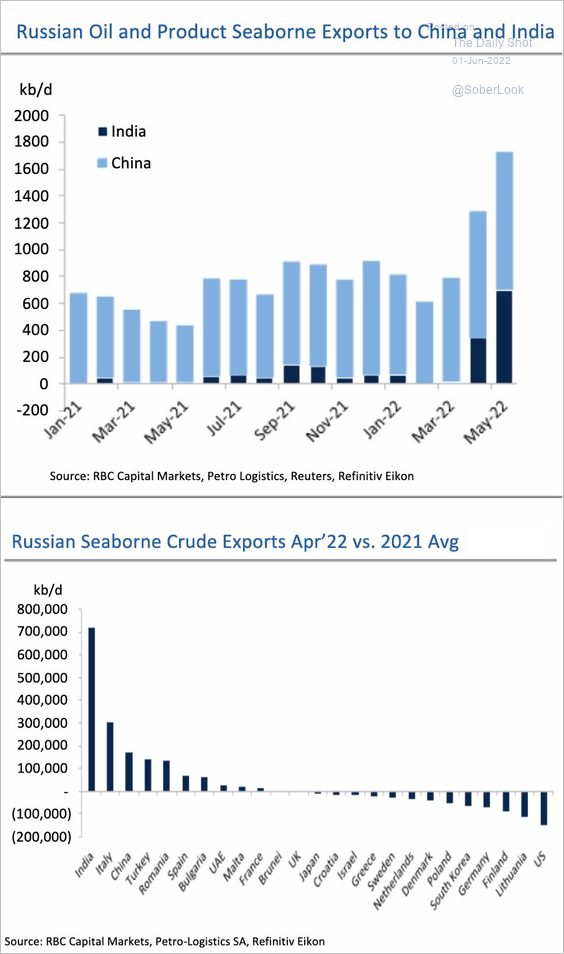 Source: RBC Capital Markets
4. Jet fuel demand is stabilizing, albeit still below pre-pandemic levels.
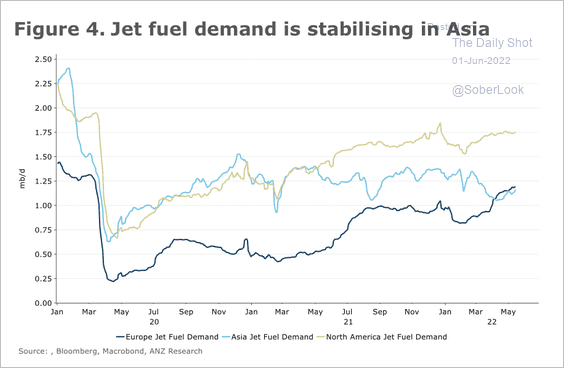 Source: @ANZ_Research
Back to Index
Equities
1. US households haven’t been this gloomy on stocks in about a decade, according to the Conference Board.

2. The number of firms in the Nasdaq Composite index is nearing levels last seen during the dot-com bust.
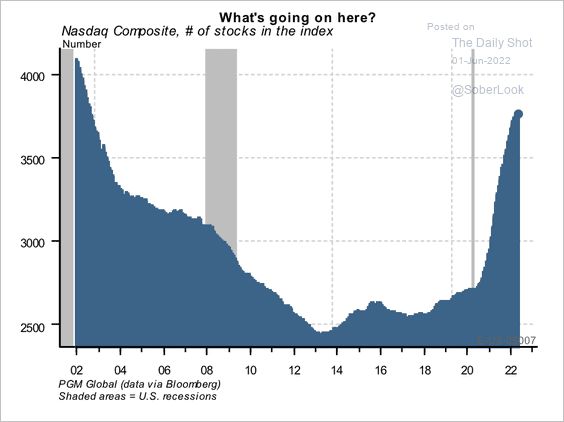 Source: PGM Global
Has there been an infiltration of low-quality firms? (2 charts)
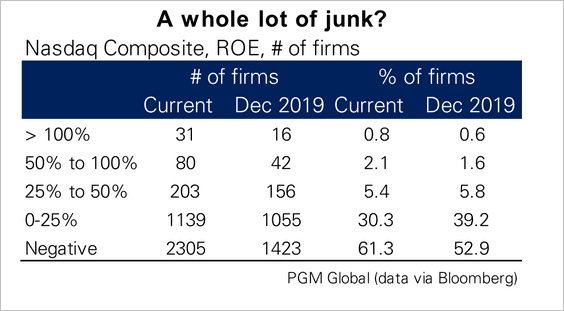 Source: PGM Global
 Source: PGM Global
——————–
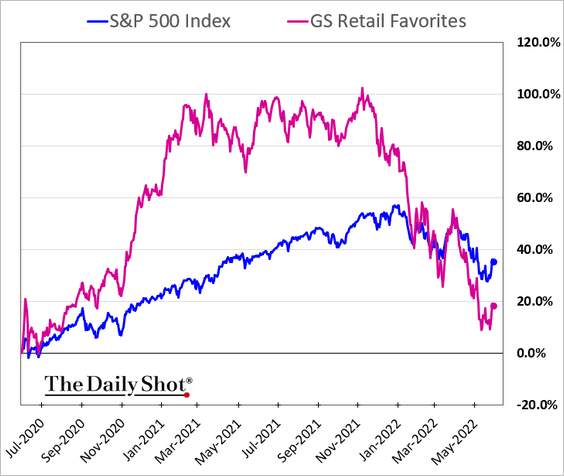
3. Retail investors have sold equity purchases made over the past two years.
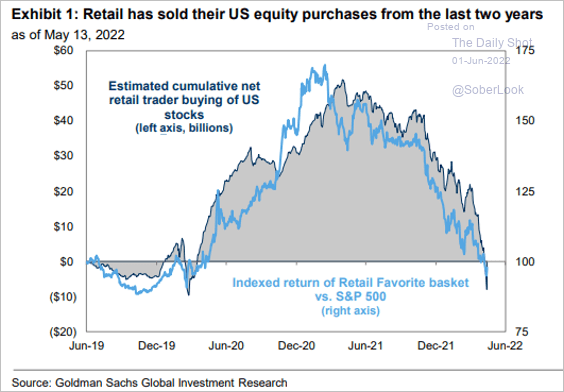 Source: Goldman Sachs; @MikeZaccardi
Here is the GS retail favorites index.
——————–
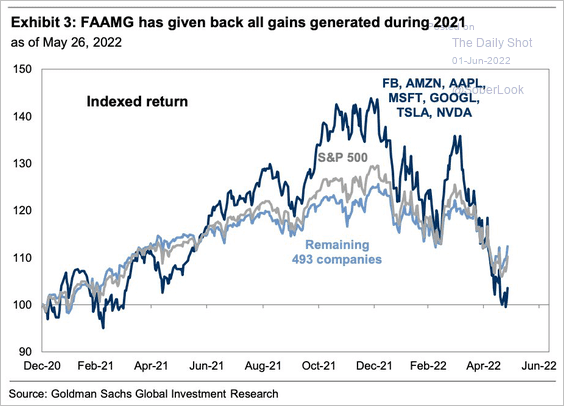
4. Tech mega-caps have given up their 2021 gains.
 Source: Goldman Sachs; @SamRo
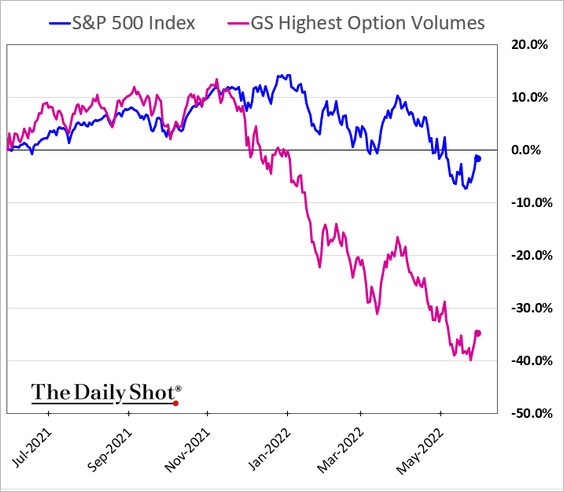
5. Stocks with high option volumes continue to underperform.
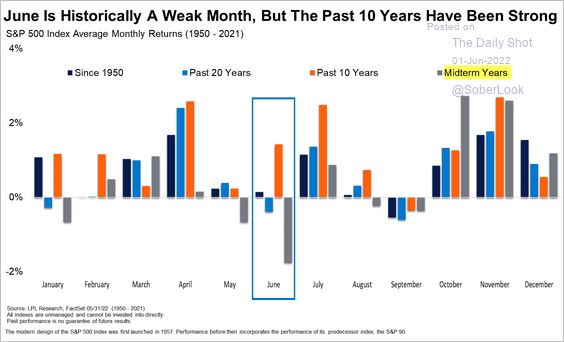
6. June tends to be a weak month during midterm election years.
 Source: LPL Research
7. More S&P 500 stocks are moving closely with the index.
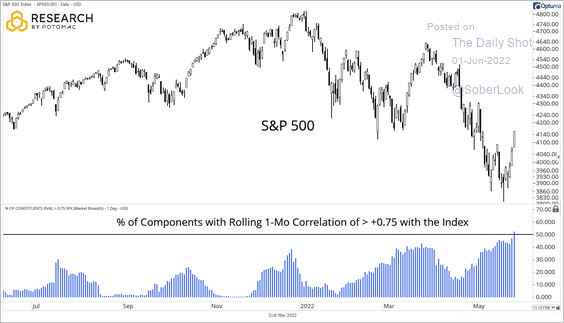 Source: @DrewTheCharts
8. The S&P500 has historically exhibited greater than 10% drawdowns quite a few times (16 times since 1959) without the US economy experiencing a recession.
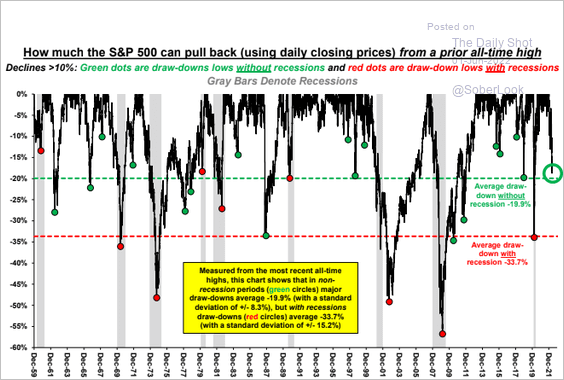 Source: Stifel
9. Here are the sectors with the highest short interest (as of the 25th of May).
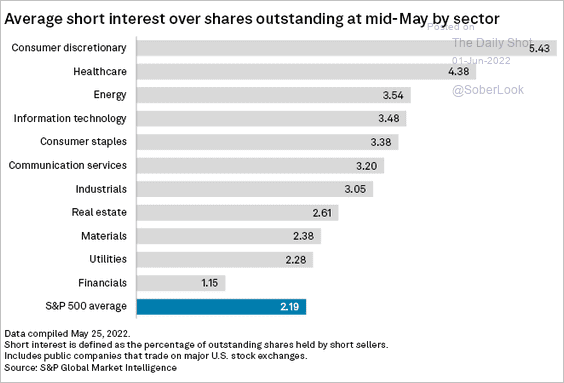 Source: S&P Dow Jones Indices
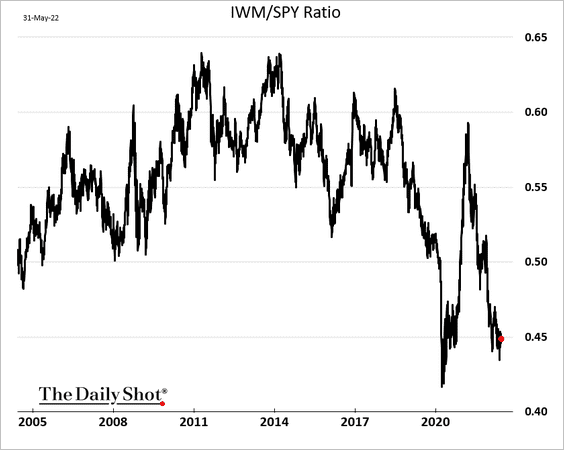
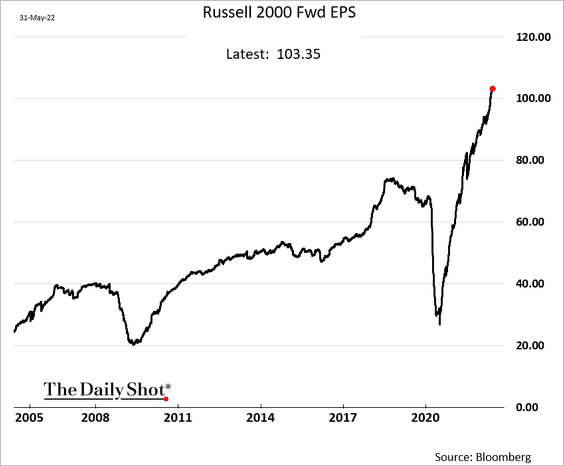
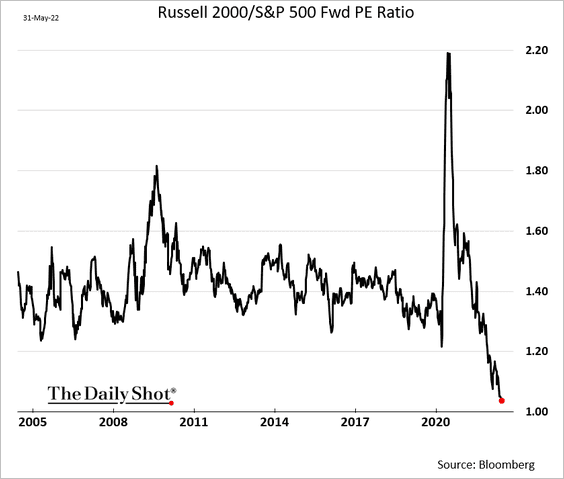
10. Next, we have some updates on US small caps (Russell 2000).
• Russell 2000 (IWM) relative performance vs. S&P 500 (SPY):
• Earnings-per-share expectations:
• Relative forward P/E ratio (small caps look cheap):
• Russell 2000 pullbacks:
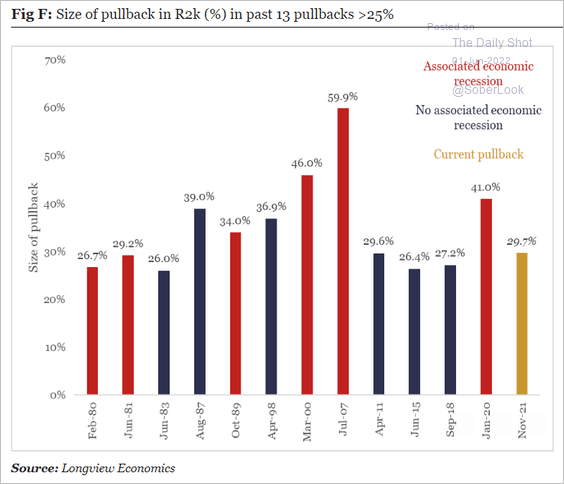 Source: Longview Economics
——————–
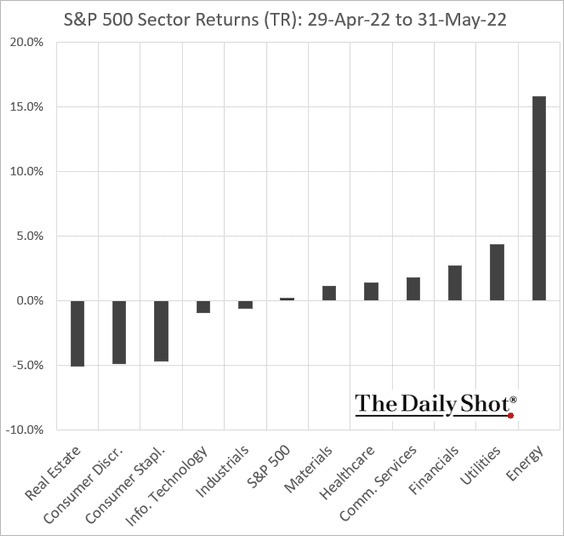
11. Here is the performance by sector in May.
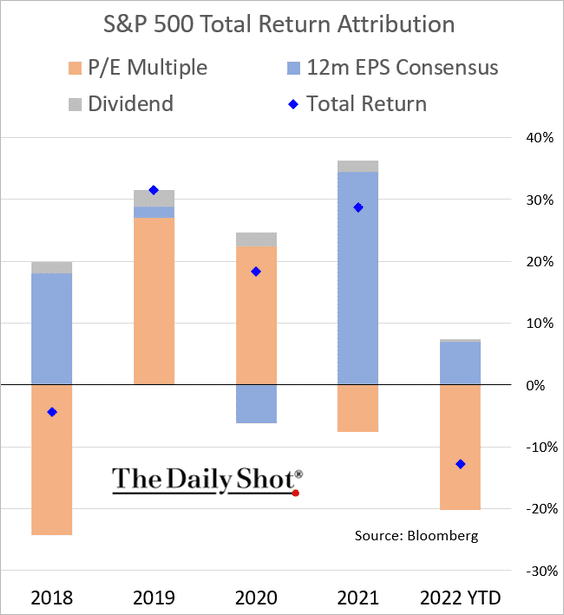
12. Finally, we have the S&P 500 year-to-date performance attribution.
Back to Index
Rates
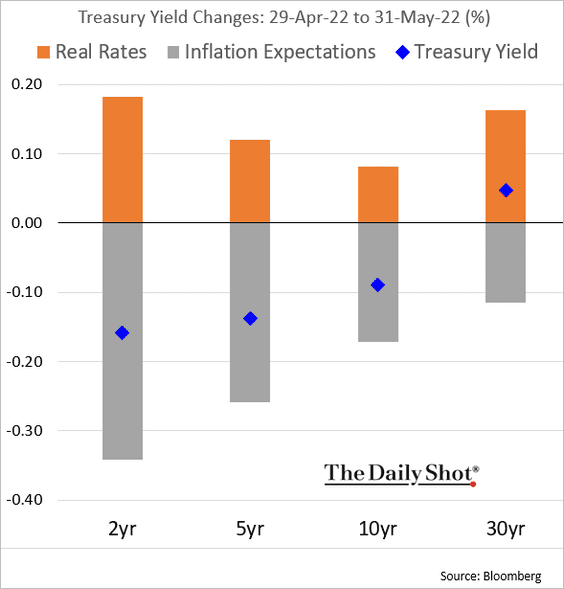
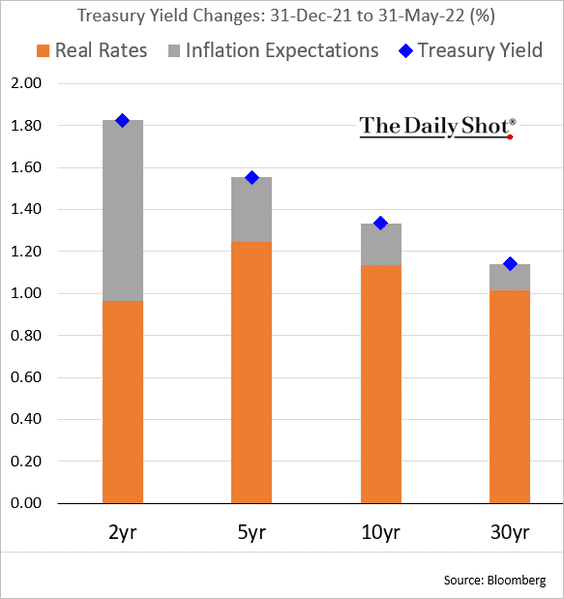
1. Here is a look at the attribution in Treasury yield changes.
• May:
• Year-to-date:
——————–
2. Higher real rates ahead?
 Source: MRB Partners
Back to Index
Global Developments
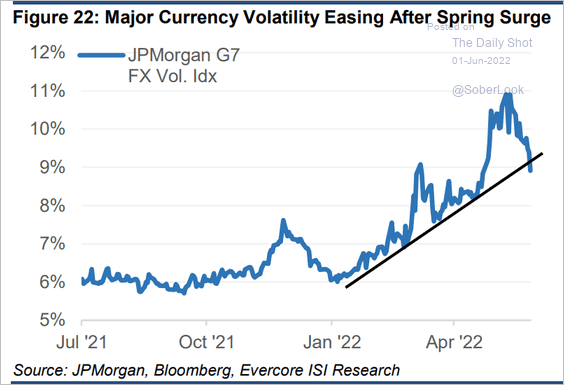
1. DM currency implied volatility has been moderating.
 Source: Evercore ISI Research
2. How much has the labor force size changed in advanced economies since the start of the pandemic? Relative to the pre-COVID trend?
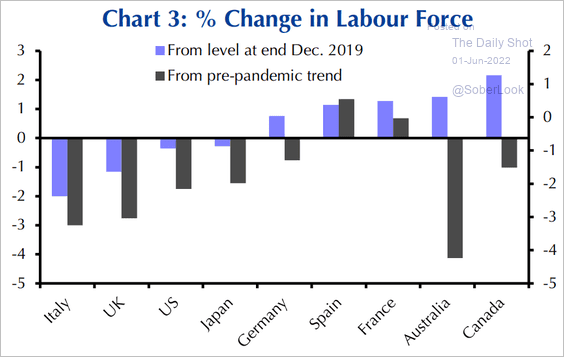 Source: Capital Economics
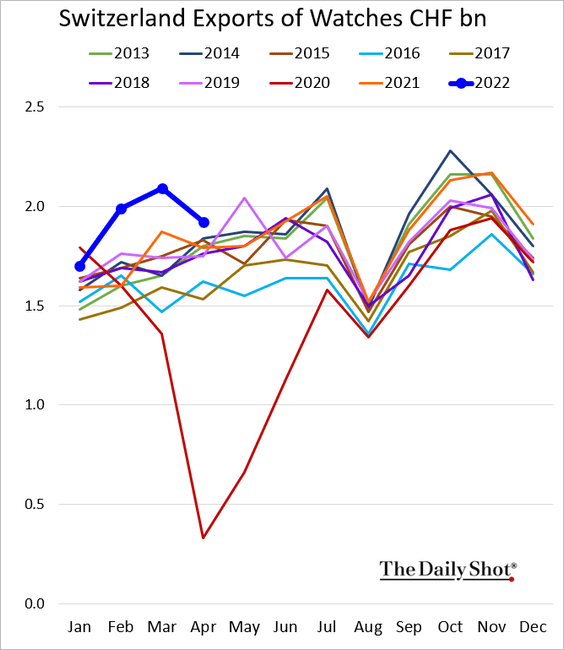
3. The pullback in Swiss watch exports points to softer demand for luxury goods.
——————–
Food for Thought
1. Refrigerator prices:
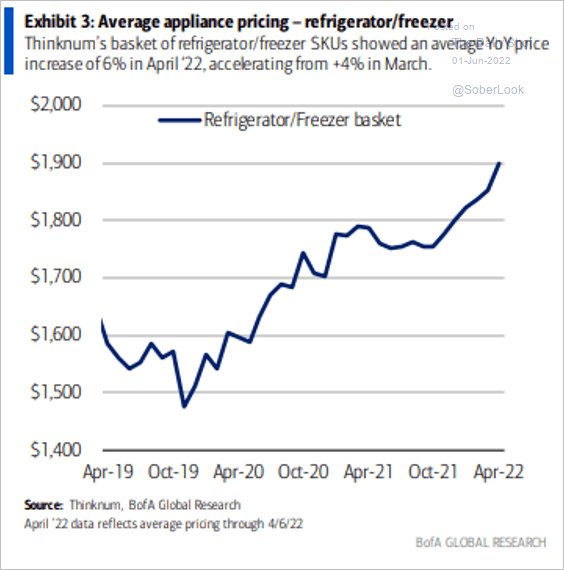 Source: BofA Global Research; @MikeZaccardi
Ground beef prices:
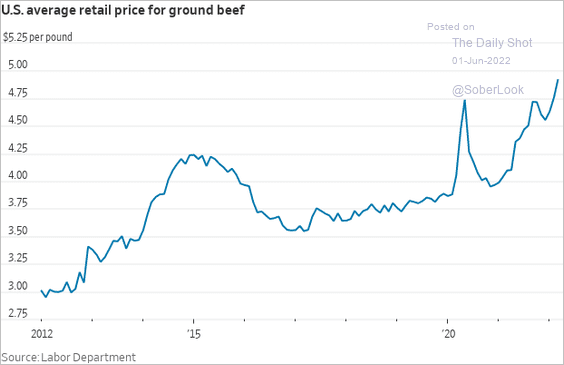 Source: @WSJ Read full article
——————–
2. Reasons for shopping online or in stores:
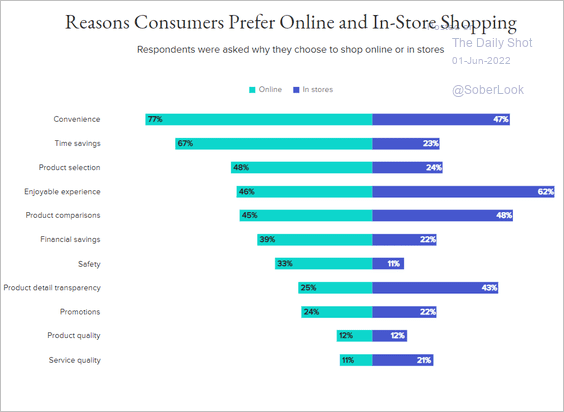 Source: Morning Consult Read full article
3. US college graduation rates:
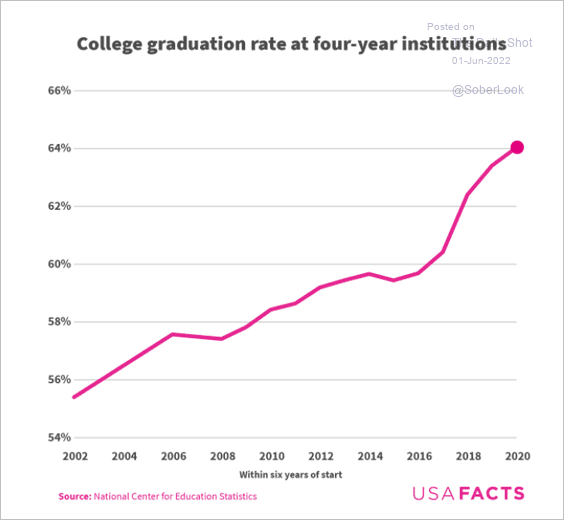 Source: USAFacts
4. Personal finance course requirements:
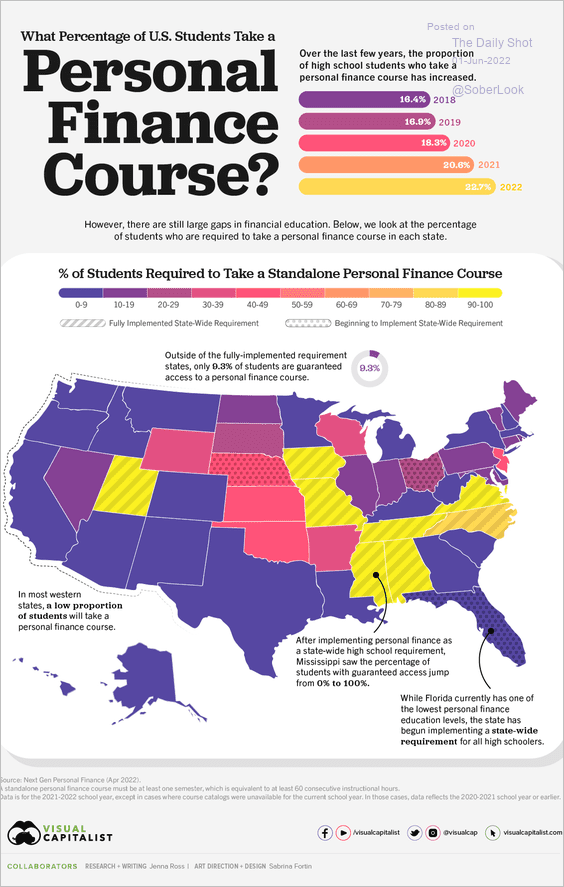 Source: Visual Capitalist
5. Companies exiting Russia:
 Source: The Economist Read full article
6. Monkeypox cases per country:
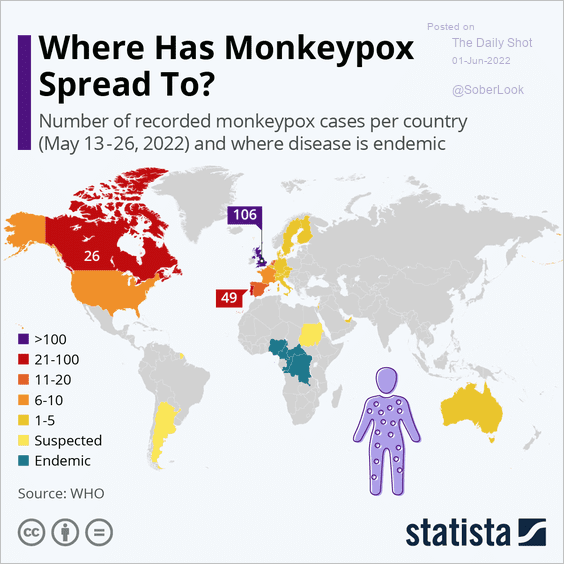 Source: Statista
7. Share of the continental US experiencing drought:
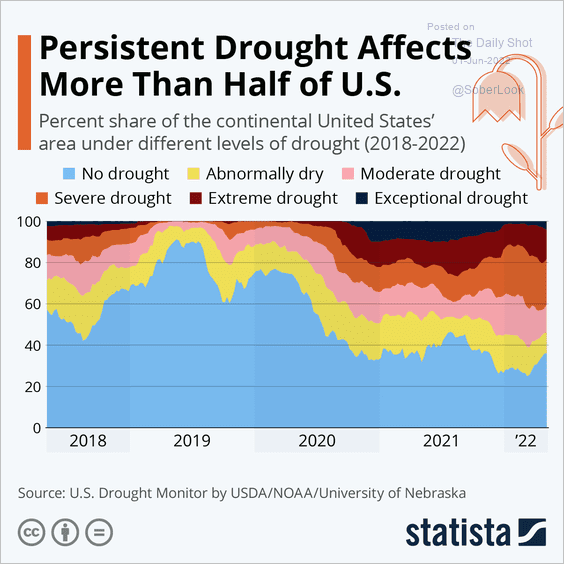 Source: Statista
8. The world’s highest-paid athletes:
 Source: Statista
——————–
Back to Index