
The Daily Shot: 02-Jun-22
• The United States
• Canada
• The United Kingdom
• The Eurozone
• Europe
• Asia – Pacific
• China
• Emerging Markets
• Cryptocurrency
• Commodities
• Energy
• Equities
• Credit
• Rates
• Global Developments
• Food for Thought
The United States
1. Despite the weakness in the regional Fed reports (see chart), the ISM Manufacturing PMI showed an improvement in May.
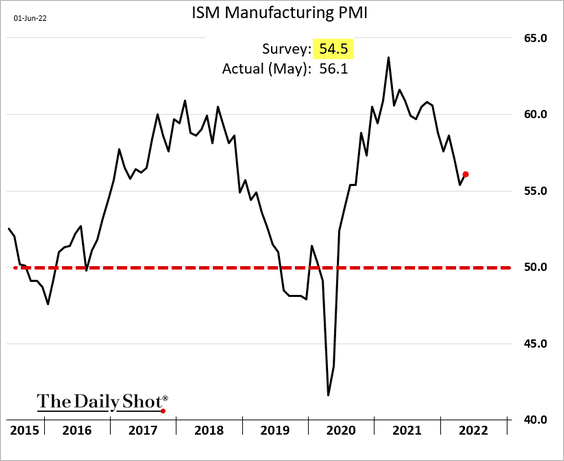
 Source: MarketWatch Read full article
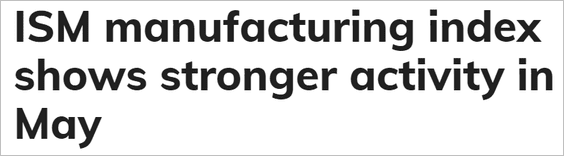
New orders unexpectedly strengthened.
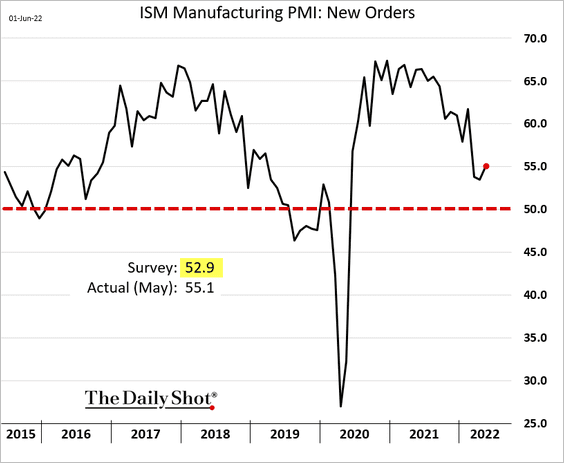
• Manufacturers continue to boost inventories of finished product.
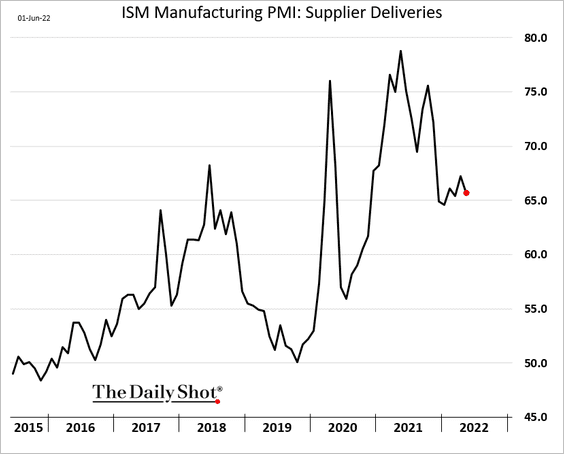
• The index of supplier delivery times is off the highs, but logistics challenges persist.
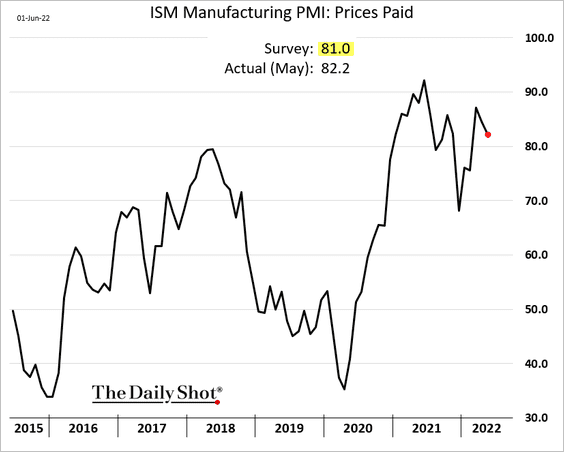
Price pressures remain elevated.
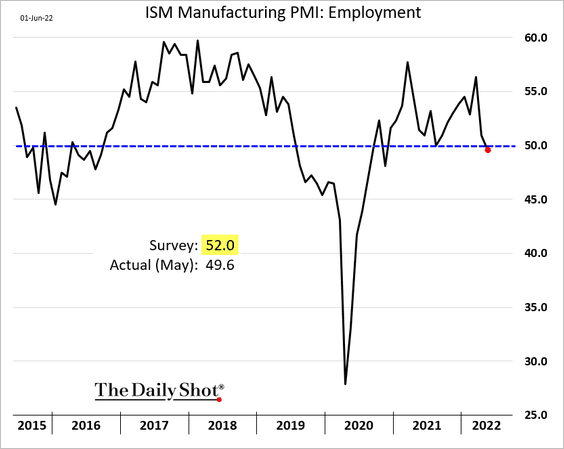
• Factory hiring ground to a halt in May.
• Here are the components of the PMI index.
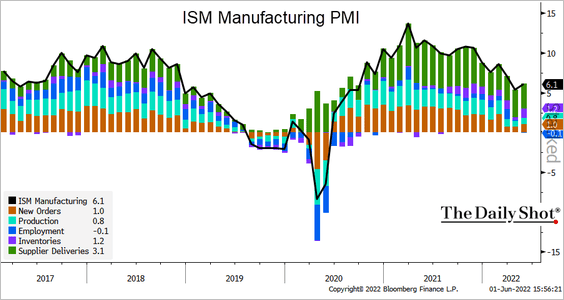 Source: @TheTerminal, Bloomberg Finance L.P.
• Below are some quotes from companies that participated in the ISM survey.
“Input costs, particularly grain, oil, dairy and protein, are rising faster than can be passed along at retail and food service, with no relief in sight.” [Food, Beverage & Tobacco Products]
“Shanghai has been shut down since mid-March. All of the (population) is in lockdown, with no production or port activities. Steel remains in allocation. Electronics lead times are more than 12 months.” [Fabricated Metal Products]
“While orders remain strong and backlogs exist, there’s a softening in forecasted orders for leading indicator-type customers and business units.” [Chemical Products]
Economists are skeptical about manufacturing strength persisting in the months ahead.
– The spread between new orders and inventories points to weakness in the ISM PMI later this year.
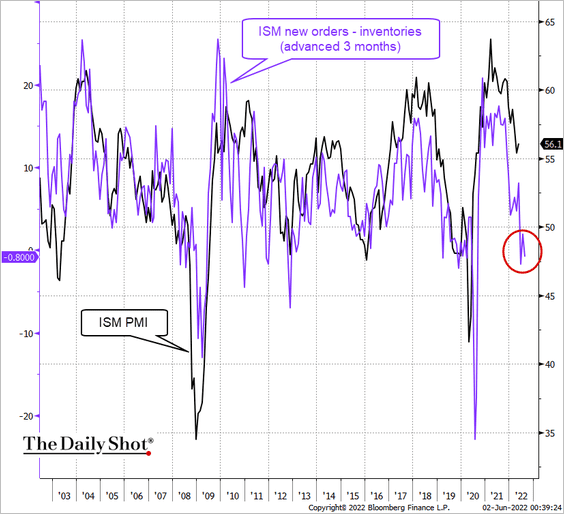 Source: @TheTerminal, Bloomberg Finance L.P.
– And so does manufacturing activity in China.
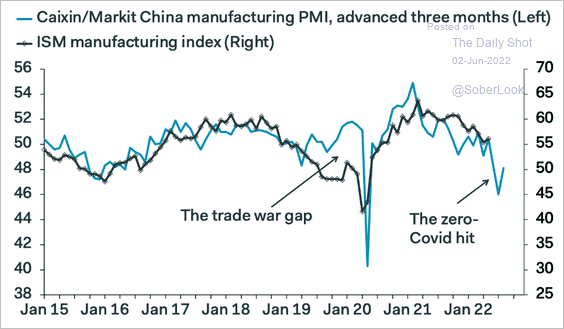 Source: Pantheon Macroeconomics
——————–
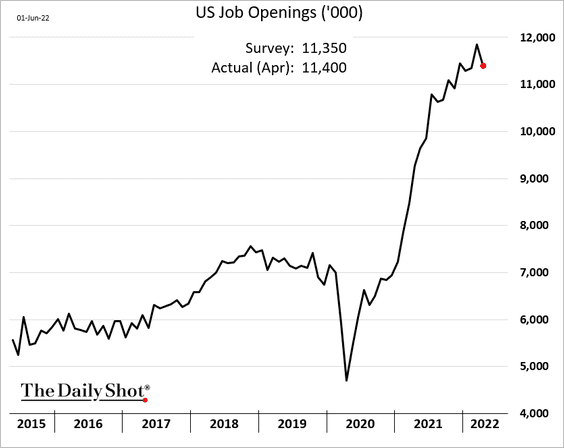
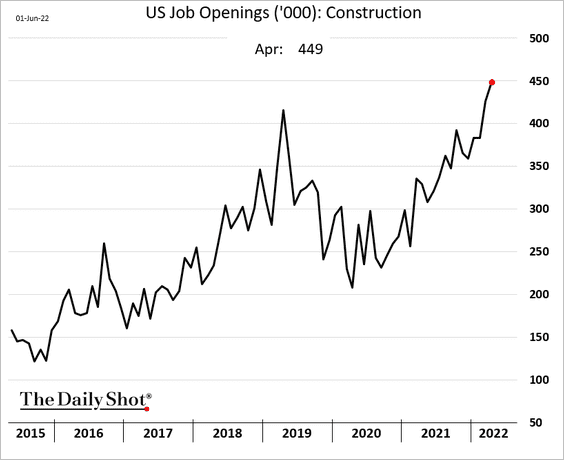
2. US job openings remained remarkably strong in April, indicating persistent tightness in the labor market.
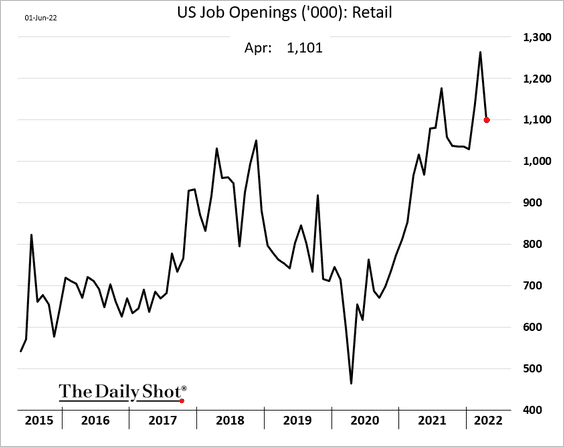
The hardest-hit industries saw some relief.
• Retail:
• Hotels and restaurants:
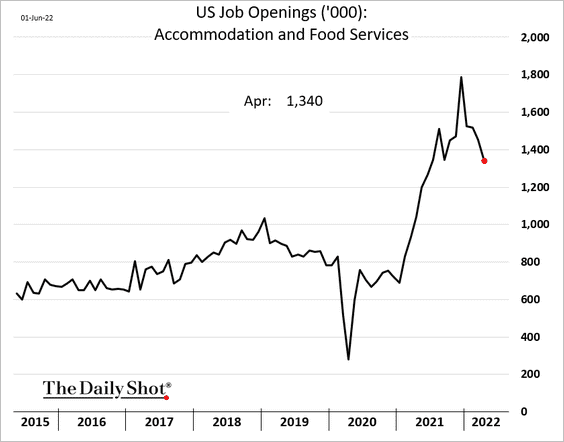
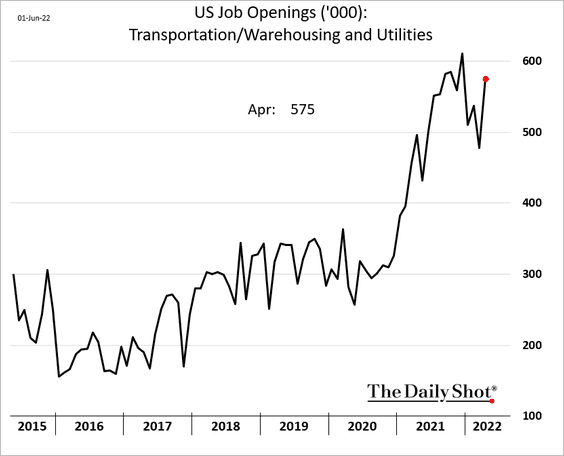
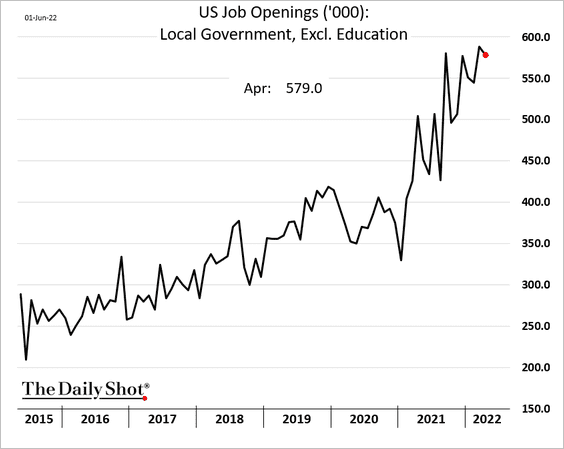
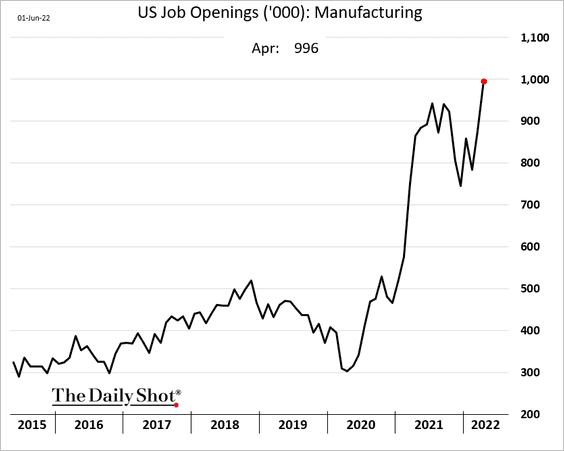
But most other sectors continued to see extreme demand for workers.
• Logistics:
• Local government:
• Manufacturing:
• Construction:
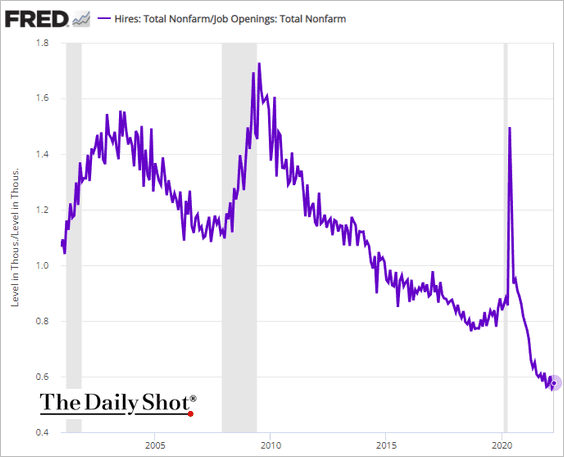
Below are some additional trends from the job openings report.
– The hires-to-openings ratio:
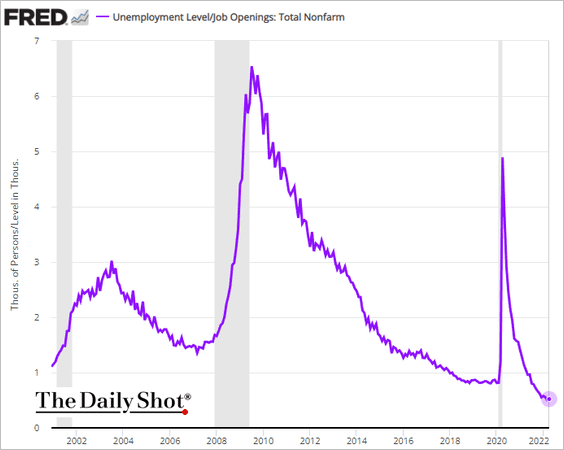
– The ratio of unemployed workers to job openings:
– Quits vs. layoffs:
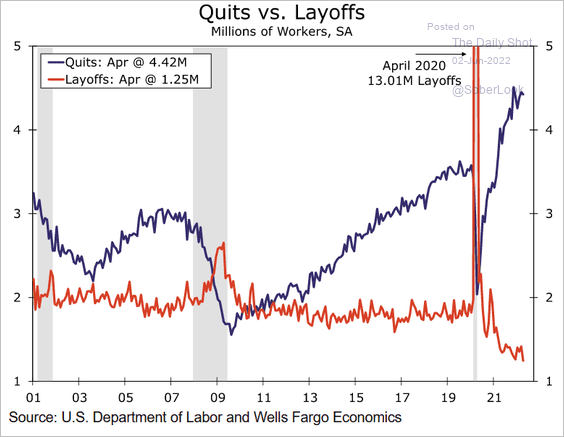 Source: Wells Fargo Securities
– The Beveridge Curve:
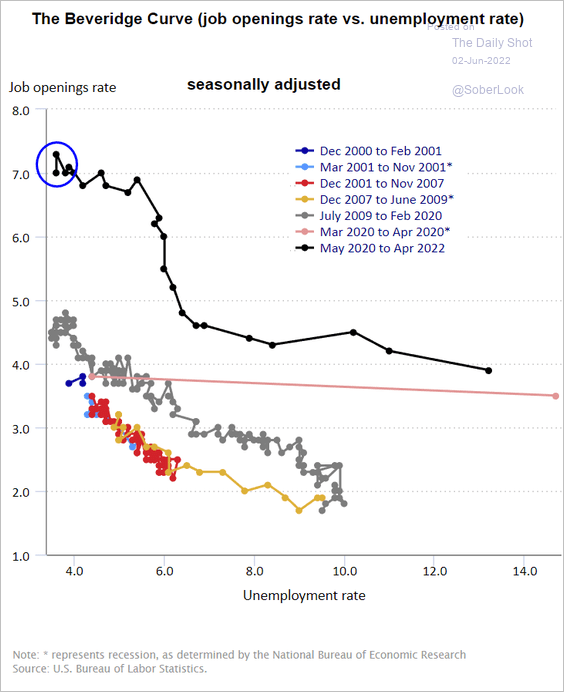 Source: BLS
——————–
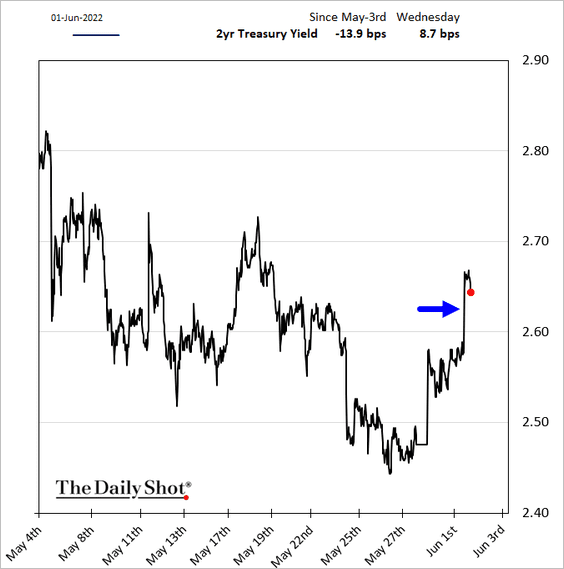
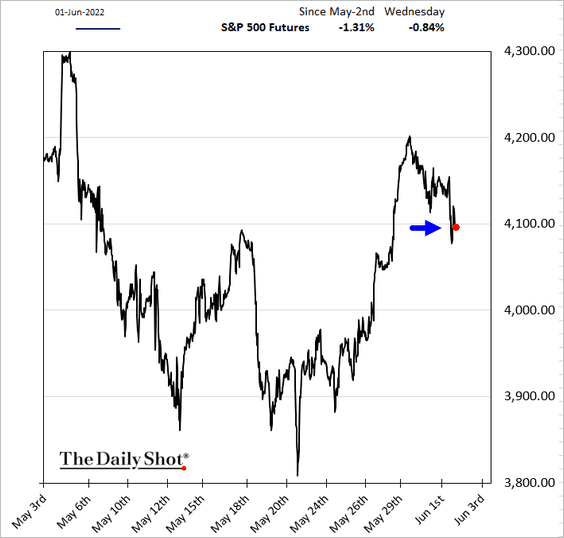
3. The combination of robust factory activity and near-record demand for labor suggests that financial conditions haven’t been tight enough to sufficiently slow the economy and ease inflationary pressures. It’s full speed ahead for the Federal Reserve.
• Treasury yields jumped.
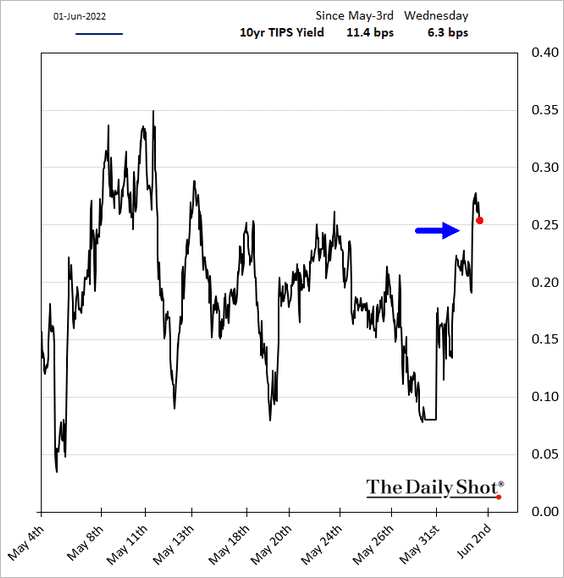
• Real rates also advanced, which could be a headwind for stocks.
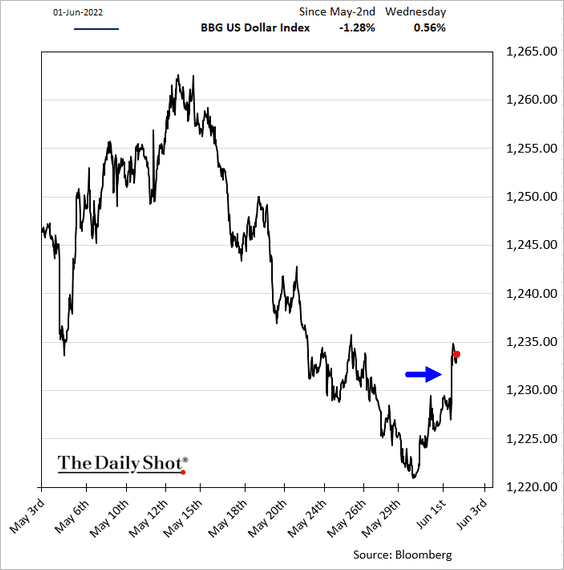
• The dollar climbed.
• Equities sold off.
——————–
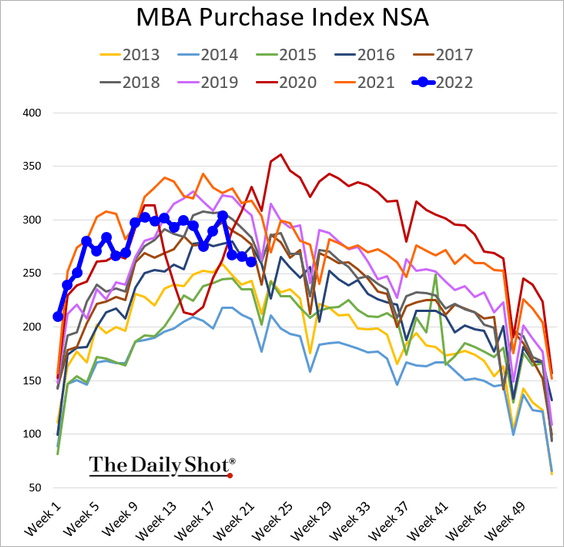
4. Despite record home price appreciation, mortgage applications are not crashing.
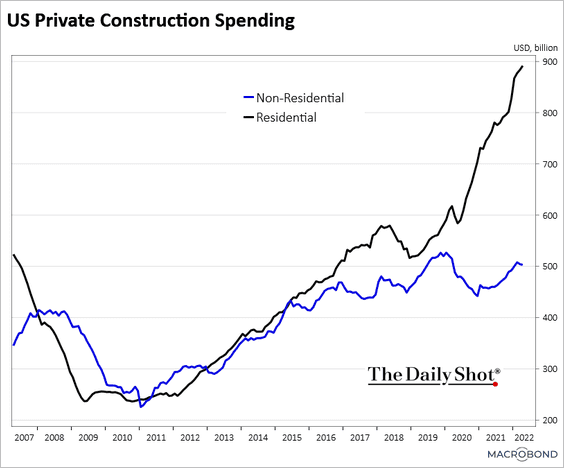
5. Growth in construction spending slowed in April.
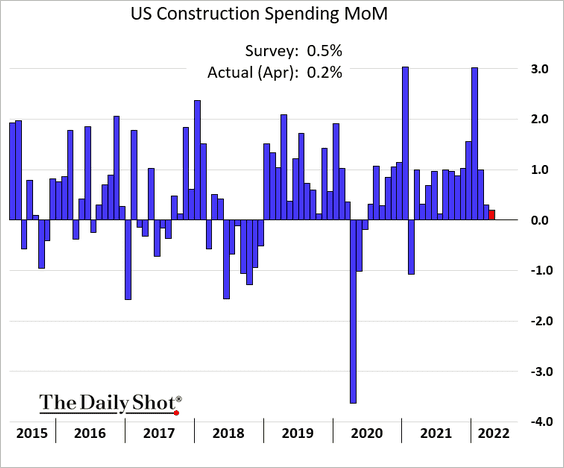
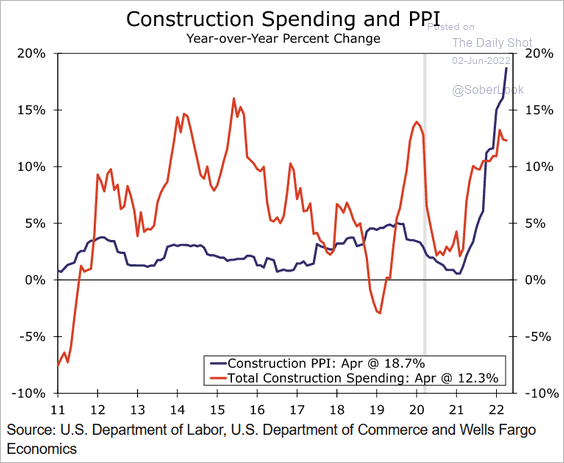
• Surging costs have been a headwind for construction spending.
 Source: Wells Fargo Securities
• The gap between private residential and nonresidential construction spending keeps widening.
 Source: Chart and data provided by Macrobond
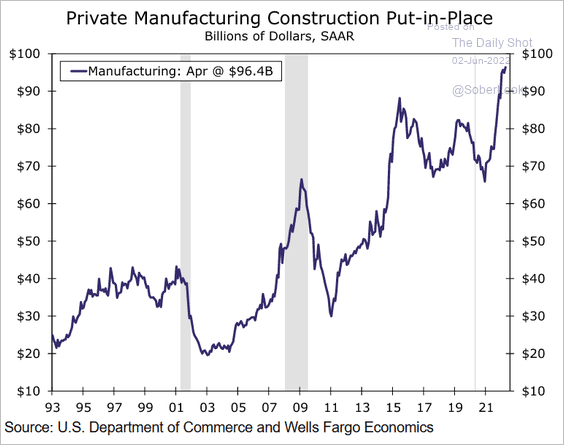
• Manufacturing-sector construction spending remains strong.
 Source: Wells Fargo Securities
——————–
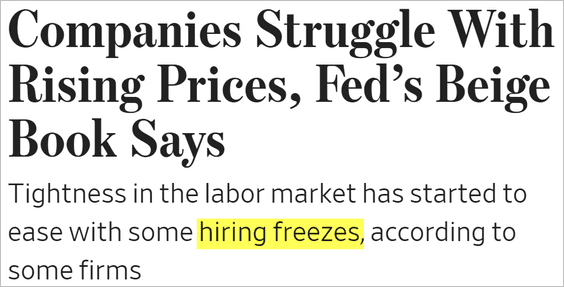
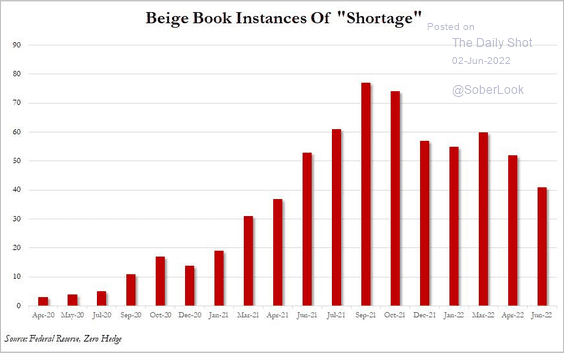
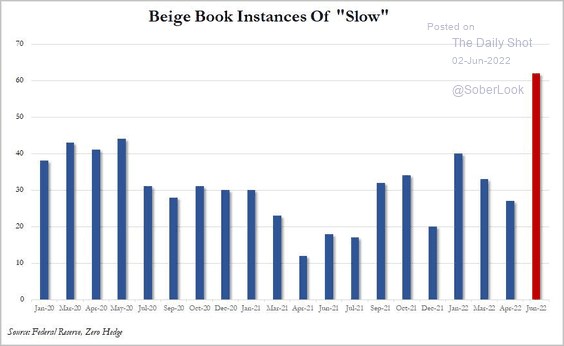
6. The Fed’s Beige Book report continues to point to price pressures. But shortages are gradually easing, and we are starting to see some concerns about slowing demand.
 Source: @WSJ Read full article
 Source: ZeroHedge Read full article
 Source: ZeroHedge Read full article
——————–
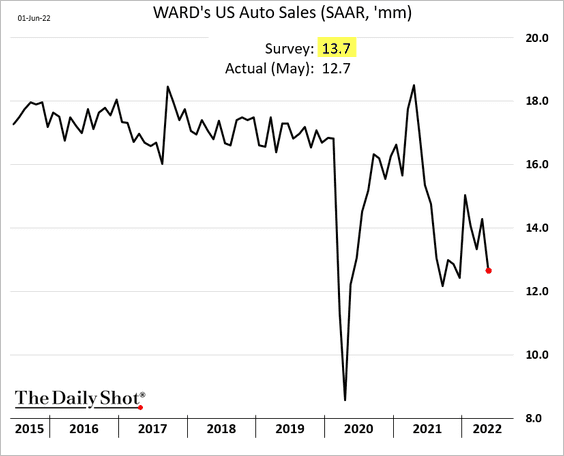
7. US automobile sales dropped in May.
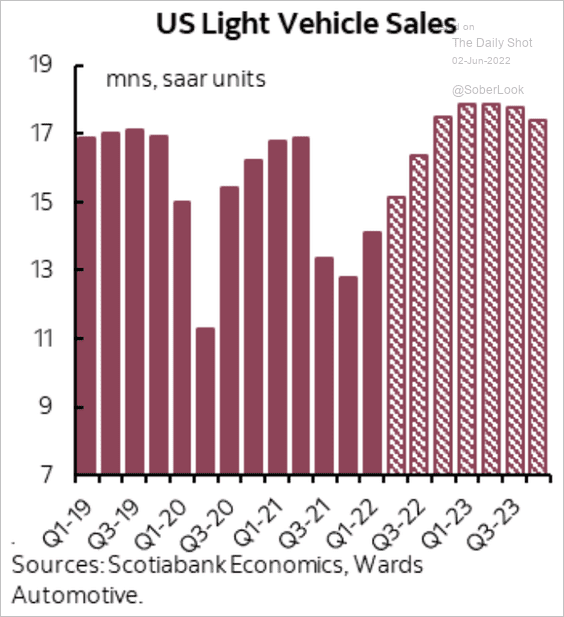
Scotiabank expects US vehicle sales to recover by the end of the year.
 Source: Scotiabank Economics
Back to Index
Canada
1. The BoC hiked by 50 bps, as expected, …
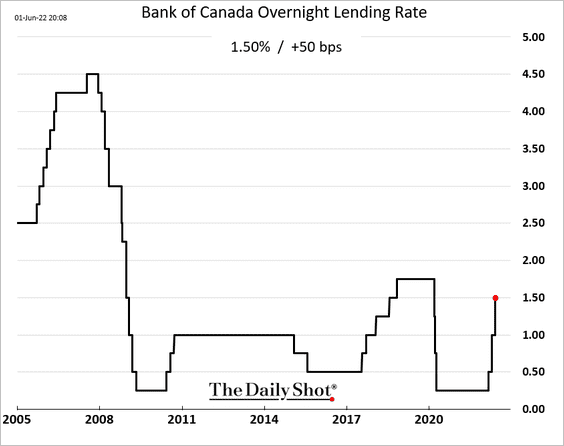
… outpacing the Fed and the BoE.
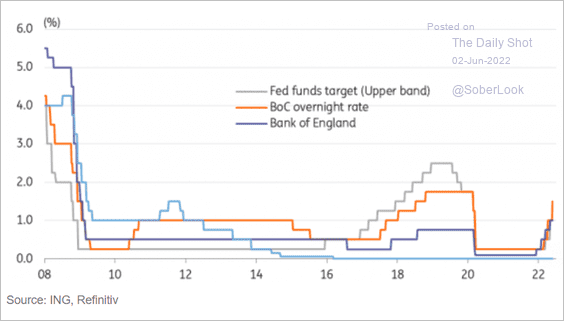 Source: ING
More aggressive tightening is on the way. Will we see a 75 bps increase?
 Source: Reuters Read full article
• The expected rate trajectory shifted higher.
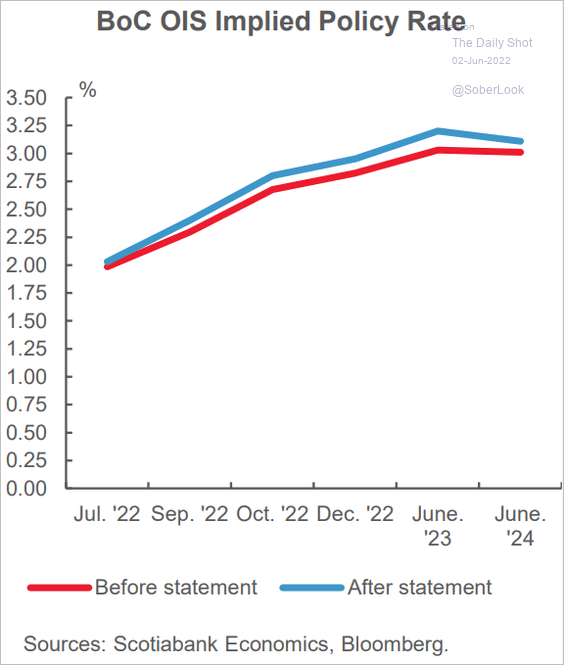 Source: Scotiabank Economics
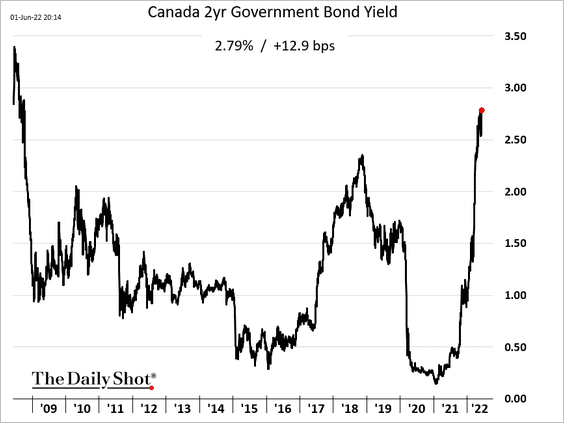
The 2-year yield jumped, hitting the highest level since 2008.
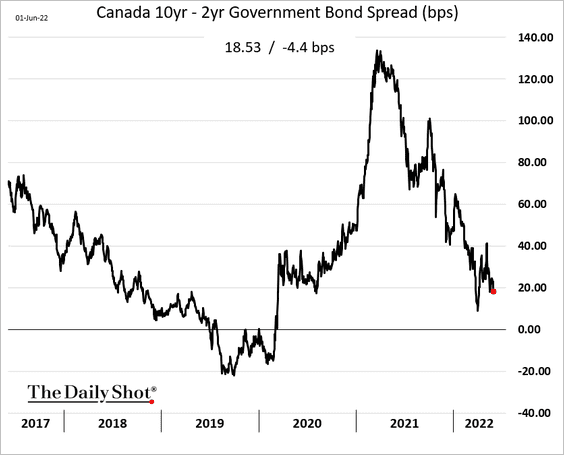
The yield curve has been flattening.
——————–
2. Manufacturing growth remains strong.
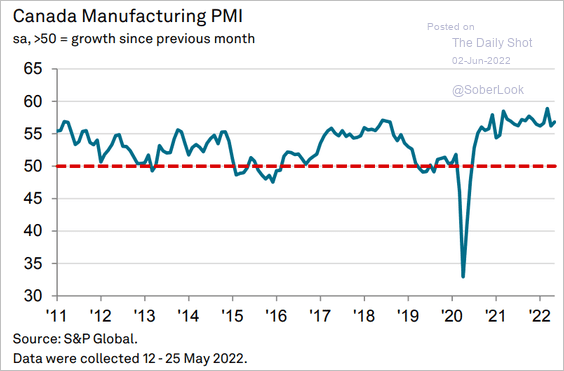 Source: S&P Global PMI
3. Canada’s current account has turned positive.
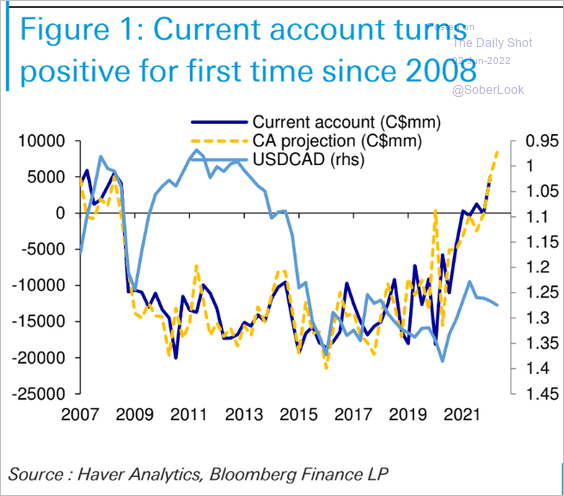 Source: Deutsche Bank Research
4. Global monetary tightening points to weaker earnings growth for Canadian companies.
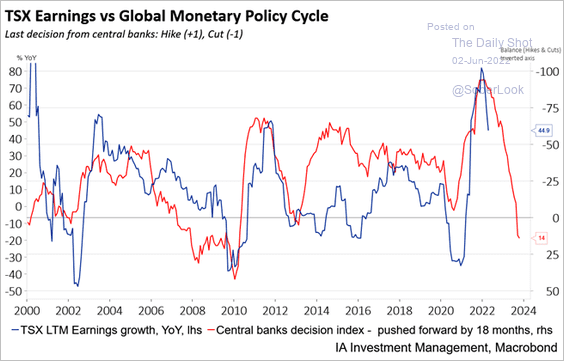 Source: Industrial Alliance Investment Management Inc.
Back to Index
The United Kingdom
Home price appreciation has been surprising to the upside.
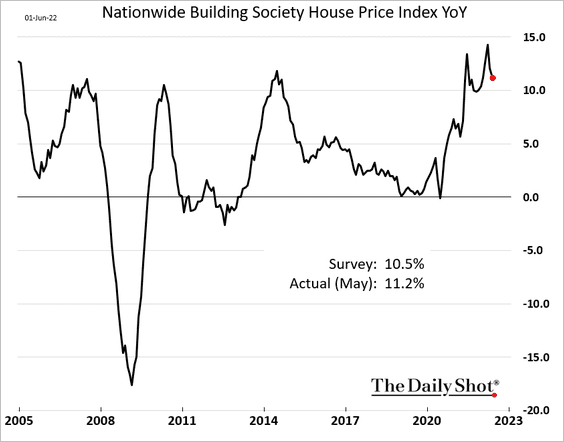
But weak consumer confidence points to downside risks for home prices.
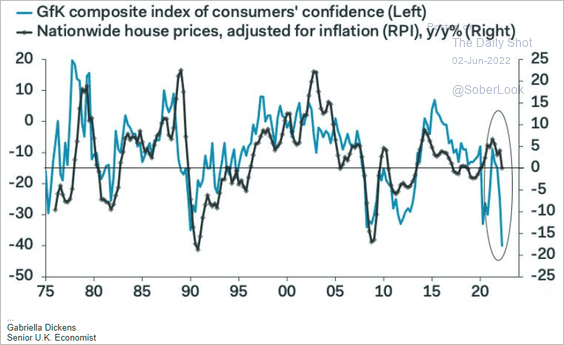 Source: Pantheon Macroeconomics
Back to Index
The Eurozone
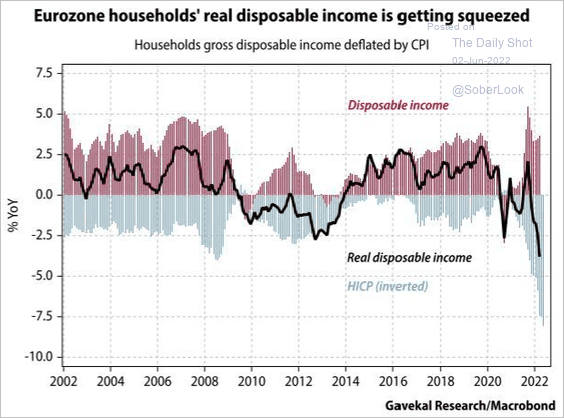
1. Germany’s retail sales tumbled in April …
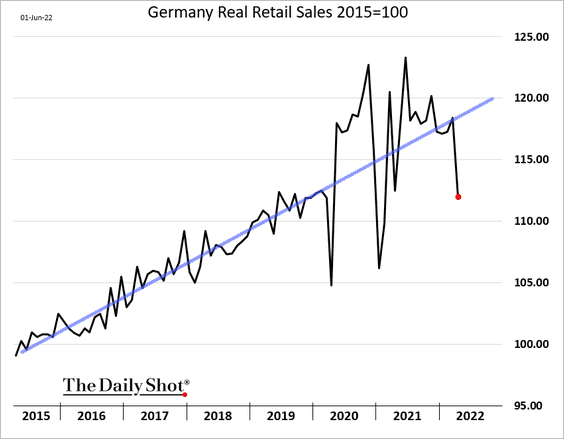
… as euro-area households’ real incomes get squeezed by surging prices. Is Germany facing a recession?
 Source: Gavekal Research
——————–
2. The persistent upside inflation surprises are creating a credibility problem for the ECB.
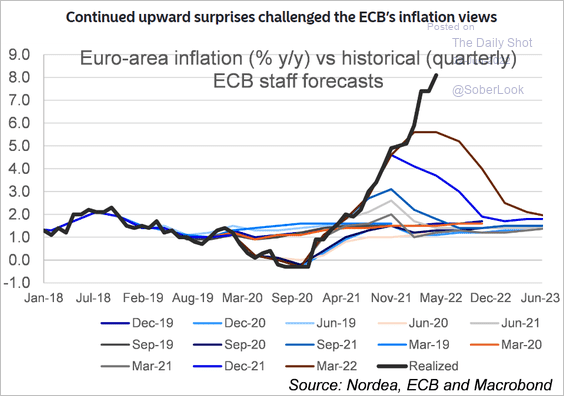 Source: Nordea Markets
3. Spain’s factory activity held up well in May.
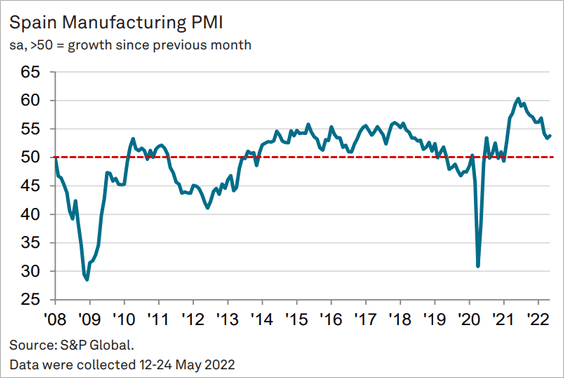
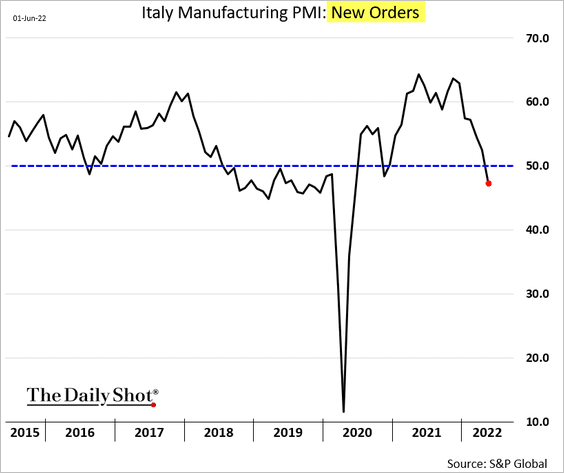
But Italy’s manufacturing growth stalled, …
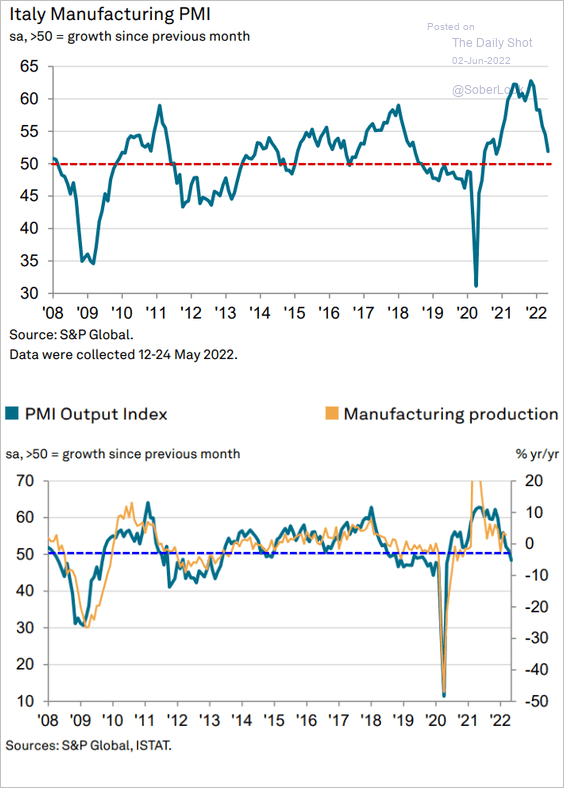 Source: S&P Global PMI
… with production and new orders contracting. Weak demand from China contributed to the slowdown in Italian manufacturing.
Back to Index
Europe
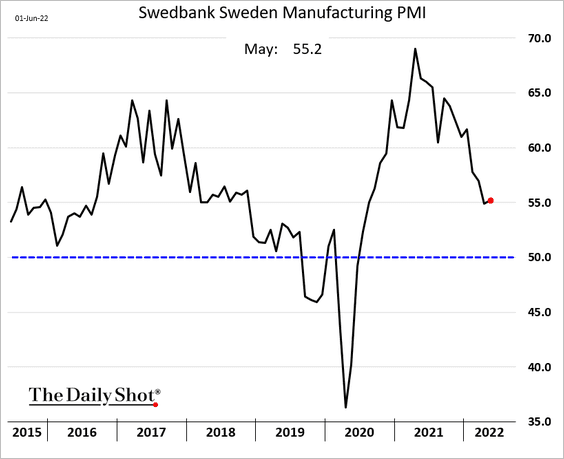
1. Sweden’s manufacturing growth improved slightly in May.
2. But Central Europe is experiencing a sharp slowdown in growth.
• The Czech Republic (much slower):
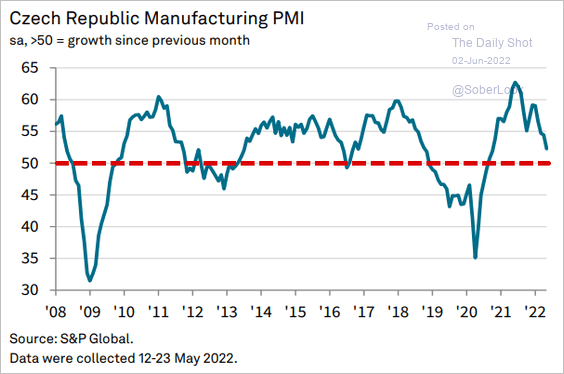 Source: S&P Global PMI
• Poland (contraction):
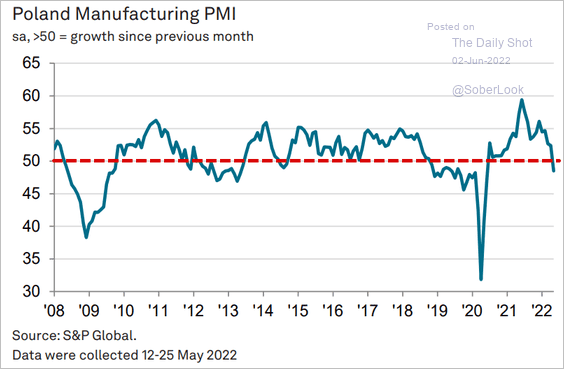 Source: S&P Global PMI
Back to Index
Asia – Pacific
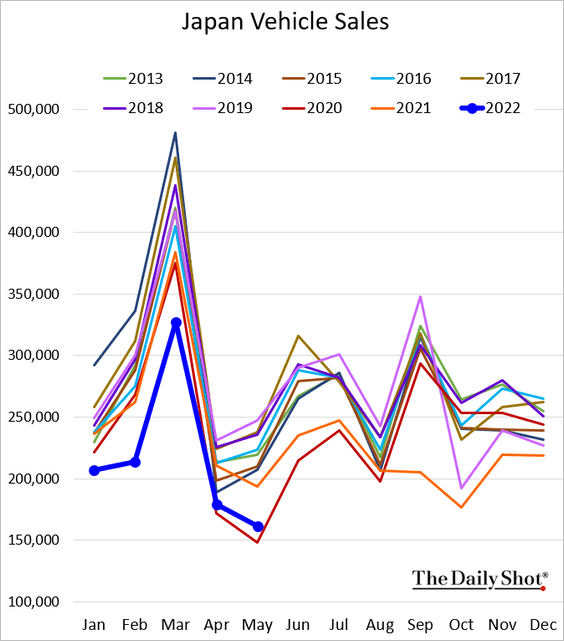
1. Japan’s vehicle sales are barely above 2020 levels.
2. South Korea’s manufacturing growth was relatively steady last month.
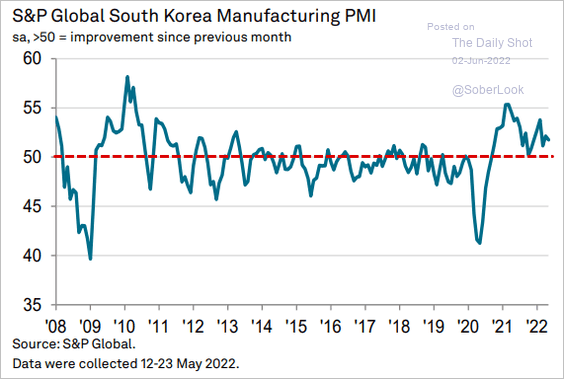 Source: S&P Global PMI
3. But Taiwan’s factory activity stalled, with output contracting (2nd panel).
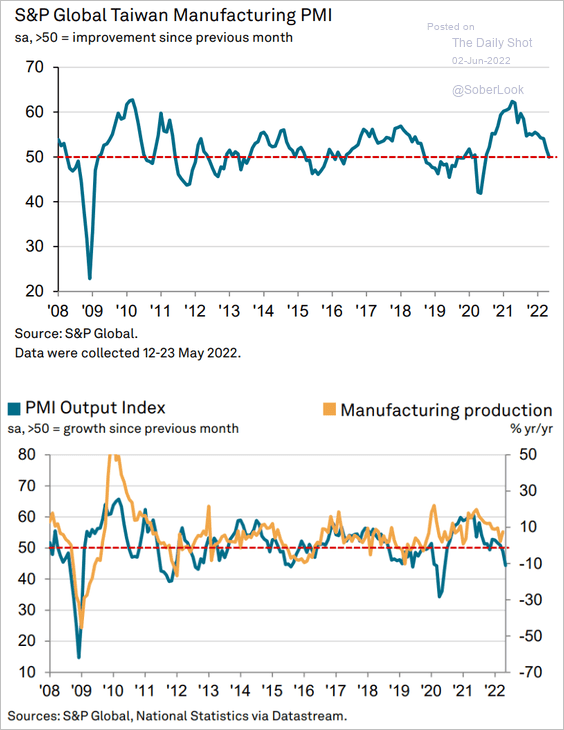 Source: S&P Global PMI
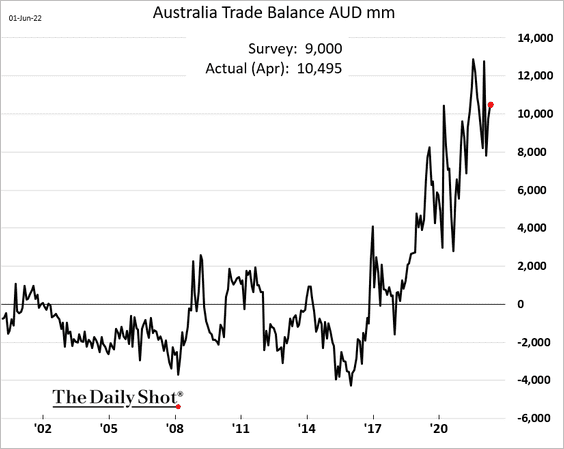
4. Australian trade balance surprised to the upside again.
Back to Index
China
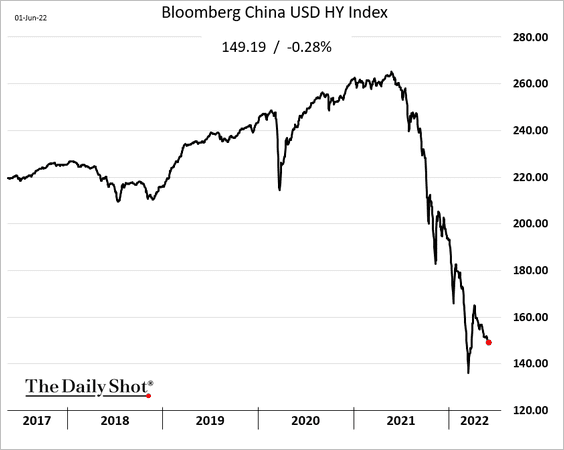
1. Despite Beijing’s support for the property sector, USD-denominated high-yield debt prices are not recovering.
2. State-run firms are paying record low rates on new bonds.
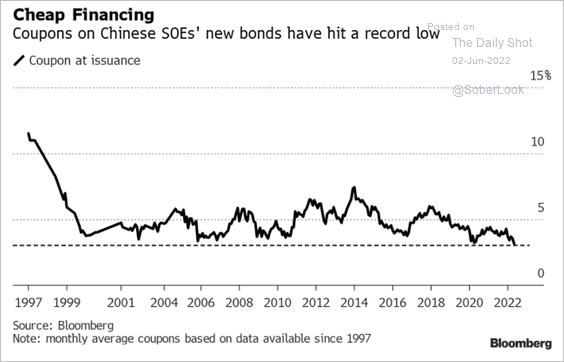 Source: Bloomberg Law Read full article
3. The iShares China ETF (MCHI) is testing long-term support.
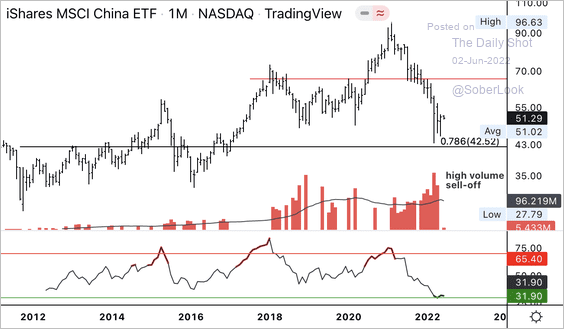 Source: Dantes Outlook
Alibaba (BABA) broke its long-term downtrend after Jack Ma criticized the Chinese government in October 2020. Downside momentum has slowed over the past few months.
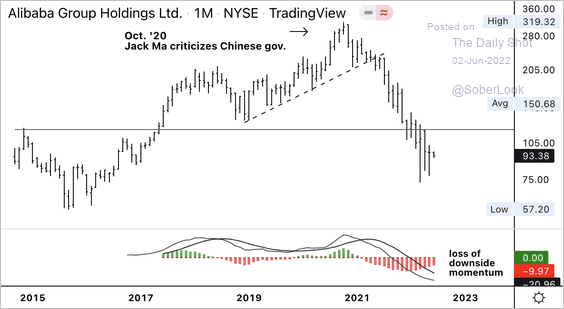 Source: Dantes Outlook
——————–
4. Fiscal revenue has deteriorated.
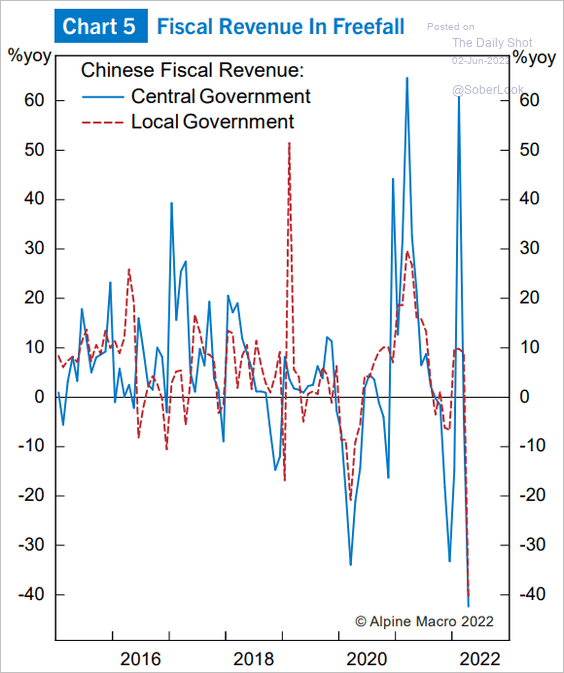 Source: Alpine Macro
5. China has been seeing large capital outflows, particularly in the bond market (2 charts). Will we see a reversal soon?
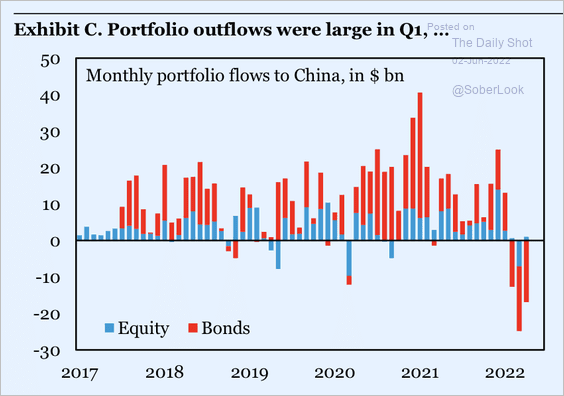 Source: IIF
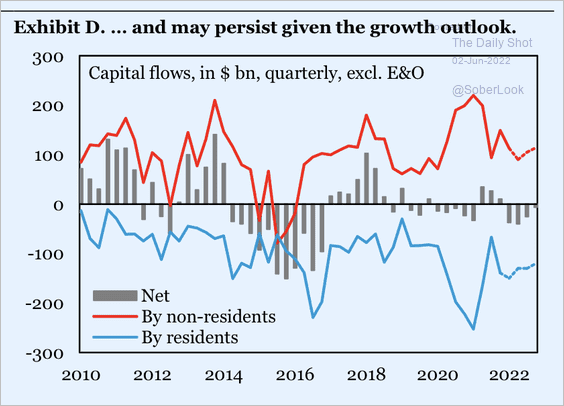 Source: IIF
——————–
6. Road freight traffic has stabilized across major cities, except Shanghai and Beijing.
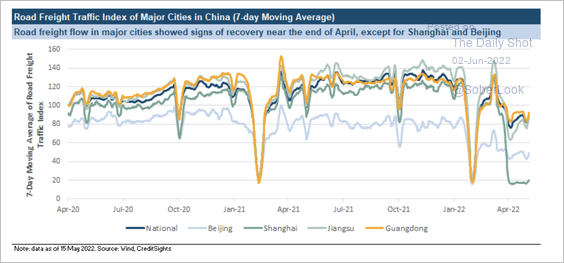 Source: CreditSights
Domestic travel is starting to recover.
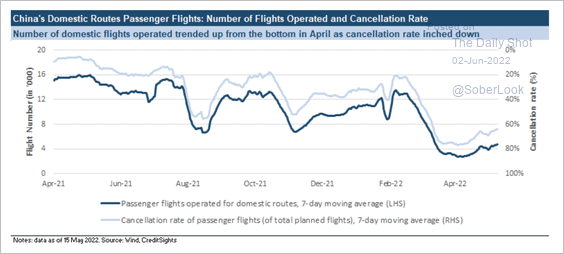 Source: CreditSights
——————–
7. Manufacturers’ product inventories have risen sharply.
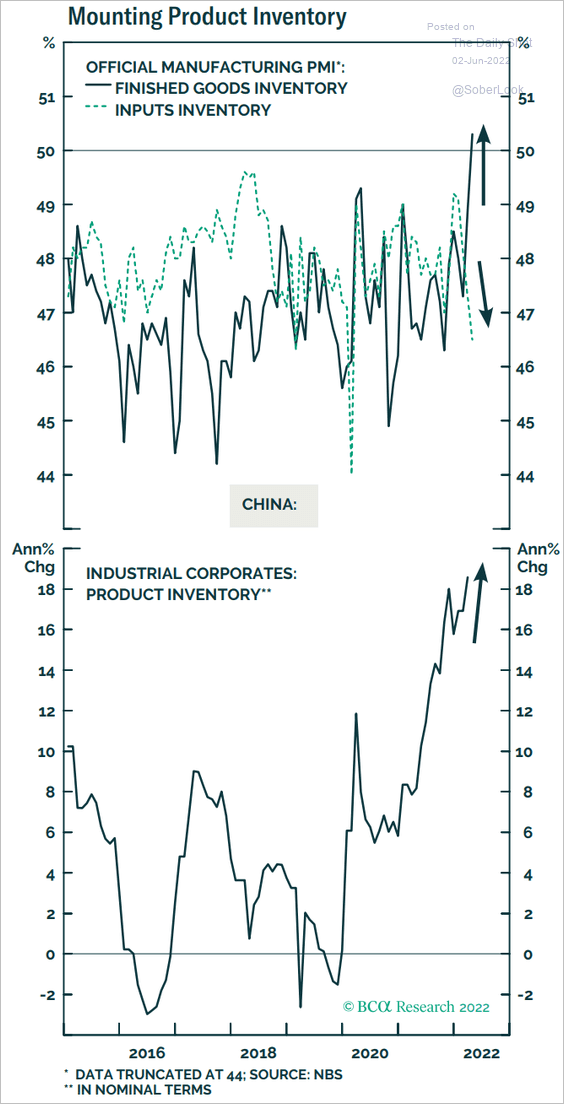 Source: BCA Research
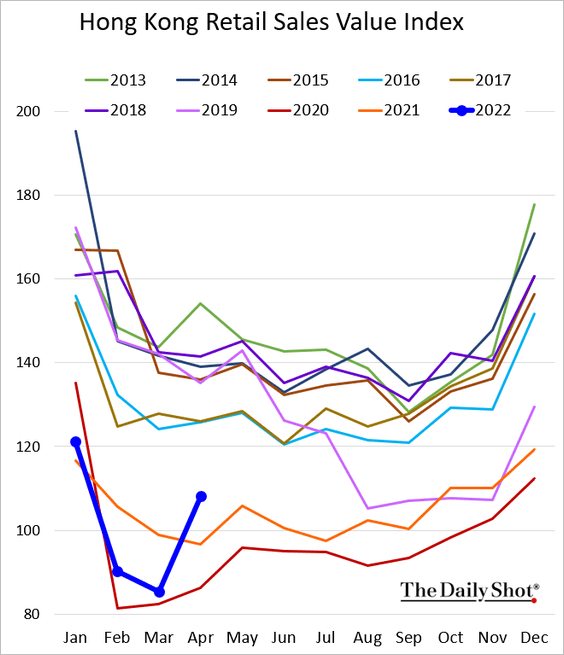
8. Hong Kong’s retail sales jumped in April.
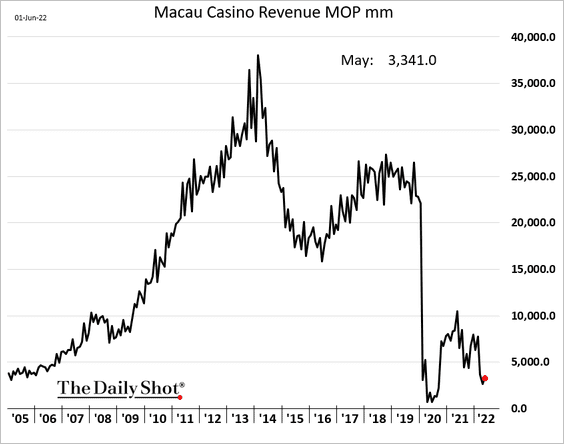
9. Macau casino revenue is not recovering.
Back to Index
Emerging Markets
1. Let’s run through the May PMI reports.
• Asia:
– ASEAN (steady growth):
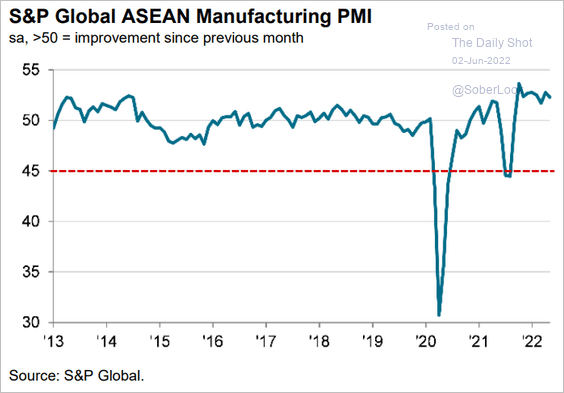 Source: S&P Global PMI
– Thailand:
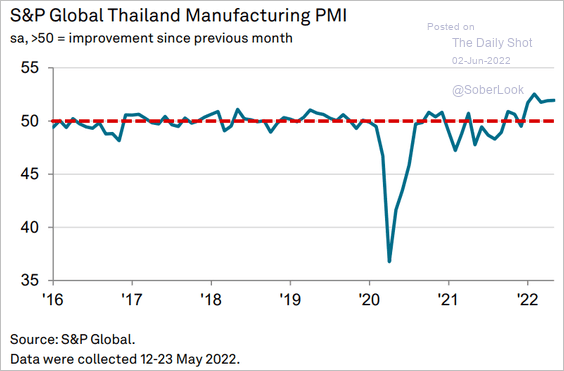 Source: S&P Global PMI
– The Philippines:
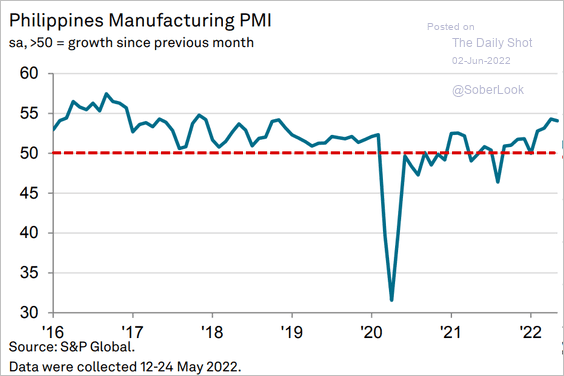 Source: S&P Global PMI
– India (holding up well):
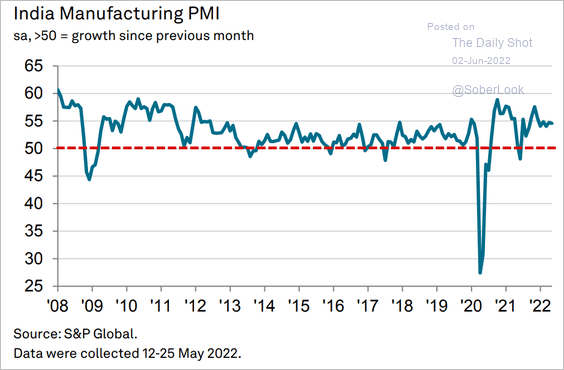 Source: S&P Global PMI
– Vietnam:
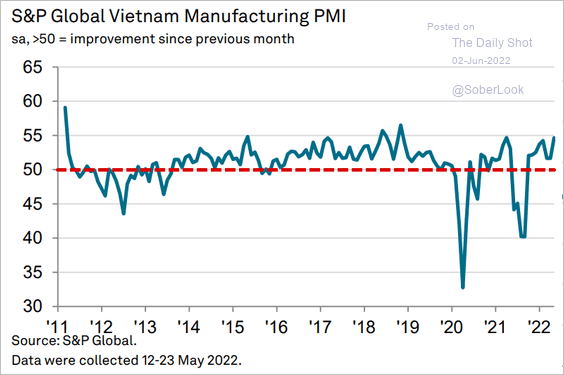 Source: S&P Global PMI
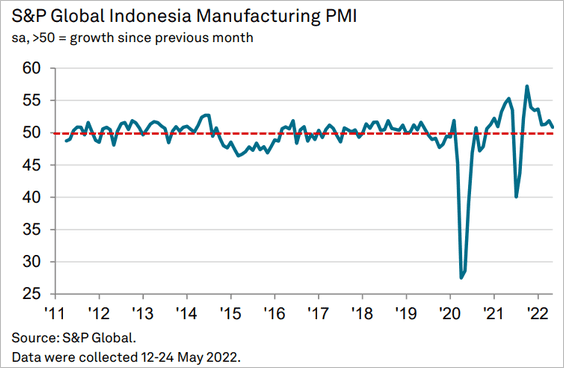
– Indonesia (stalling):
• Europe:
– Russia (back in growth mode):
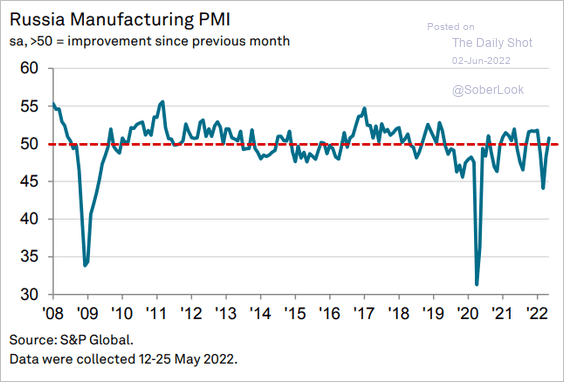 Source: S&P Global PMI
– Turkey (output contracting):
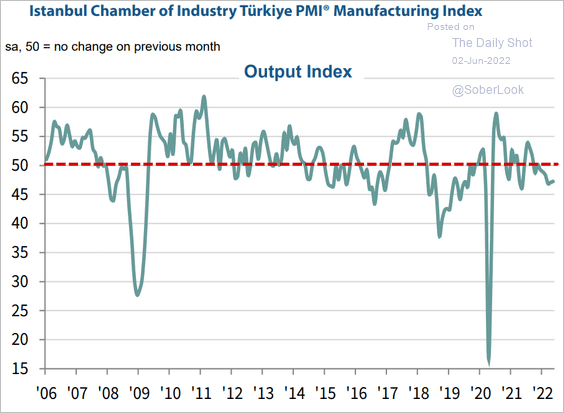 Source: S&P Global PMI
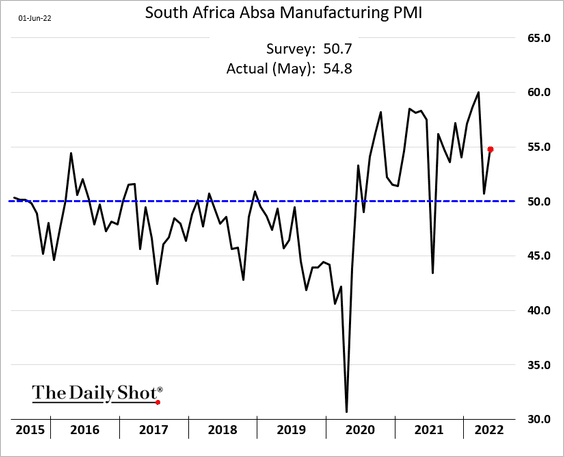
• South Africa’s PMI rebounded.
• LatAm:
– Brazil (picked up momentum):
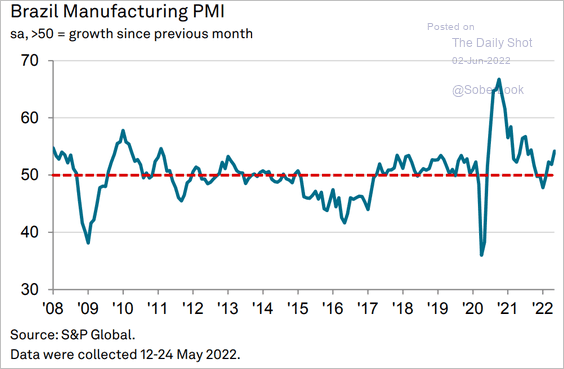 Source: S&P Global PMI
– Mexico (finally in growth mode):
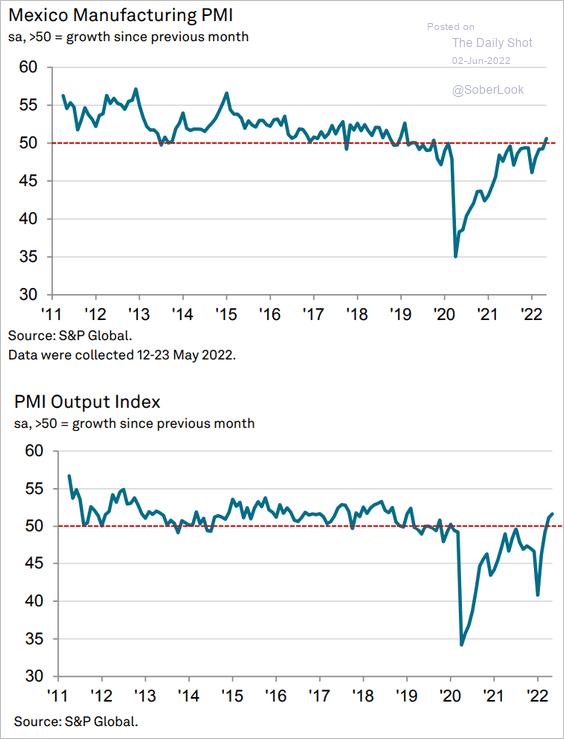 Source: S&P Global PMI
——————–
2. India’s daily activity tracker has peaked.
![]() Source: @ANZ_Research
Source: @ANZ_Research
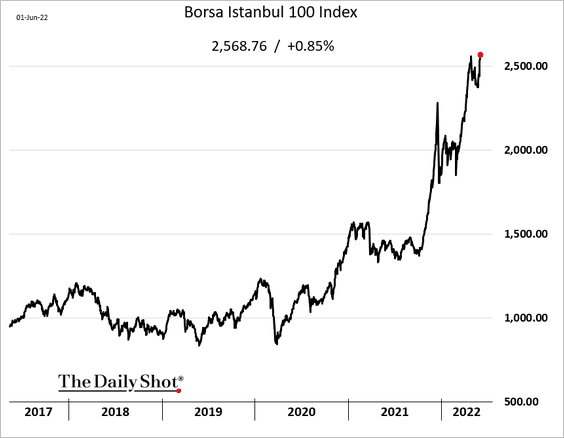
3. Turkey’s stock market is hitting record highs as investors try to escape hyperinflation.
 Source: Bloomberg Read full article
——————–
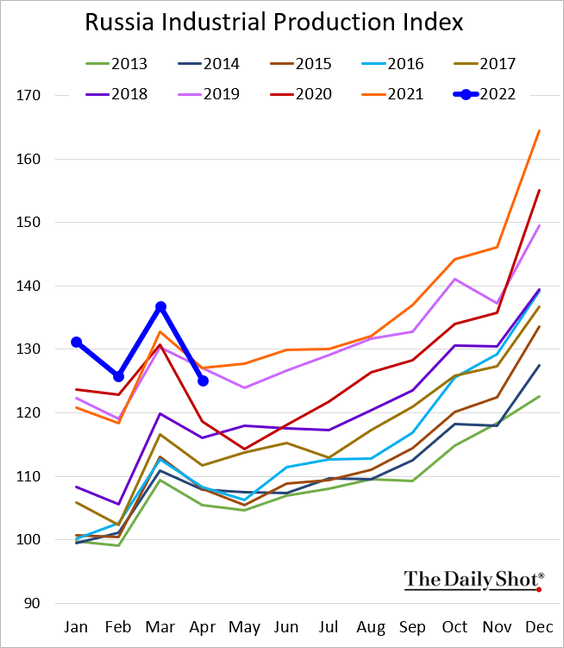
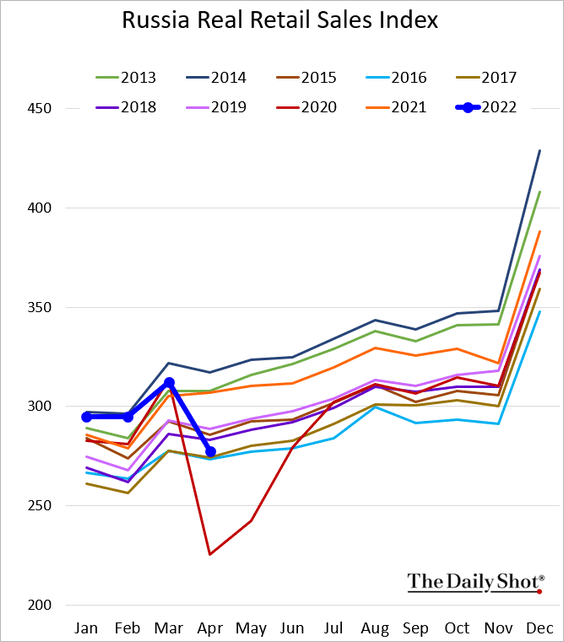
4. Here are some economic results from Russia (should be taken with a pinch of salt).
• Industrial production:
• Retail sales:
——————–
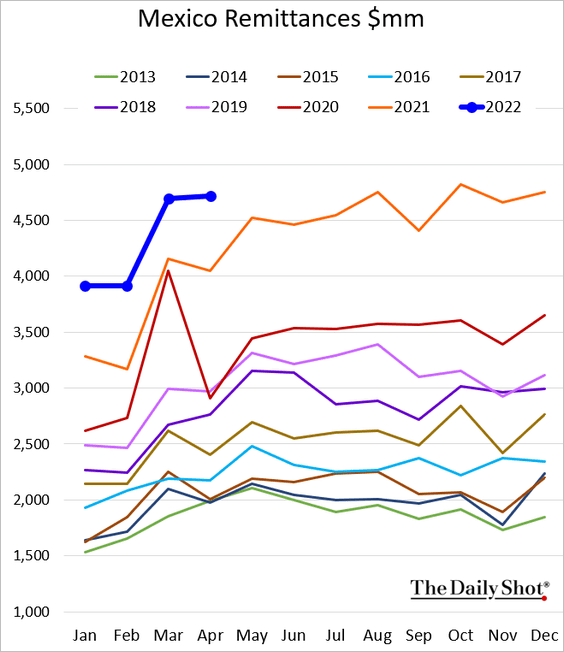
5. Mexican remittances are at record highs for this time of the year.
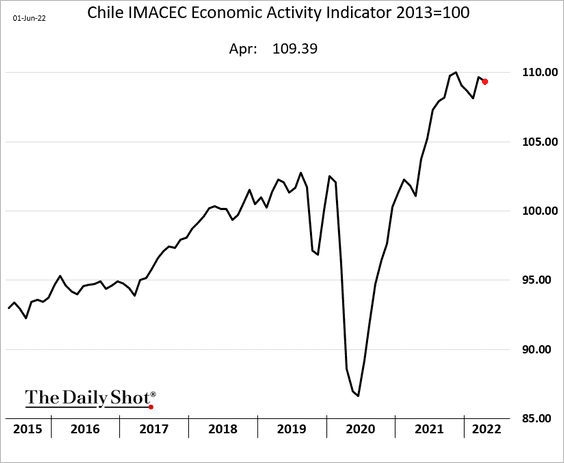
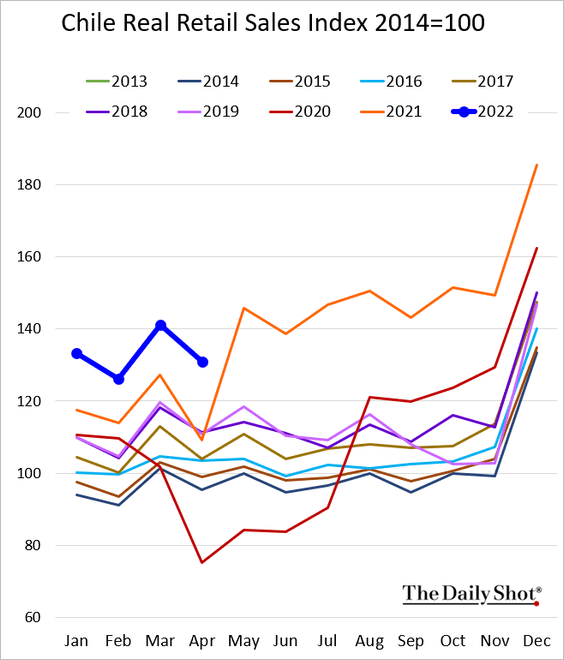
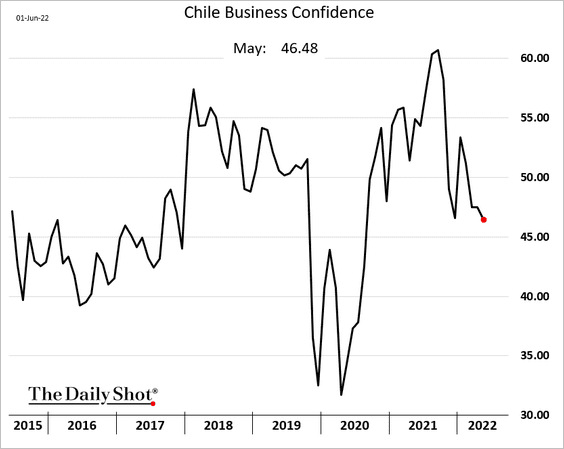
6. Finally, we have some updates from Chile.
• Economic activity (still solid):
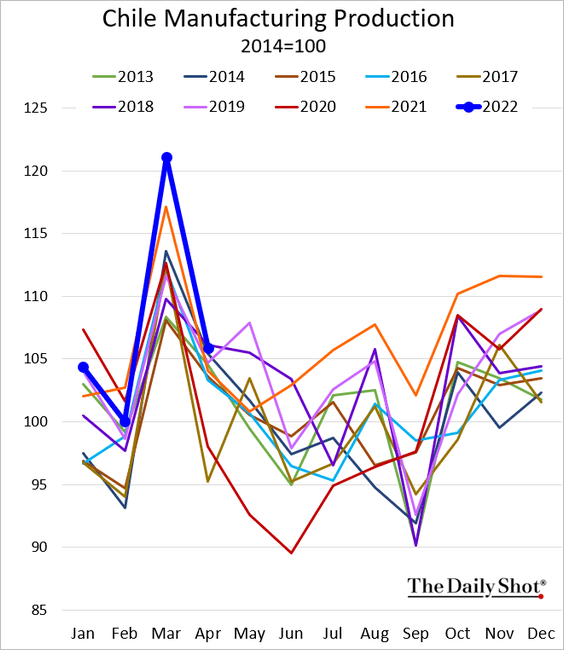
• Industrial production (back in line with earlier years):
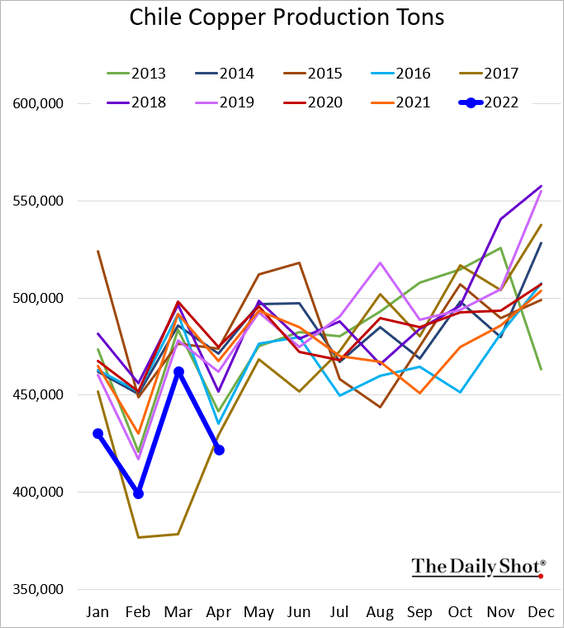
• Copper output (soft):
• Retail sales (very strong):
• Business confidence (deteriorating):
Back to Index
Cryptocurrency
1. Bitcoin continues to underperform stocks and gold year to date.
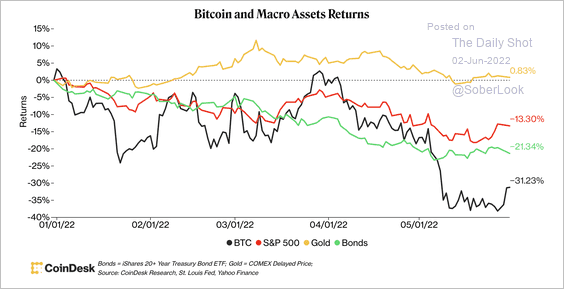 Source: CoinDesk Read full article
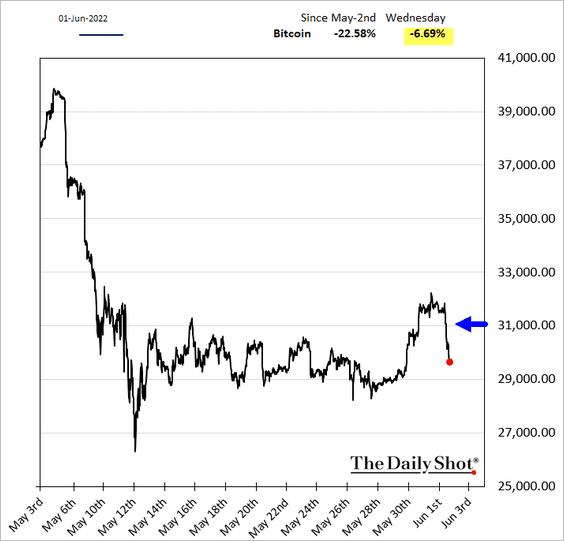
Bitcoin took a hit after better-than-expected economic data in the US reignited inflation fears.
——————–
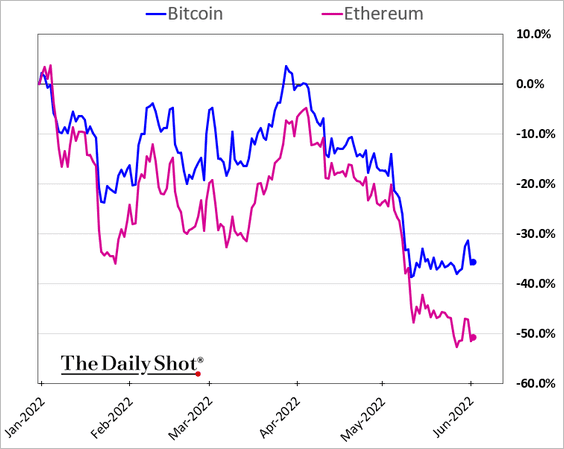
2. Ether is down over 50% this year, sharply underperforming bitcoin in recent weeks.
3. May was a tough month for cryptos as many altcoins tumbled in the wake of Terra’s stablecoin crash.
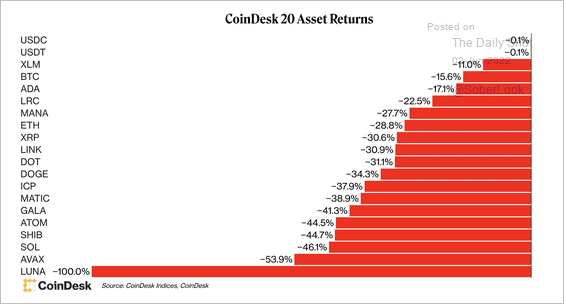 Source: CoinDesk Read full article
4. So far, bitcoin has resisted its seasonal norm. Historically, over the next few months, the odds of a strong return diminish.
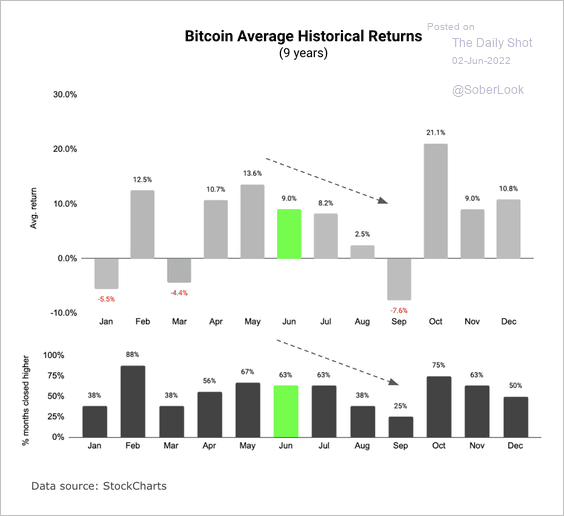 Source: CoinDesk Read full article
5. NFTs currently command 30% to 45% of Ethereum gas consumption and transaction counts on the blockchain.
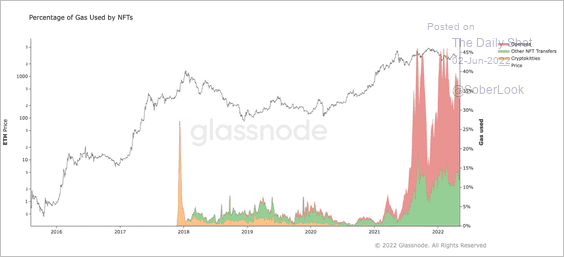 Source: @glassnode
6. A former OpenSea executive who was accused of front-running NFT purchases has been arrested and charged with insider trading.
 Source: TechCrunch Read full article
7. There are over 10 million addresses that hold at least 0.01 BTC.
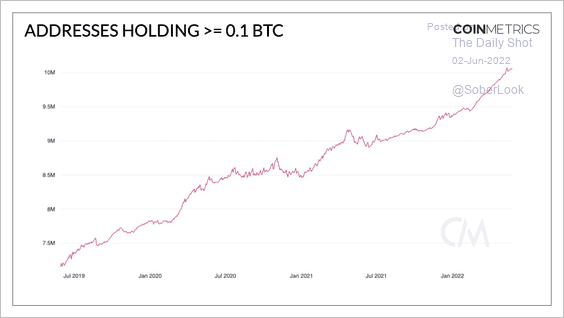 Source: @coinmetrics
Back to Index
Commodities
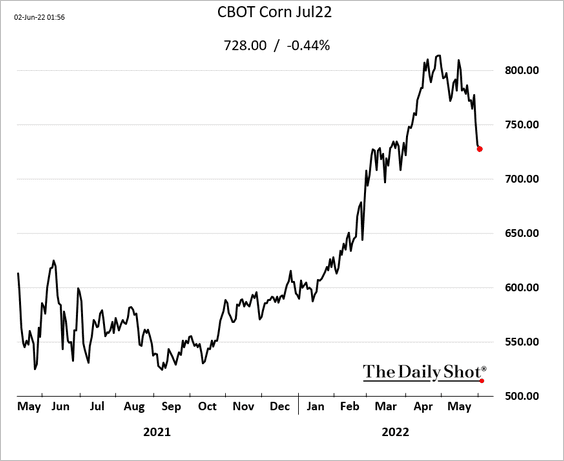
1. US grains remain under pressure.
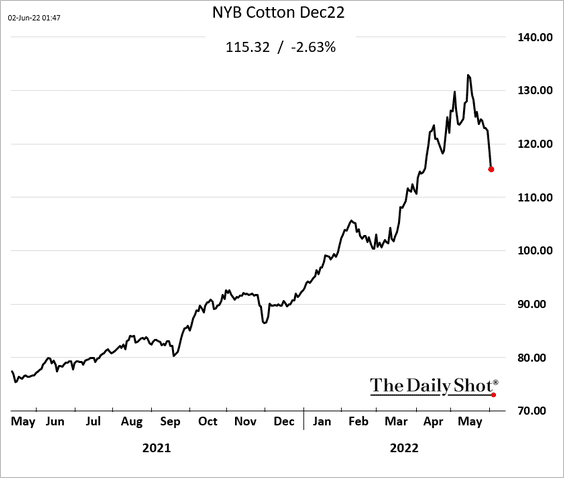
2. Cotton futures took a hit in recent days.
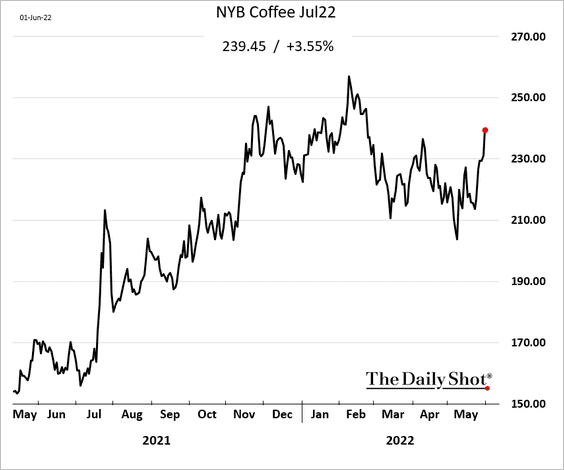
3. Coffee is rebounding due to tightening inventories and cold weather in Brazil.
4. A substantial portion of global sunflower products come from Ukraine, which is exacerbating the US baby formula shortages.
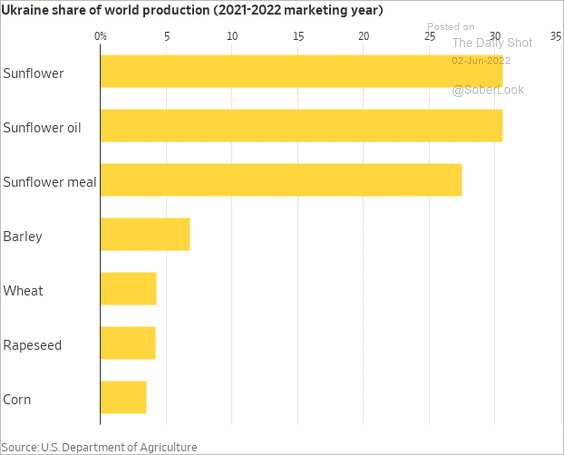 Source: @WSJ Read full article
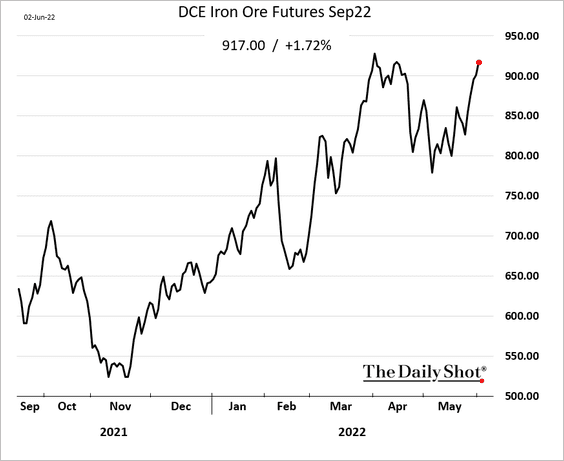
5. Iron ore is rallying as China’s lockdowns ebb.
Brazil’s rising iron ore output growth will provide ample supplies for the market in the years ahead.
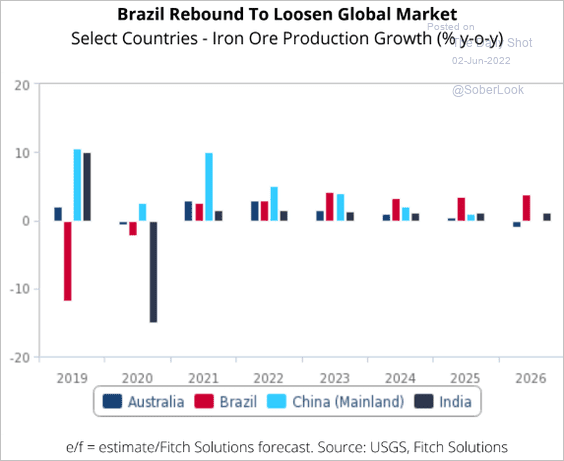 Source: Fitch Solutions Macro Research
Back to Index
Energy
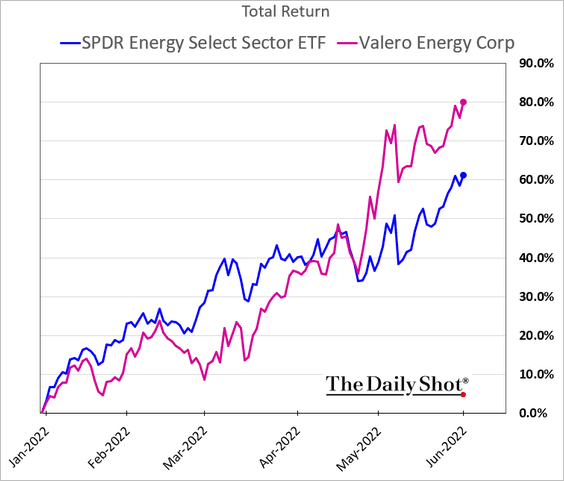
1. Crack spreads are surging (these charts show weekly data), …
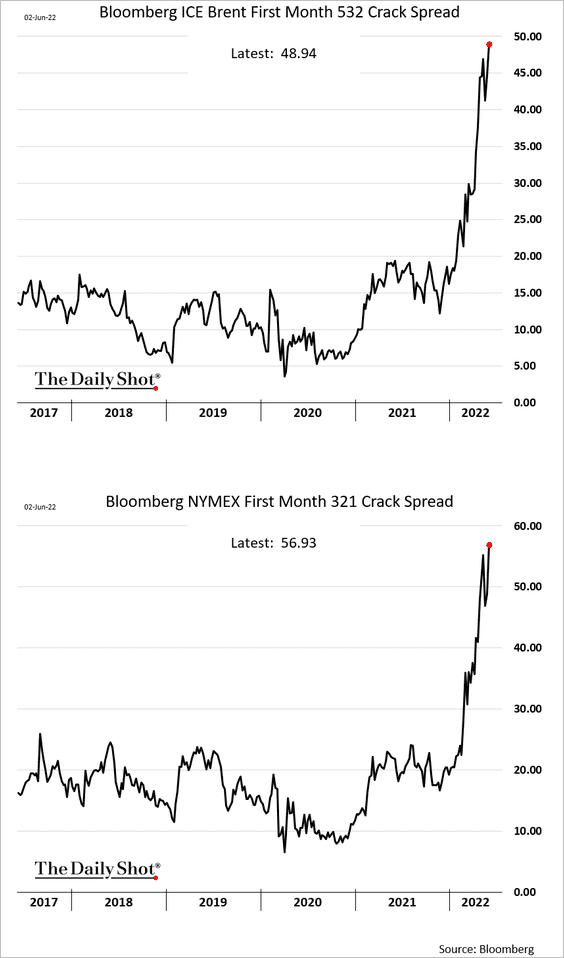
… boosting refinery margins.
• A shortage of distillates has been a tailwind for refining margins.
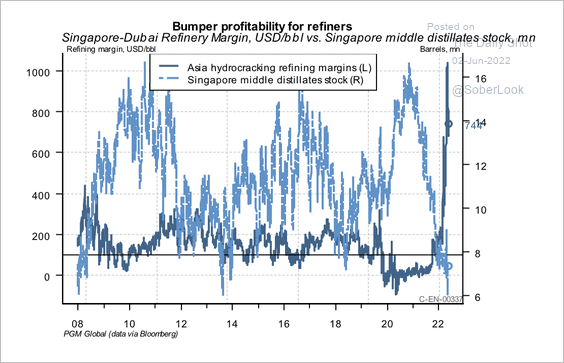 Source: PGM Global
• The US East Coast has been struggling with record low distillates and jet fuel inventories.
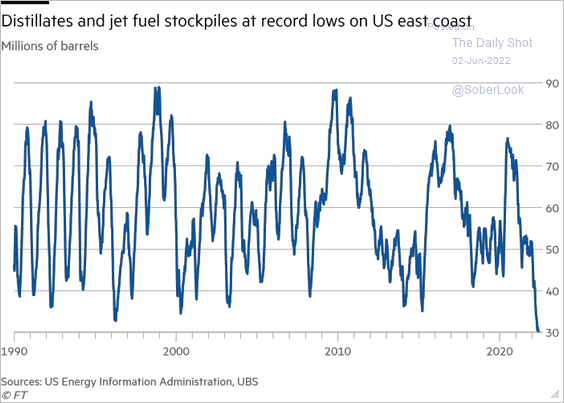 Source: @jessefelder, @financialtimes Read full article
• Here is the spread between Gulf Coast and RBOB (New York Harbor) gasoline prices.
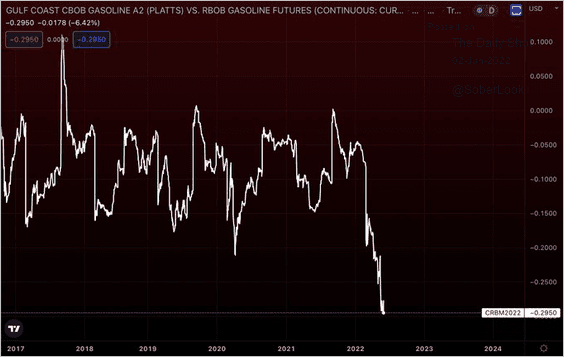 Source: @AlessioUrban
——————–
2. Natural gas output from Russia’s Gazprom was down 14% compared to last year in May. Deliveries to domestic customers rose last month because of unusually cold weather. Meanwhile, exports to Europe declined as more regional customers decided not to switch to ruble payments.
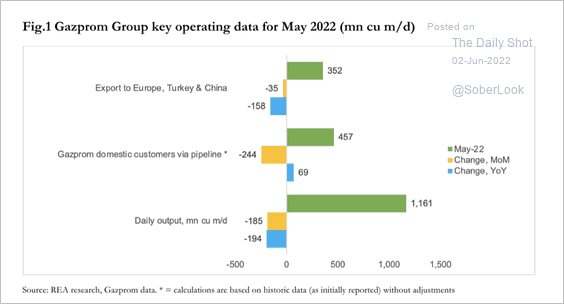 Source: Nadia Kazakova; Renaissance Energy Advisors
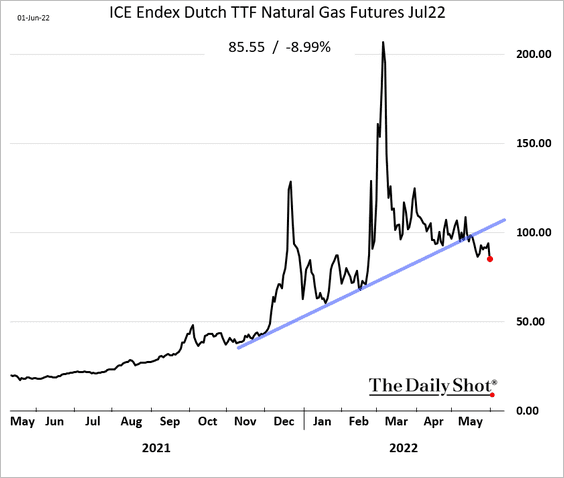
• But European gas prices continue to moderate, …
… while US natural gas trades at multi-year highs. The Europe-US gas price ratio is moving toward its long-term average.
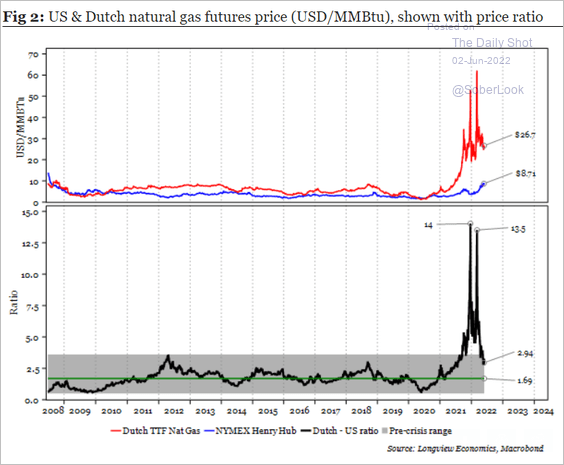 Source: Longview Economics
• Poland’s LNG imports hit a record high, contributing to the gas price declines in Europe. The country helps supply its neighbors.
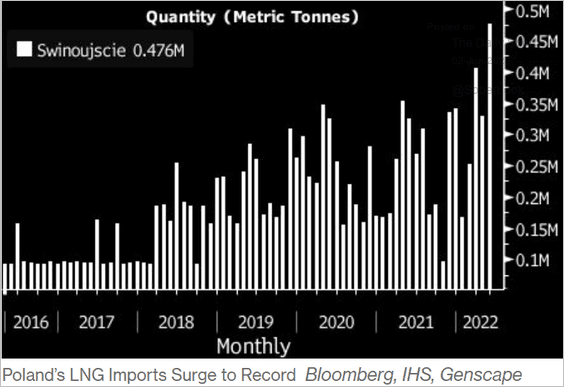 Source: Bloomberg Read full article
——————–
3. Russian crude oil and refined products exports have been stable despite the sanctions.
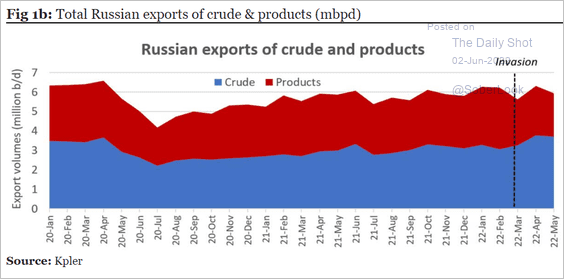 Source: Longview Economics
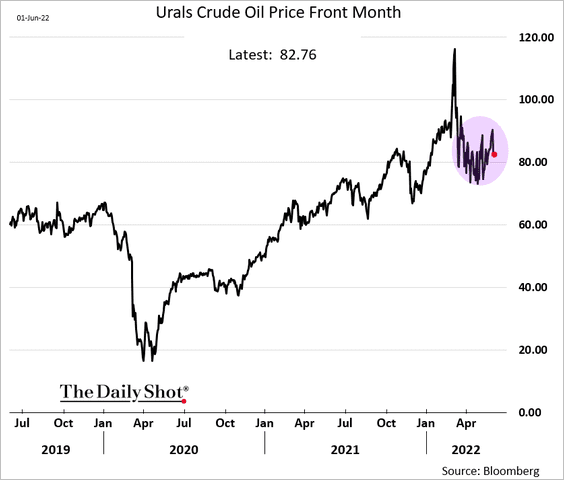
Russian crude oil prices are lower since the start of the war but are up year-to-date.
Back to Index
Equities
1. There has been a significant spike in news articles mentioning “bear market rally,” which previously occurred around market bottoms.
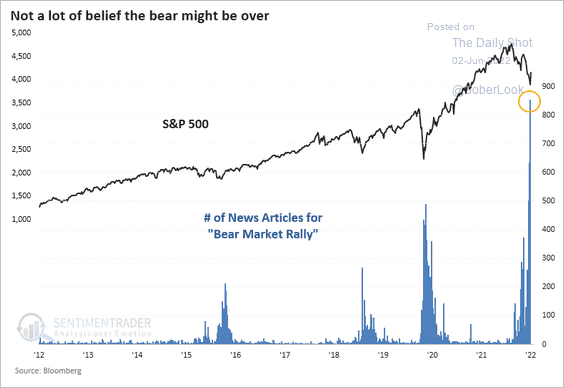 Source: SentimenTrader
Here is the search activity for “bear market rally” on Google.
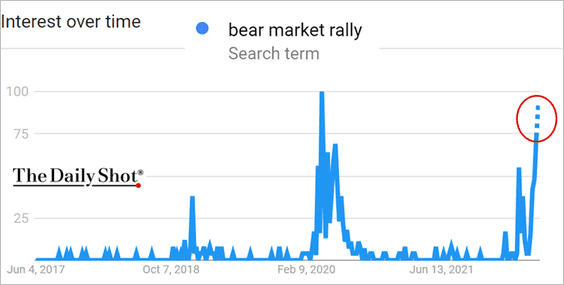 Source: Google Trends
——————–
2. Next, we have last month’s large-cap performance around the world.
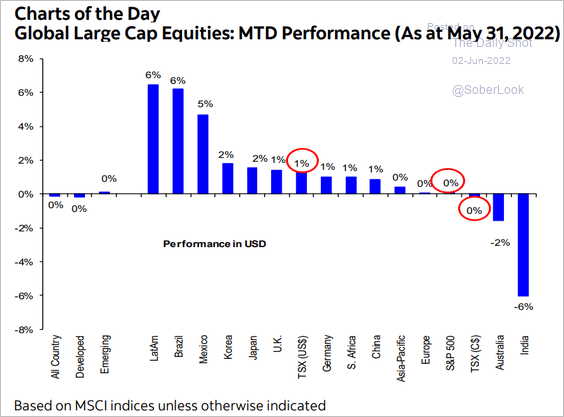 Source: Hugo Ste-Marie, Portfolio & Quantitative Strategy Global Equity Research, Scotia Capital
3. US equities are 60% of the global market capitalization versus a 25% weight in global GDP.
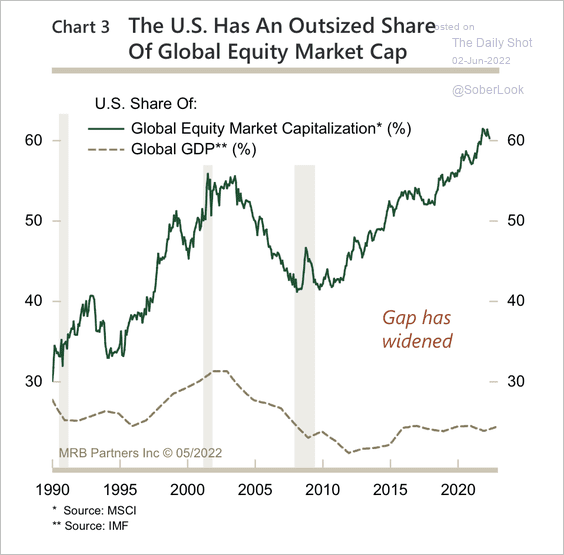 Source: MRB Partners
4. The spread between the best- and worst-performing sectors is extremely wide.
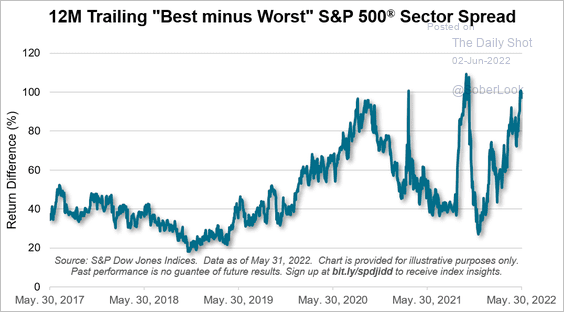 Source: S&P Dow Jones Indices
5. The stocks/commodity ratio is breaking below its long-term uptrend, similar to what occurred during previous market shocks.
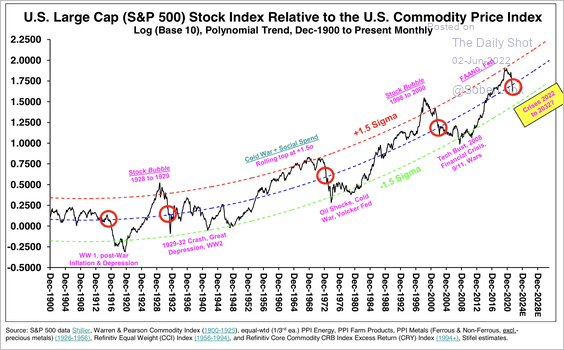 Source: Stifel
6. The market continues to price in a recession.
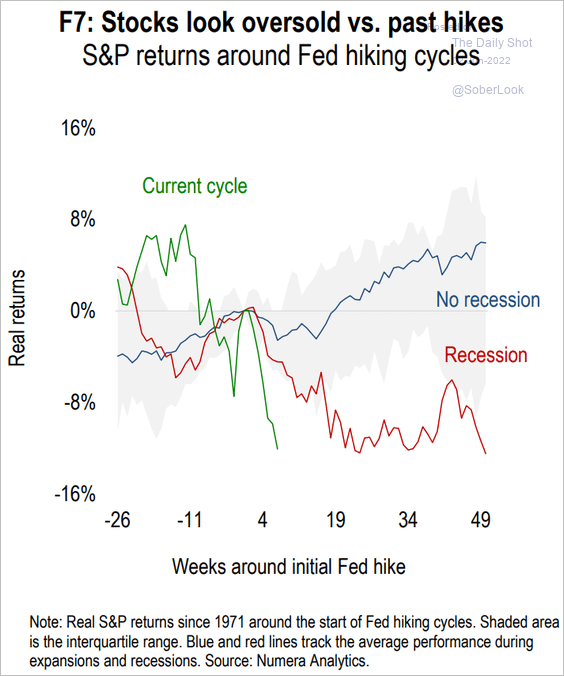 Source: Numera Analytics
7. VIX tends to rise sharply at the start of recessions.
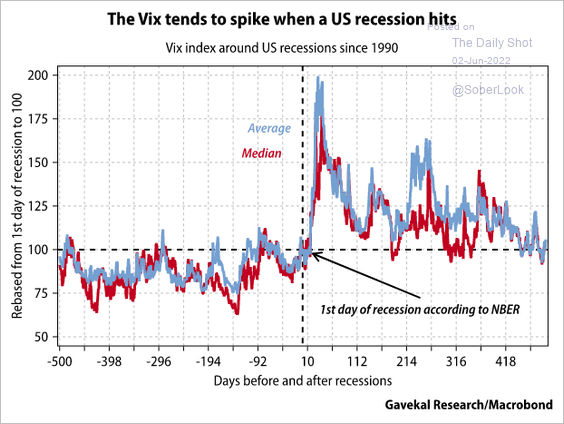 Source: Gavekal Research
8. Retail investors have been buying out-of-the-money puts.
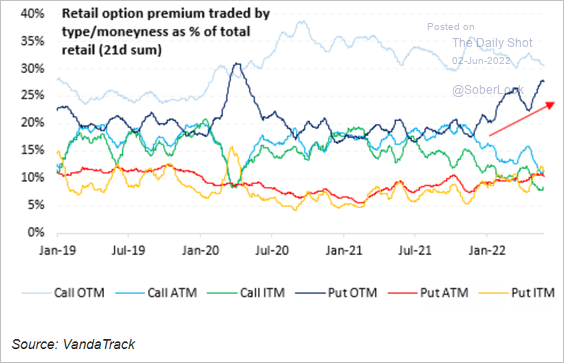 Source: Vanda Research
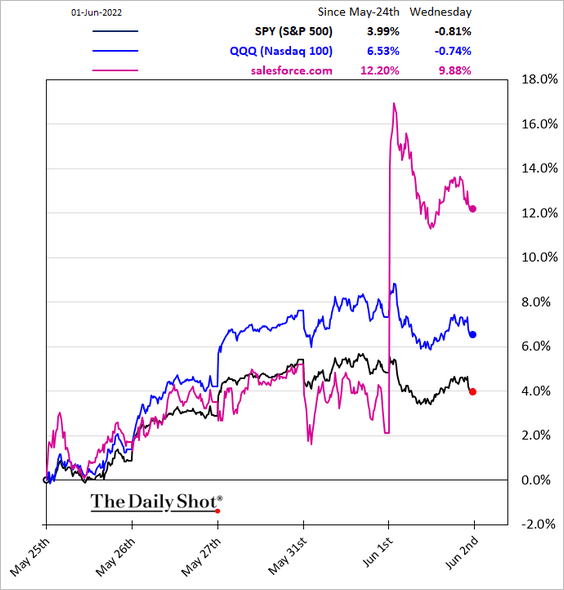
9. Demand for business software is holding up.
Back to Index
Credit
1. The ratio between US investment-grade bond advancing and declining issues surged higher in recent days.
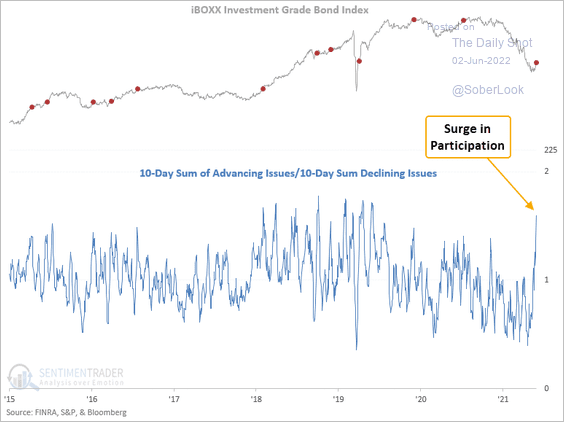 Source: SentimenTrader
2. In a high-stress scenario, the share of US speculative-grade issuers generating negative free operating cash flow (FOCF) jumps to around 39% from under 14.9% (base case), according to S&P Global Ratings.
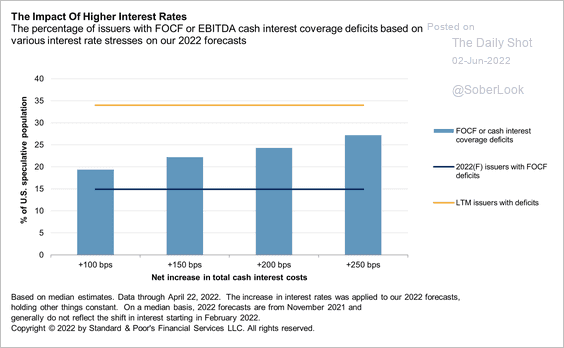 Source: S&P Global Ratings
3. The number of zombie firms remains elevated.
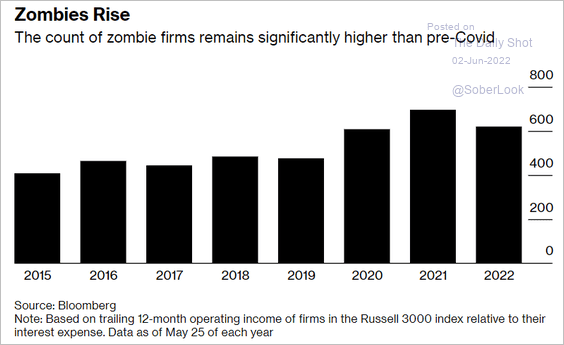 Source: Bloomberg Read full article
Back to Index
Rates
1. Retail investors jumped back into bonds this week.
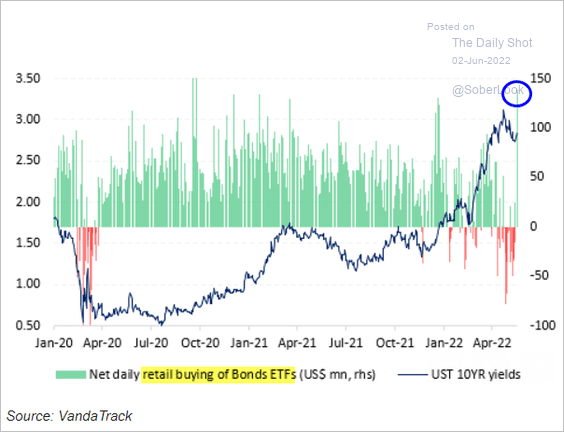 Source: Vanda Research
2. The average maturity of Treasury securities continues to climb.
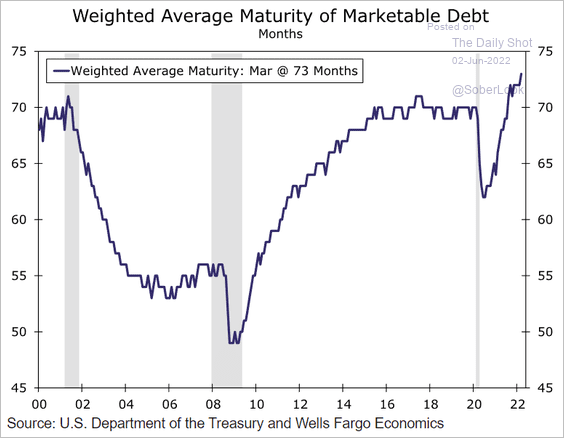 Source: Wells Fargo Securities
Back to Index
Global Developments
1. Here is a summary of global manufacturing activity (PMI) in May, by country.
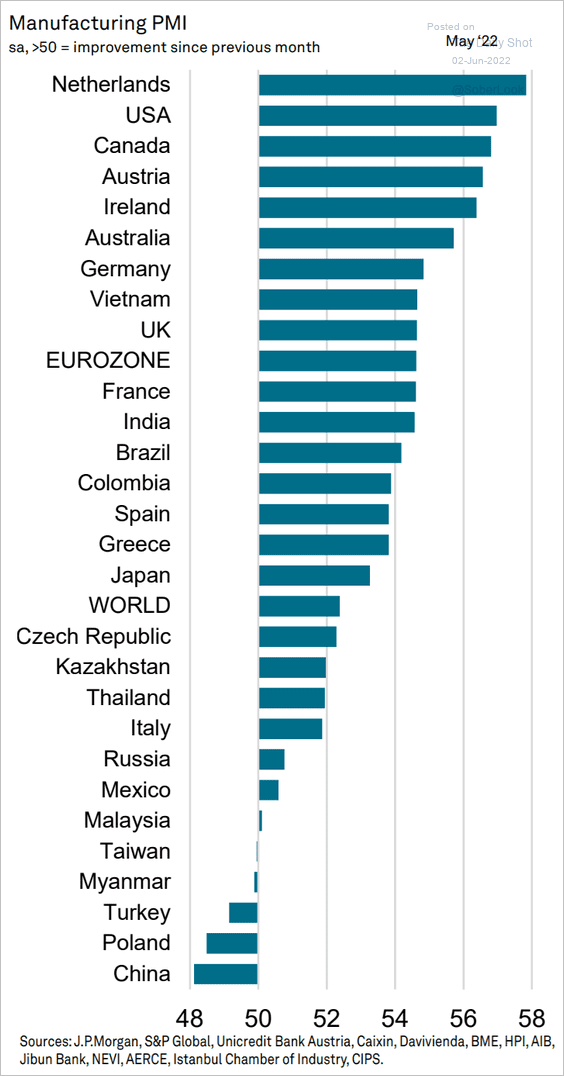 Source: S&P Global PMI
2. Commodity supply and price pressures are holding near extreme levels.
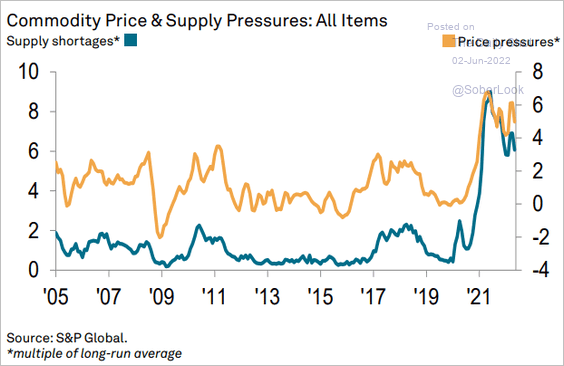 Source: S&P Global PMI
——————–
Food for Thought
1. Infant formula shortages, by state:
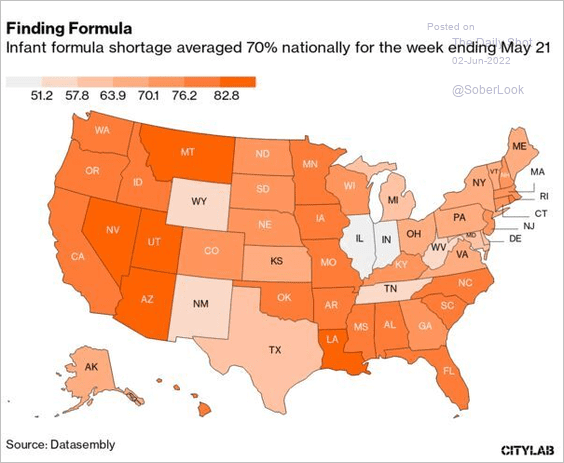 Source: @bloomberggov Read full article
2. Childcare costs in the US:
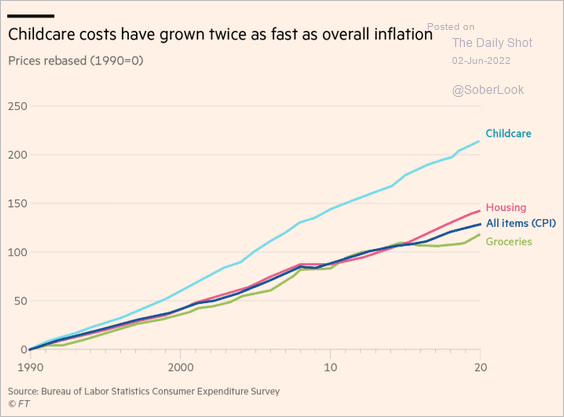 Source: @financialtimes Read full article
• Childcare spending by state:
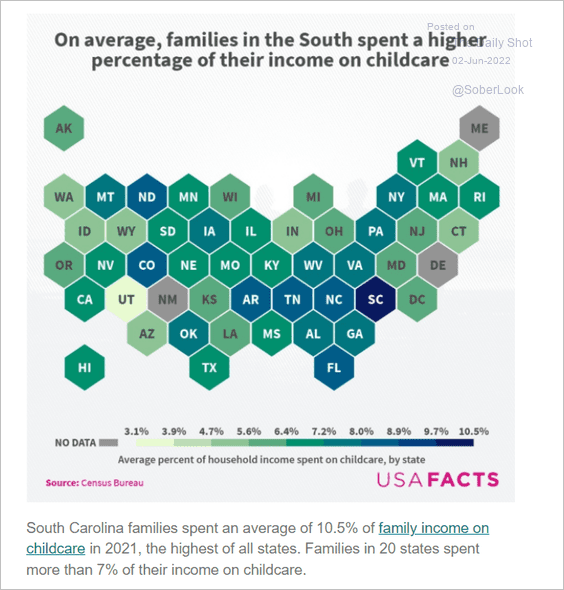 Source: USAFacts
——————–
3. Who gets blamed for rising US student debt?
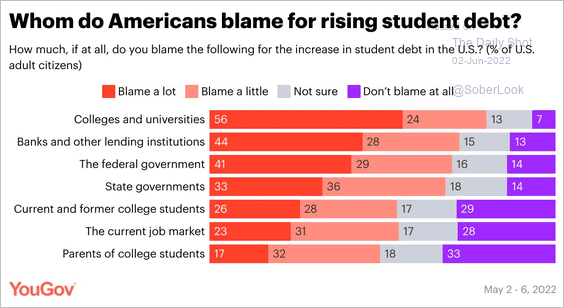 Source: @YouGovAmerica Read full article
4. Hourly wages in the food service industry:
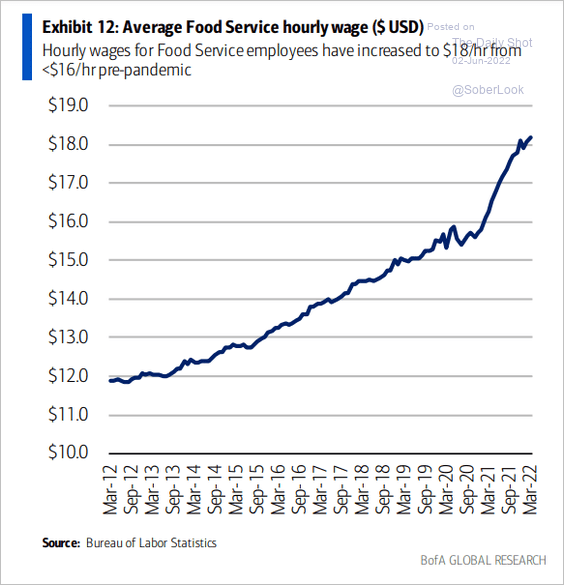 Source: BofA Global Research; @MikeZaccardi
5. Political polarization in Western democracies:
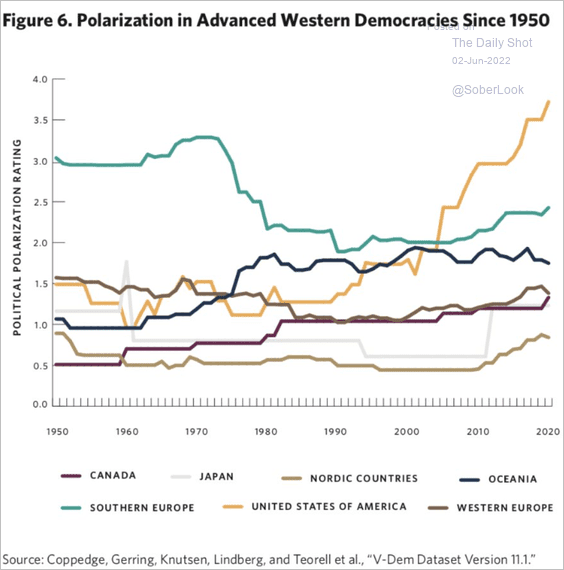 Source: @Yascha_Mounk
6. K-12 school shootings:
 Source: Statista
7. US foreign aid:
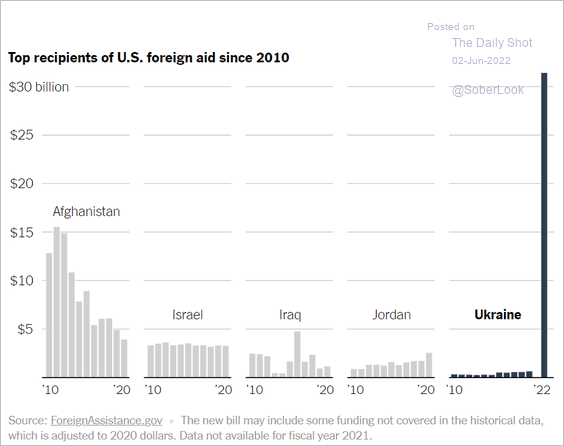 Source: The New York Times Read full article
8. Origins of elements in the Solar System:
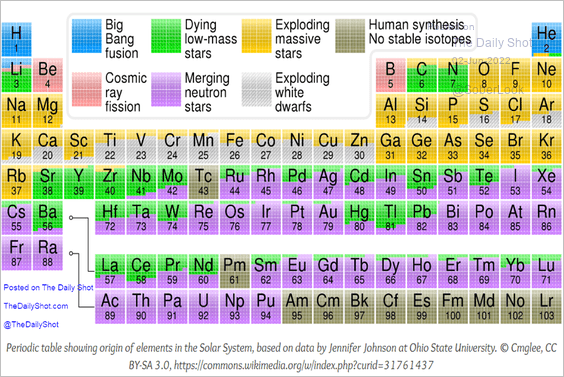 Source: Max Planck Institute for Gravitational Physics
——————–
Back to Index