
The Daily Shot: 06-Jun-22
• The United States
• The United Kingdom
• The Eurozone
• Asia – Pacific
• China
• Emerging Markets
• Cryptocurrency
• Commodities
• Energy
• Equities
• Credit
• Global Developments
• Food for Thought
The United States
1. The jobs market held up better than expected in May, …
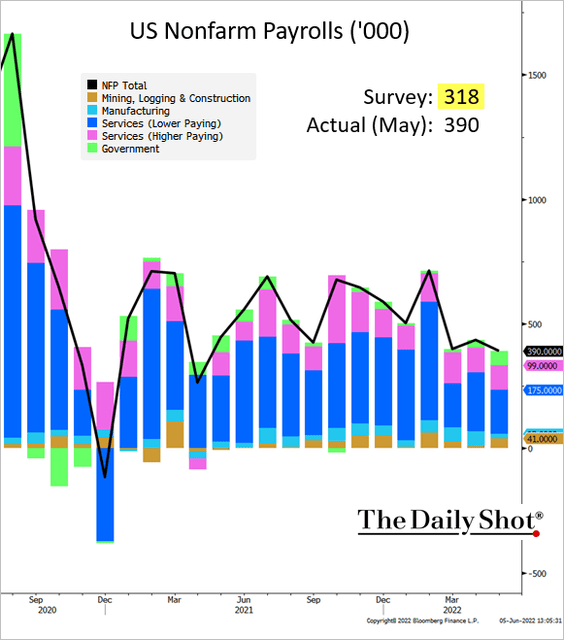 Source: @TheTerminal, Bloomberg Finance L.P.
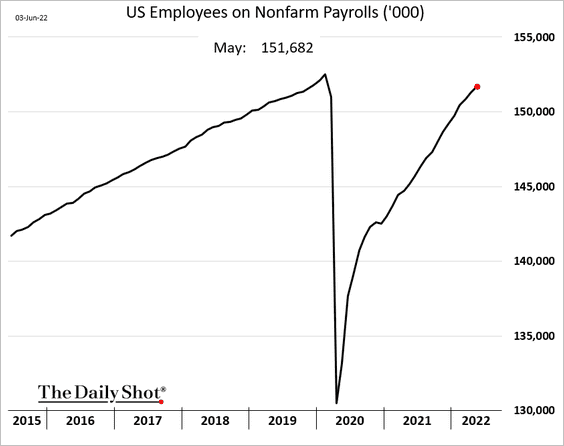
… with total employment nearing the pre-COVID peak.
• Here is the labor market recovery by industry wage tier.
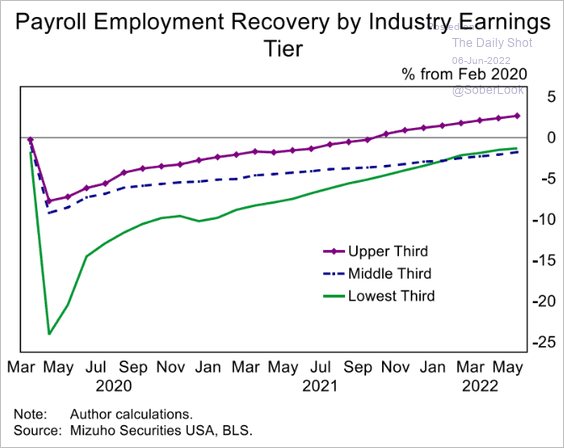 Source: Mizuho Securities USA
• The retail sector registered some job losses.
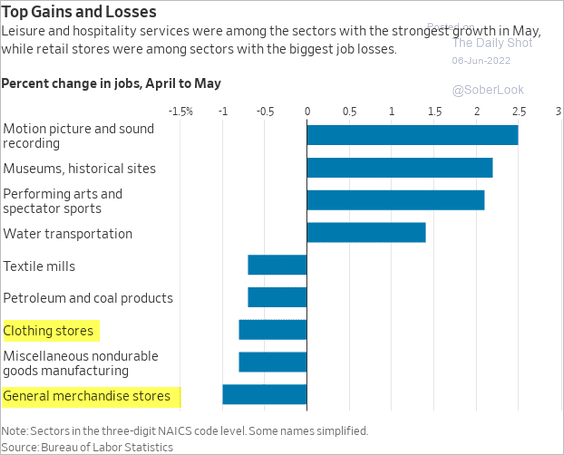 Source: @WSJ Read full article
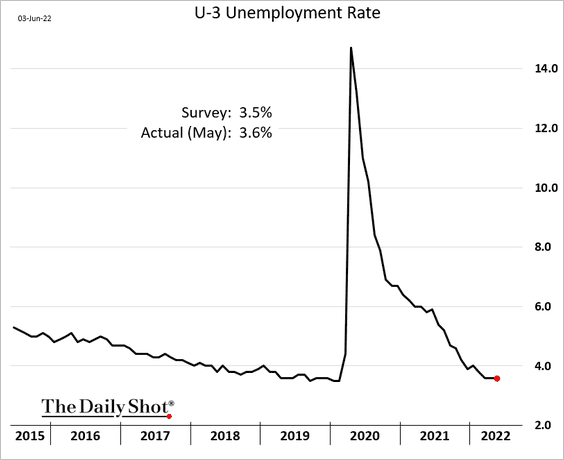
• The unemployment rate was unchanged, …
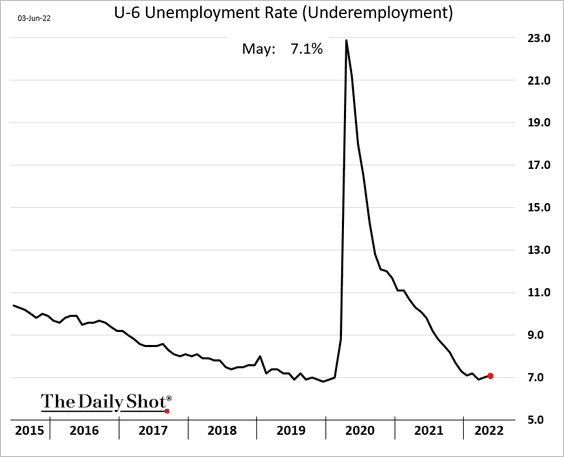
… but underemployment ticked up.
• Prime-age labor force participation continues to rebound, which should ease wage pressures (as more Americans return to work).
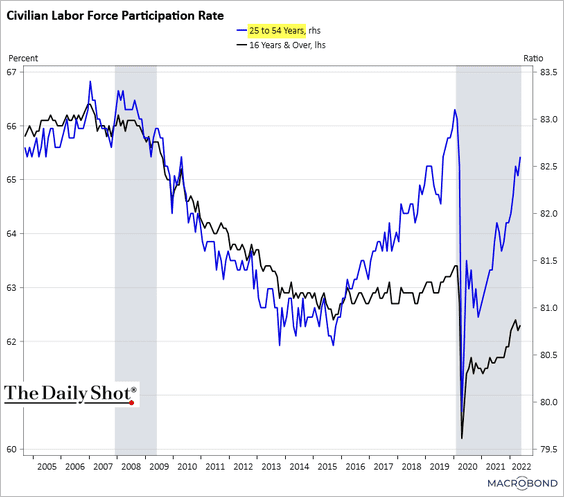 Source: Chart and data provided by Macrobond
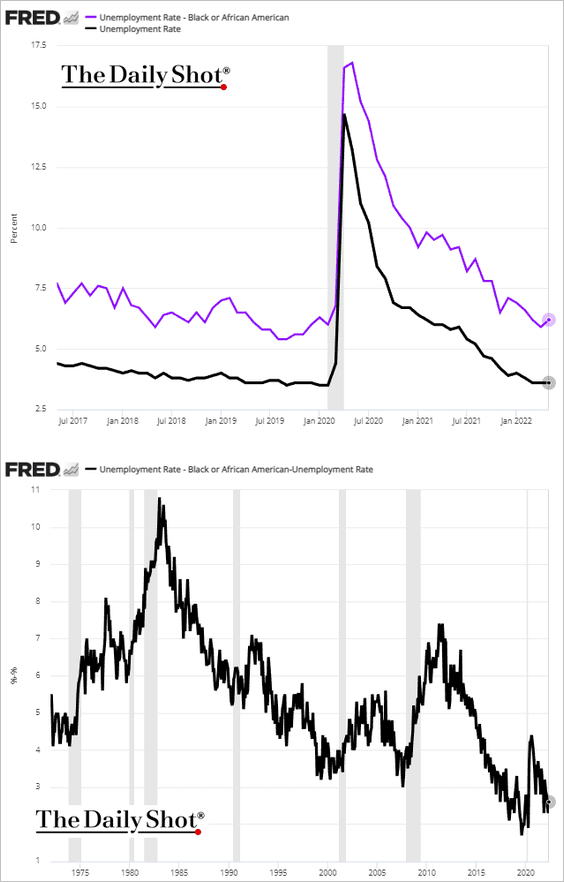
The labor force participation rate among African Americans surged in May, approaching its pre-COVID peak.
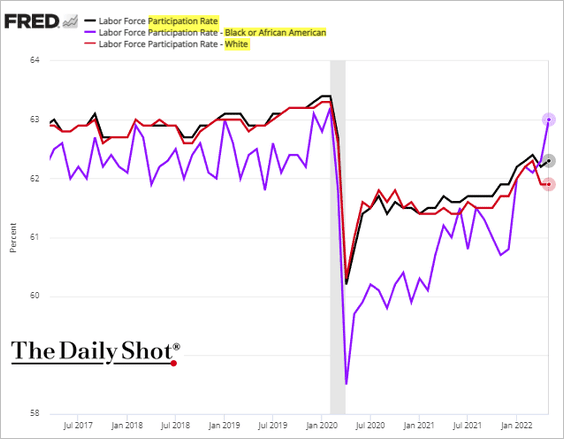
As a result, the unemployment rate ticked higher (1st panel below). The second panel shows the spread between the unemployment rate among African Americans and the total rate.
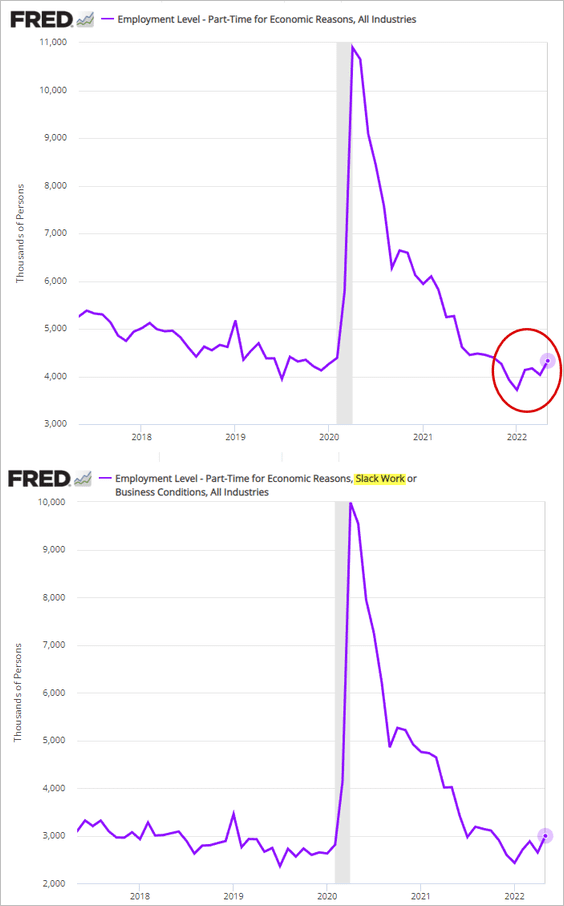
• One area of concern in the jobs report was an uptick in part-time employment for “economic reasons.”
• Wage growth appears to be slowing (helped by stronger labor force participation), …
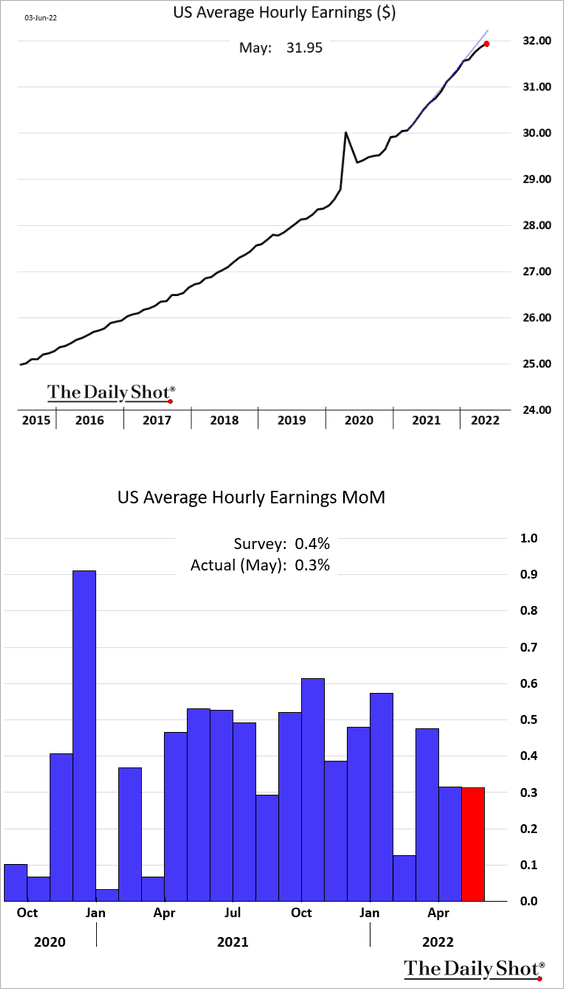
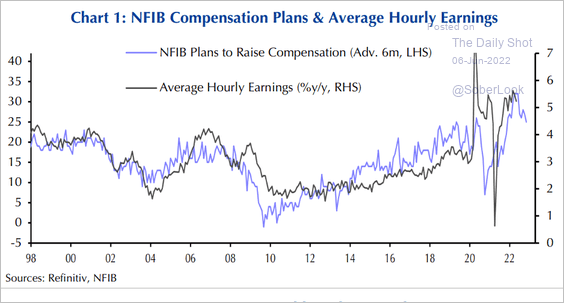
…. a trend which is likely to continue.
 Source: Capital Economics
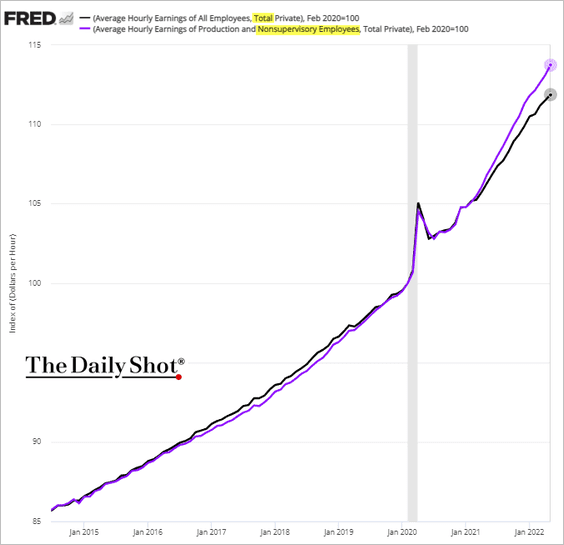
• Nonsupervisory workers’ wages keep outperforming.
• Overall, the labor market looks stronger than it was prior to the pandemic.
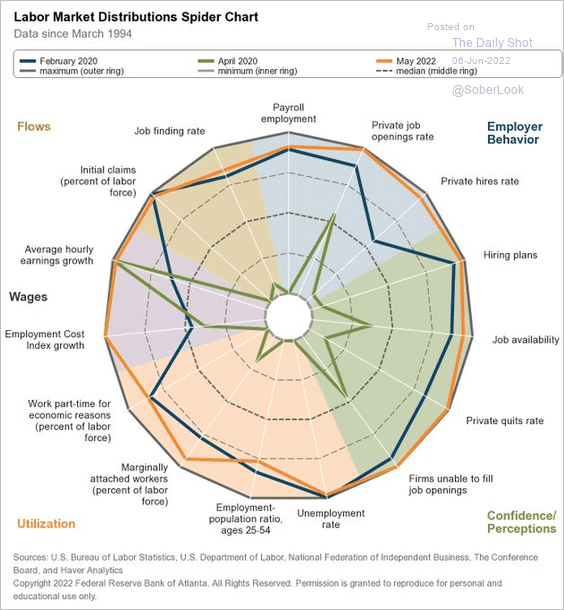 Source: @AtlantaFed
But hiring is likely to slow in the months ahead amid increased focus on cost-cutting.
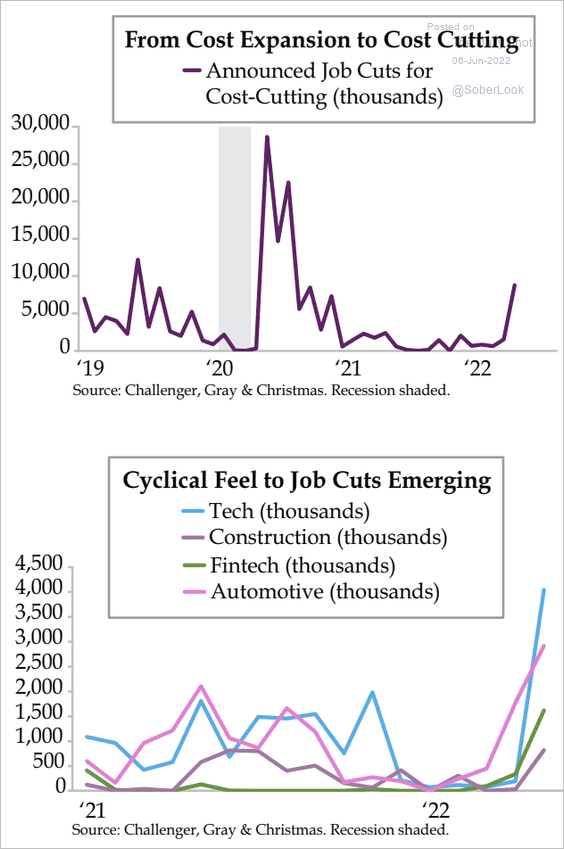 Source: Quill Intelligence
——————–
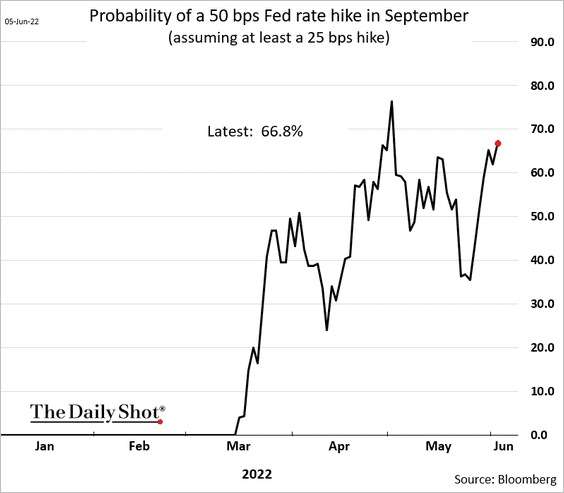
2. The market increasingly expects a 50 bps rate hike in September. The “pause” talk has died down for now.
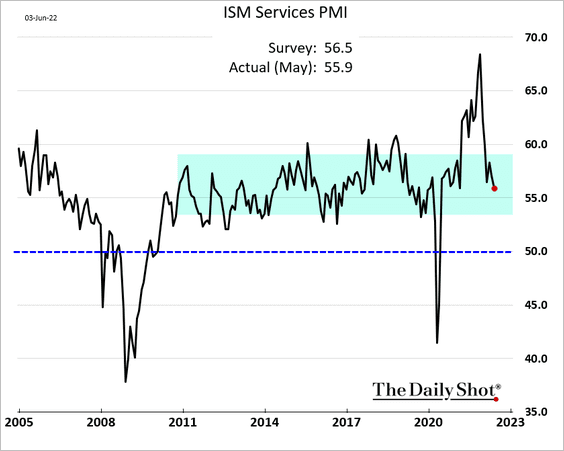
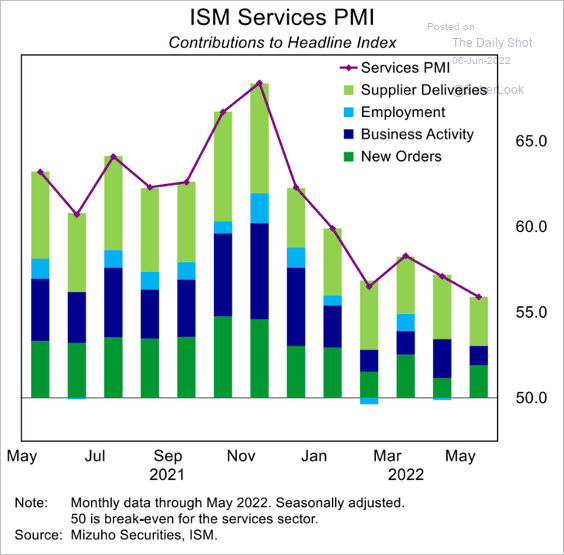
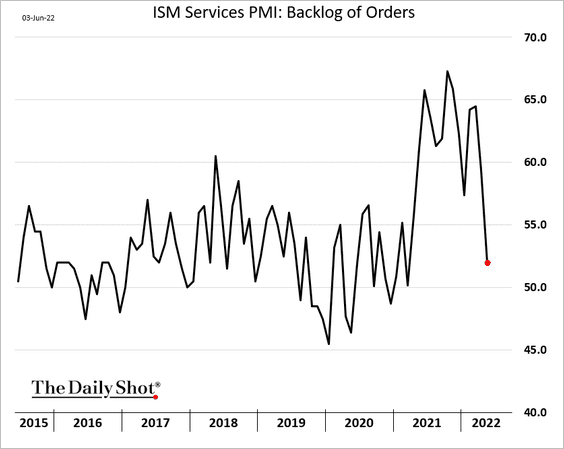
3. The pandemic-era surge in service-sector growth is over. The ISM service PMI is well inside its pre-COVID range.
 Source: Mizuho Securities USA
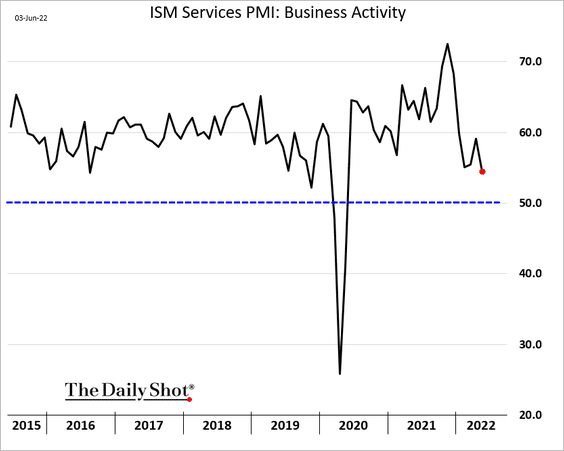
Here is the business activity index.
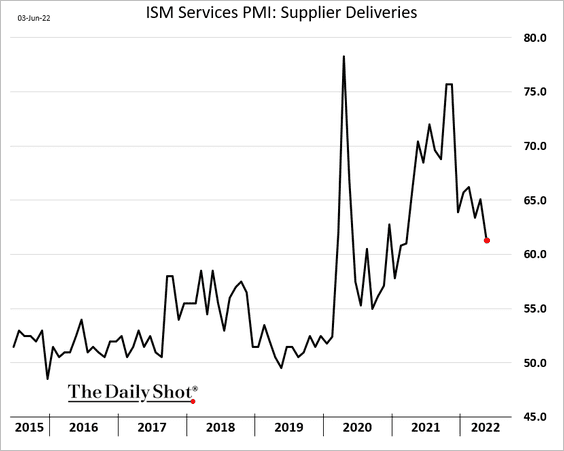
Supply pressures are easing.
• Supplier delivery times:
• Backlog of orders:
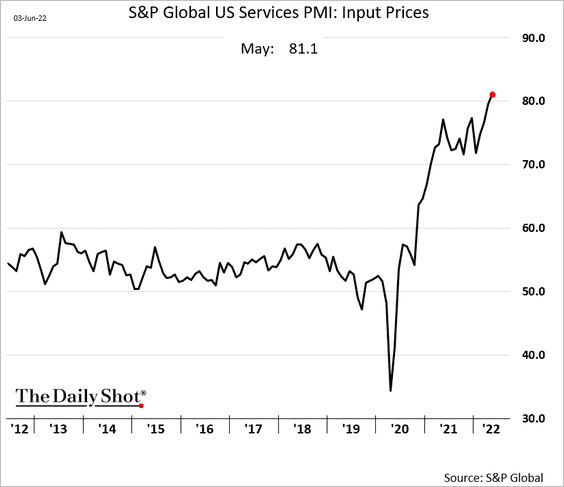
A separate service-sector PMI report from S&P Global showed accelerating input costs (likely driven by energy prices).
——————–
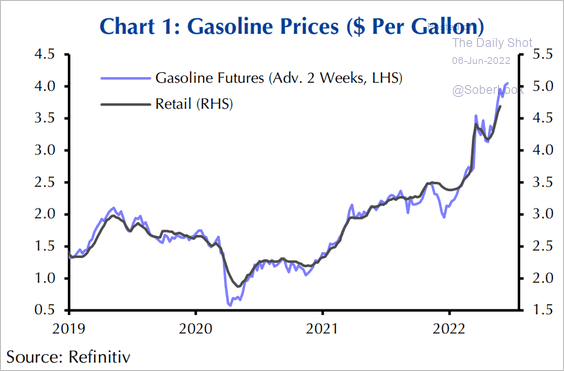
4. Retail gasoline prices are headed higher, which will keep pressuring consumer sentiment.
 Source: Capital Economics
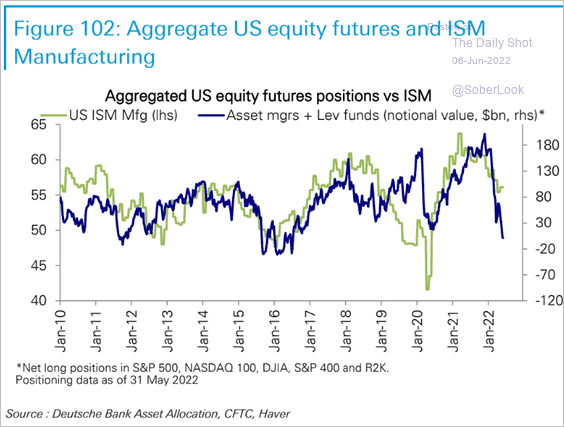
5. Equity futures traders are betting on deterioration in economic activity (and earnings).
 Source: Deutsche Bank Research
• The hit to household wealth could become a drag on consumption.
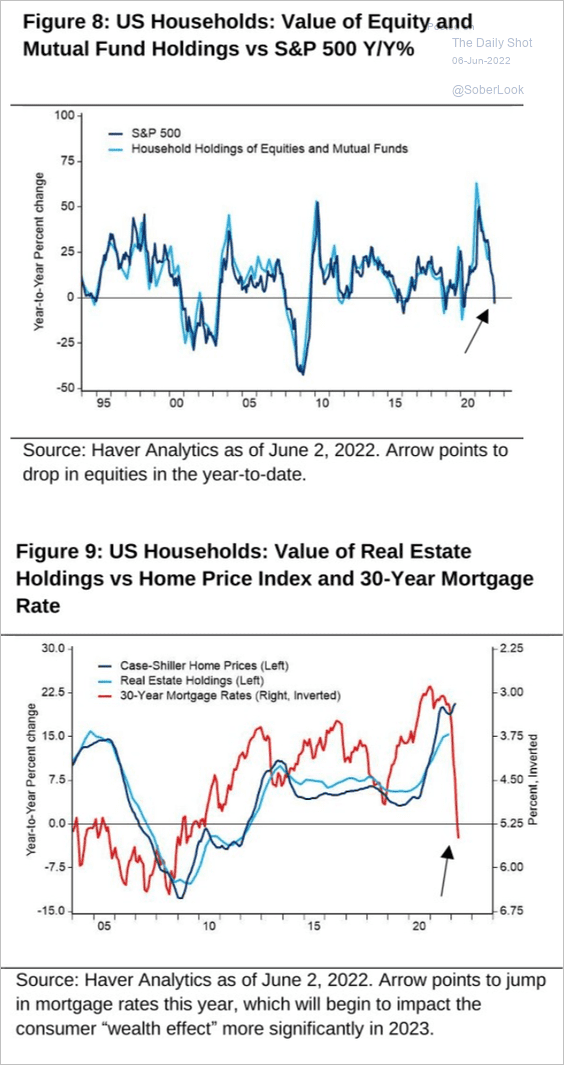 Source: Citi Private Bank
• Danske Bank expects a recession in the US next year, …
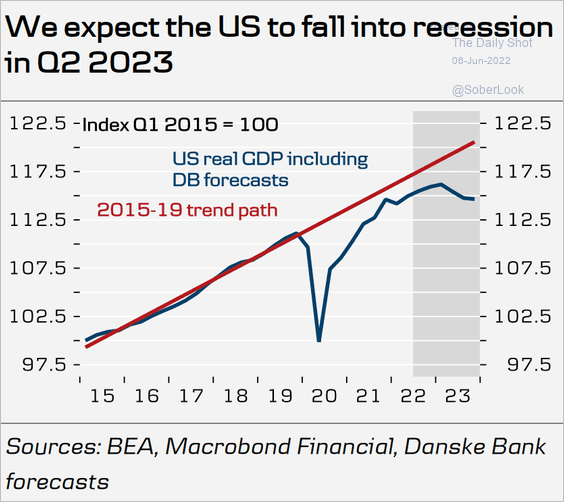 Source: Danske Bank
… as inflation takes a toll on spending.
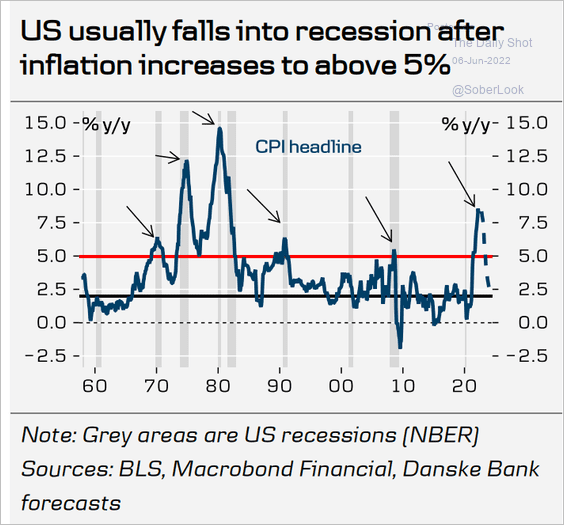 Source: Danske Bank
Back to Index
The United Kingdom
1. Weak consumer confidence doesn’t bode well for household spending.
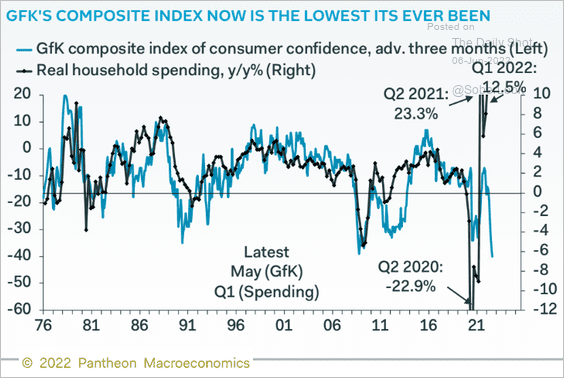 Source: Pantheon Macroeconomics
2. The pound could decline further against the euro.
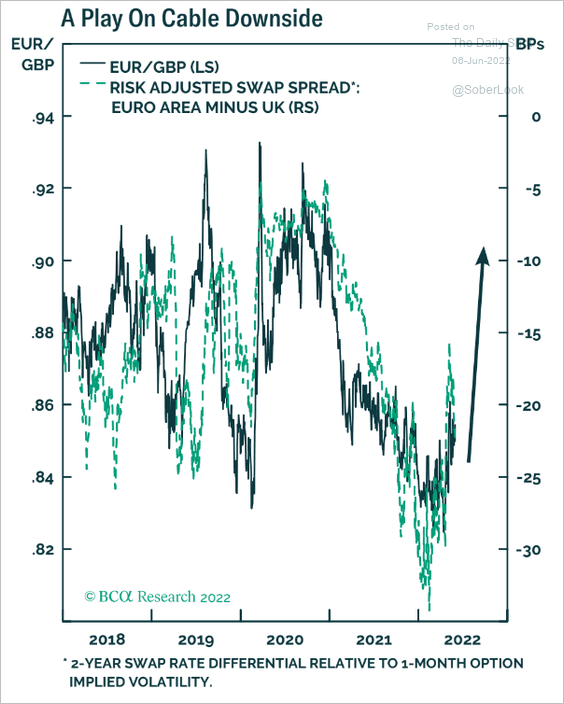 Source: BCA Research
3. Concerns about immigration have eased.
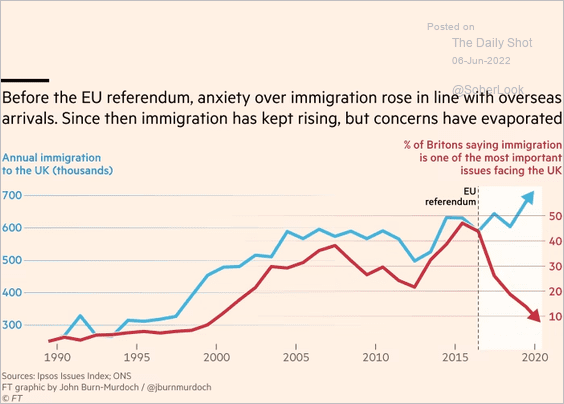 Source: @financialtimes Read full article
Back to Index
The Eurozone
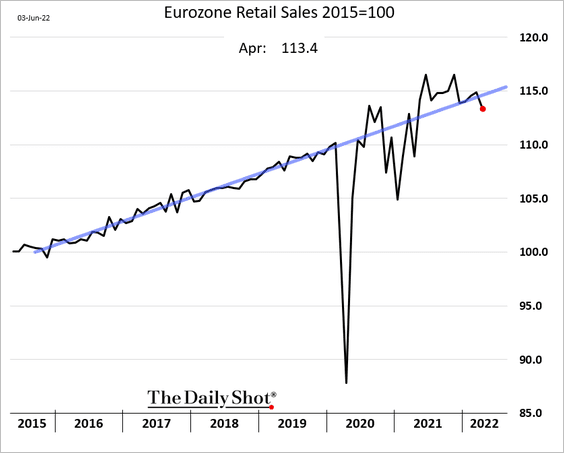
1. Euro-area retail sales dipped below the trendline in April.
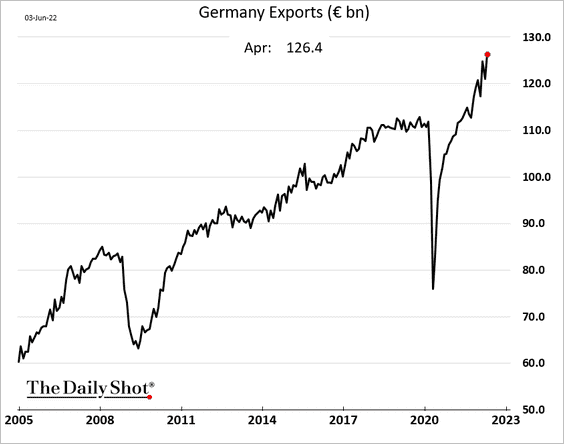
2. Germany’s trade balance remains depressed, due in part to energy costs and weak demand from China.
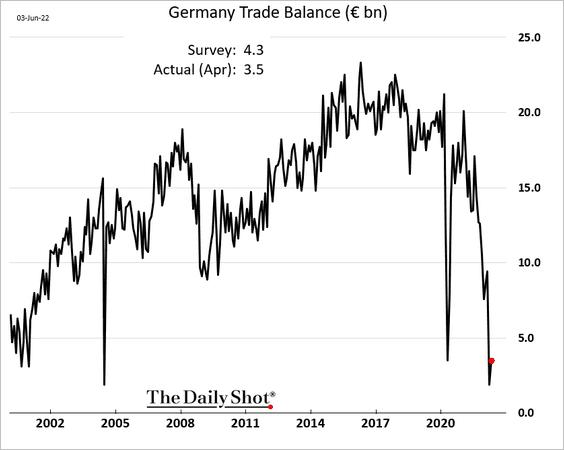
But exports are surging.
——————–
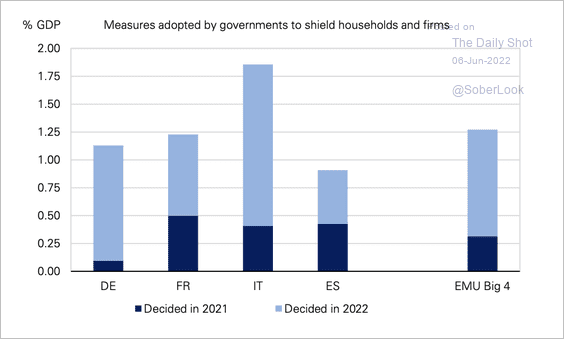
3. Significant fiscal support has partially alleviated the impact of higher energy prices.
 Source: Deutsche Bank Research
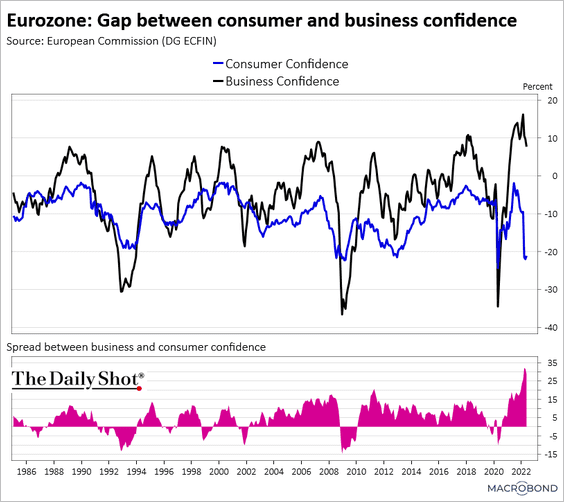
4. The gap between consumer and business confidence hit a record high this year.
 Source: Chart and data provided by Macrobond
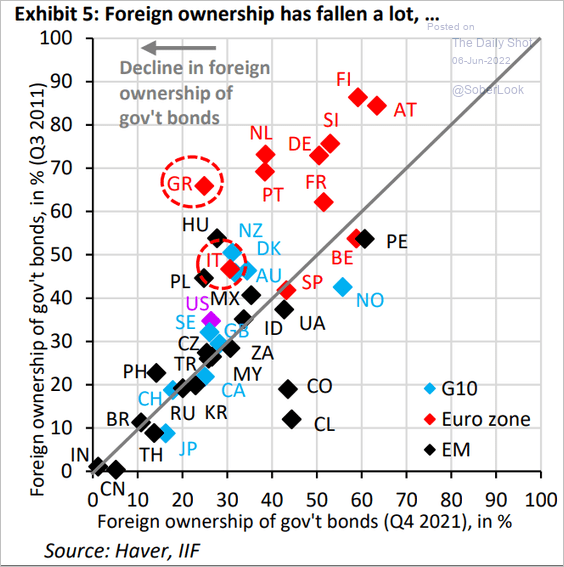
5. Foreign ownership of euro-area sovereign bonds has declined substantially.
 Source: IIF
Back to Index
Asia – Pacific
1. South Korea’s inflation has been broad, with the core CPI rising well above the BoK’s target.
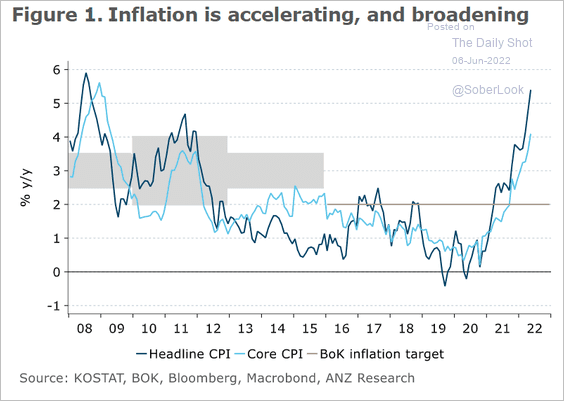 Source: @ANZ_Research
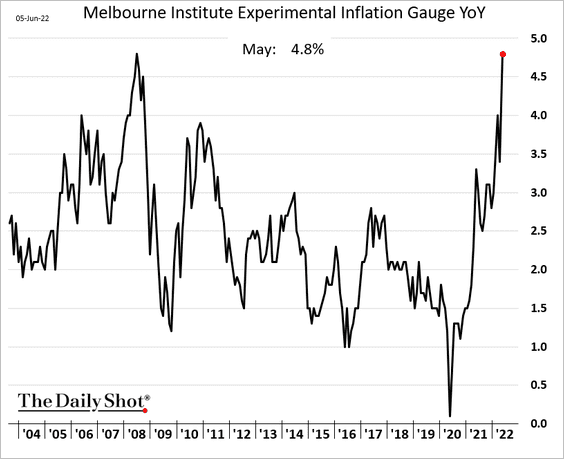
2. Australian inflation is accelerating.
Back to Index
China
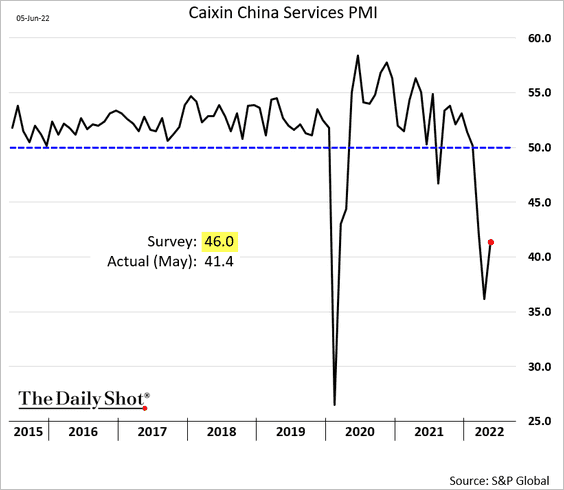
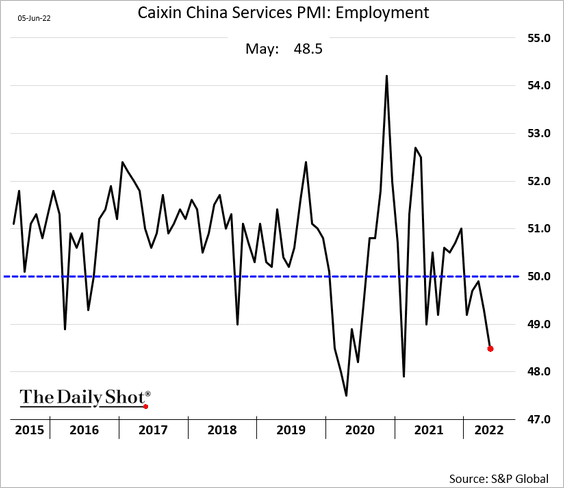
1. Service sector activity continues to contract.
The labor market is under pressure.
——————–
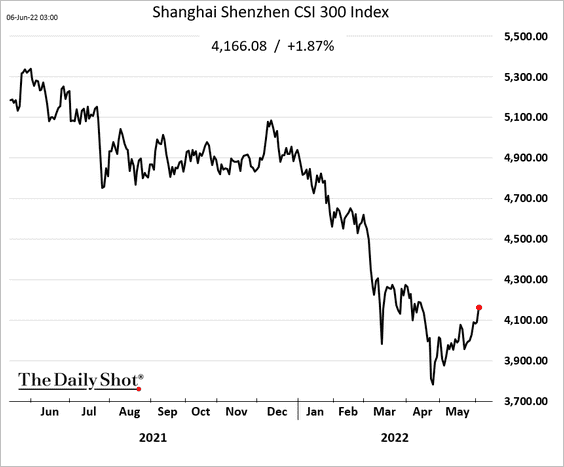
2. The stock market is rebounding as foreign investors return.
3. Offshore debt defaults accelerated this year, …
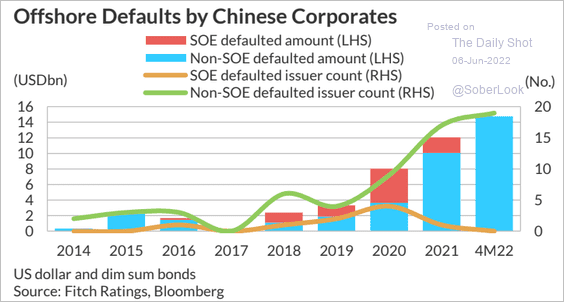 Source: Fitch Ratings
… amid increased balance sheet stress.
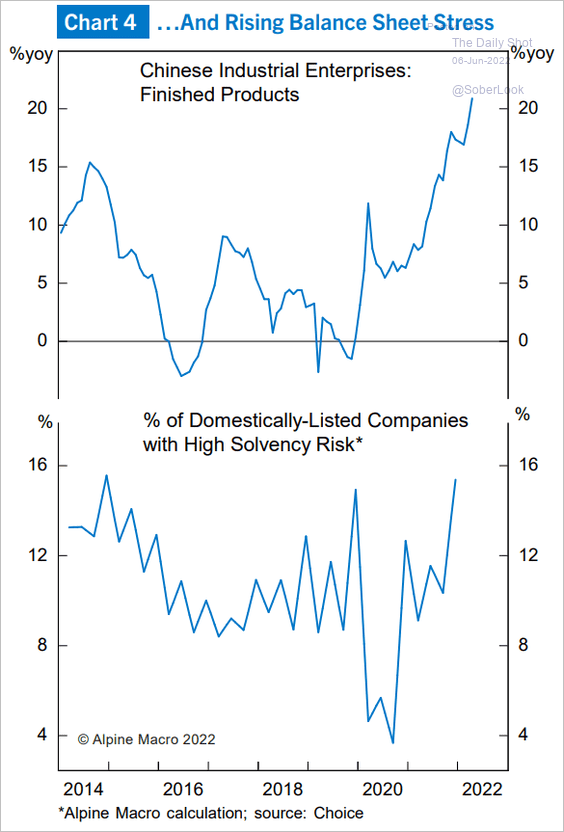 Source: Alpine Macro
Profitability has been deteriorating. Here is the percentage of money-losing companies.
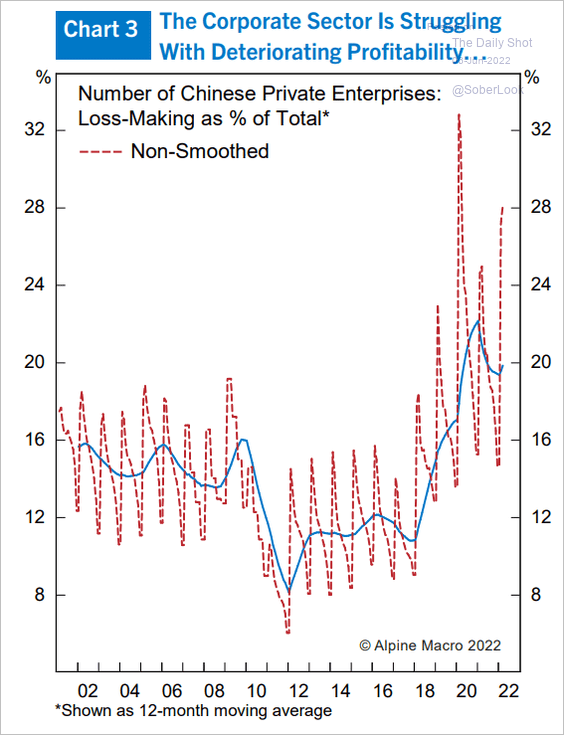 Source: Alpine Macro
——————–
4. Hong Kong’s business activity grew at the fastest pace in over a decade in May.
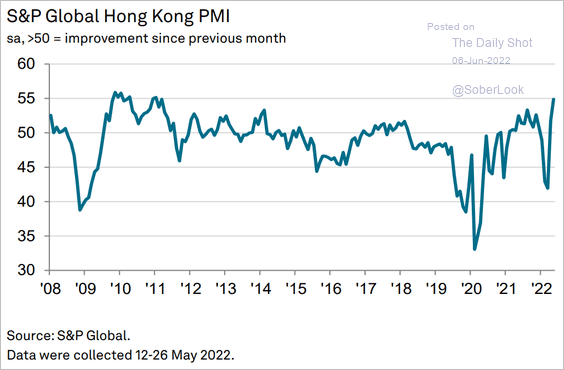 Source: S&P Global PMI
Back to Index
Emerging Markets
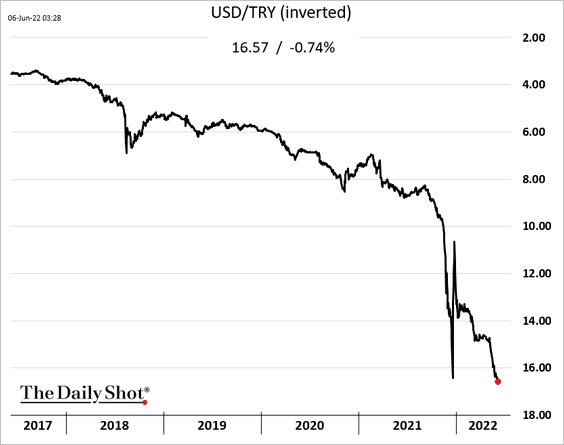
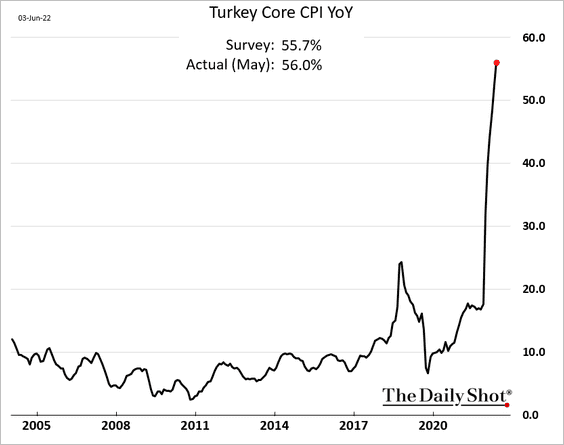
1. The Turkish lira keeps weakening, exacerbating (hyper)inflationary pressures.
The core CPI hit 56%.
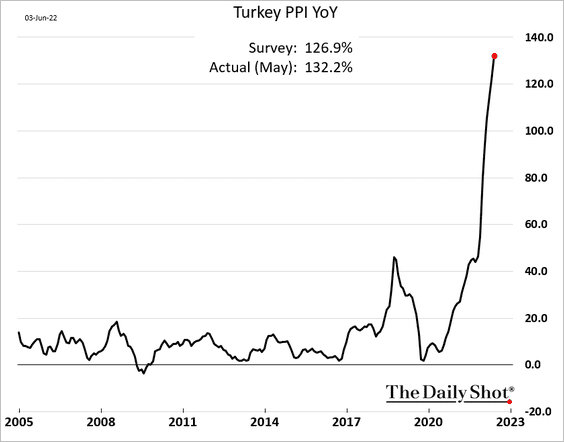
And the PPI is above 130%.
——————–
2. LatAm inflation has been soaring.
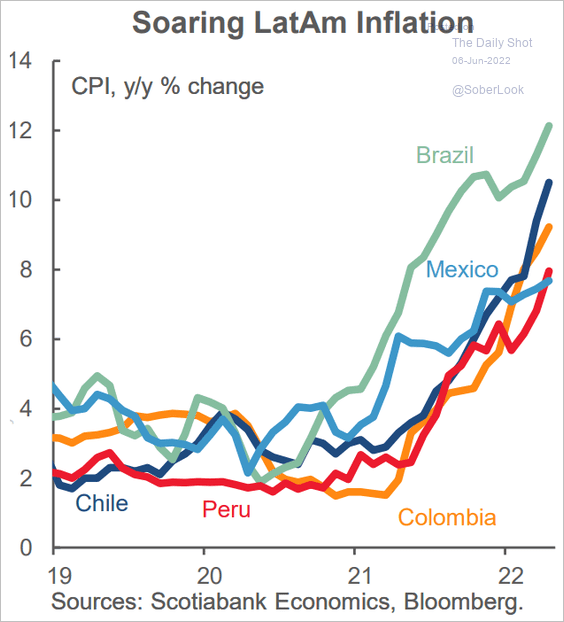 Source: Scotiabank Economics
3. EM bond funds continue to see outflows.
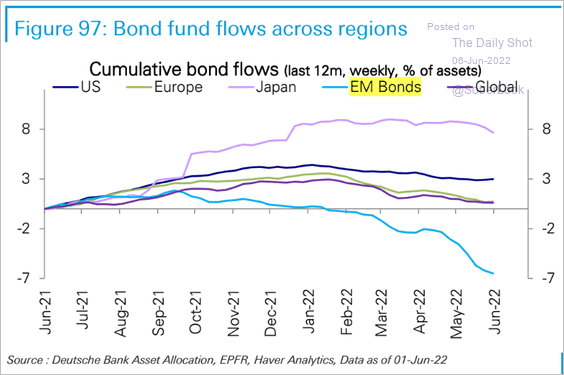 Source: Deutsche Bank Research
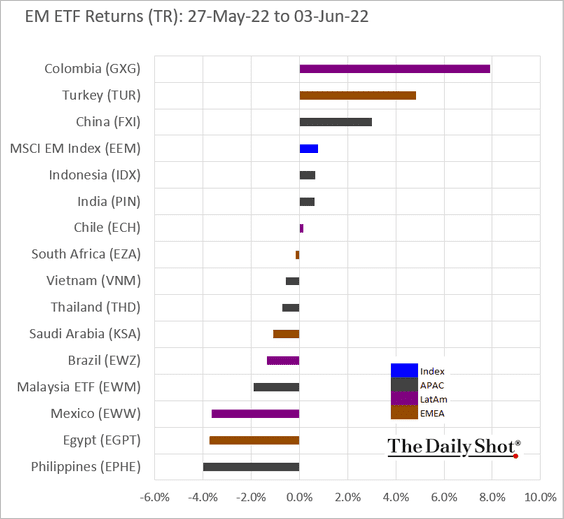
4. Here is last week’s performance data.
• Currencies:
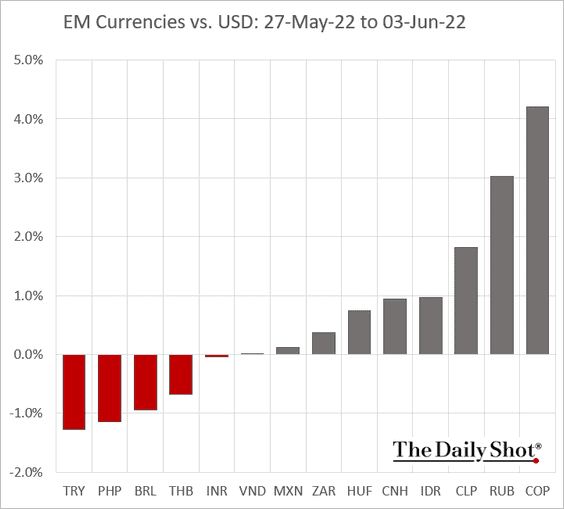
• Equity ETFs:
Back to Index
Cryptocurrency
1. This chart shows significant drawdown events in cryptos and stocks.
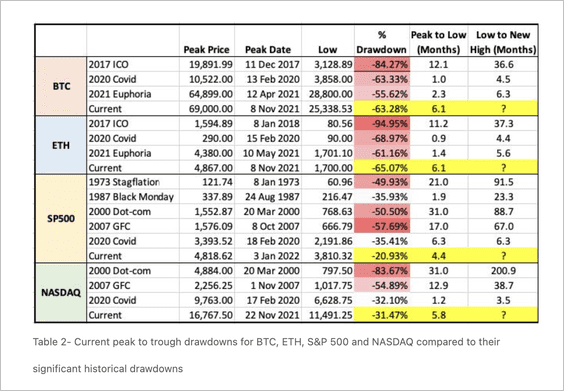 Source: @QCPCapital
2. For the most part, the bitcoin community is seen as inclusive, but less so for people in India, according to a survey by Block.
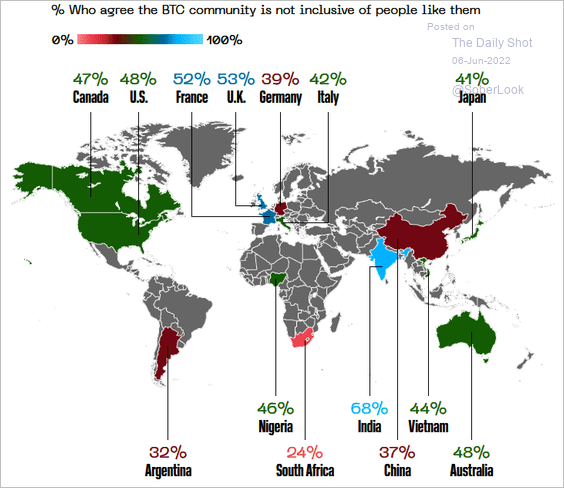 Source: Block Read full article
This chart shows the level of crypto knowledge by gender and region, according to a survey by Block.
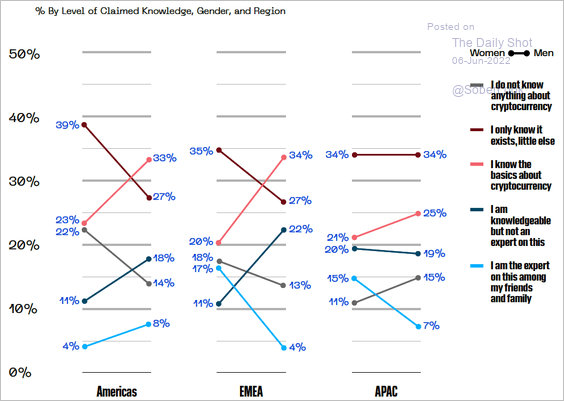 Source: Block Read full article
——————–
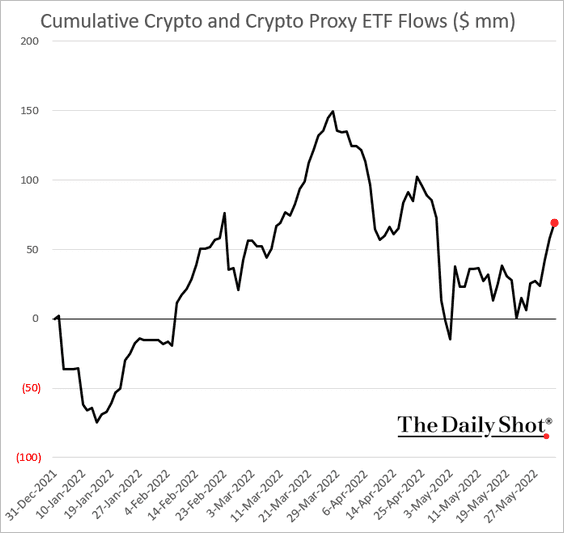
3. Crypto ETF flows are rebounding.
4. Miners sold bitcoin in May as the crypto markets slumped.
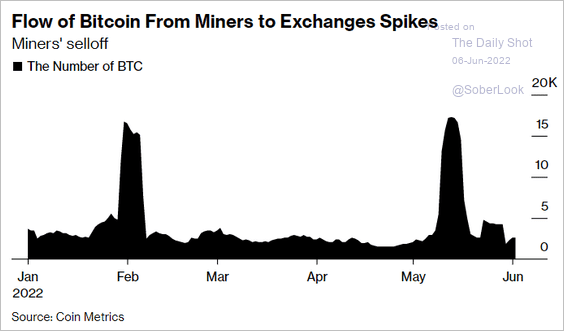 Source: Bloomberg Read full article
Back to Index
Commodities
1. The slowdown of China’s economic activity (chart shows deviation from trend) points to lower demand for commodities.
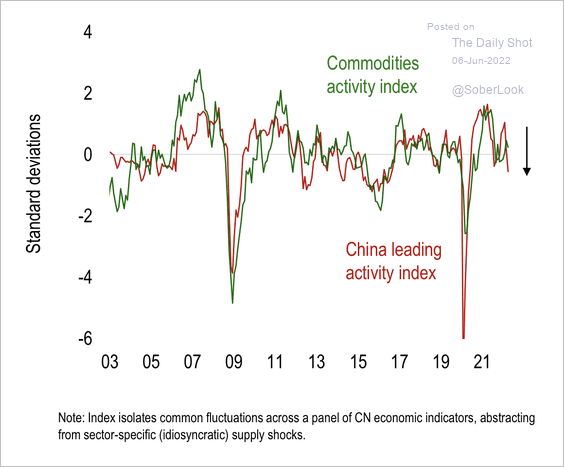 Source: Numera Analytics
2. This chart compares the average returns of select commodities with above/below potential China GDP growth over the past 27 years.
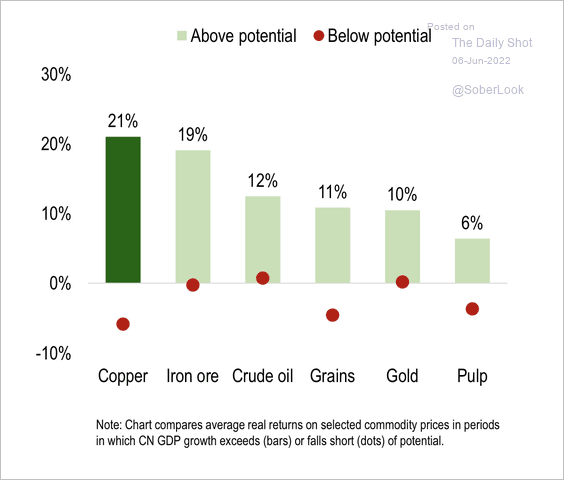 Source: Numera Analytics
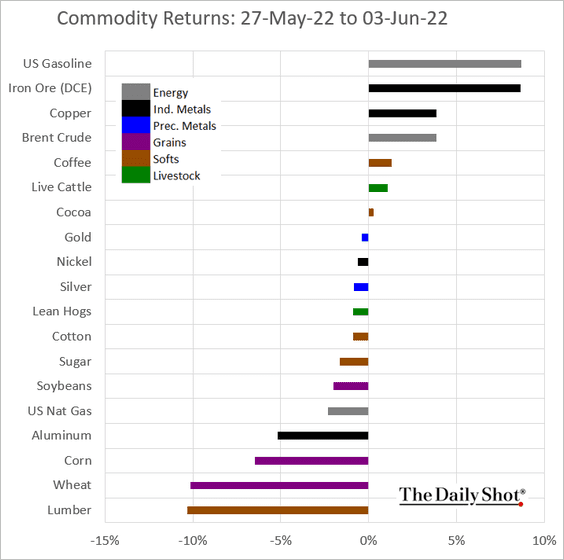
3. Here is last week’s performance across key commodity markets.
Back to Index
Energy
1. Brent crude is back above $120/bbl as Saudi Arabia boosts prices for Asian buyers.
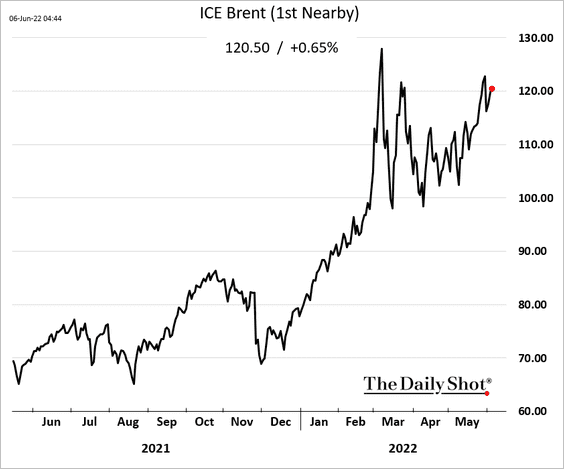
 Source: Reuters Read full article
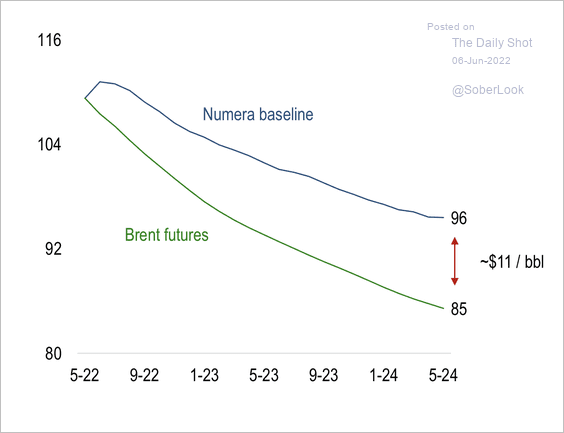
Numera expects the Brent oil price to trend lower over the next 12 months, although at a slower pace than predicted by markets.
 Source: Numera Analytics
——————–
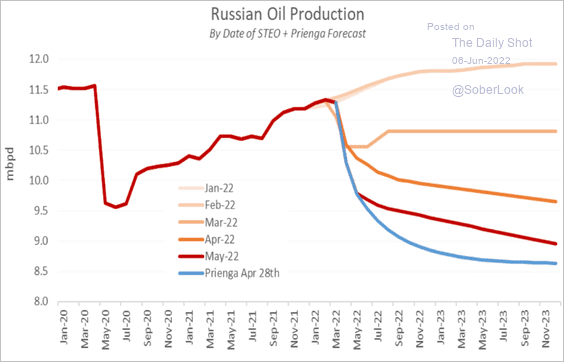
2. Analysts have been downgrading their forecasts for Russian oil output. Oil markets could get very tight.
 Source: Princeton Energy Advisors
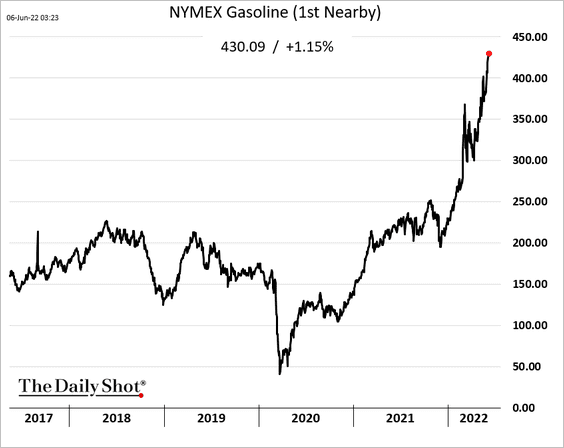
3. Crack spreads are soaring.
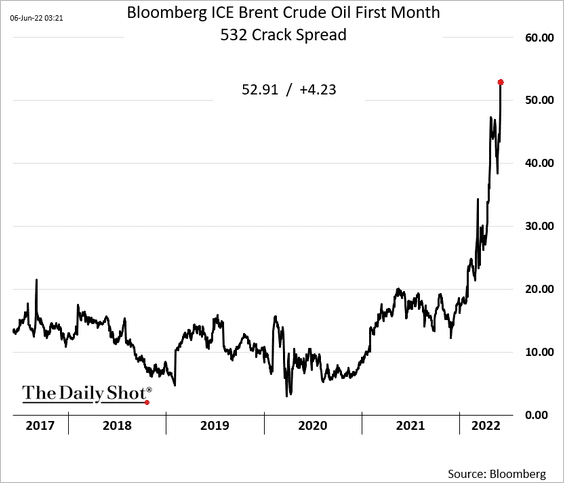
US gasoline futures are hitting record highs.
——————–
4. US net crude oil imports are at multi-year lows for this time of the year.
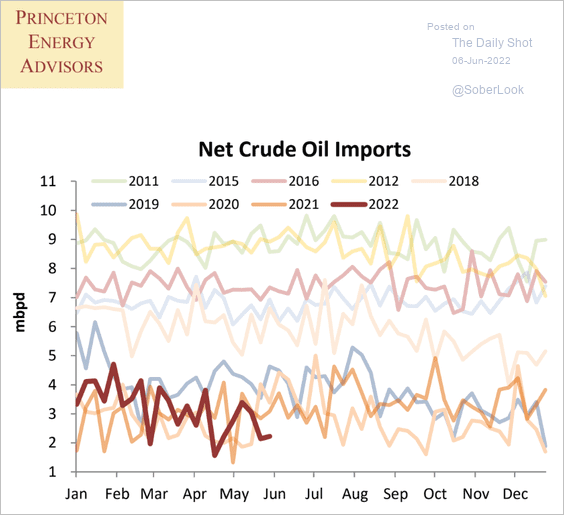 Source: Princeton Energy Advisors
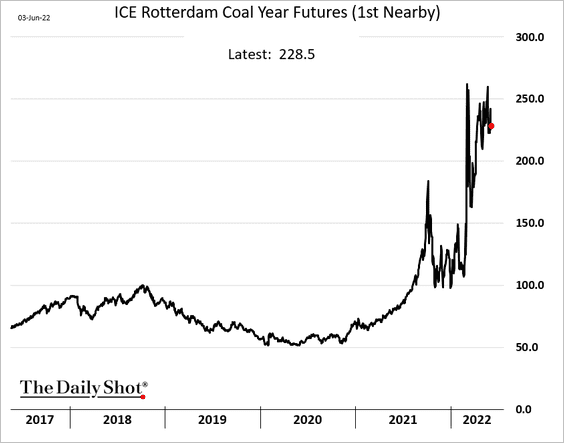
5. European coal prices remain elevated.
 Further reading
Back to Index
Equities
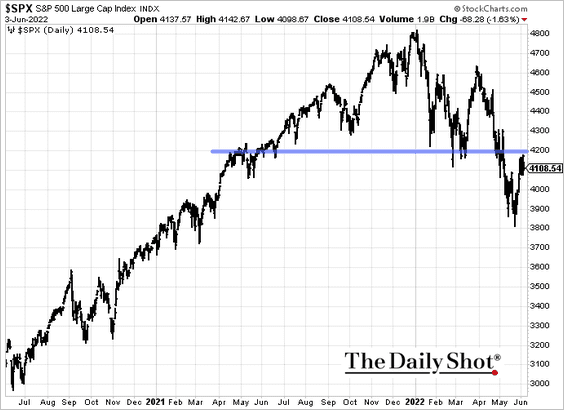
1. The S&P 500 held resistance near 4,200.
2. How much of a rebound should we expect in a relief rally?
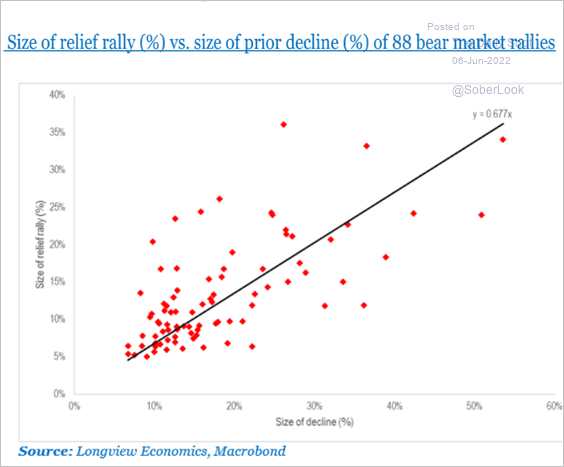 Source: Longview Economics
3. What were the drivers of this year’s selloff.
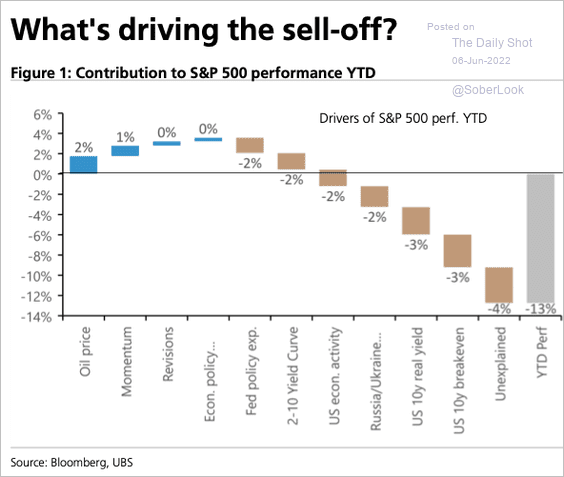 Source: UBS Research; @SamRo
4. Deteriorating CEO confidence points to downside risks for earnings growth.
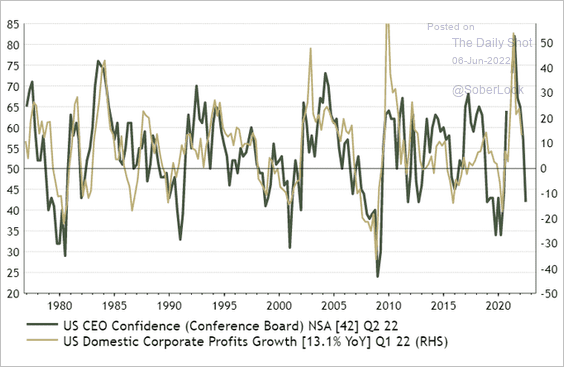 Source: @IanRHarnett
5. Market sentiment remains depressed.
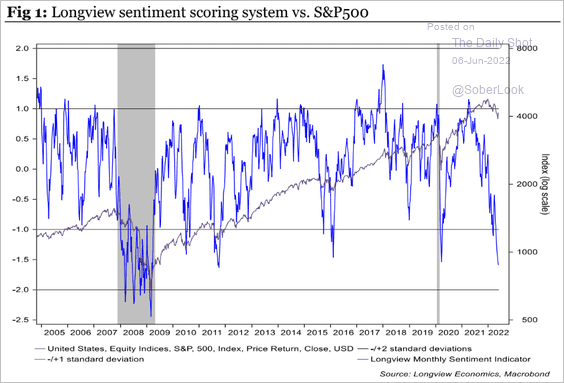 Source: Longview Economics
• CTAs’ equity allocations:
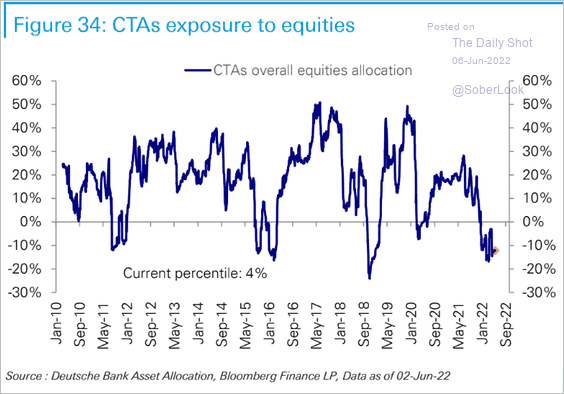 Source: Deutsche Bank Research
• Net bullish option volumes:
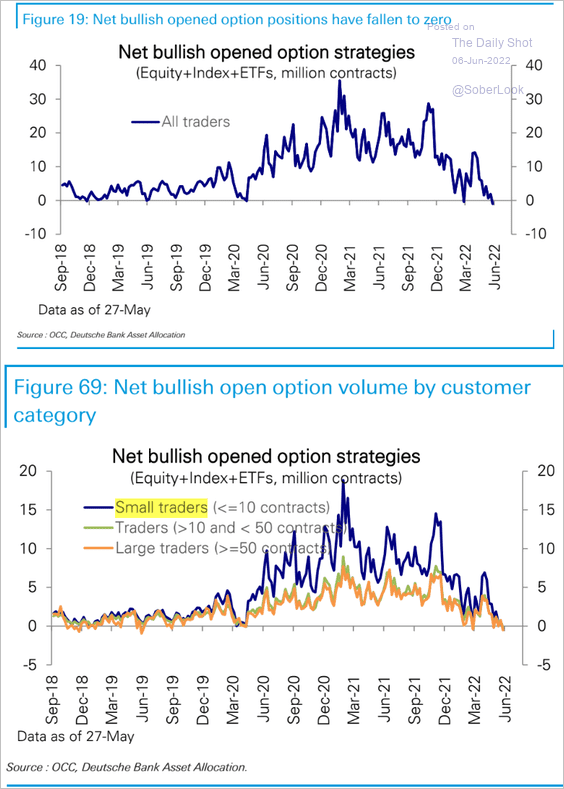 Source: Deutsche Bank Research
——————–
6. Stock correlation increased substantially this year.
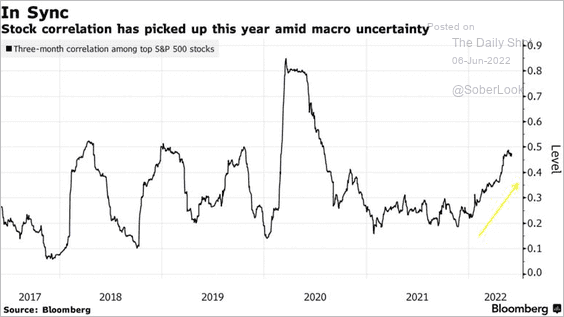 Source: Bloomberg Read full article
7. The bubble in post-IPO stocks has deflated as retail investors retreated.
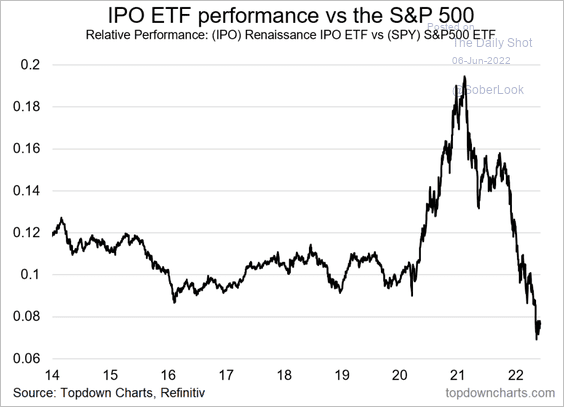 Source: @topdowncharts
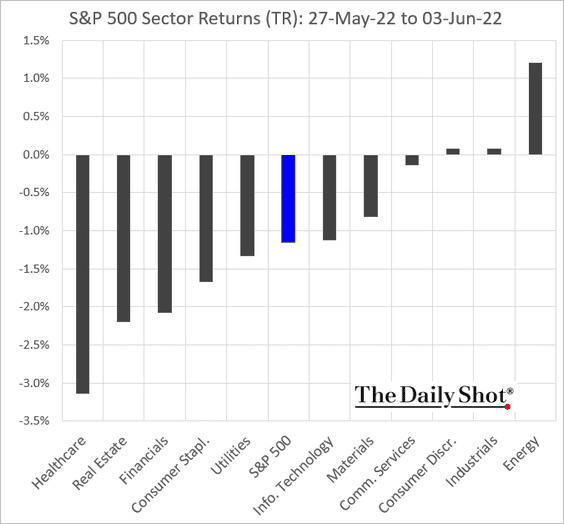
8. Next, we have some performance data from last week.
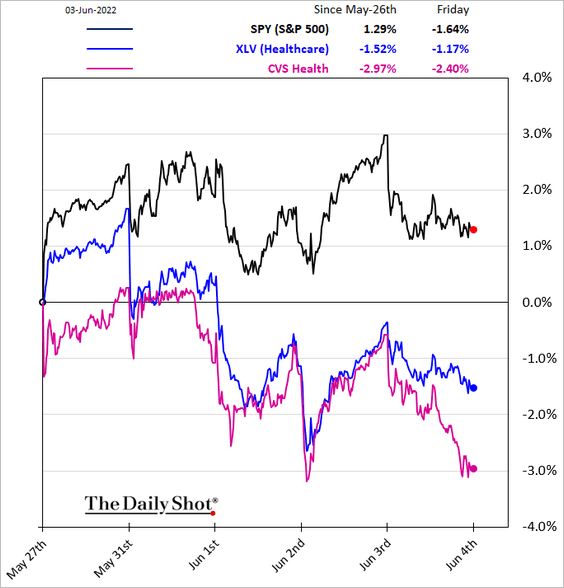
• Sectors:
– Healthcare:
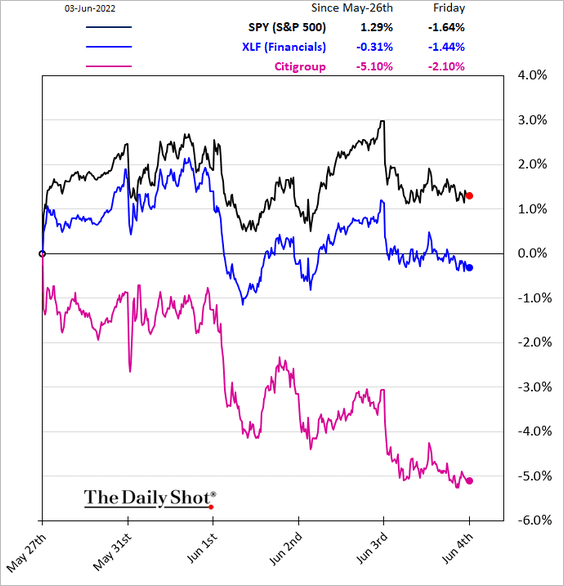
– Financials:
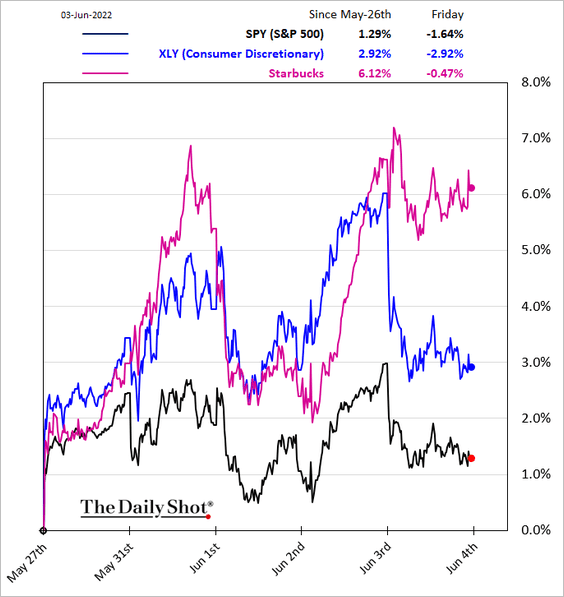
– Consumer Discretionary:
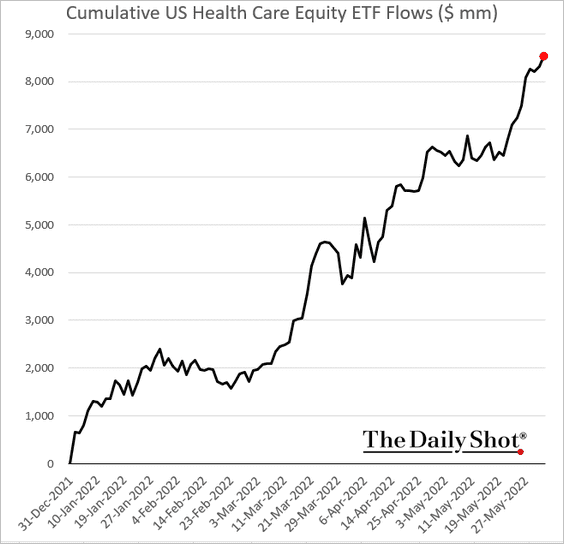
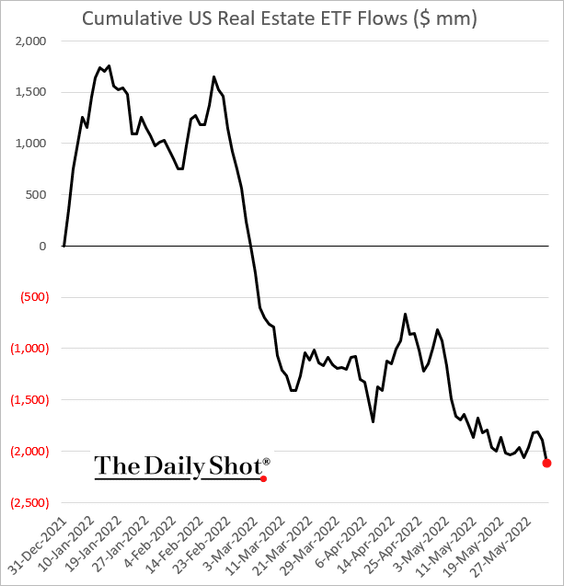
• Here are a couple of ETF flow trends.
– Healthcare:
– Real estate:
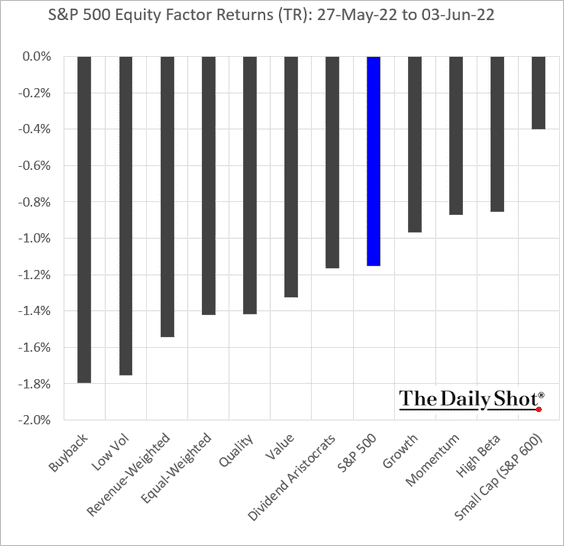
• Equity factors:
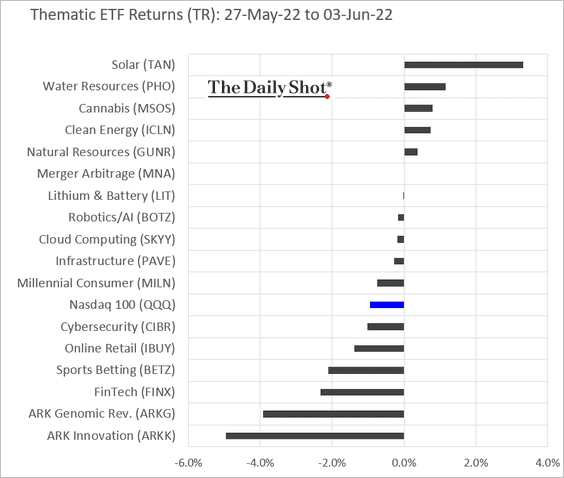
• Thematic ETFs:
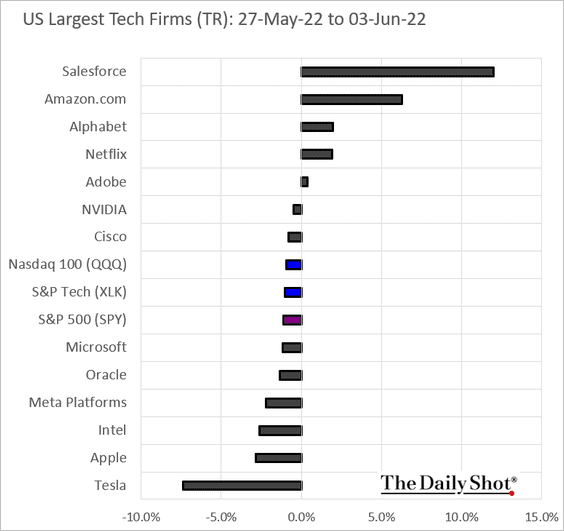
• The largest US tech companies:
Back to Index
Credit
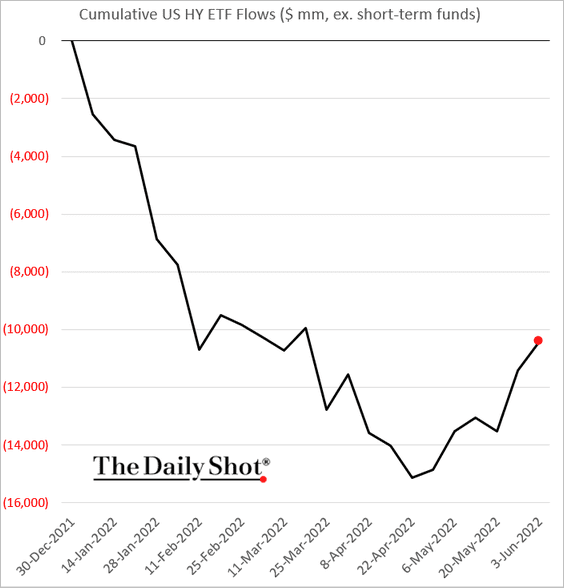
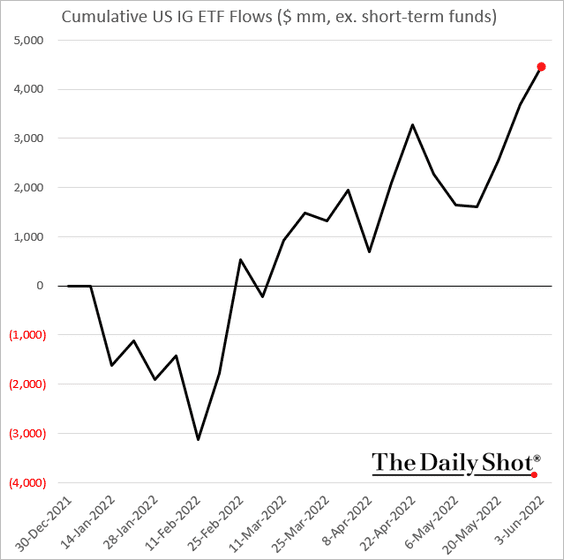
1. US high-yield ETF flows have been rebounding.
And investment-grade ETFs continue to see strong inflows.
——————–
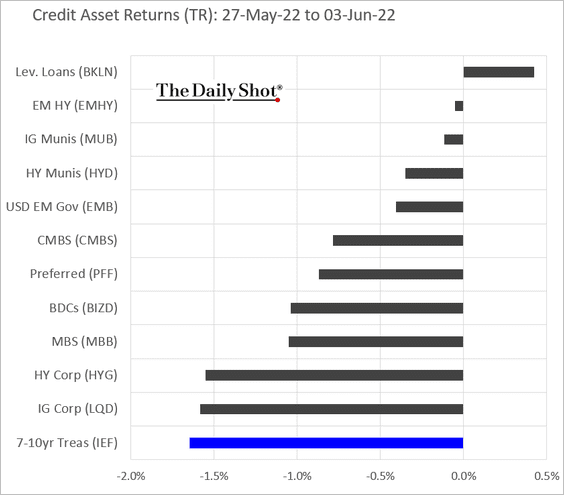
2. Here is last week’s performance by asset class.
Back to Index
Global Developments
1. Advanced economies have experienced a substantial tightening in financial conditions.
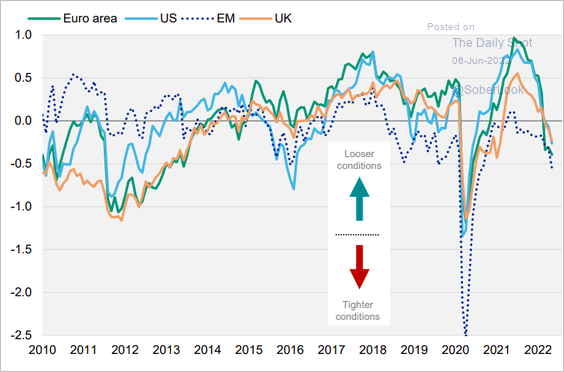 Source: Moody’s Investors Service
2. More room for global stocks and bonds to rebound?
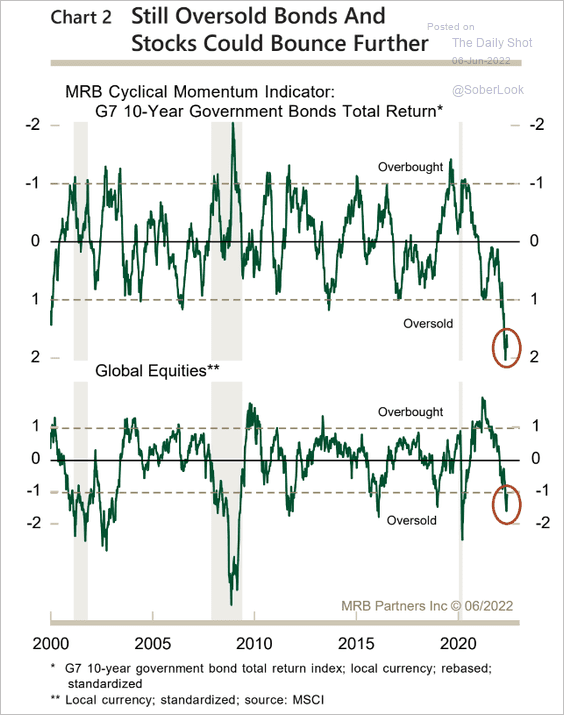 Source: MRB Partners
3. The average policy rate is set to rise by 240 basis points in under two years, which is more aggressive than the average of the past five tightening cycles, according to Capital Economics.
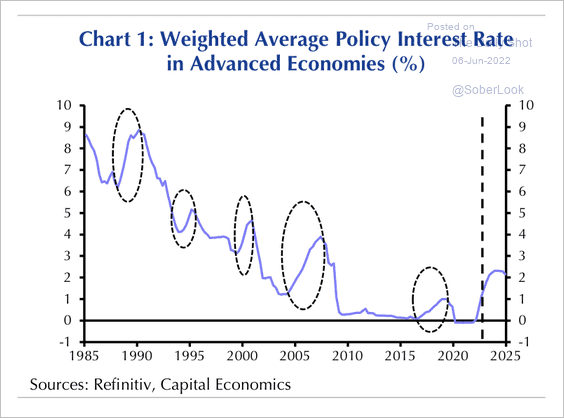 Source: Capital Economics
The net asset acquisitions of major central banks could switch to net disposals as soon as August.
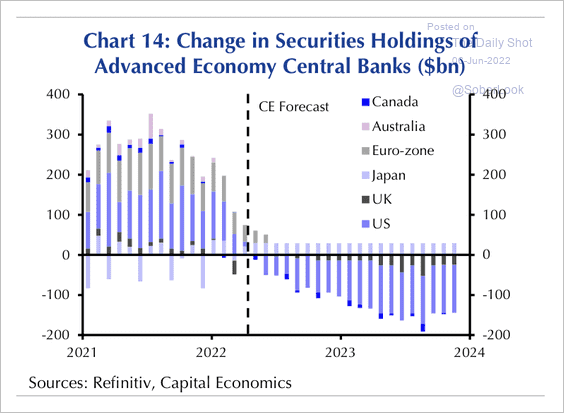 Source: Capital Economics
——————–
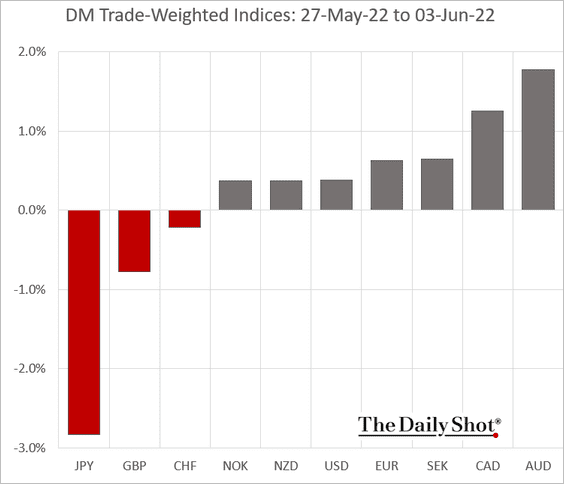
4. Finally, we have last week’s performance data.
• Trade-weighted currency indices:
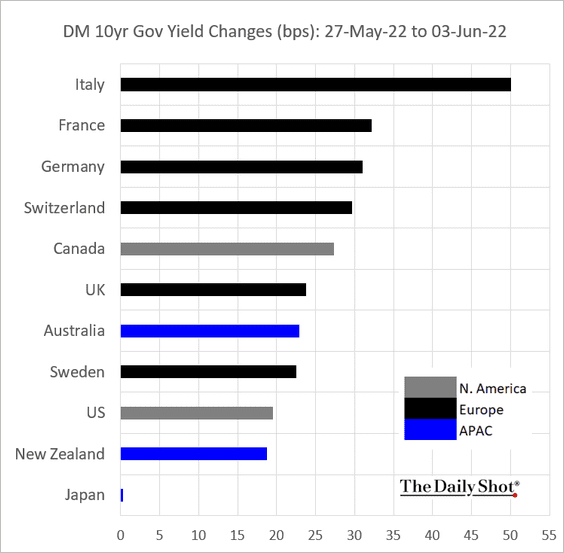
• Sovereign bond yields:
——————–
Food for Thought
1. Construction spending by sector during the COVID era:
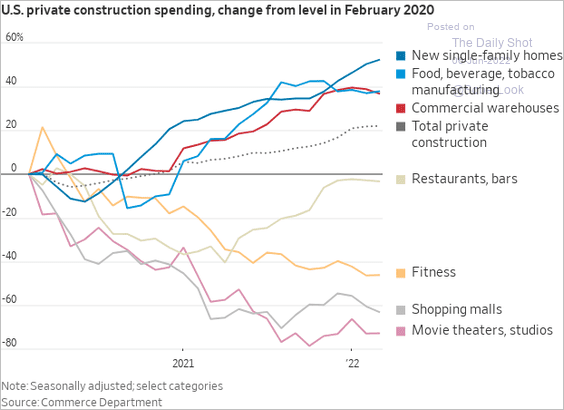 Source: @WSJ Read full article
2. Global income distribution over 200 years:
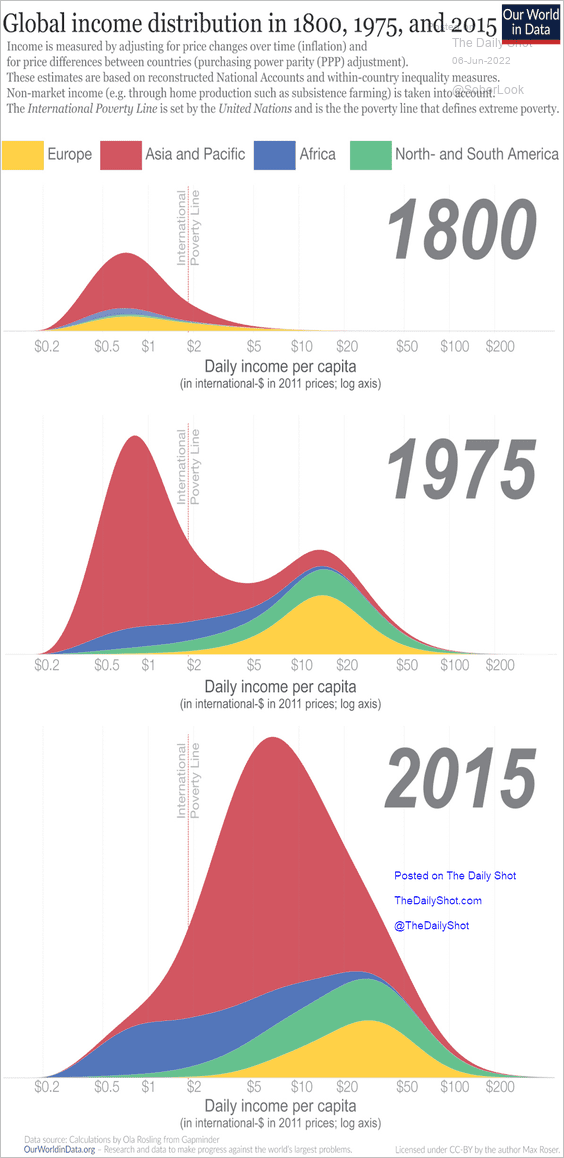 Source: Visual Capitalist Read full article
3. US exports of goods by state:
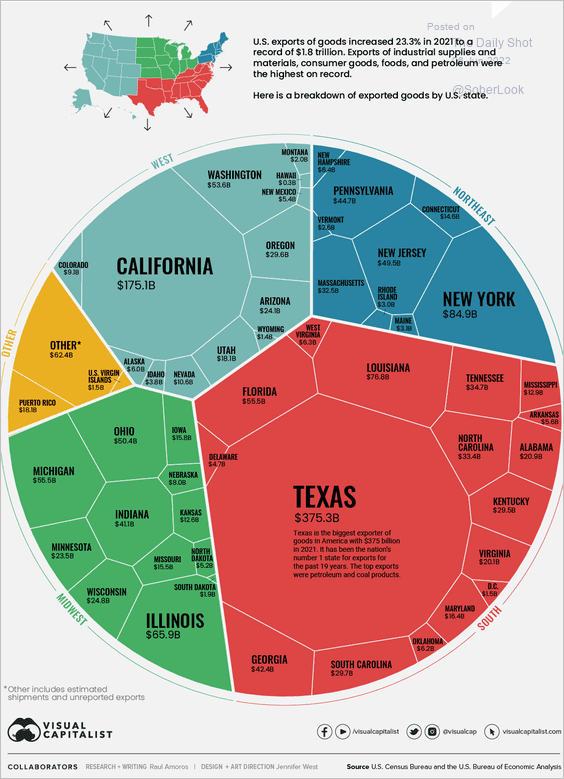 Source: Visual Capitalist Read full article
4. Skipping medical treatment because of cost:
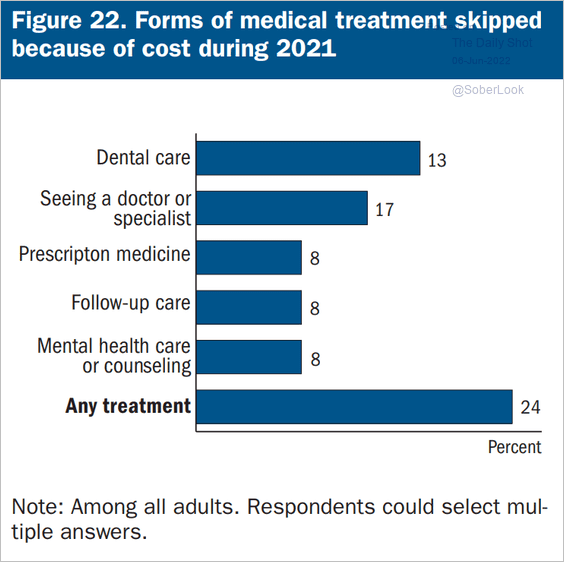 Source: Federal Reserve Board
5. US COVID deaths by occupation in 2020:
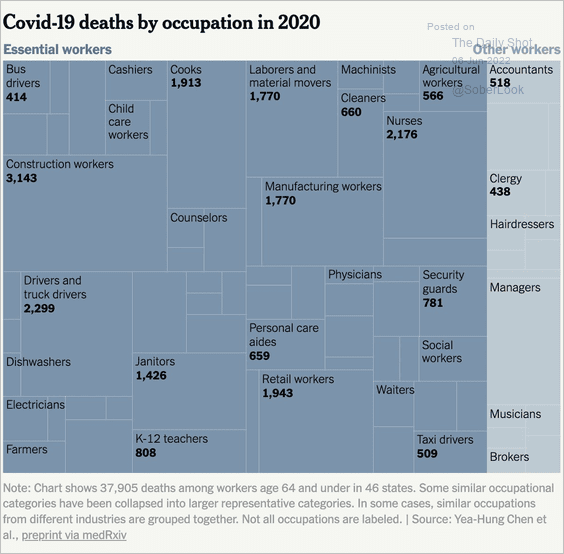 Source: @blprnt, The New York Times Read full article
6. Key causes of death among young people in the US:
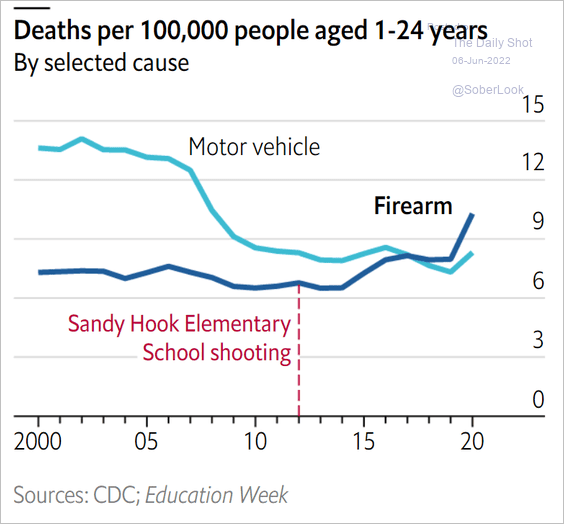 Source: The Economist Read full article
7. Share of the top 100 global tech firms’ market capitalization:
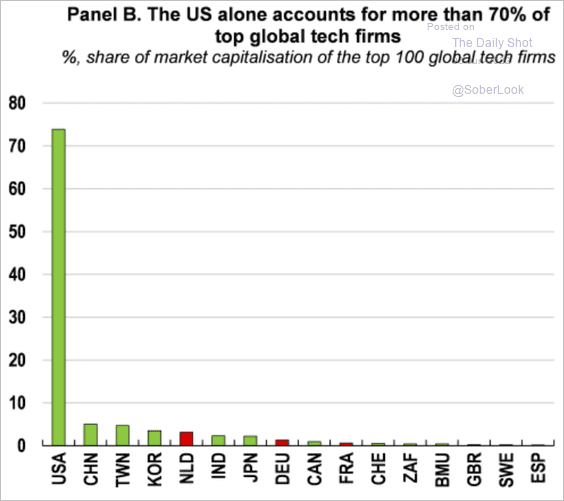 Source: ECOSCOPE Read full article
8. Digital video preferences by genre:

——————–
Back to Index