
The Daily Shot: 10-Jun-22
• The Eurozone
• Europe
• The United States
• Japan
• China
• Emerging Markets
• Commodities
• Energy
• Equities
• Food for Thought
The Eurozone
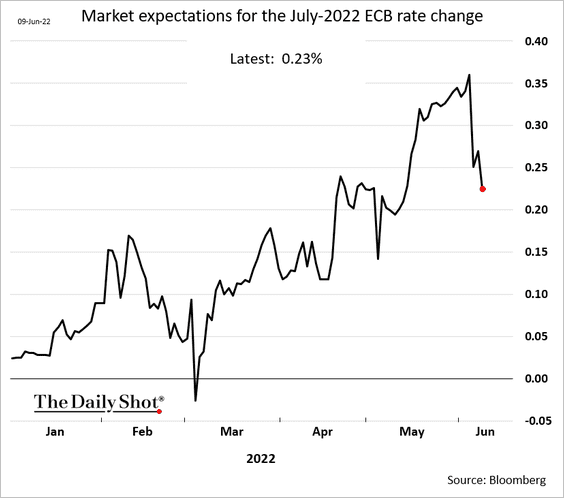
1. The ECB struck a hawkish tone, confirming the start of its first rate-hiking cycle since 2011.
 Source: Reuters Read full article
The July rate increase is now expected to be 25 bps (a more cautious start).
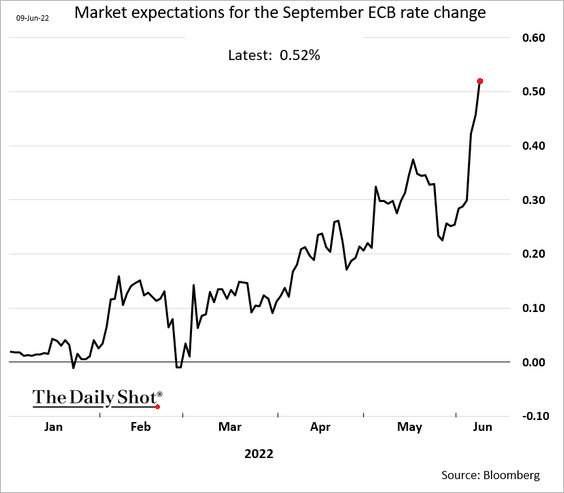
But the central bank will ramp up its tightening to 50 bps in September.
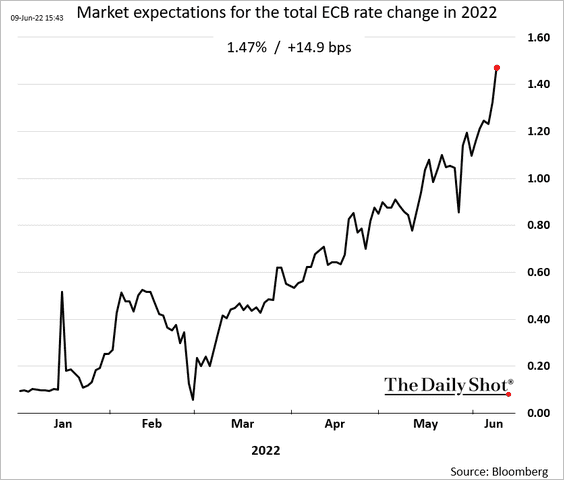
The market now expects the ECB to deliver nearly 150 bps worth of hikes by the end of the year.
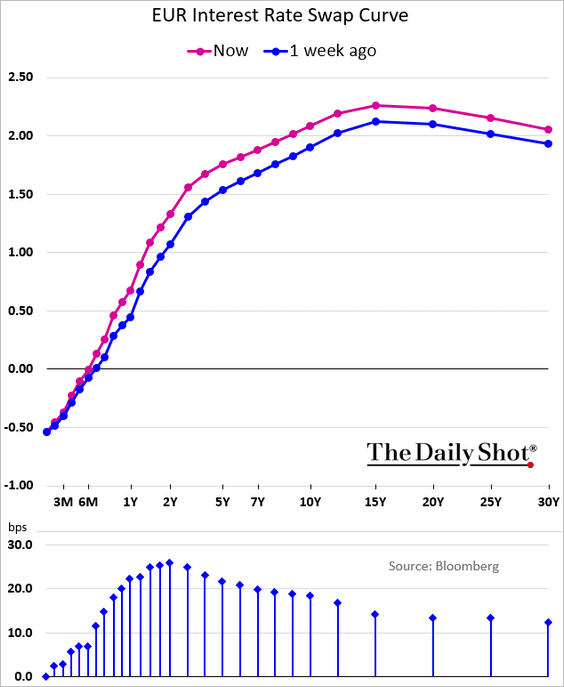
– Bond yields jumped, …
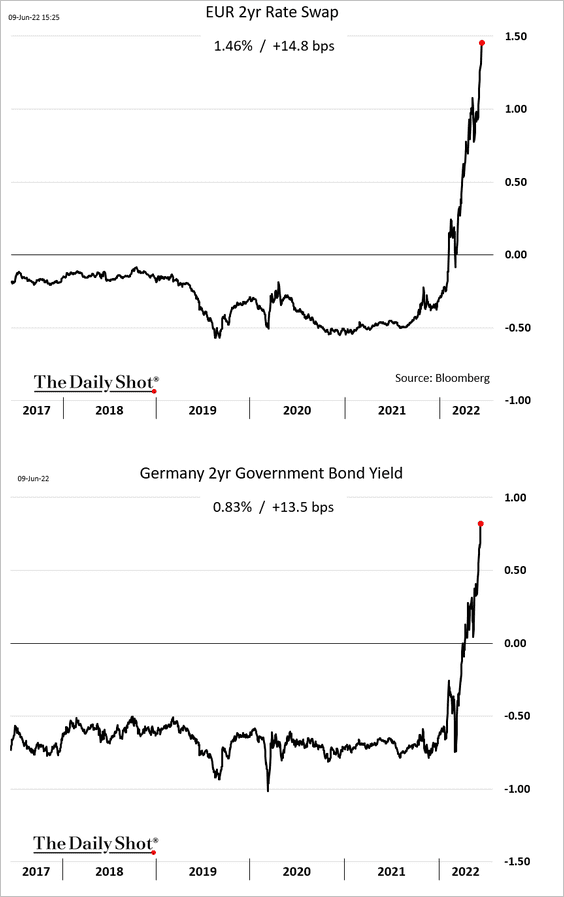
… and the curve flattened at the longer end.
– This year’s surge in yields has been massive by historical standards.
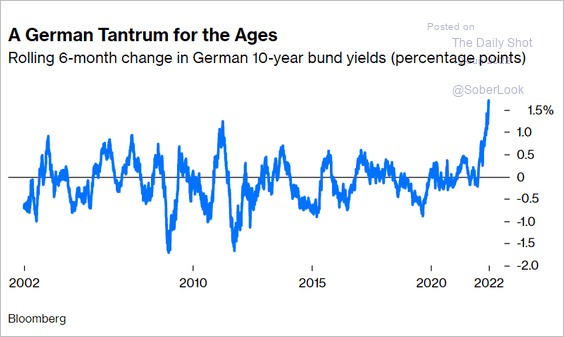 Source: @johnauthers, @opinion Read full article
• Market expectations for the ECB’s terminal rate are around 2% (2 charts).
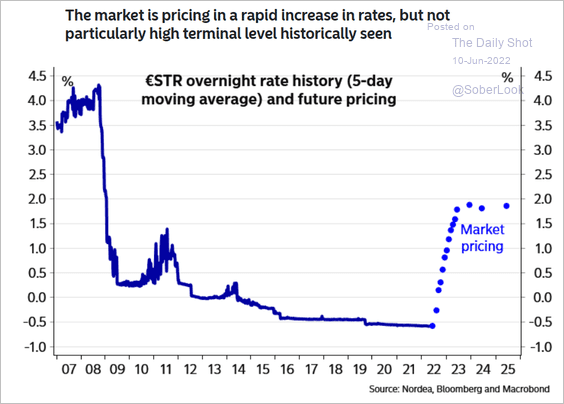 Source: Nordea Markets
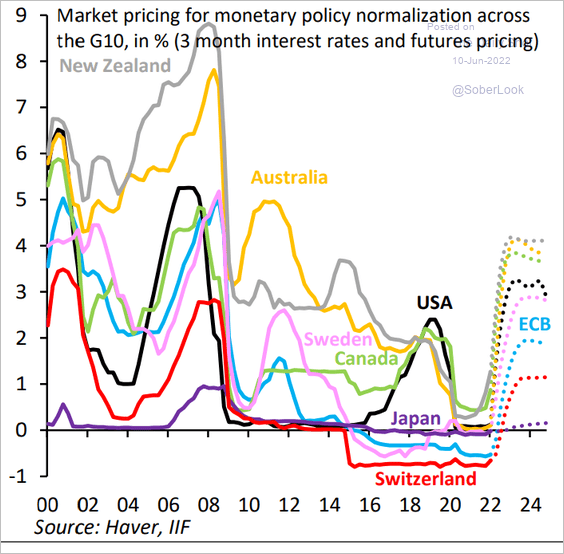 Source: IIF
• Historically, the market’s expectations for the ECB rate hikes have been too hawkish.
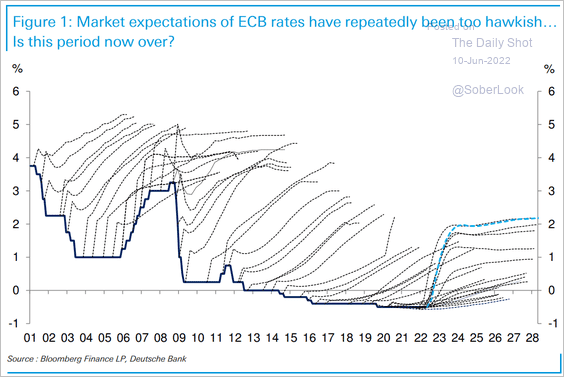 Source: Deutsche Bank Research
——————–
2. The ECB significantly increased its inflation forecasts – again.
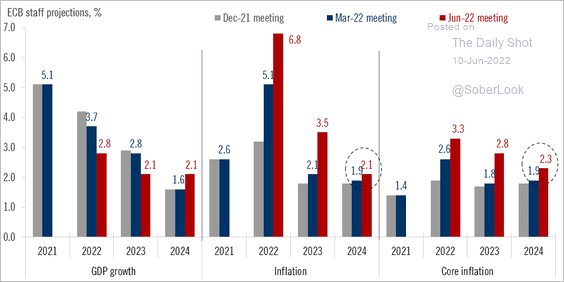 Source: @fwred
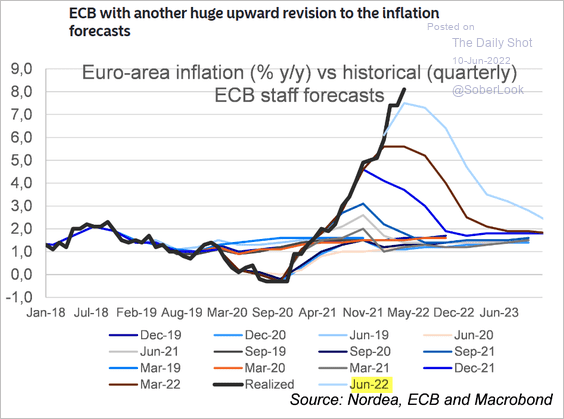 Source: Nordea Markets
——————–
3. The market is increasingly becoming concerned about “fragmentation.” As the ECB halts QE, the Eurozone “periphery” debt financing costs will climb further, …
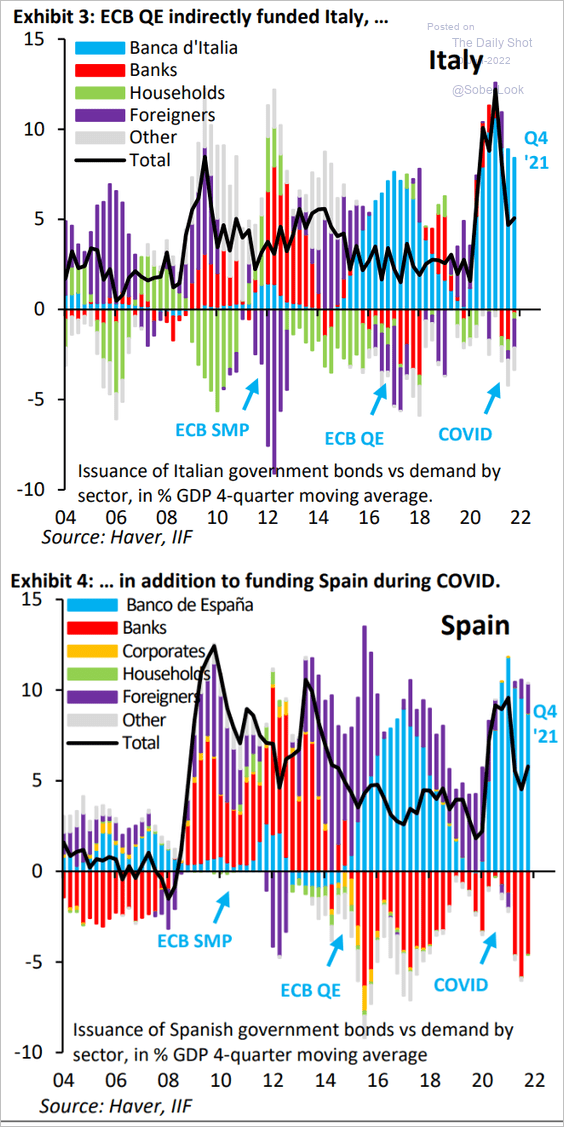 Source: IIF
… making it challenging for the central bank to implement its policy uniformly across the single-currency bloc.
 Source: Reuters Read full article
 Source: ShareCast Read full article
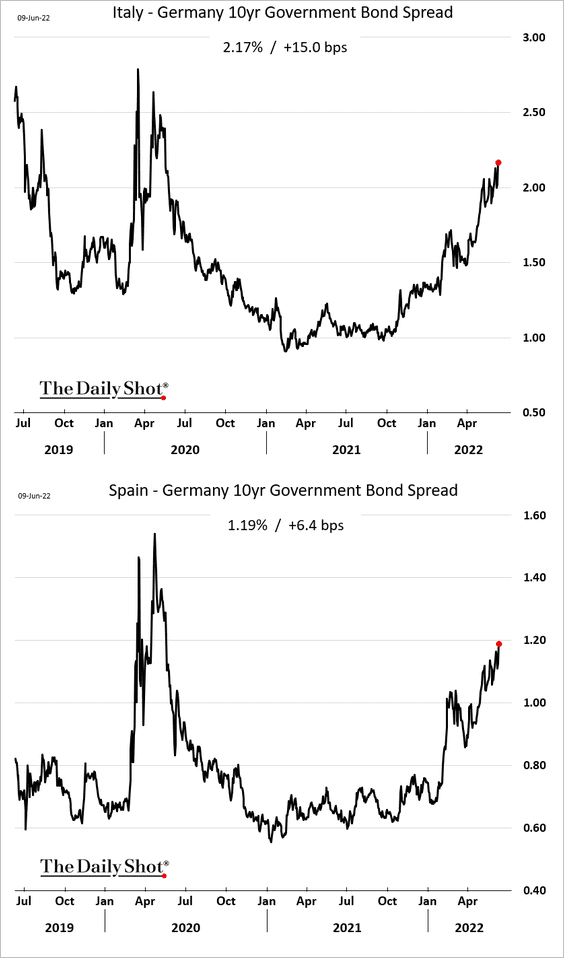
• Italian and Spanish spreads to Germany widened further.
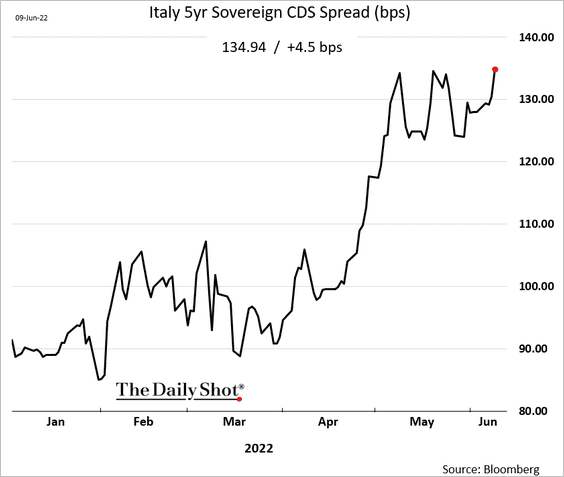
Here is Italy’s CDS spread.
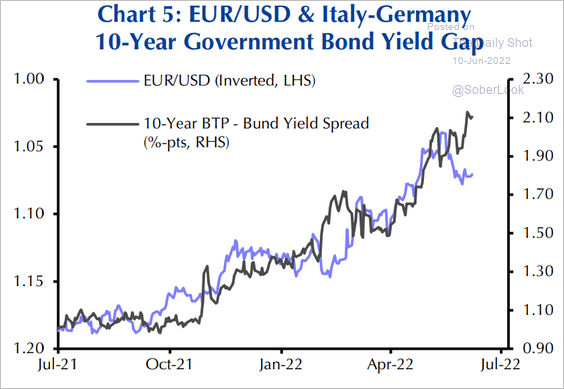
• Fragmentation concerns sent the euro sharply lower despite the ECB’s hawkish stance.
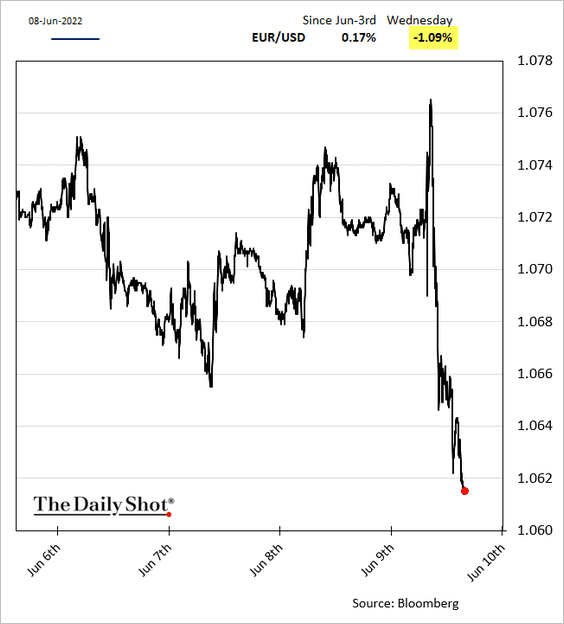
Wider periphery spreads could weigh on the euro going forward, bringing back painful memories of the Eurozone debt crisis.
 Source: Capital Economics
Back to Index
Europe
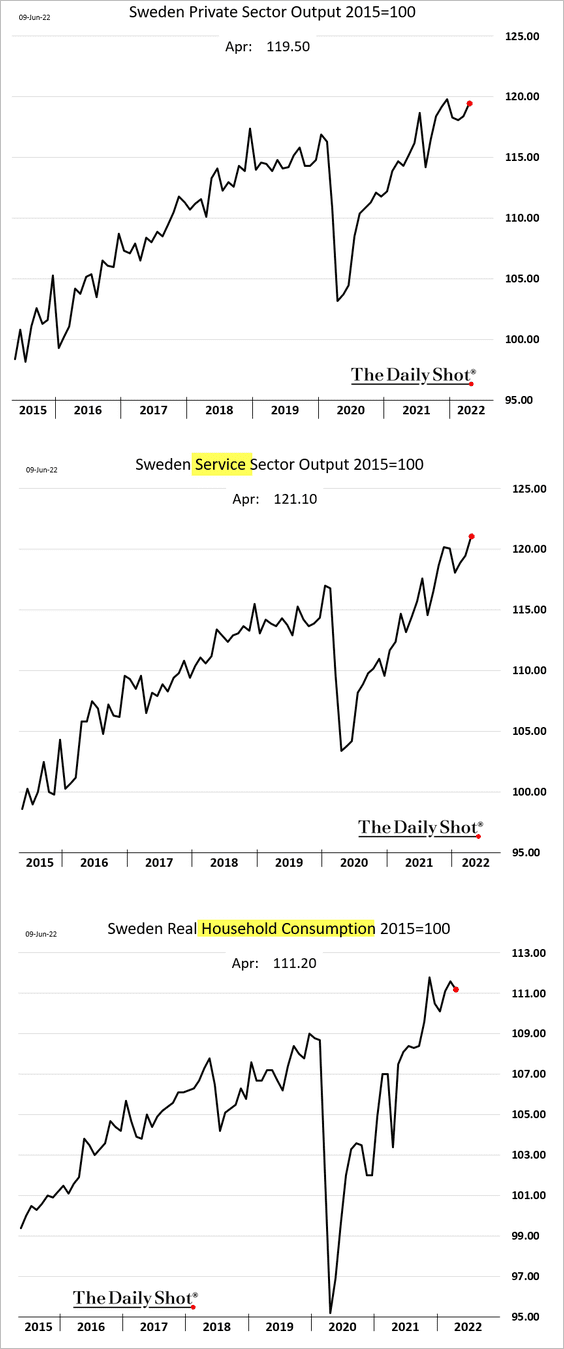
1. Sweden’s economic activity remained robust in April as service sector output hit new highs.
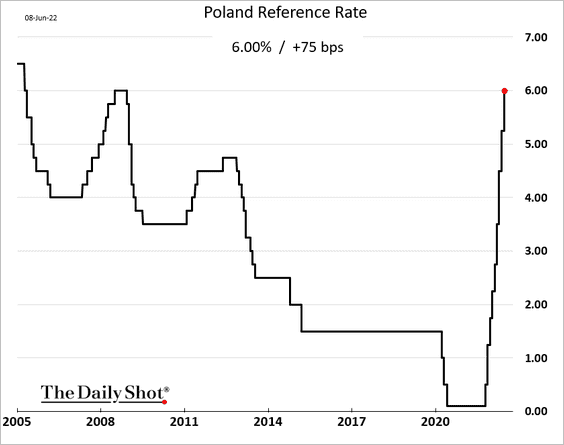
2. Poland’s central bank delivered another 75 bps hike this week. Is the hiking cycle about to end?
 Source: Reuters Read full article
The 2yr yield is approaching 7%.

Back to Index
The United States
1. Initial jobless claims remain near multi-year lows.
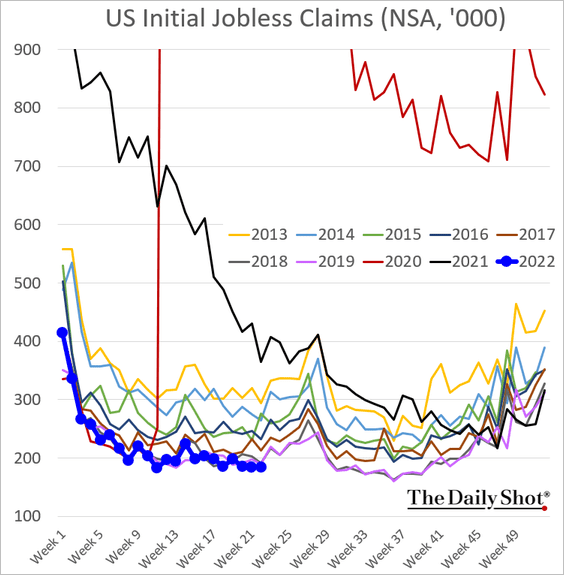
The media has been focused on “rising” unemployment claims …
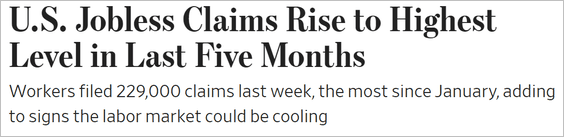 Source: @WSJ Read full article
.. but for now, it’s mostly a seasonal adjustment effect. As we mentioned earlier, performing seasonal adjustments on weekly data is challenging and can be very noisy around US holidays. We had a holiday last week. Zooming in on the above chart, does this look like a big increase in jobless claims?
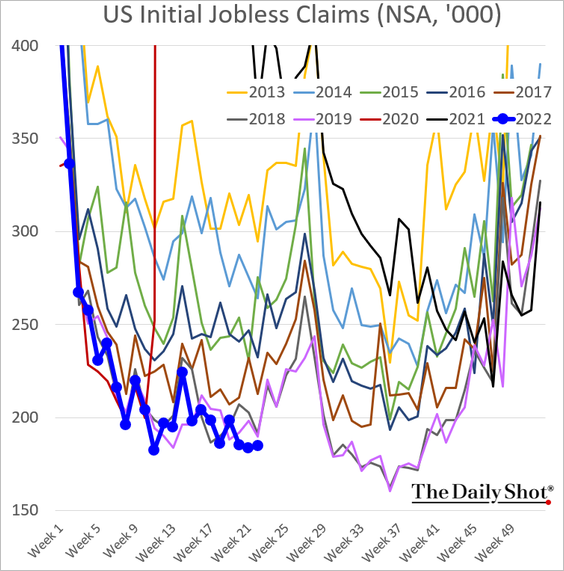
Having said that, we should expect slower hiring going forward as companies turn to cost-cutting.
——————–
2. Economists continue to boost their forecasts for the 2022 inflation rate.
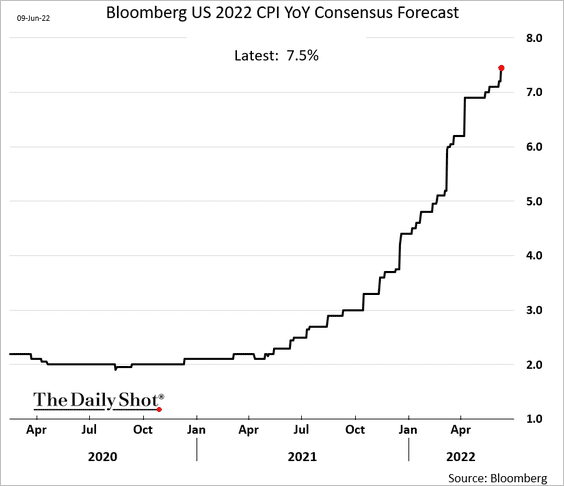
• According to Bloomberg Economics, …
calls that US inflation has peaked may be premature. Surging energy and food prices means high risk that inflation surpasses March’s 8.5% sometime this summer.
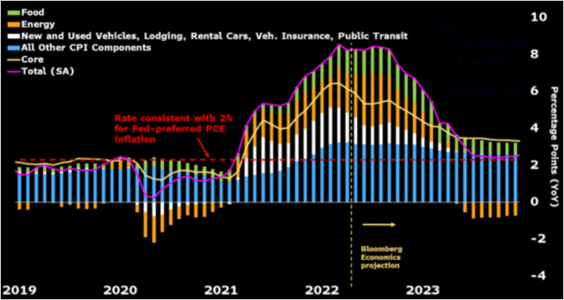 Source: @lisaabramowicz1, @economics
• Food delivery price data point to further gains in the “food at home” CPI.
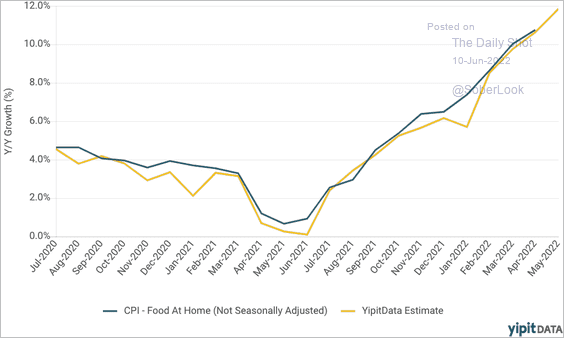 Source: YipitData
——————–
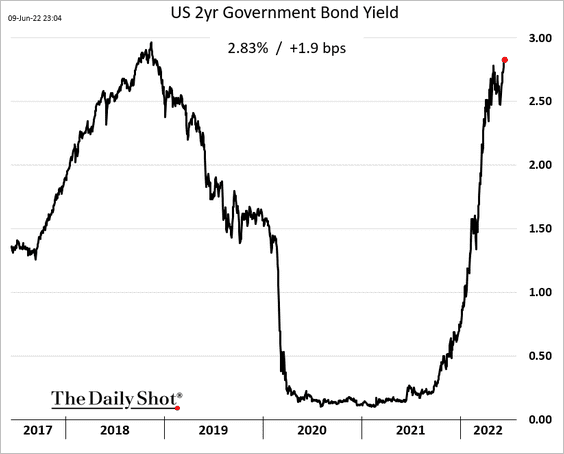
3. The 2yr Treasury yield hit the highest level since 2018 ahead of today’s CPI report.
4. The Oxford Economics supply chain stress tracker is starting to move in the right direction.
![]() Source: Oxford Economics
Source: Oxford Economics
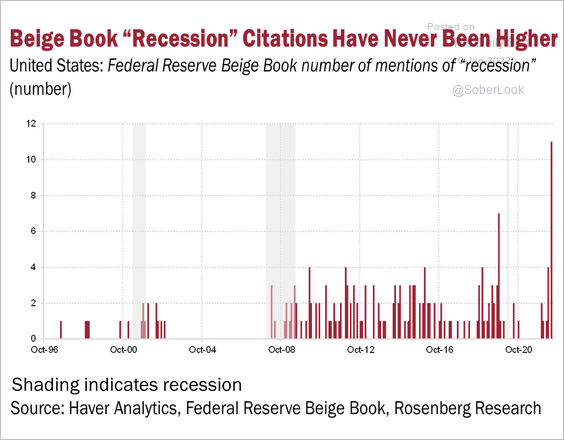
5. Mentions of “recession” in the Fed’s Beige Book surged in the latest report.
 Source: @EconguyRosie
Back to Index
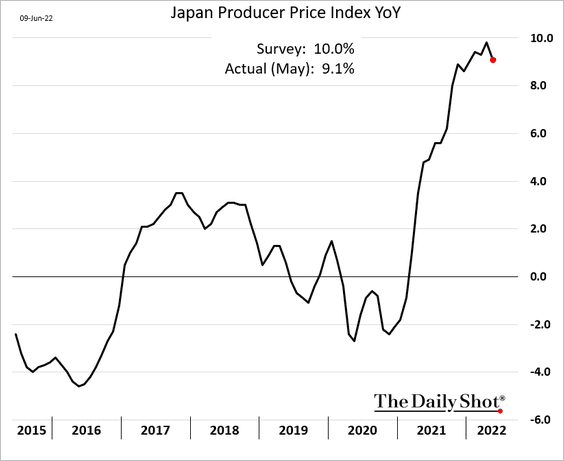
Japan
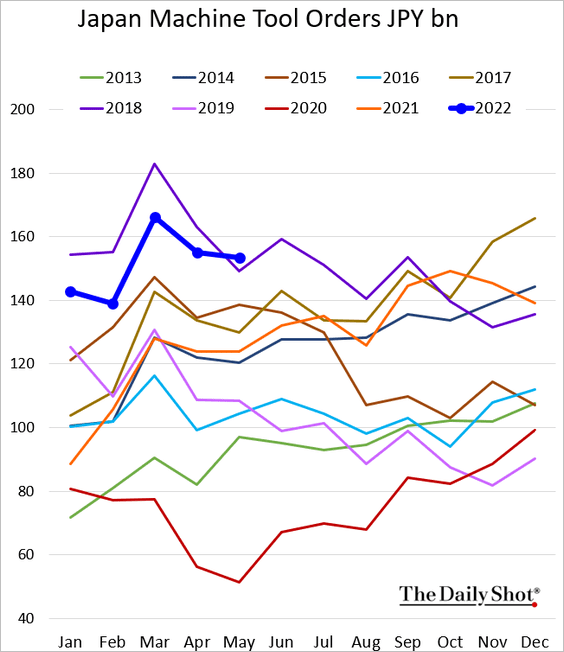
1. Machine tool orders have been holding up well.
2. The PPI appears to have peaked.
3. Dollar-yen has been highly correlated with the US-Japan yield differential.
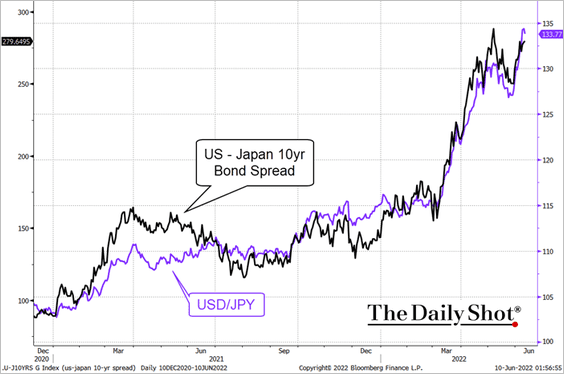 Source: @TheTerminal, Bloomberg Finance L.P.
Back to Index
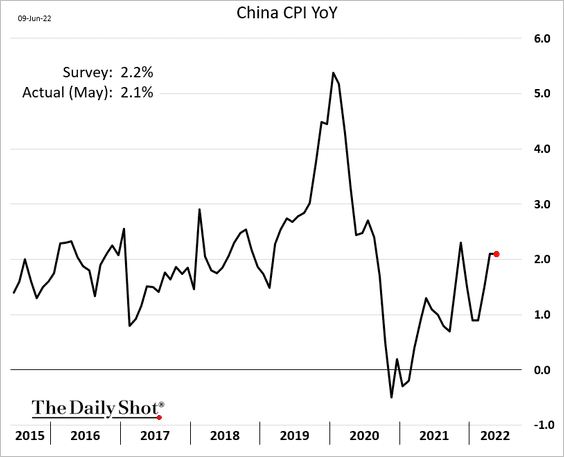
China
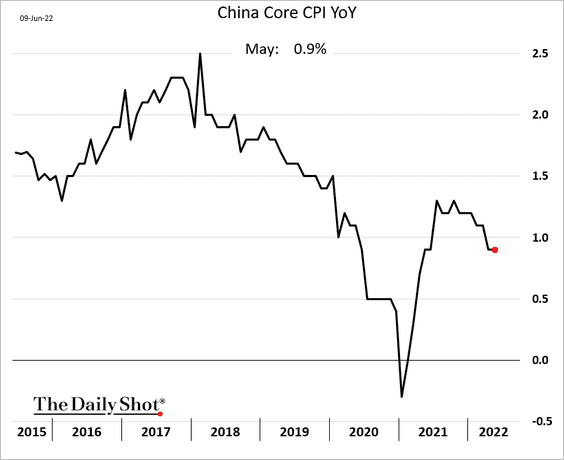
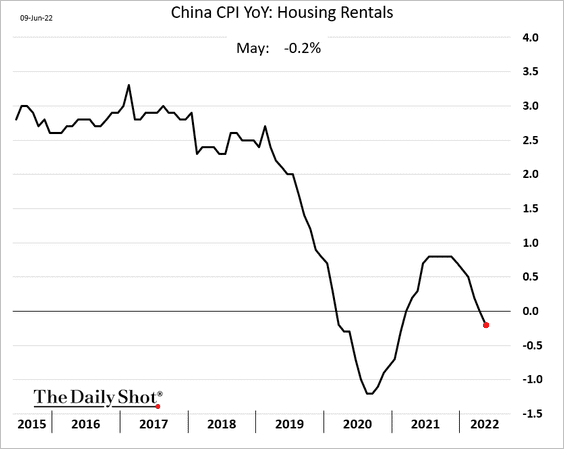
1. Inflation remains relatively benign.
The core CPI is holding below 1%.
Here is rent CPI.
——————–
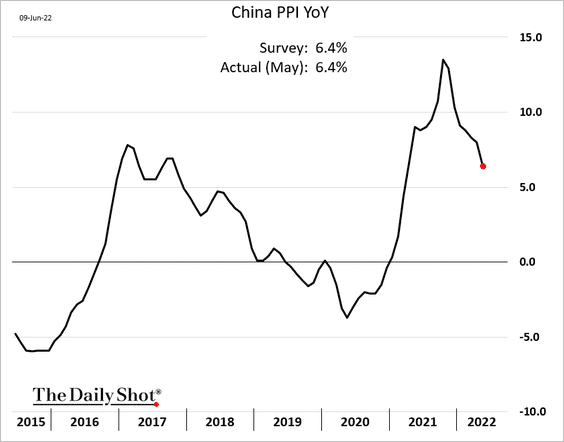
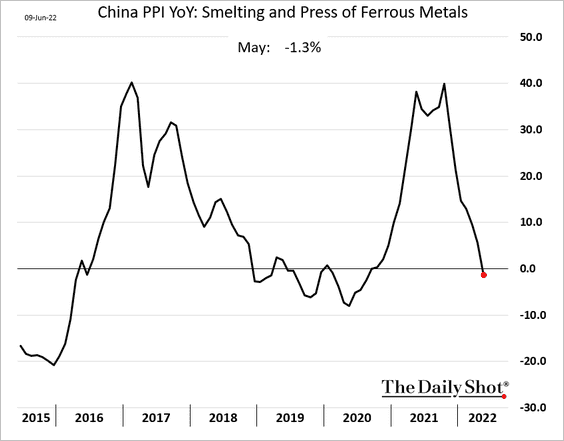
2. The PPI has peaked.
——————–
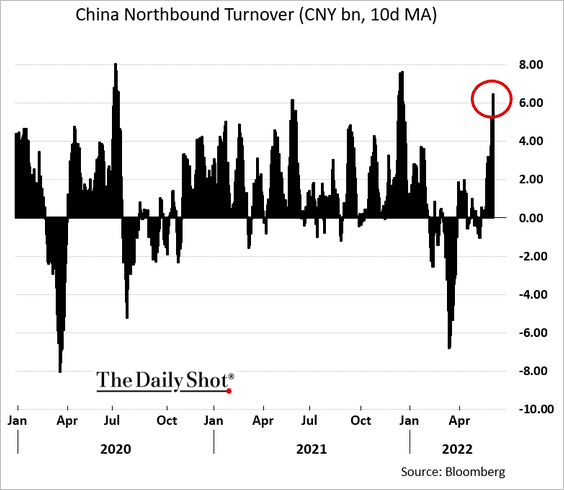
3. Mainland stocks continue to rebound, …
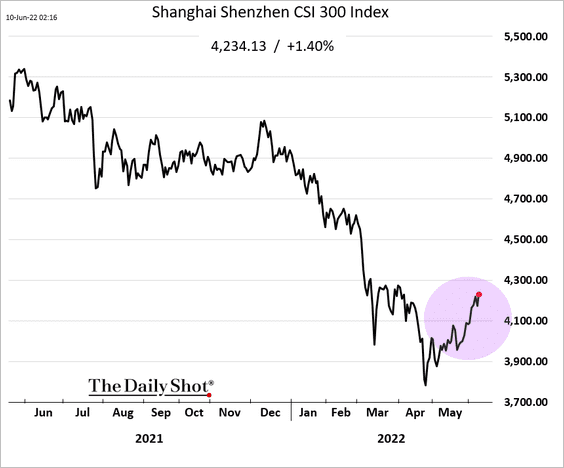
… driven by foreign inflows.
——————–
4. This chart shows the changes in April retail sales by sector.
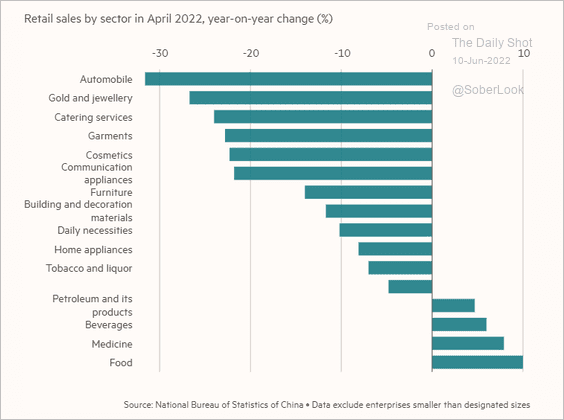 Source: @financialtimes Read full article
5. Food is 20% of households’ budgets.
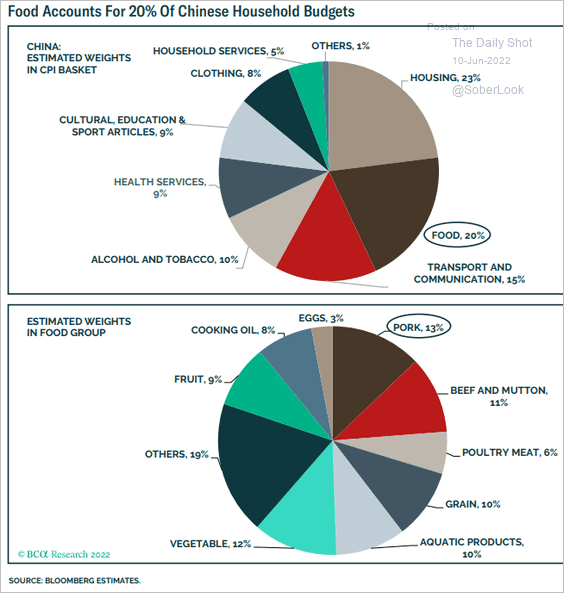 Source: BCA Research
Back to Index
Emerging Markets
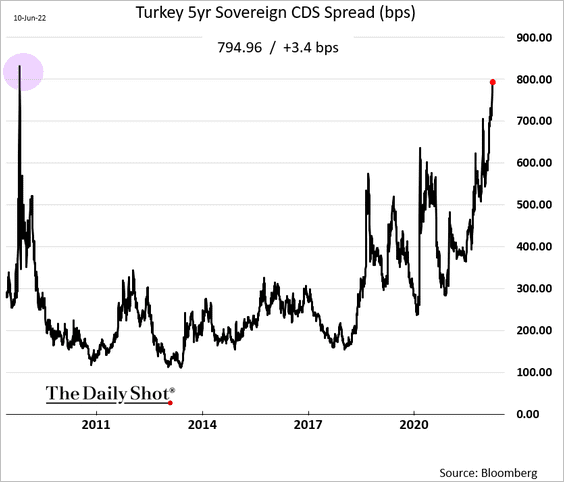
1. Turkey’s sovereign CDS spread is nearing the 2008 peak.
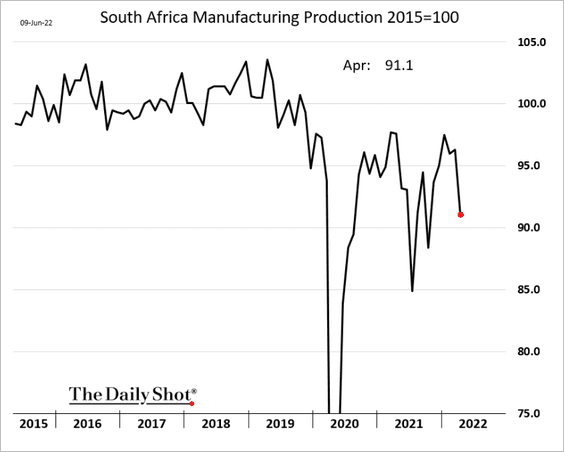
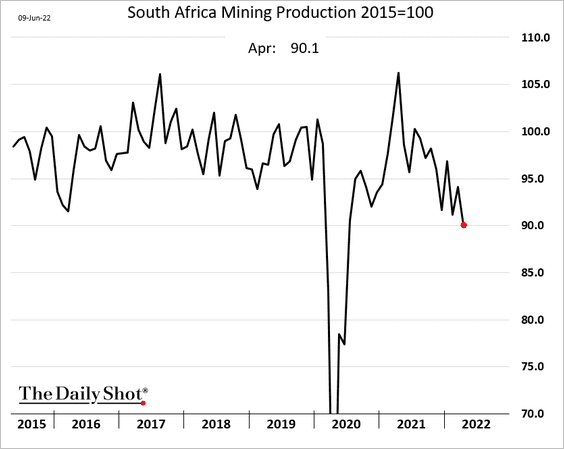
2. South Africa’s industrial production deteriorated in April.
– Manufacturing (reflecting the KZN floods):
– Mining:
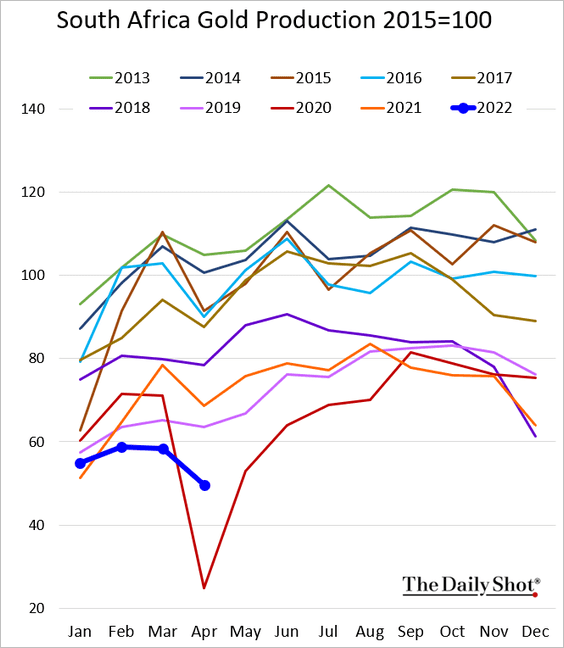
Here is South Africa’s gold output.
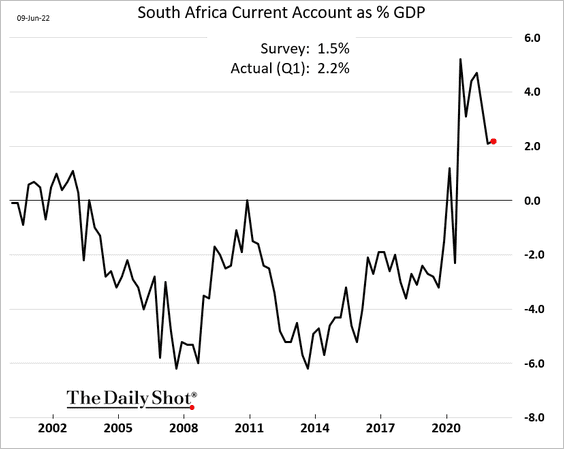
• South Africa’s Q1 current account surplus surprised to the upside.
——————–
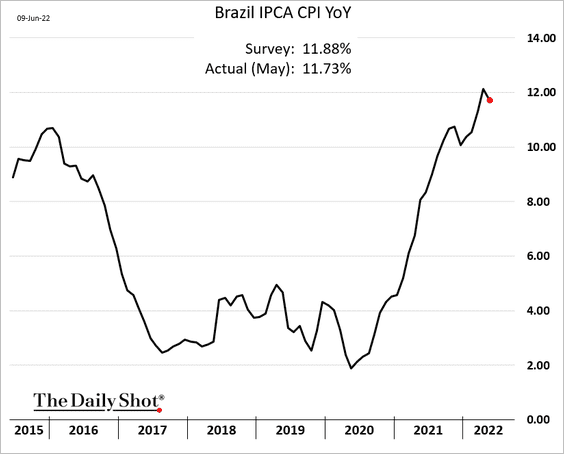
3. Brazil’s inflation is peaking.
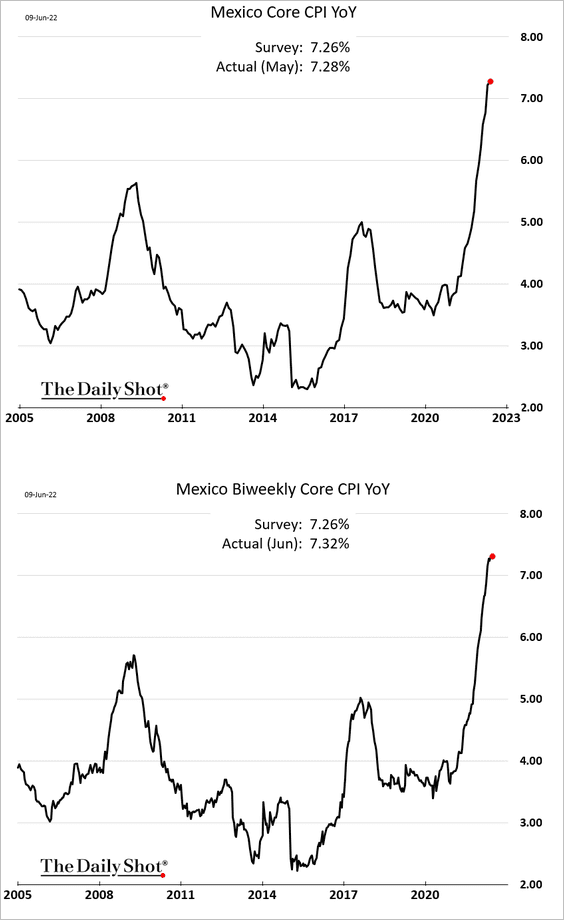
4. Mexican inflation hit a multi-year high, but CPI increases appear to be slowing.
5. Substantial sovereign defaults ahead?
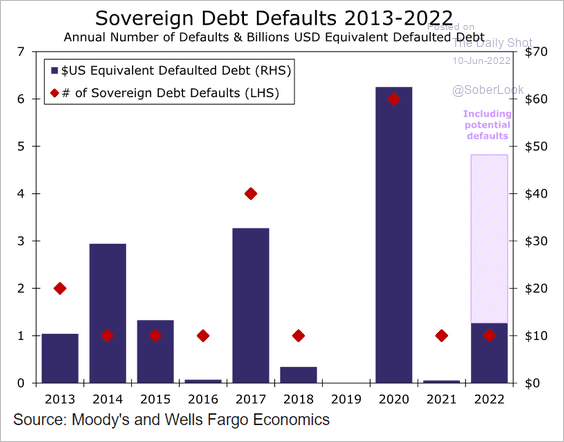 Source: Wells Fargo Securities
Back to Index
Commodities
1. US soybean futures are hitting new highs amid robust foreign demand.
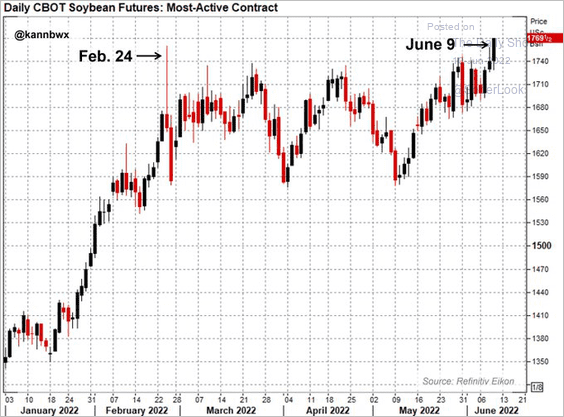 Source: @kannbwx
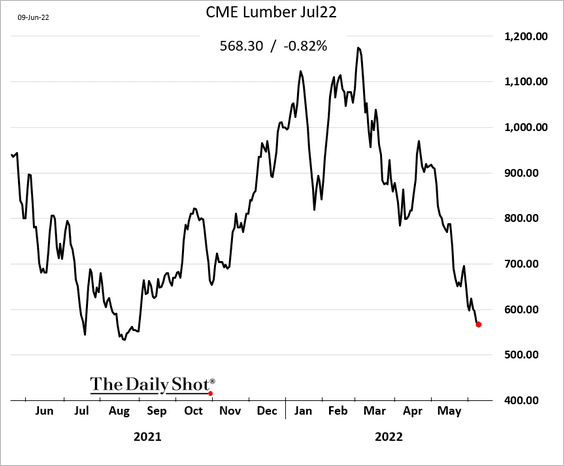
2. Lumber prices continue to fall, partially due to soft demand from the US housing sector.
3. Energy has been leading commodity markets.
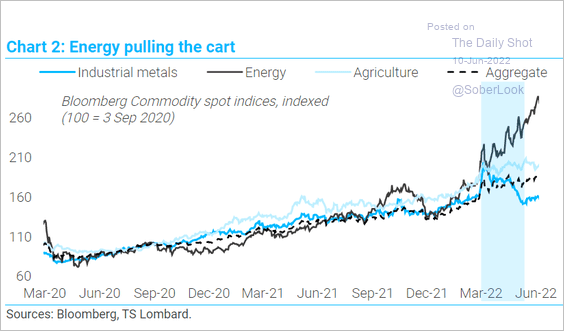 Source: TS Lombard
Back to Index
Energy
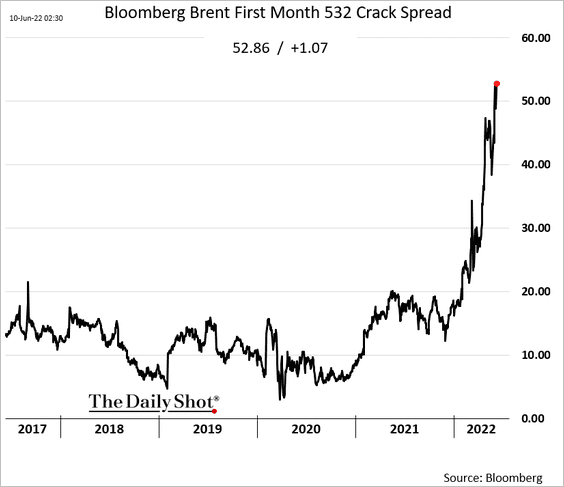
1. Crack spreads continue to climb.
2. US natural gas prices are expected to stay elevated until next year.
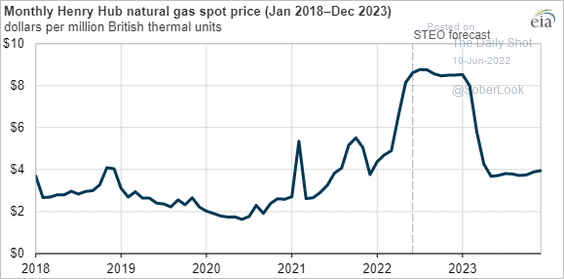 Source: EIA Read full article
3. This chart shows Europe’s natural gas demand in the industrial sector.
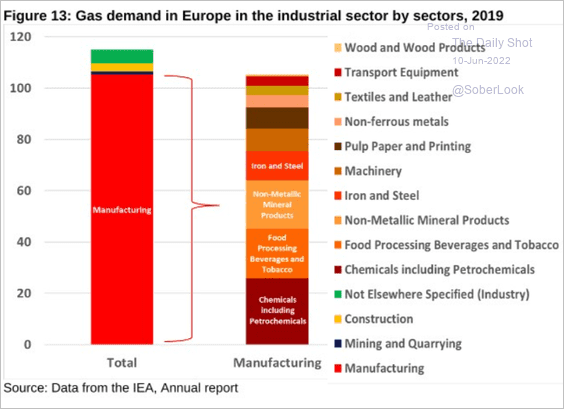 Source: Oxford Institute for Energy Studies
4. Here is US electricity generation by source.
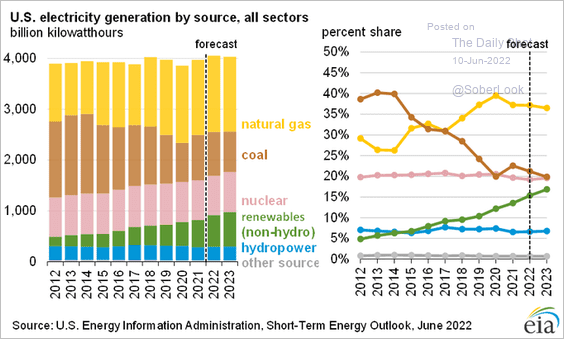 Source: @NatBullard; EIA Read full article
Back to Index
Equities
1. Further valuation pullbacks are likely if inflation continues to surprise to the upside.
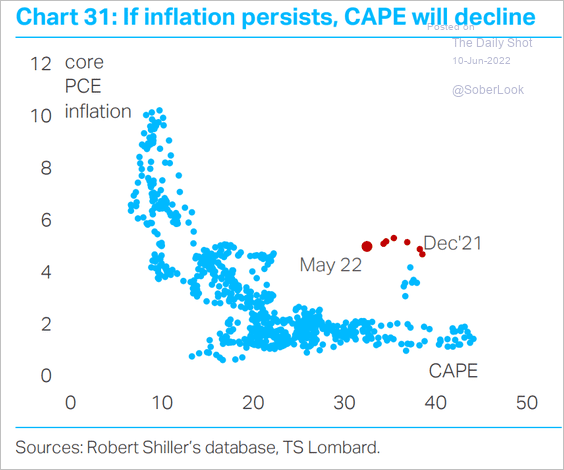 Source: TS Lombard
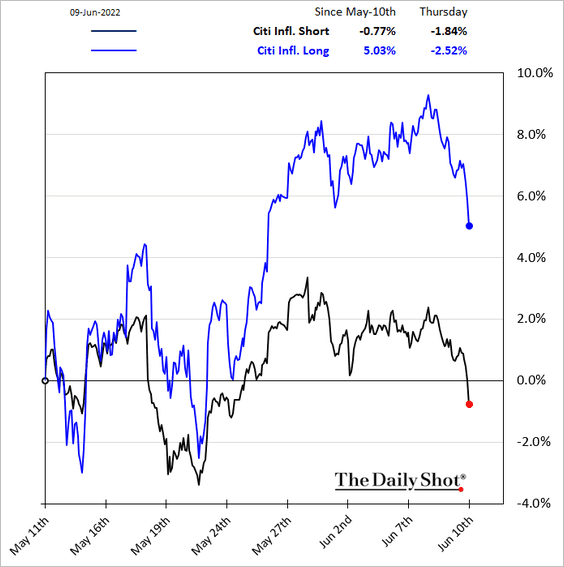
And stock investors continue to bet on high inflation. Stocks that benefit from rising prices (Citi “inflation long” basket) have been outperforming.
——————–
2. Elevated household equity allocations don’t bode well for long-term performance.
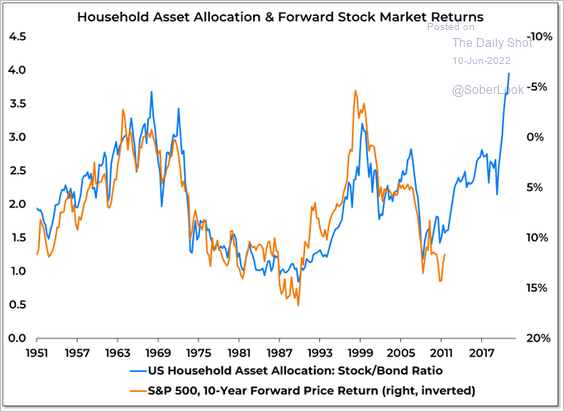 Source: @WillieDelwiche Read full article
3. “Long-duration” stocks (such as growth companies) are vulnerable to rising rates.
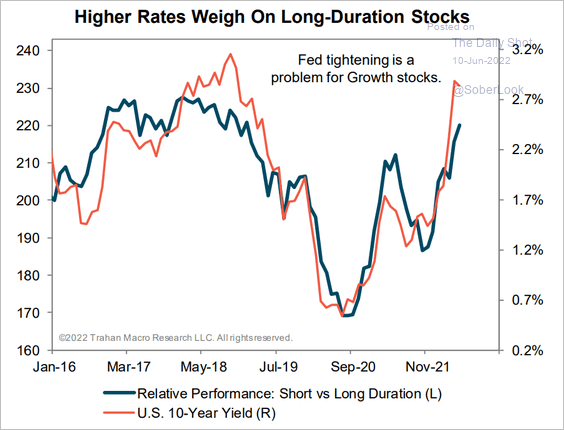 Source: Trahan Macro Research
4. Retail investors have been moving back into single stocks (out of ETFs).
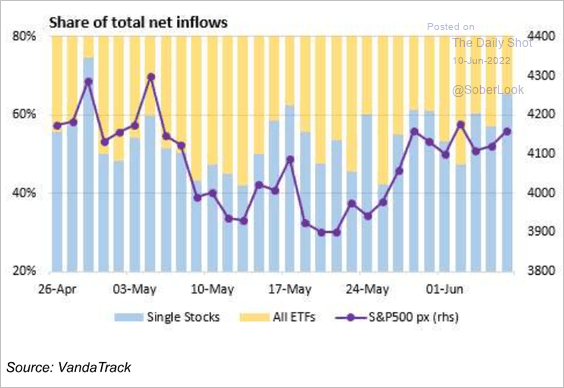 Source: Vanda Research
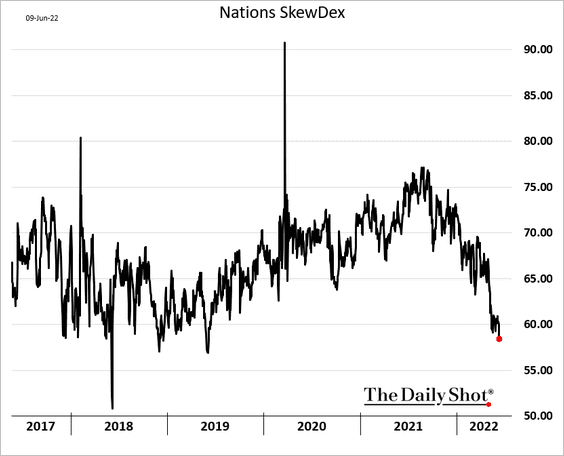
5. SPY (S&P 500 ETF) skew hit the lowest level since 2019.
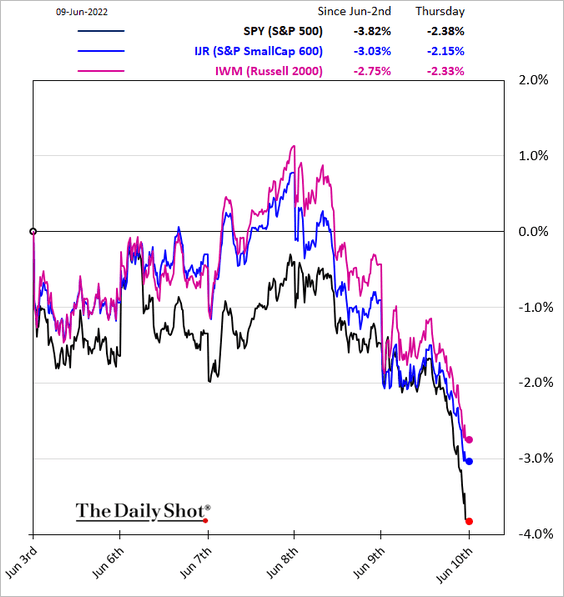
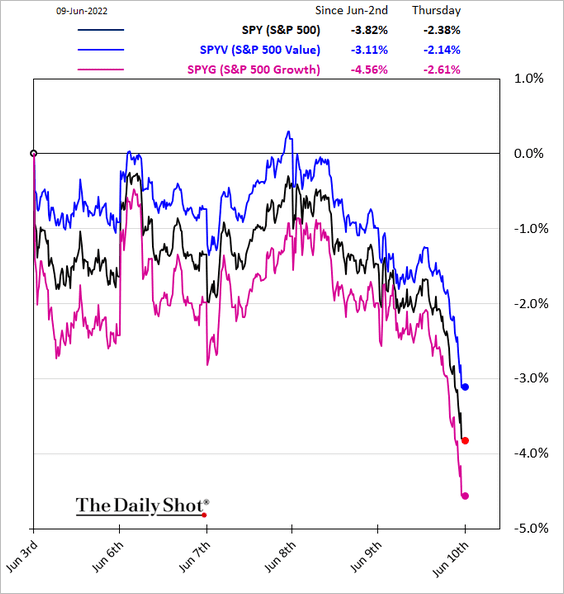
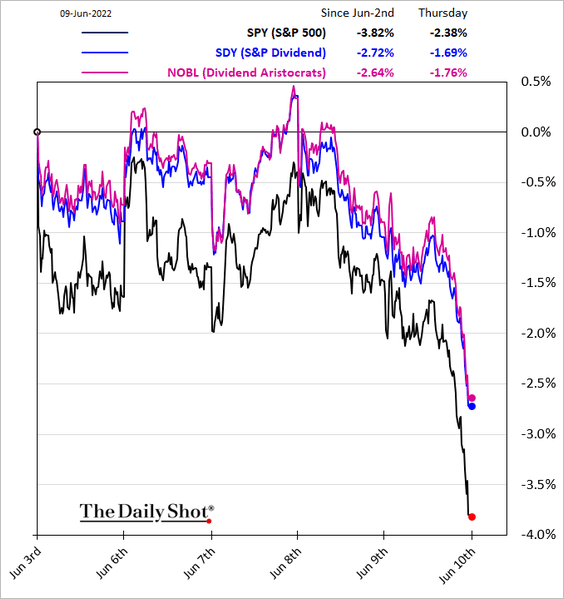
6. Next, we have some equity factor performance charts over the past five days.
• Small caps:
• Value vs. growth:
• Dividend:
——————–
7. The equal-weight S&P 500 index has been outperforming (in part due to higher energy-sector weight).
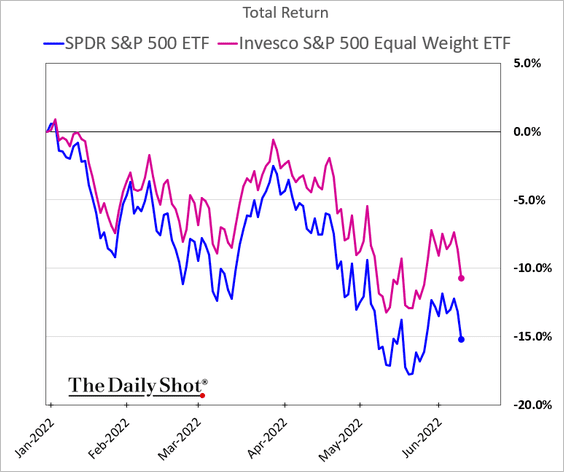
Below is the sector breakdown for the S&P 500 vs. the equal-weight index.
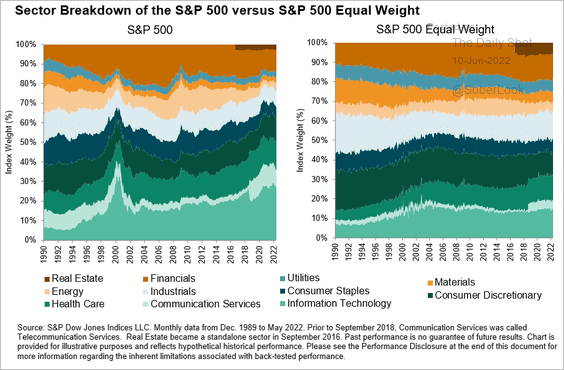 Source: S&P Dow Jones Indices
——————–
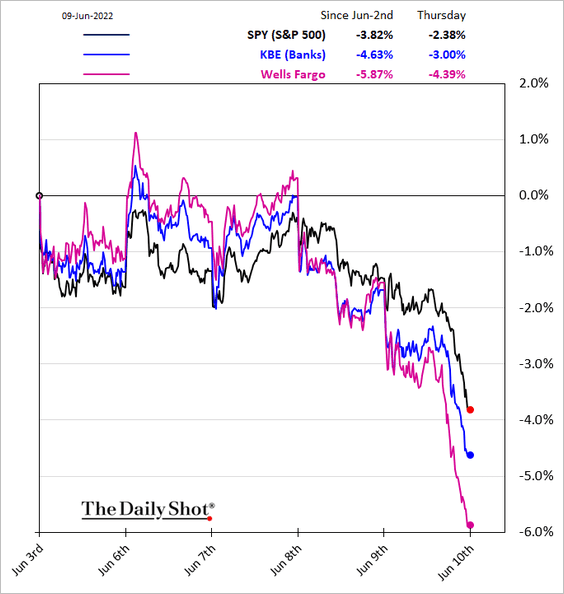
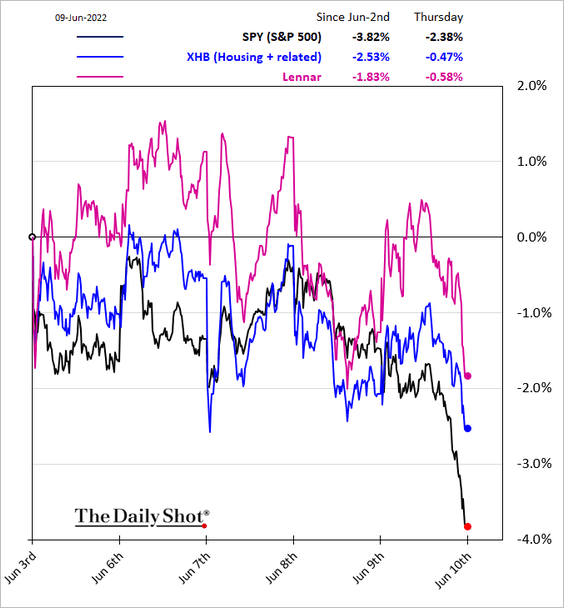
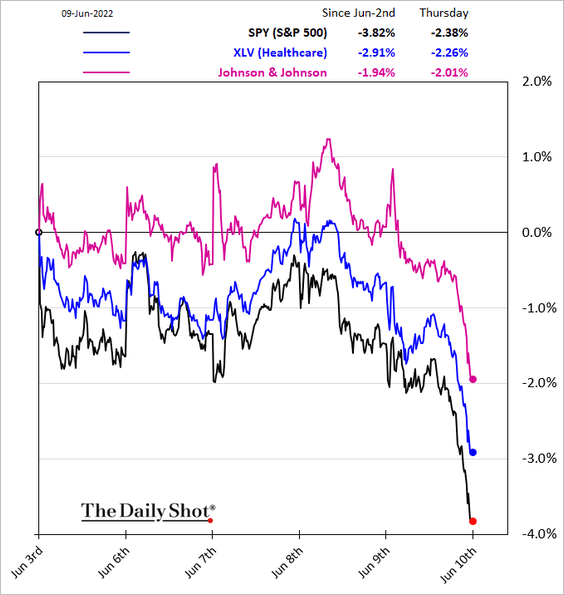
8. Finally, here are some sector updates.
• Banks:
• Housing:
• Healthcare:
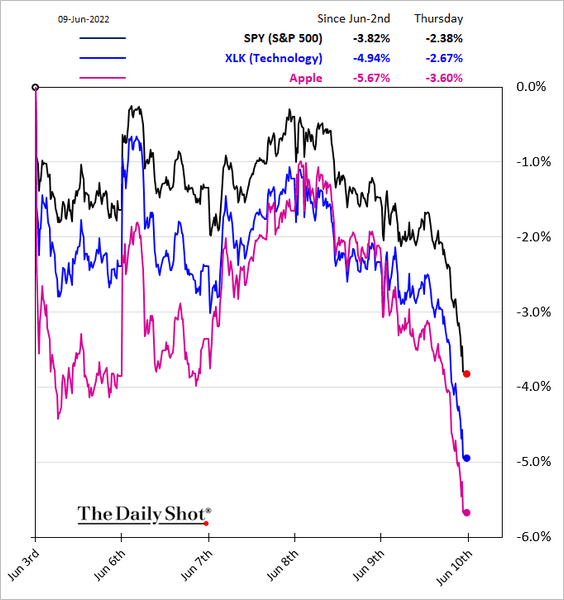
• Tech:
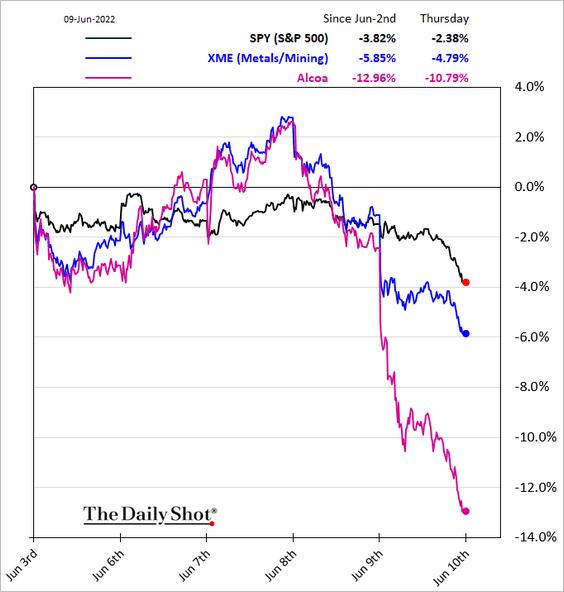
• Metals & Mining:
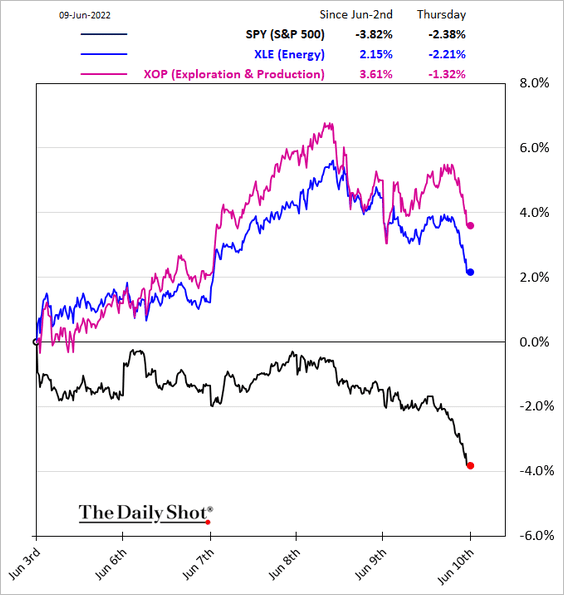
• Energy:
By the way, retail investors have been loading up on energy.
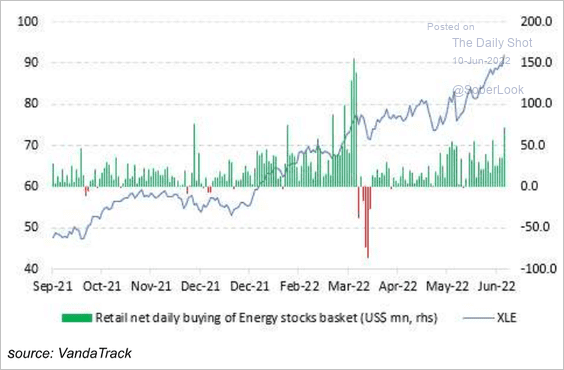 Source: Vanda Research
——————–
Food for Thought
1. Expected changes in the level of influence wielded by labor unions:
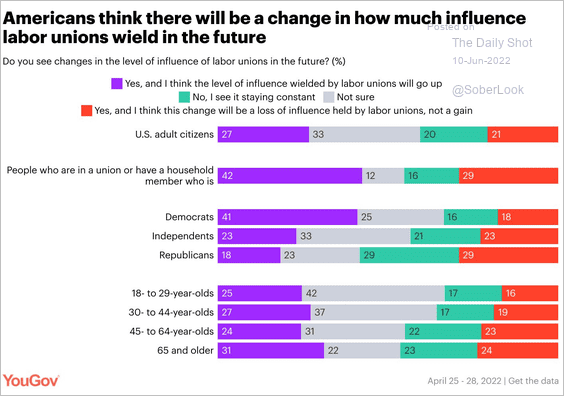 Source: @YouGovAmerica Read full article
2. Support for same-sex marriage:
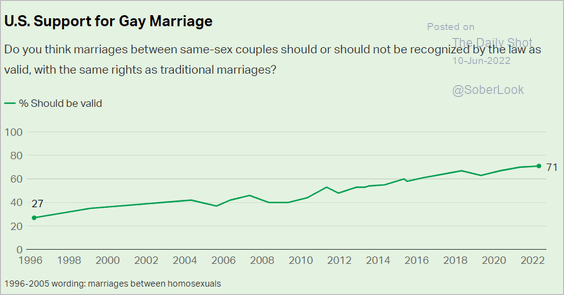 Source: Gallup Read full article
3. Homicide rates by method:
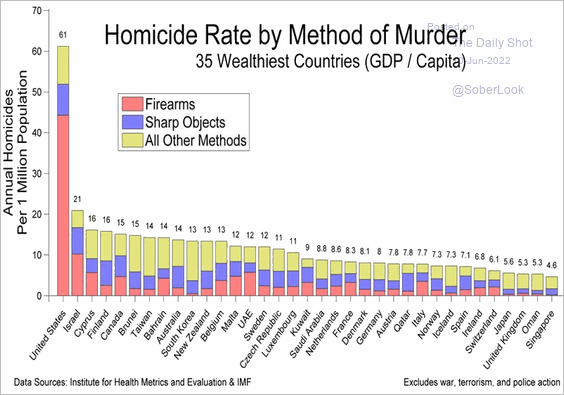 Source: Institute for Health Metrics and Evaluation
4. Gasoline prices vs. Joe Biden’s approval rating:
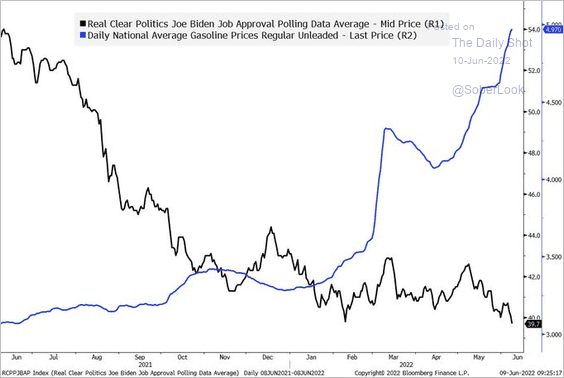 Source: @TheStalwart
5. US COVID-related deaths:
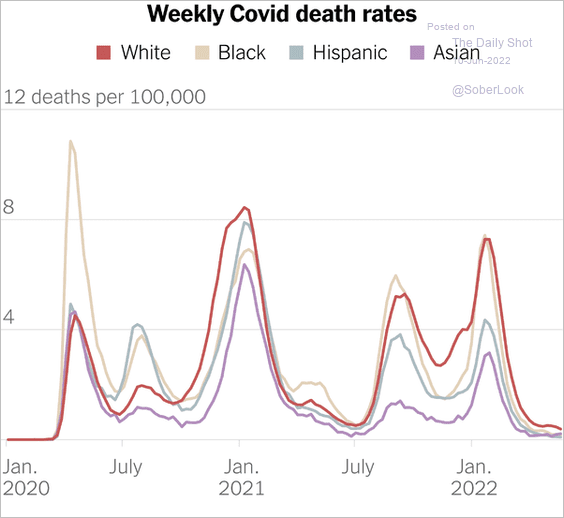 Source: The New York Times Read full article
6. Top destinations of waste from the EU:
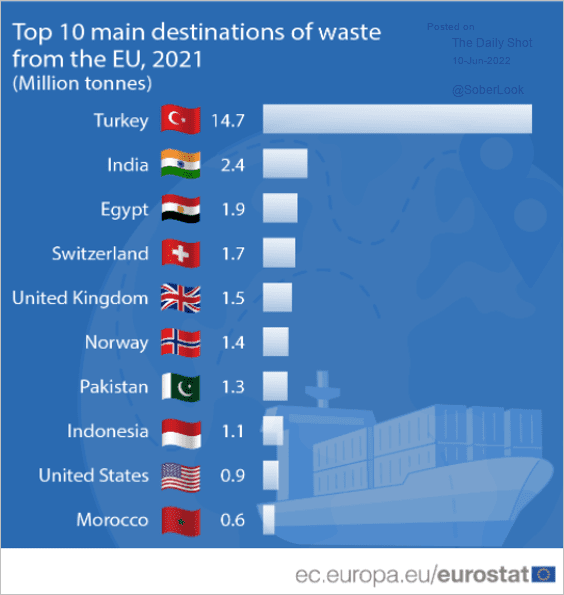 Source: Eurostat Read full article
7. The distribution of student loan balances:
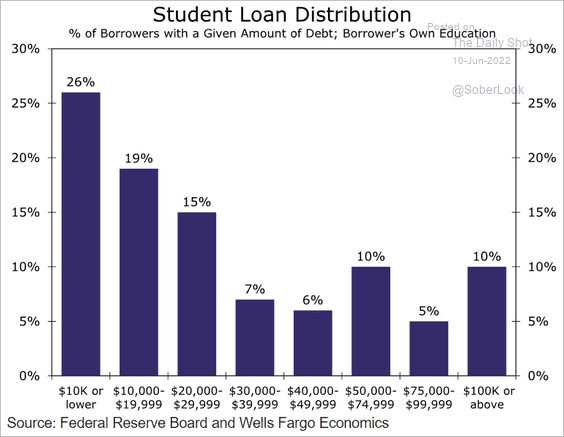 Source: Wells Fargo Securities
8. The most common nut crop, by county:
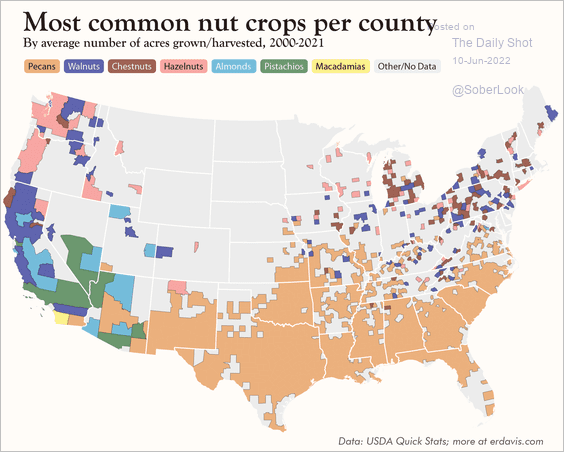 Source: @erindataviz
——————–
Have a great weekend!
Back to Index