
The Daily Shot: 13-Jun-22
• The United States
• Canada
• The Eurozone
• Europe
• China
• Emerging Markets
• Cryptocurrency
• Commodities
• Energy
• Equities
• Credit
• Rates
• Global Developments
• Food for Thought
The United States
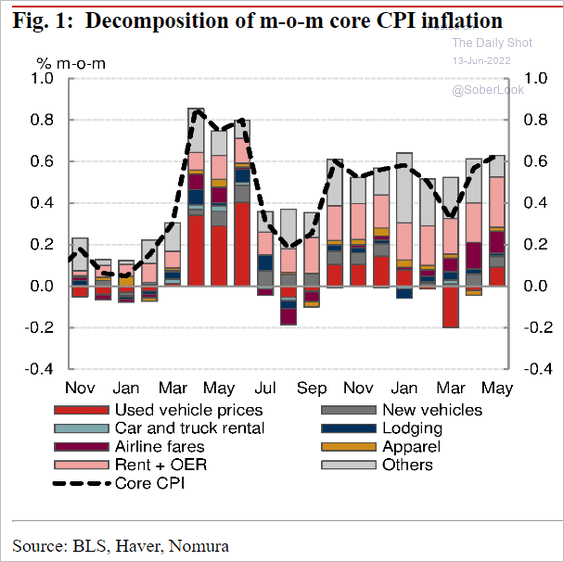
1. The CPI report surprised to the upside again. The headline CPI index re-accelerated to hit a multi-decade high. While goods inflation is easing (due to bloated inventories), food, energy, and core services CPI sped up last month.
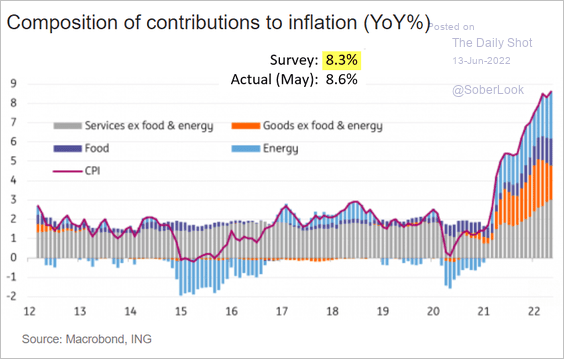 Source: ING
• It was the largest upside CPI surprise in almost a year.
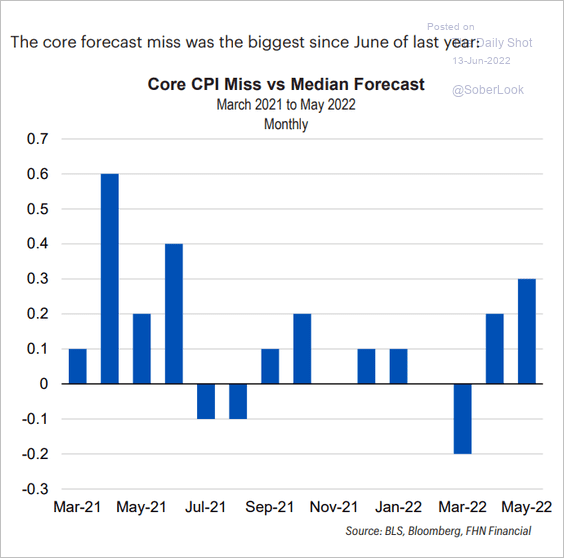 Source: FHN Financial
• Here are the monthly CPI changes.
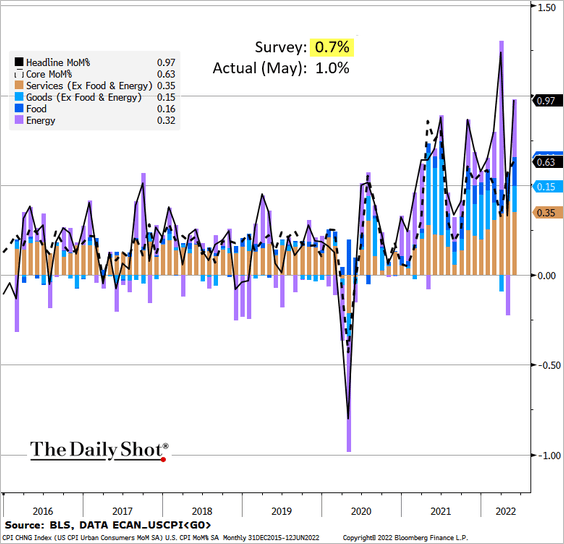 Source: @TheTerminal, Bloomberg Finance L.P.
• Food prices continue to surge.
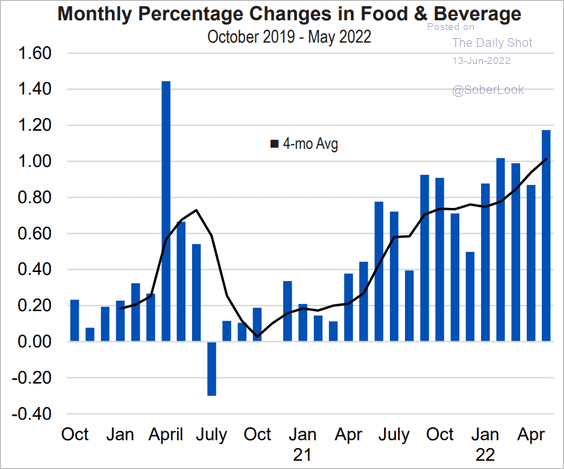 Source: FHN Financial
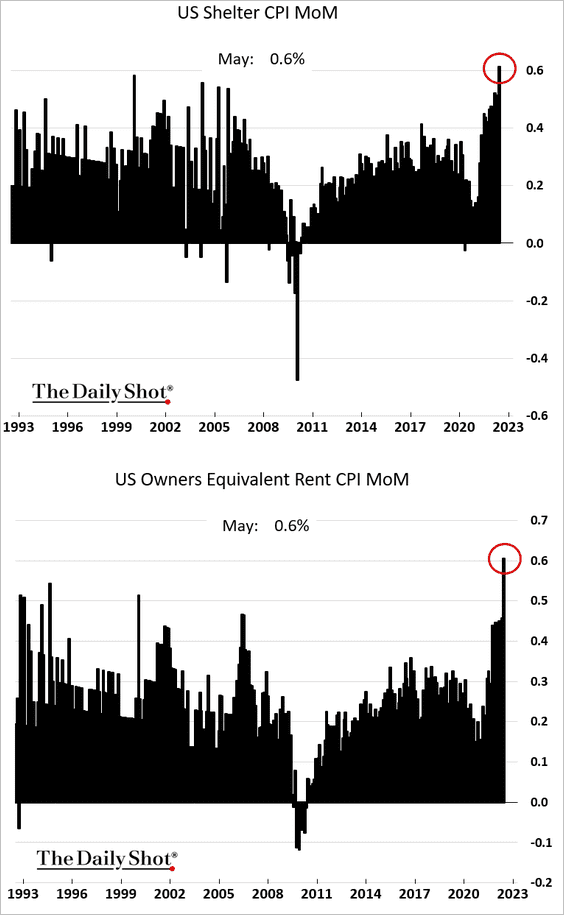
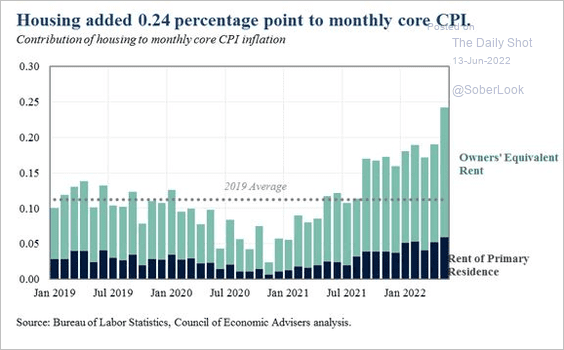
• As we mentioned last week, housing-related inflation poses a key upside risk for the core CPI (3 charts).
 Source: Nomura Securities
 Source: @WhiteHouseCEA, h/t @SamRo Read full article
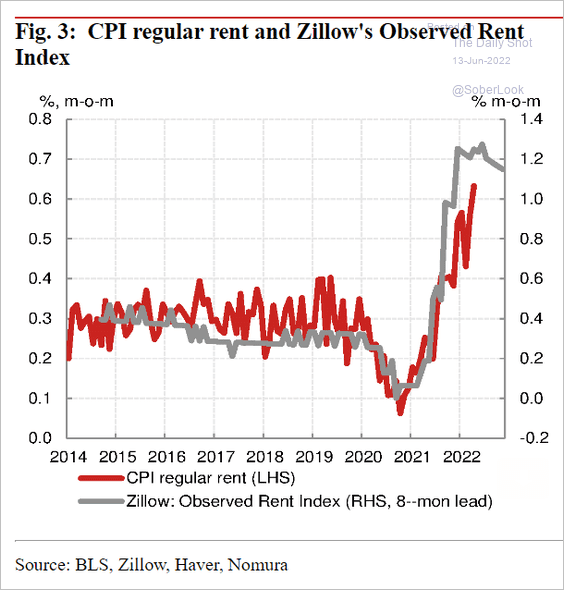
Rent CPI is yet to peak.
 Source: Nomura Securities
• Below are some key components of the core CPI.
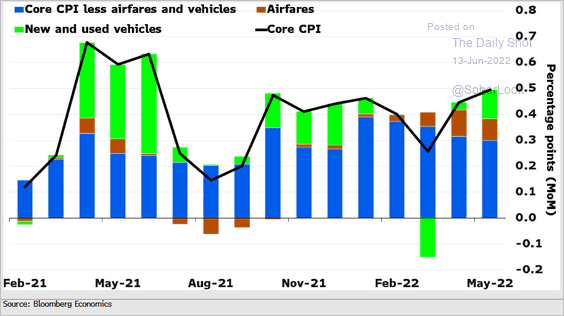 Source: Andrew Husby, Bloomberg Economics Read full article
This chart shows the price levels (not changes).
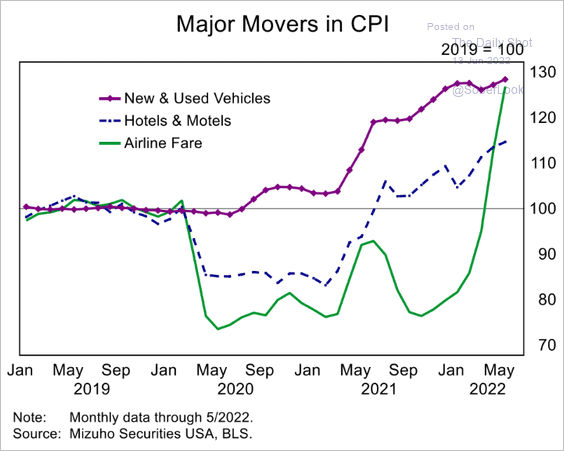 Source: Mizuho Securities USA
• CPI breadth remains elevated.
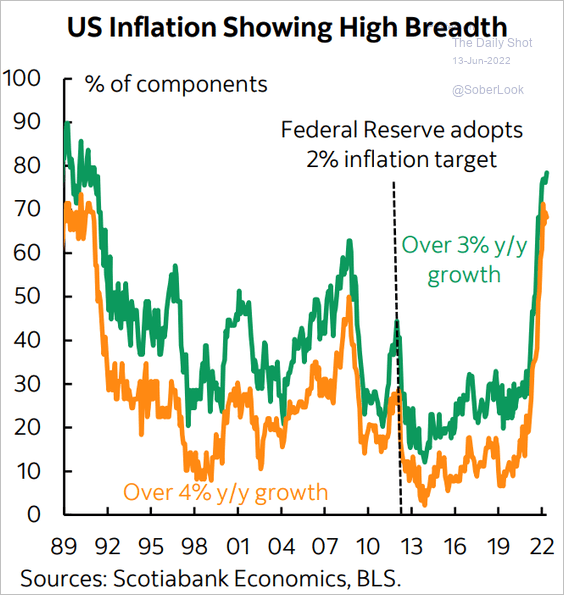 Source: Scotiabank Economics
• Durable goods are in deflation as retailers try to move inventory.
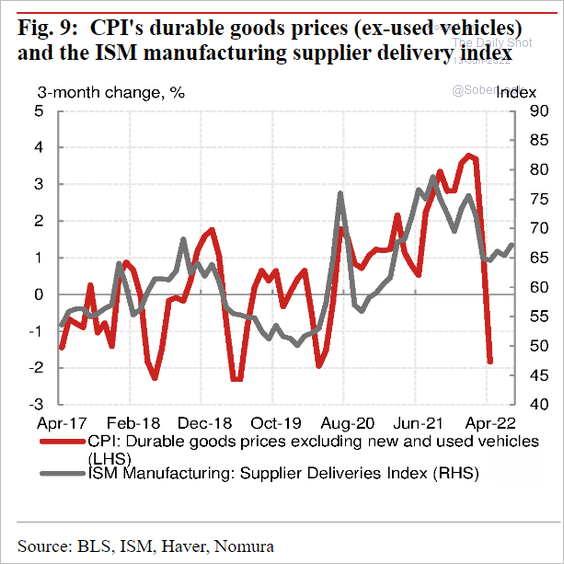 Source: Nomura Securities
We will have more data on the CPI report tomorrow.
——————–
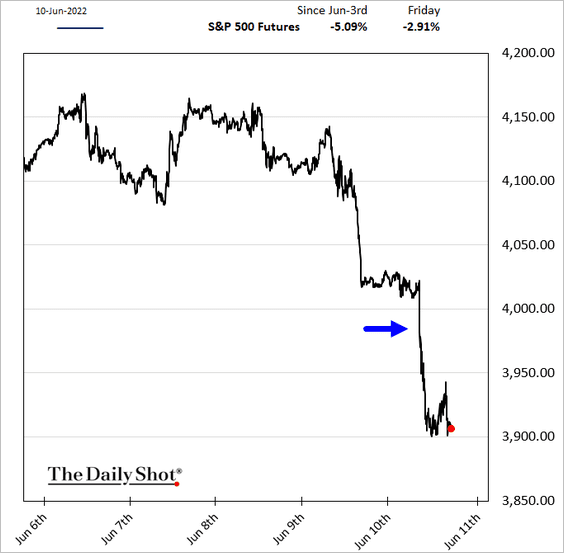
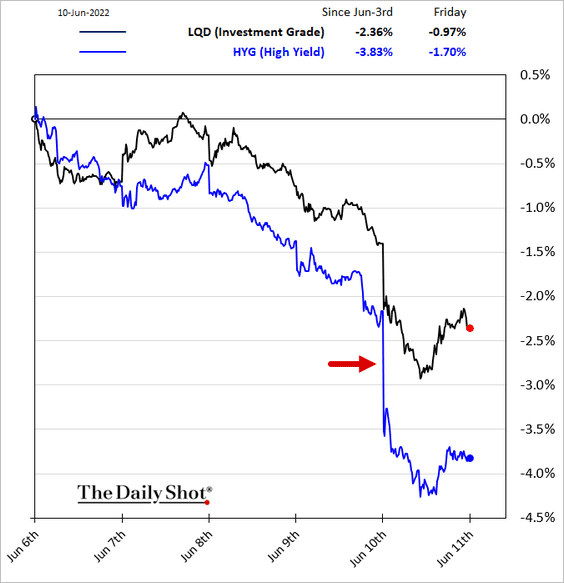
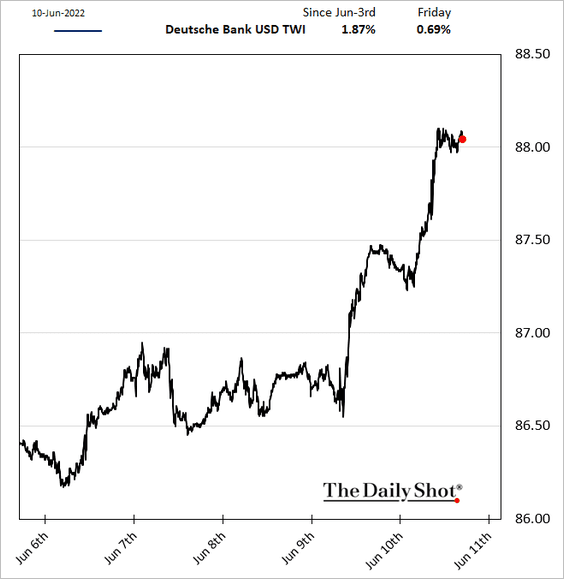
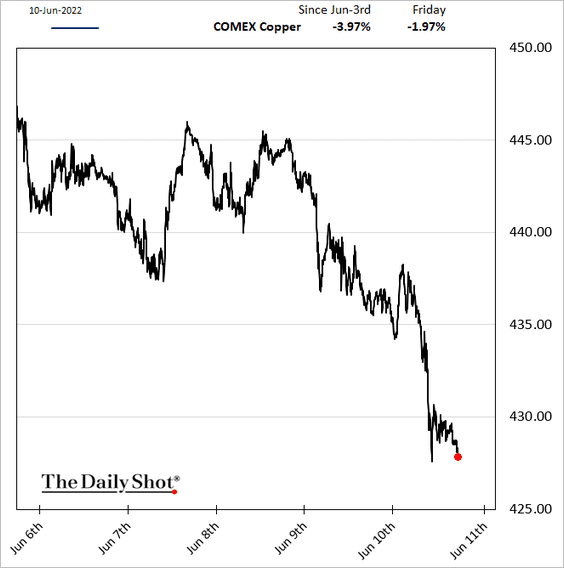
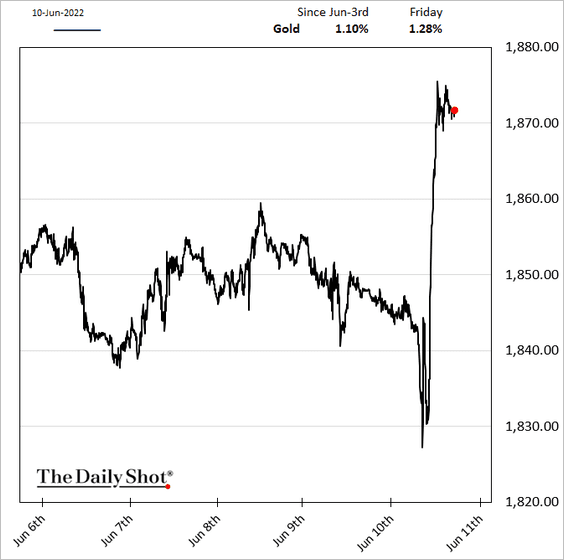
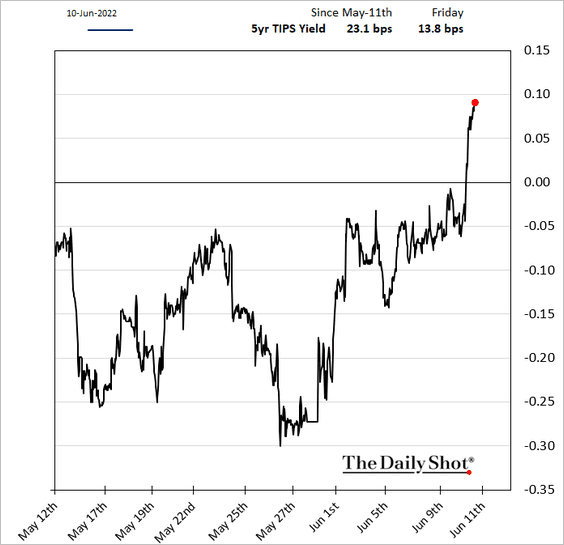
2. As expected, markets reacted violently to the CPI surprise.
– Equities:
– Credit:
– The US dollar:
– Copper:
– Gold (up sharply despite a stronger US dollar):
– The 5yr TIPS yield (real rates):
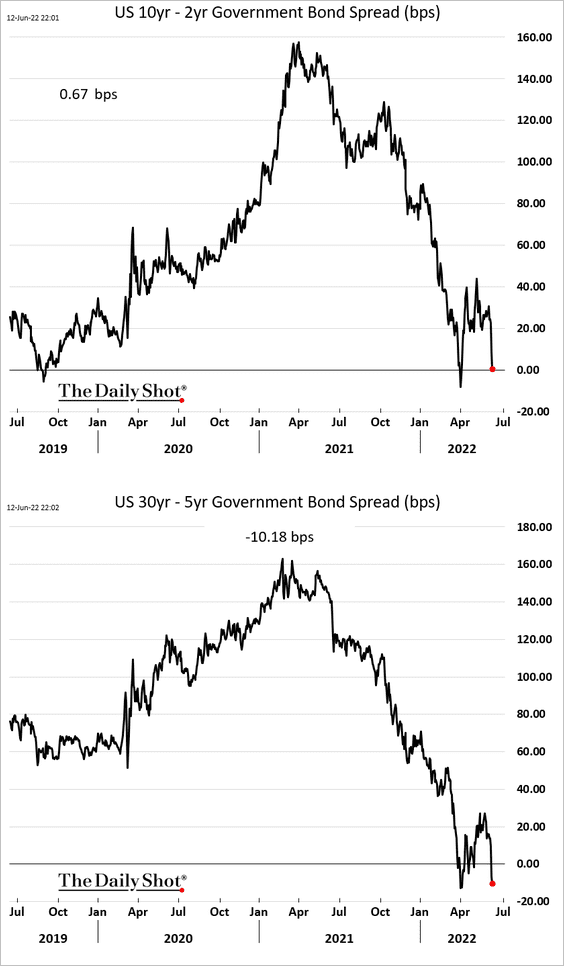
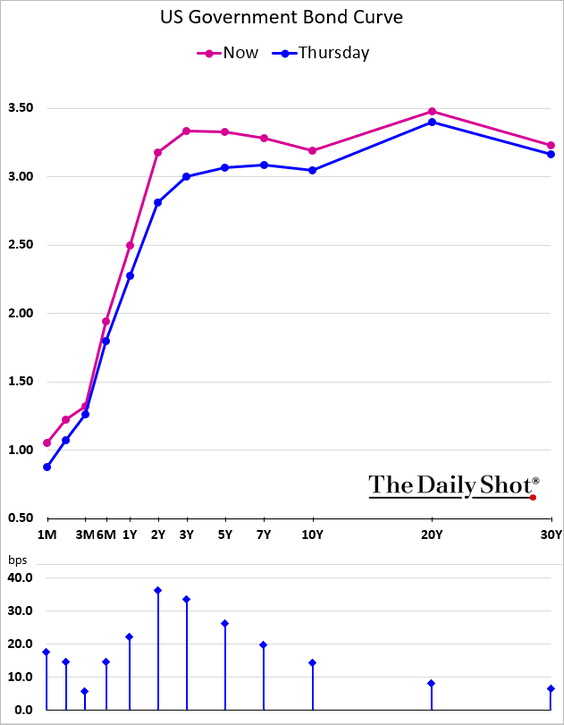
• The 2yr Treasury yield hit the highest level since 2007.
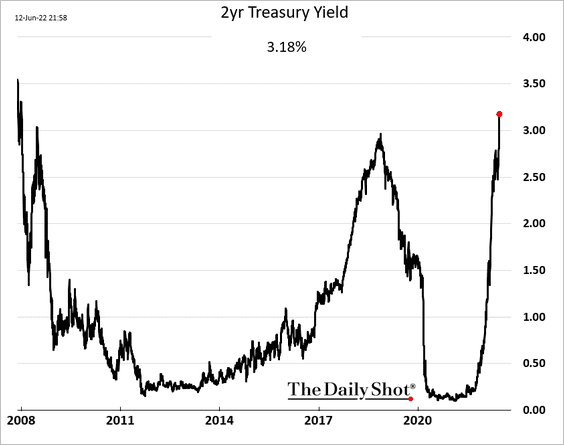
The Treasury curve is flirting with inversion as recession risks rise.
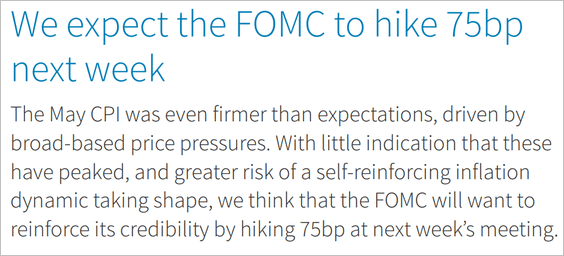
• 75 bps rate hikes are back on the table.
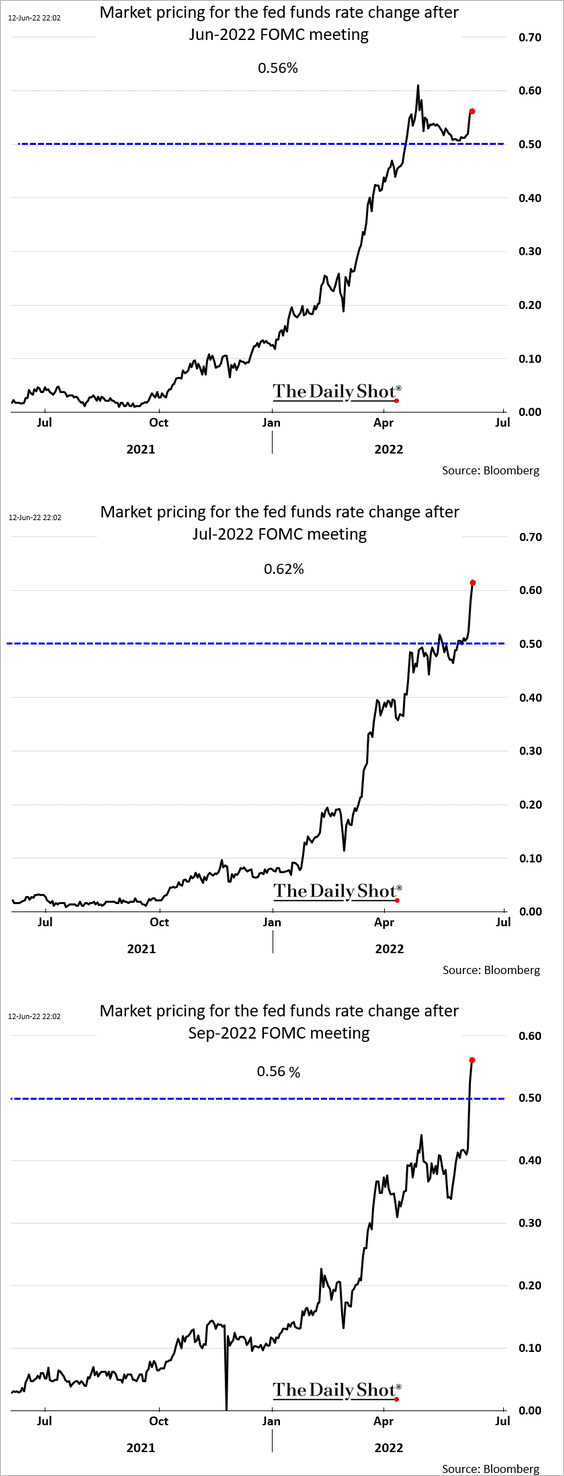
While the odds of a 75 bps rate hike this month are relatively low, some economists now expect such an outcome. Here is a quote from Barclays. However, the market-based probability of a jumbo hike next month is close to 50% now.
 Source: Barclays Research
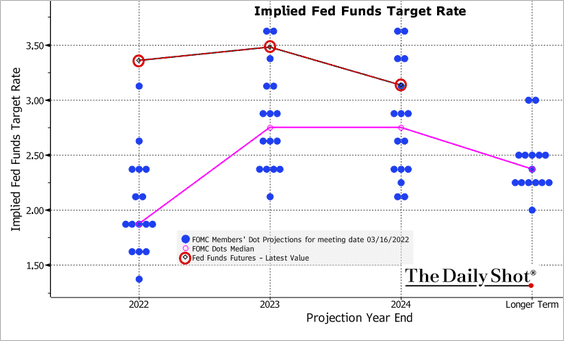
• The Fed is now expected to take rates well above 3.5%, …
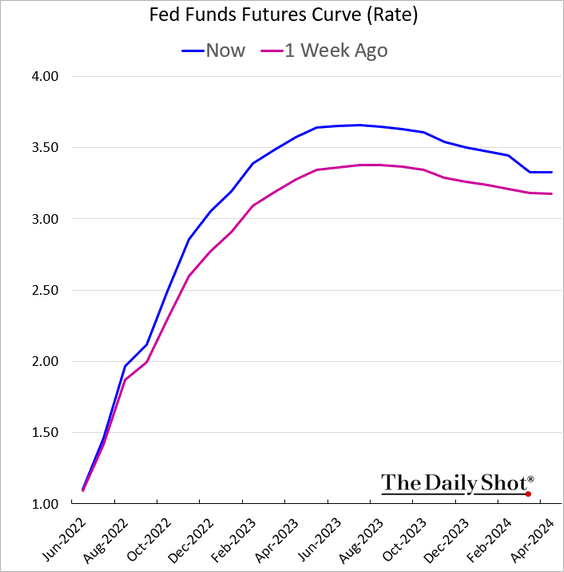
… with most of the increases coming this year (frontloading).
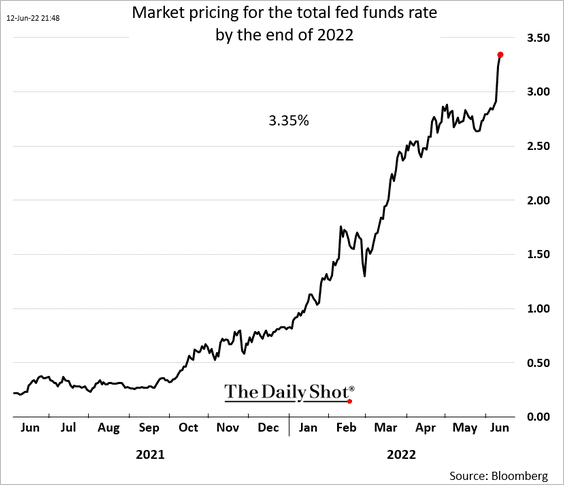
Market expectations are now well above the FOMC’s dot-plot.
 Source: @TheTerminal, Bloomberg Finance L.P.
——————–
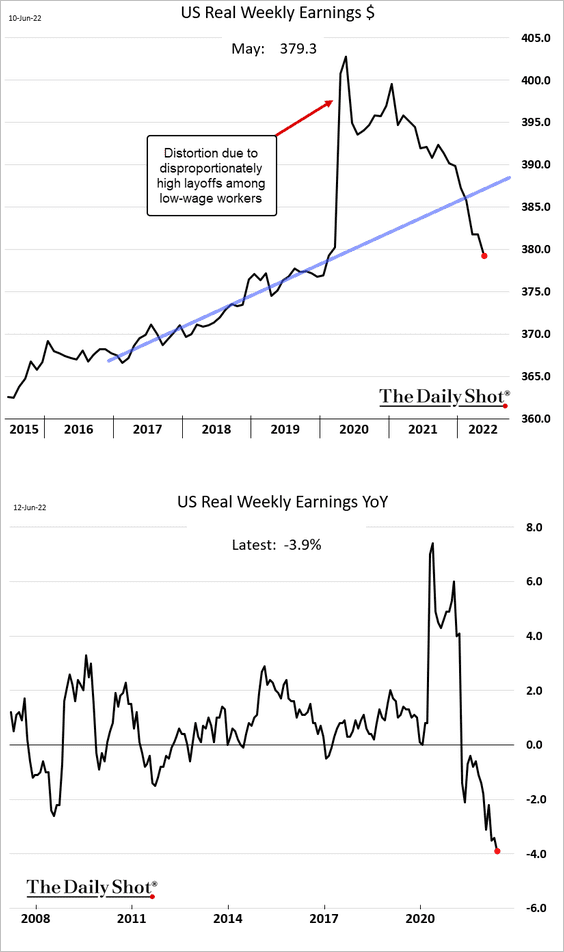
4. Real wages continue to deteriorate.
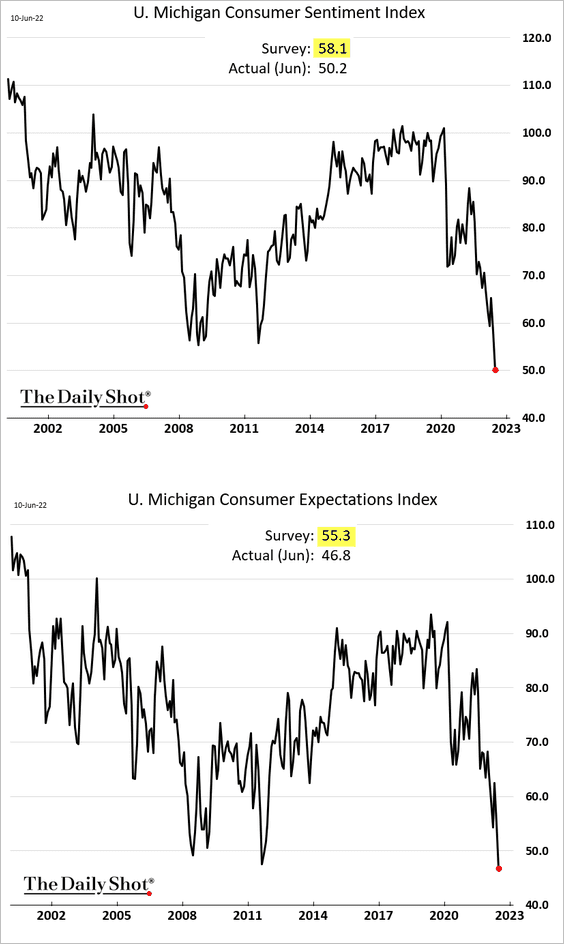
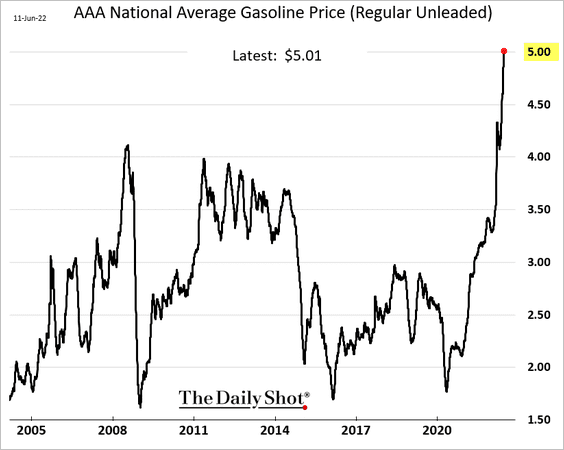
5. The U. Michigan consumer sentiment index hit the lowest level on record this month, …
 Source: MarketWatch Read full article
… as the average gasoline price exceeds $5.0.
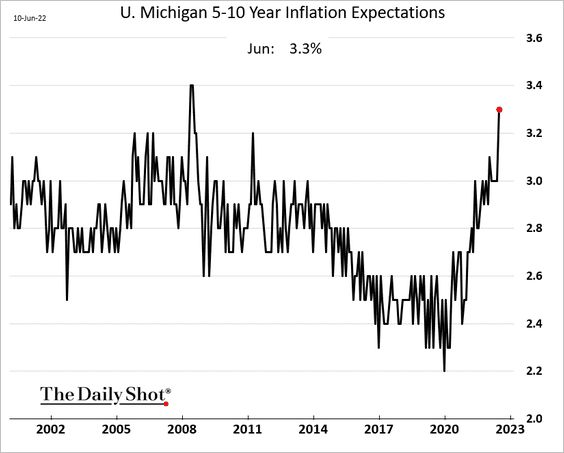
6. Inflation expectations remain elevated.
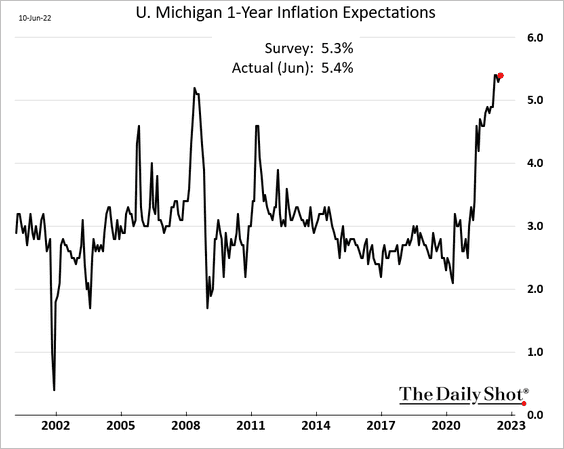
The biggest problem for the Fed may not even be the CPI surprise (above). Instead, it could be the chart below. Are longer-term inflation expectations becoming unanchored?
Back to Index
Canada
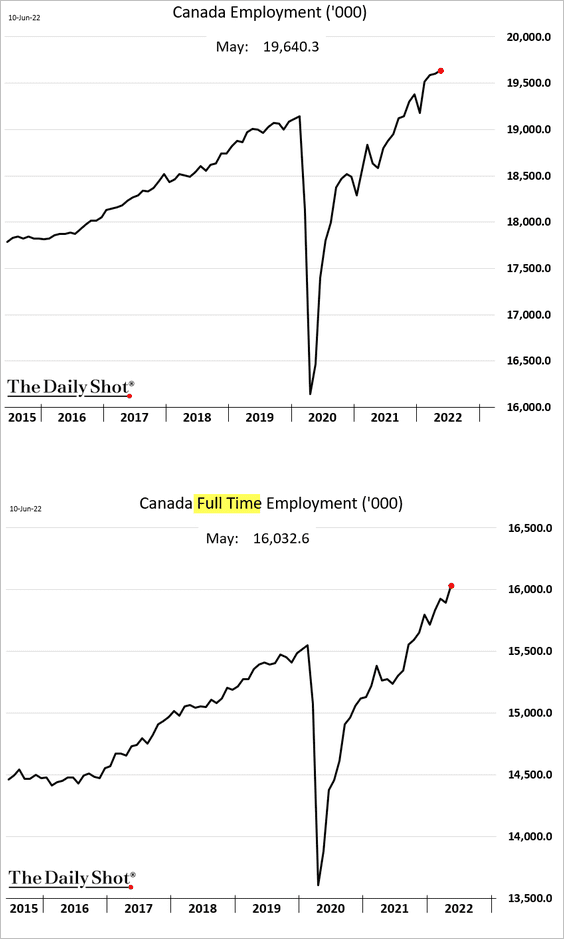
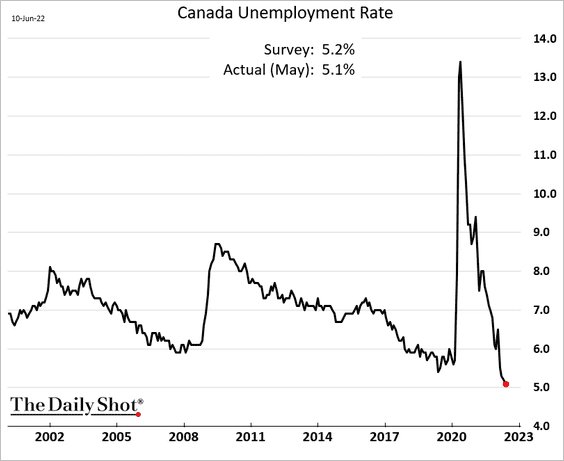
The labor market remains robust, with full-time employment surging (2nd panel).
• The unemployment rate is at multi-decade lows.
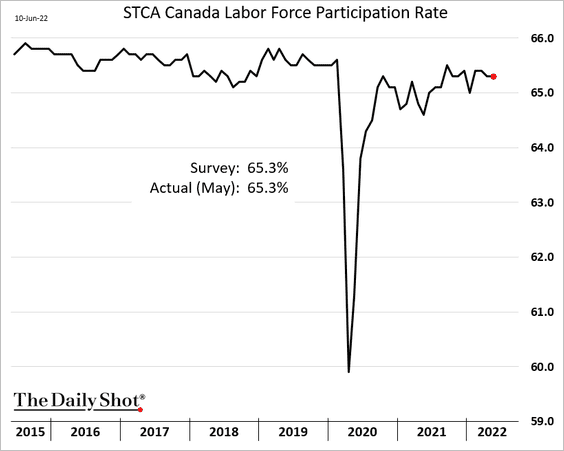
• The participation rate held steady last month.
• Wage growth strengthened.
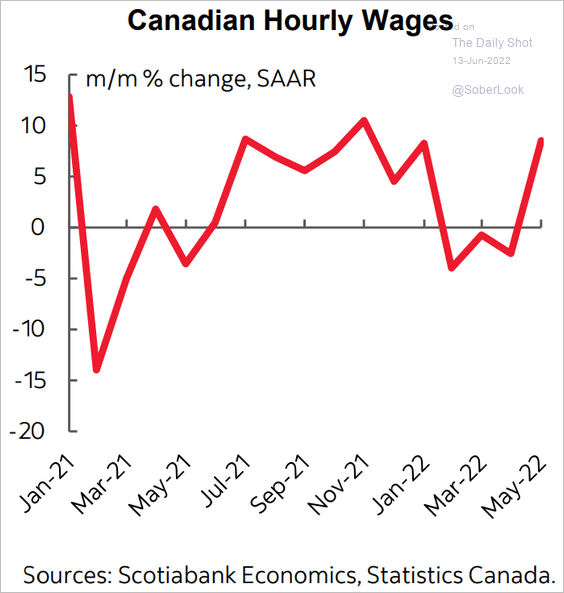 Source: Scotiabank Economics
Back to Index
The Eurozone
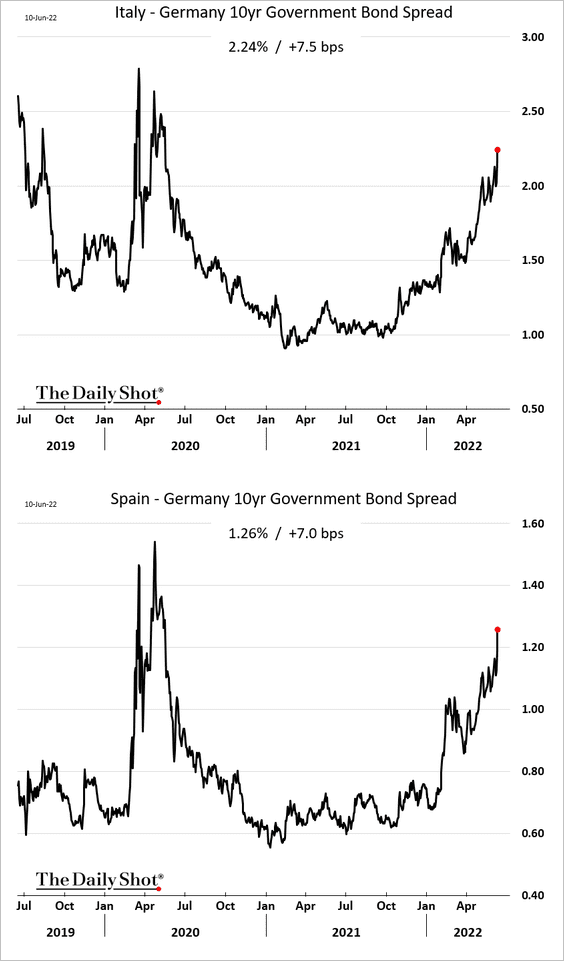
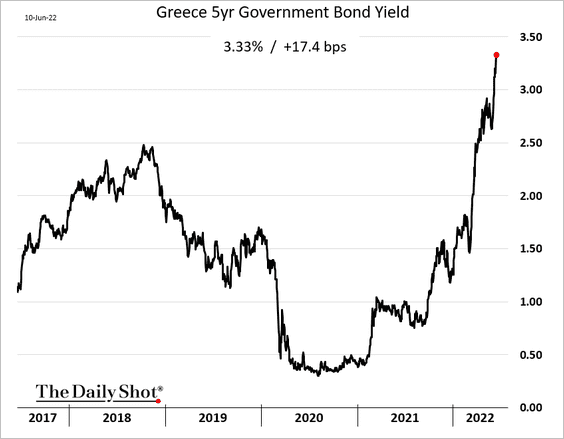
1. Italian and Spanish bond spreads continue to widen, raising concerns about fragmentation.
Here is the Greek 5yr yield.
——————–
2. The euro is weaker again as global risk aversion and a hawkish Fed boost the US dollar.
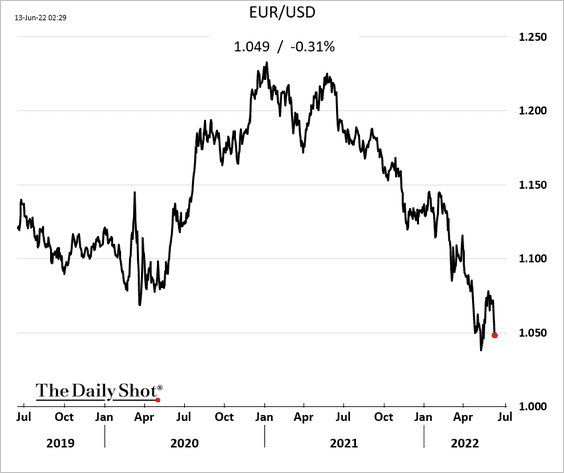
EUR/USD has decoupled from interest rate differentials.
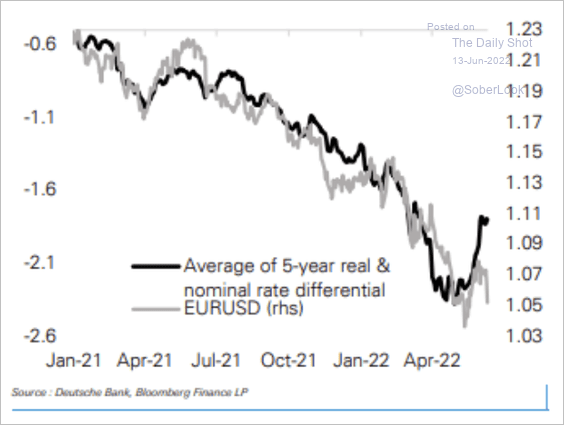 Source: Deutsche Bank Research
——————–
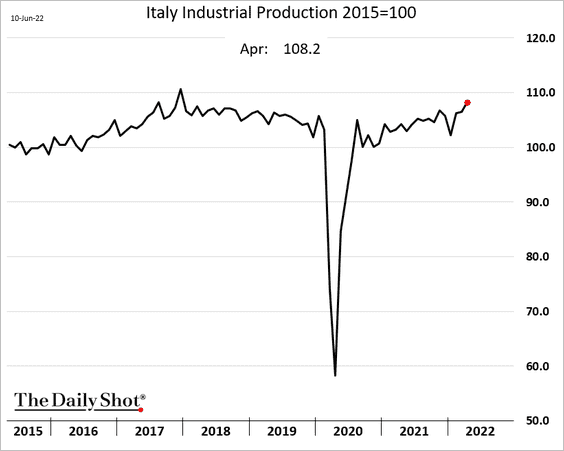
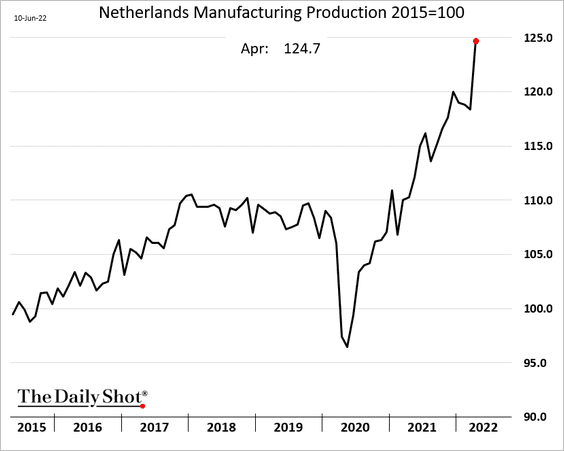
3. Outside of Germany, April’s industrial production reports for April are not terrible.
• Italy:
• The Netherlands:
——————–
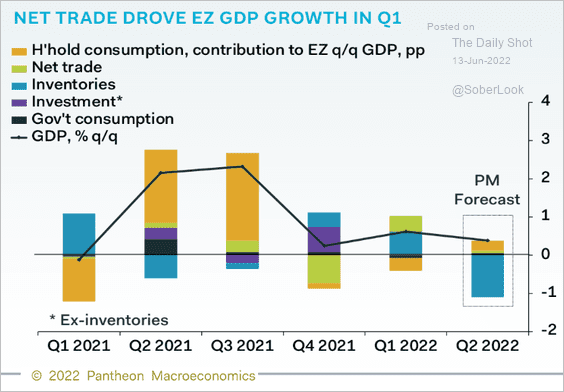
4. According to Pantheon Macroeconomics, the GDP will contract this quarter due to inventory adjustments. But growth ex. inventories is expected to be positive.
 Source: Pantheon Macroeconomics
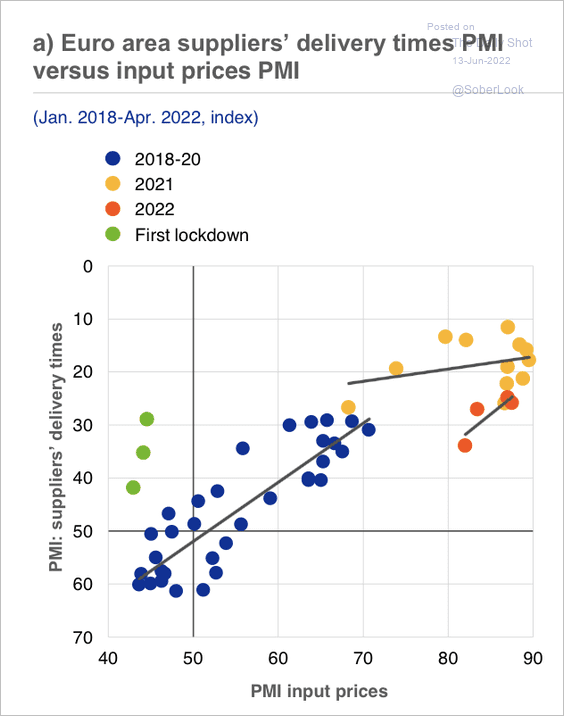
5. Supply chain disruptions and higher input prices have delayed the recovery from the pandemic.
 Source: ECB
Back to Index
Europe
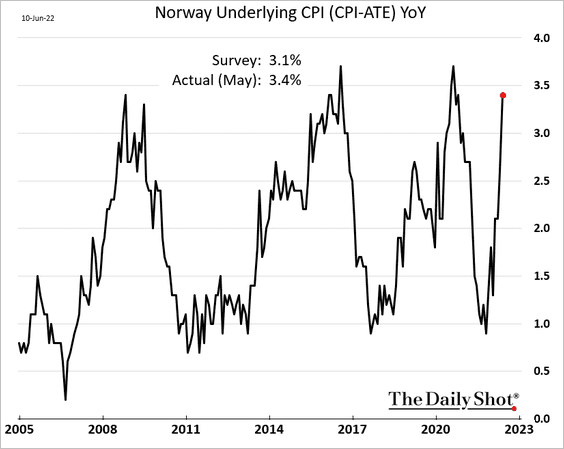
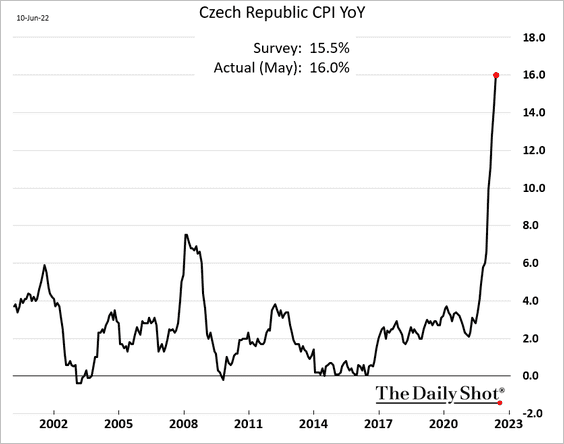
Inflation is surprising to the upside across Europe.
• Norway:
• The Czech Republic:
Back to Index
China
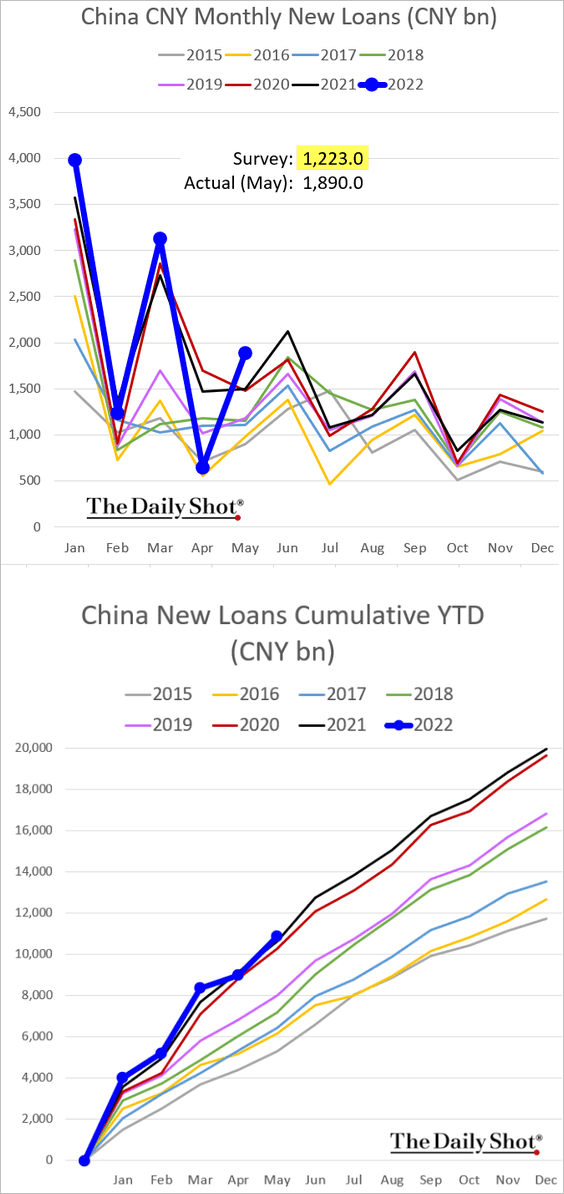
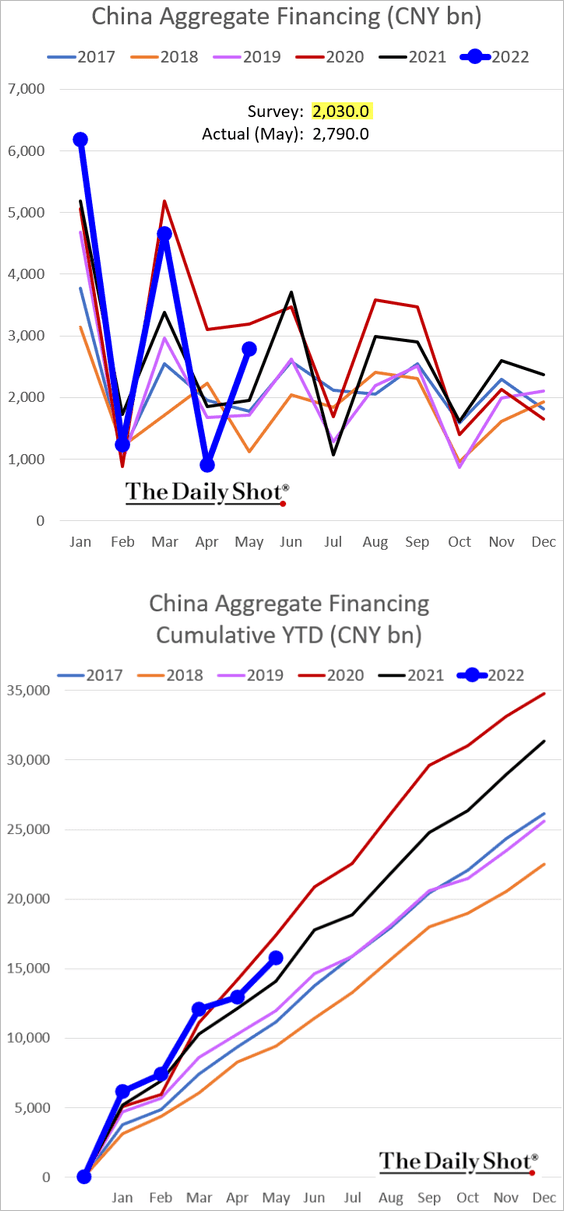
1. Credit growth rebounded in May, topping expectations.
• Bank loans:
• Total financing:
——————–
2. Labor share has been gaining ground.
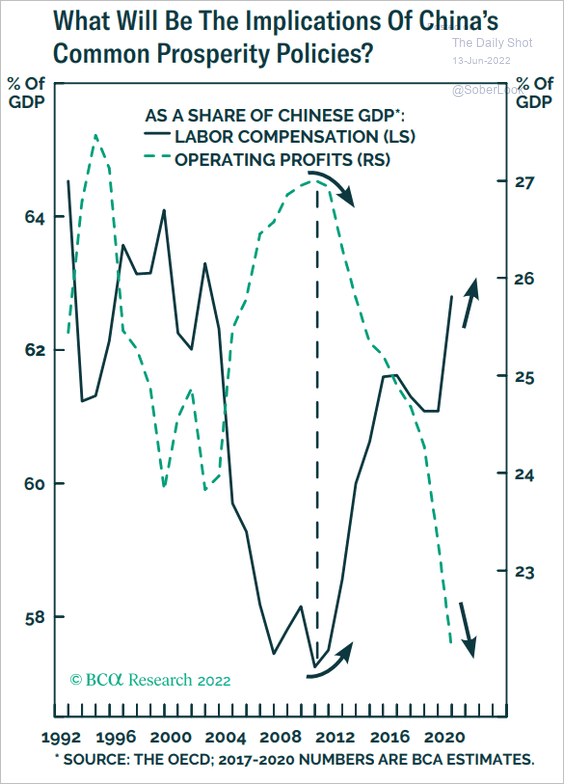 Source: BCA Research
3. This chart shows China’s electricity generation by source.
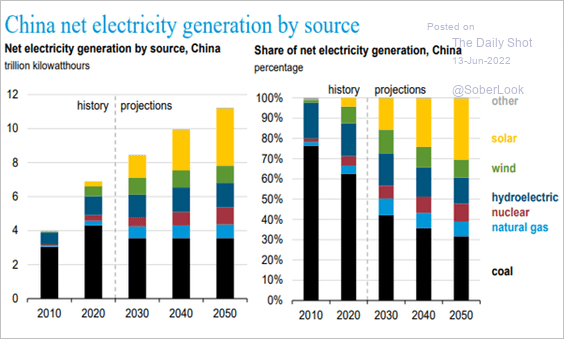 Source: @EIAgov
Back to Index
Emerging Markets
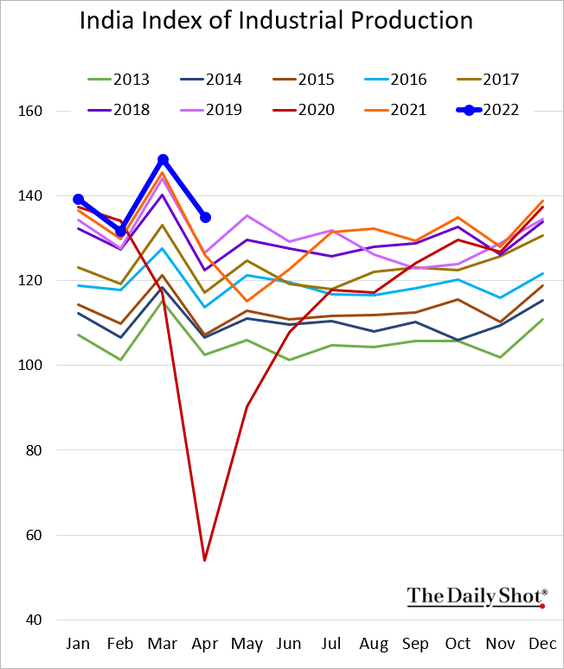
1. India’s industrial production was very strong in April.
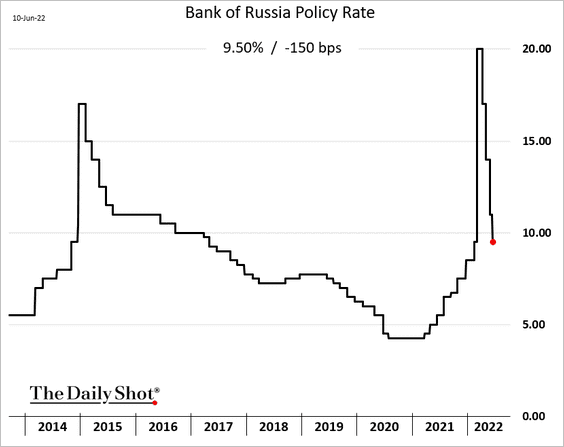
2. Russia’s central bank cut rates again.
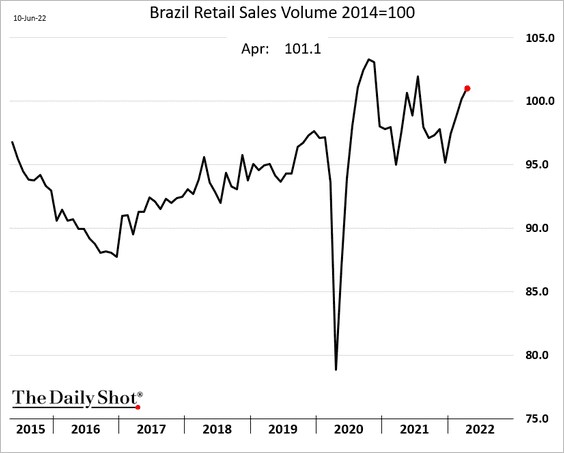
3. Brazil’s retail sales continue to climb.
Separately, is the central bank done hiking rates?
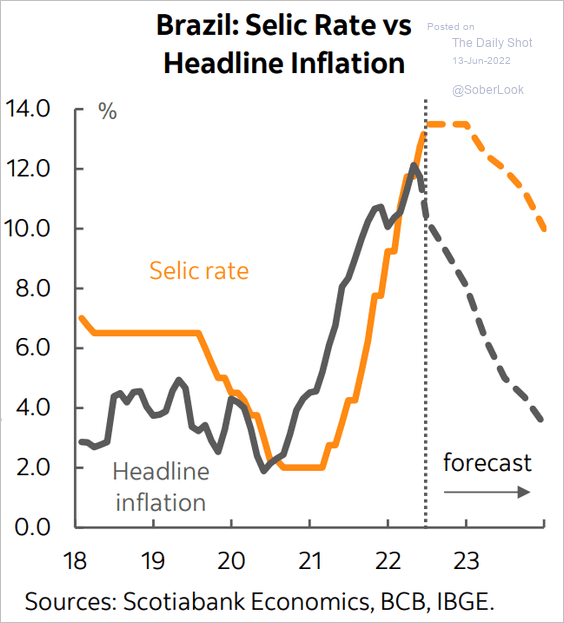 Source: Scotiabank Economics
——————–
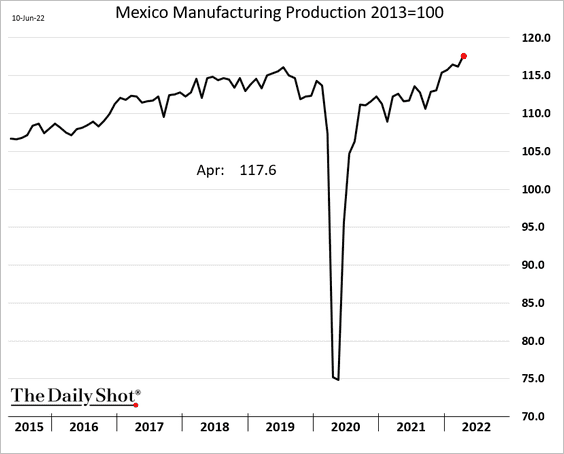
4. Mexican manufacturing output increased again in April.
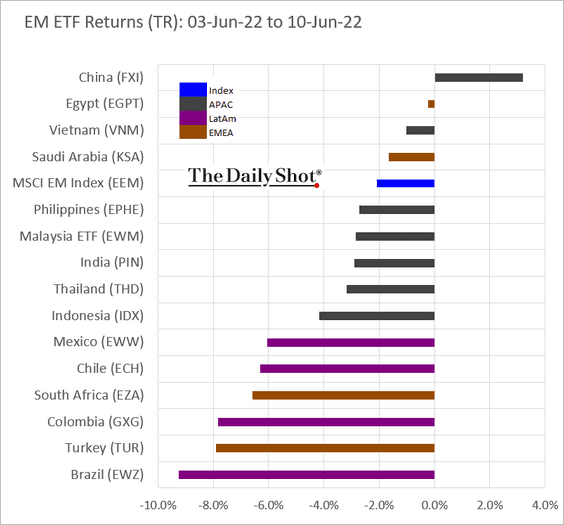
5. Next, we have some performance data from last week.
• Equity ETFs:
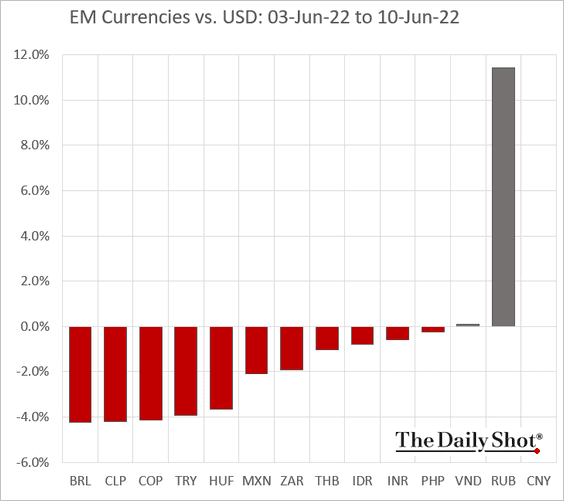
• Currencies:
Back to Index
Cryptocurrency
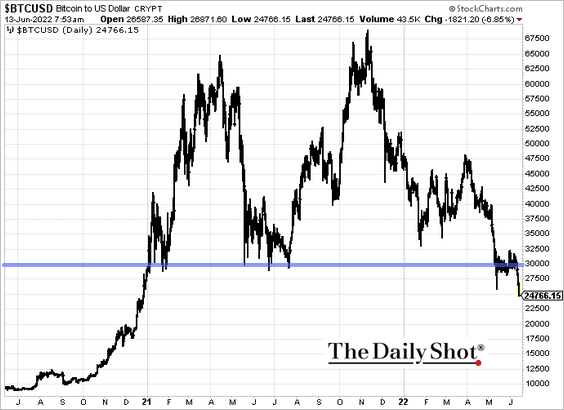
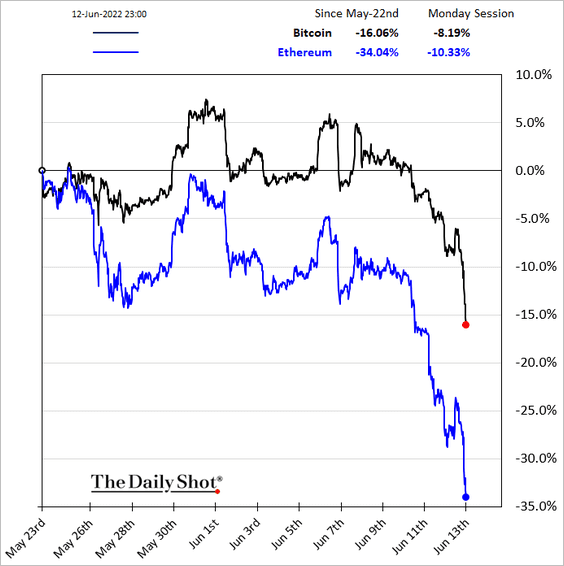
1. Cryptos plunged with stocks, as bitcoin dips below $25k.
Ether is widening its underperformance.
——————–
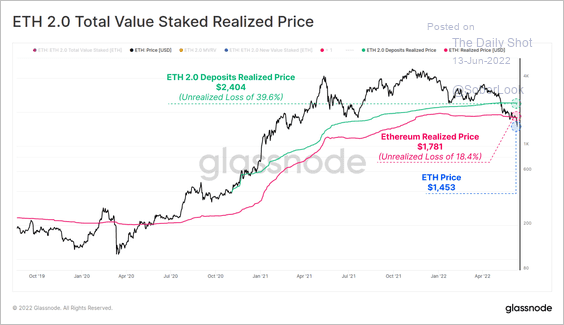
2. Ether (ETH) has fallen below its average realized price (based on the cost-basis of holders, recorded on blockchain). A majority of market participants are at a loss during the current cycle, especially ETH 2.0 deposits.
 Source: @glassnode
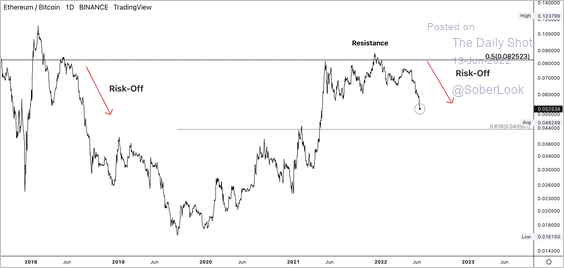
3. There has been a significant breakdown in the ETH/BTC price ratio, similar to what occurred in the 2018 bear market.
 Source: Dantes Outlook
4. This chart shows more of bitcoin’s hashrate moving offline, which typically signals stress in miner incomes.
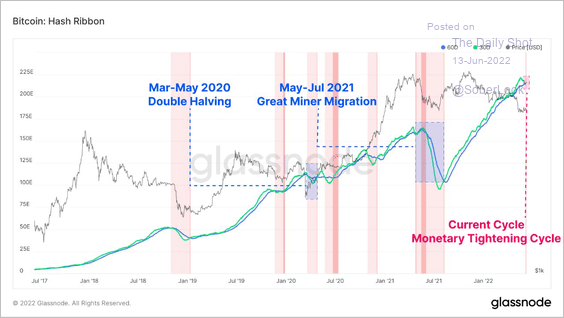 Source: @glassnode
Back to Index
Commodities
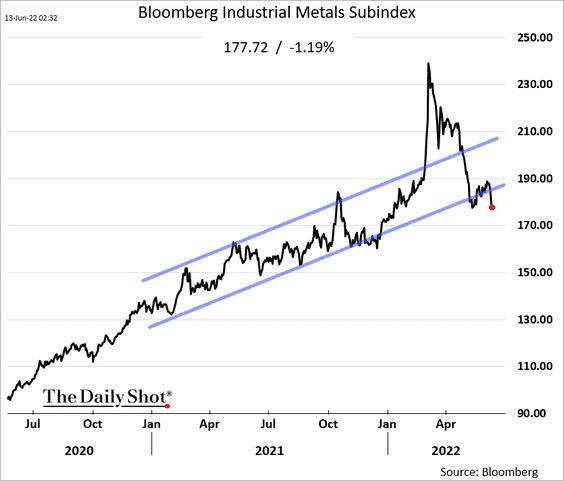
1. Bloomberg’s broad industrial metals index broke below the uptrend channel as the dollar movies higher and US yields surge.
2. US farm businesses are not happy as input costs soar.
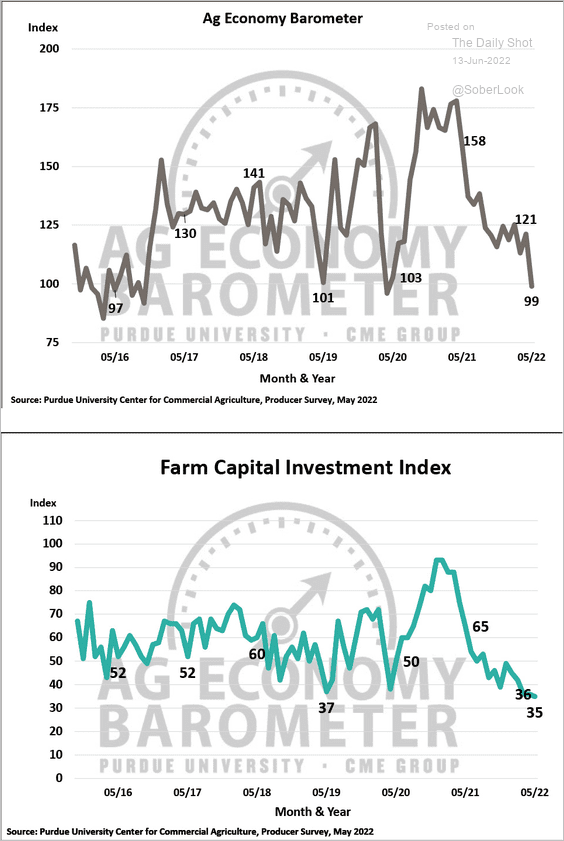 Source: Purdue University-CME Group Ag Economy Barometer
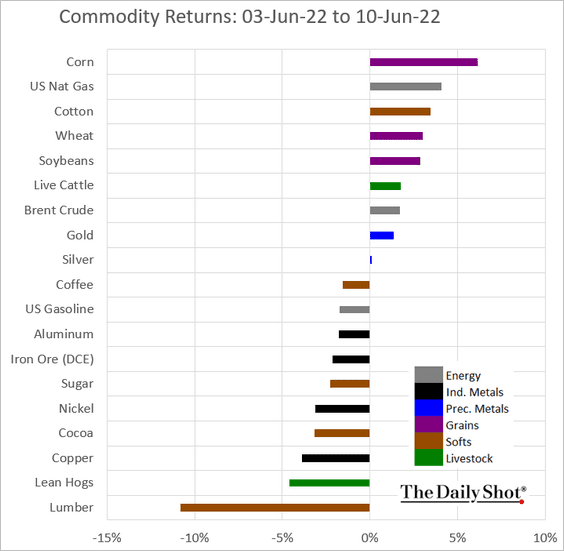
3. Here is last week’s performance across major commodity markets.
Back to Index
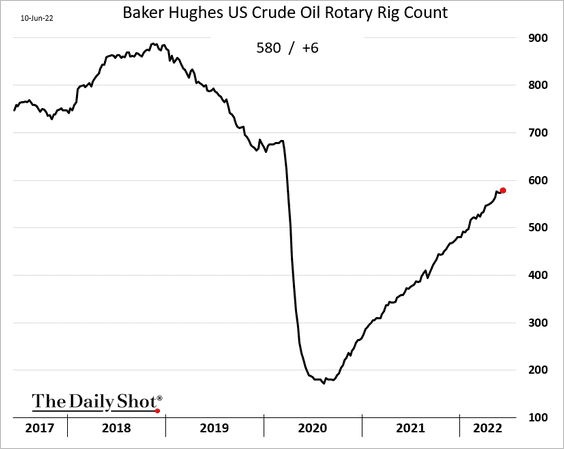
Energy
1. The US rig count is grinding higher but remains below pre-COVID levels.
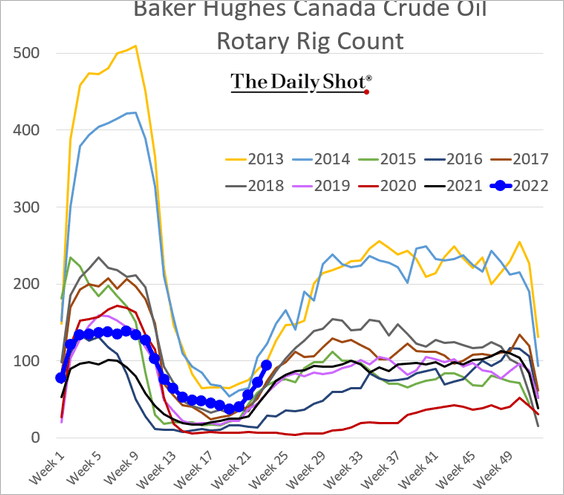
Canadian rigs have picked up momentum.
——————–
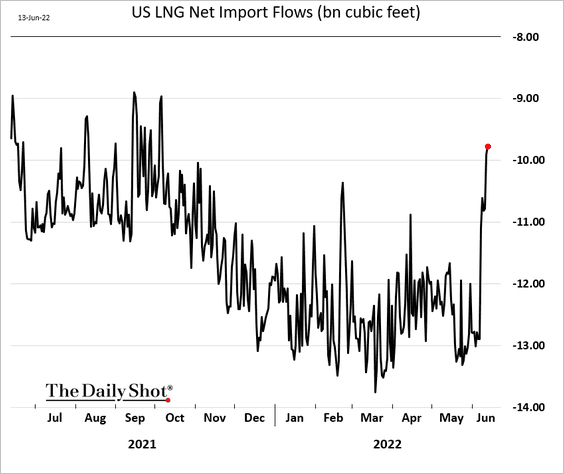
2. US LNG exports slowed as the Freeport LNG terminal shuts.
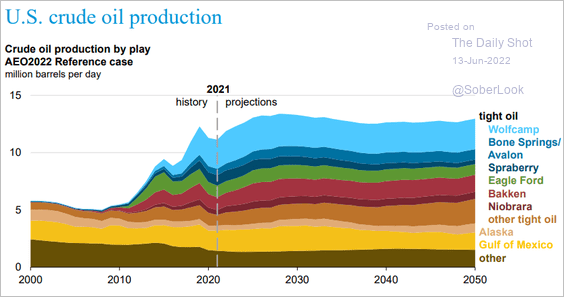
3. US crude oil production is expected to peak in the next few years.
 Source: @EIAgov
4. Renewables’ share of global electricity production is expected to keep growing.
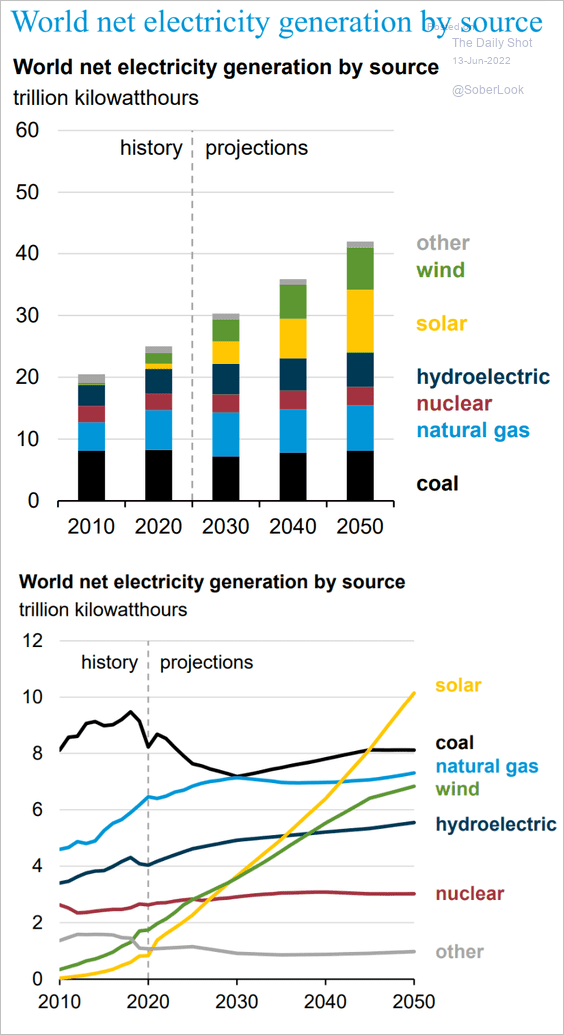 Source: @EIAgov
Back to Index
Equities
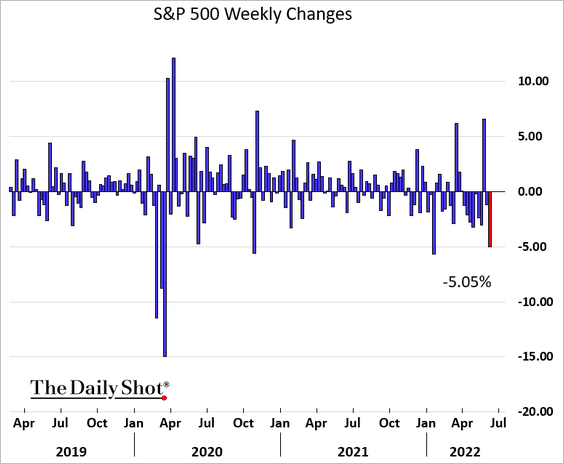
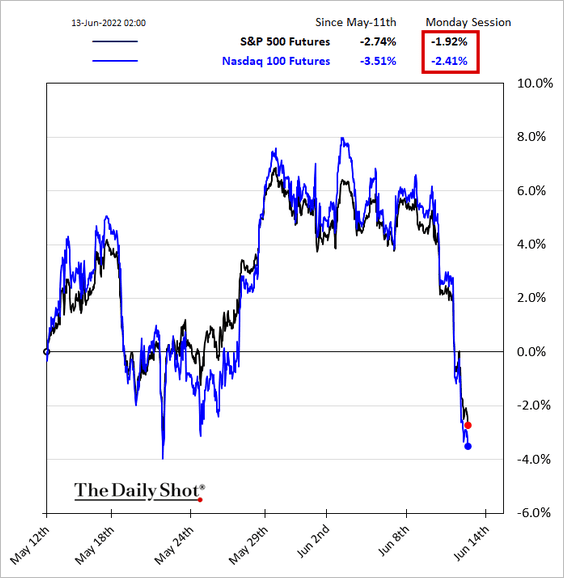
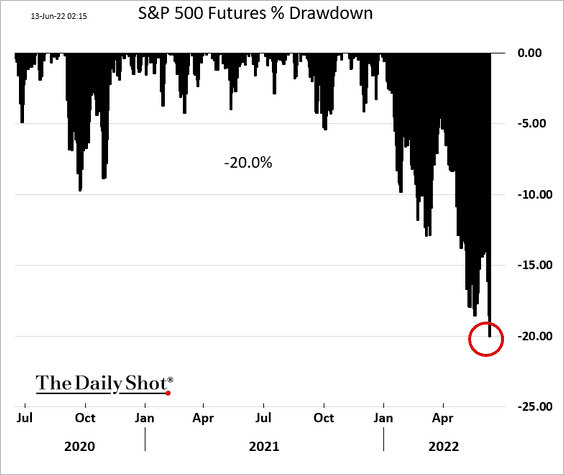
1. It was a rough week for equities as the US CPI surprised to the upside again.
Futures took another leg down this morning.
2. At this point, it’s hard to see a catalyst to keep the S&P 500 from entering bear-market territory.
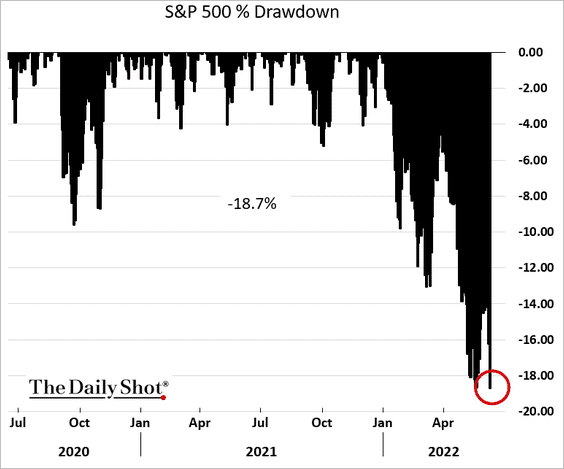
Stock futures are already there.
——————–
3. The S&P 500 has more room to fall to align with growth in fundamentals.
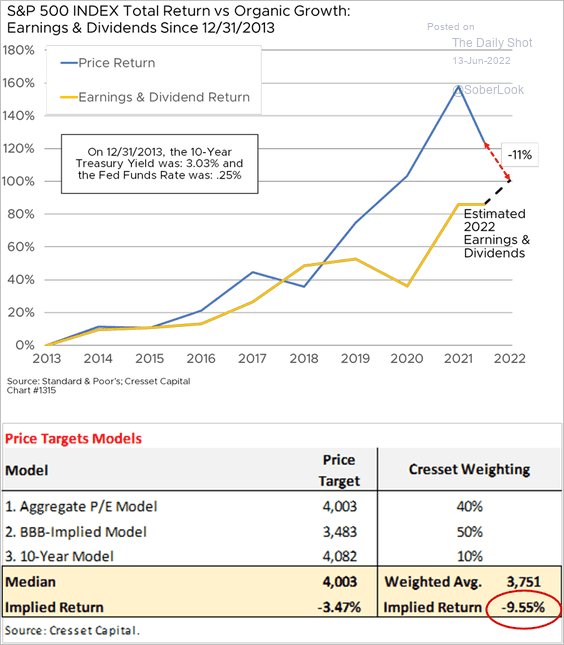 Source: Jack Ablin, Cresset Wealth Advisors
4. The S&P 500 forward P/E is nearing 16x as traders lose confidence in earnings forecasts (amind concerns about falling margins).
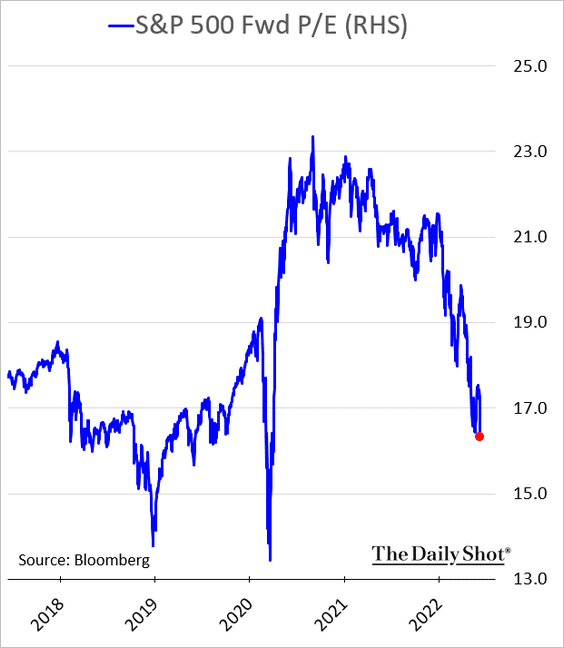
Here are the forward P/E ratios for the Nasdaq 100 …
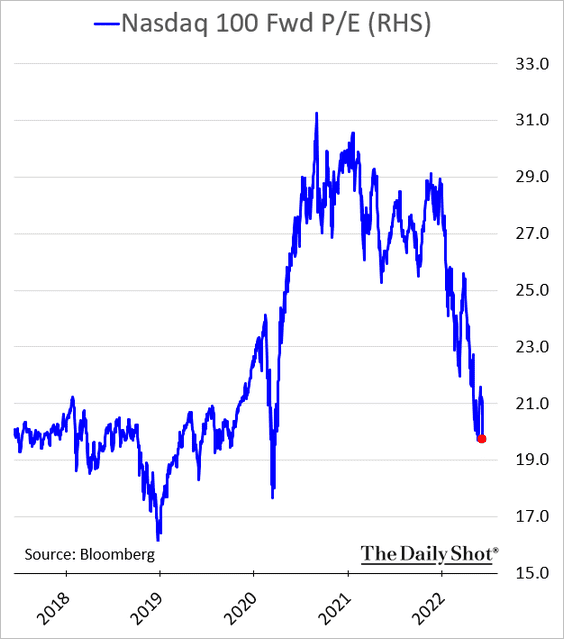
… and the Russell 2000 (2 charts).
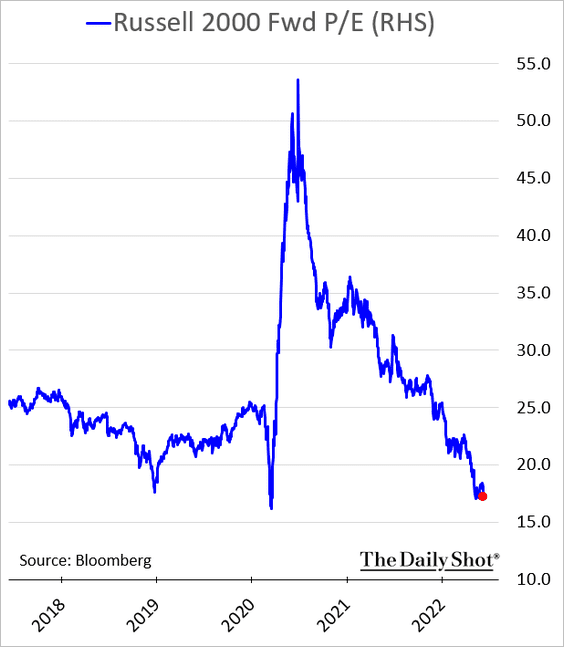
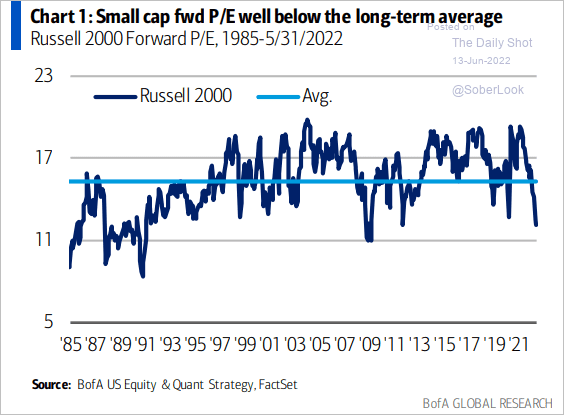 Source: BofA Global Research
——————–
5. Small-cap value stocks saw stronger outperformance vs. growth than large-cap value shares.
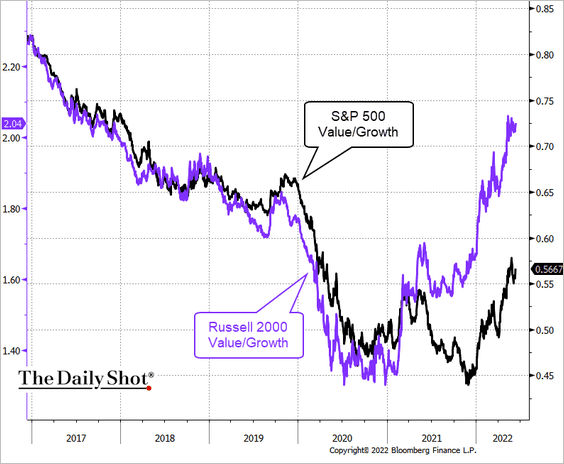 Source: @TheTerminal, Bloomberg Finance L.P.
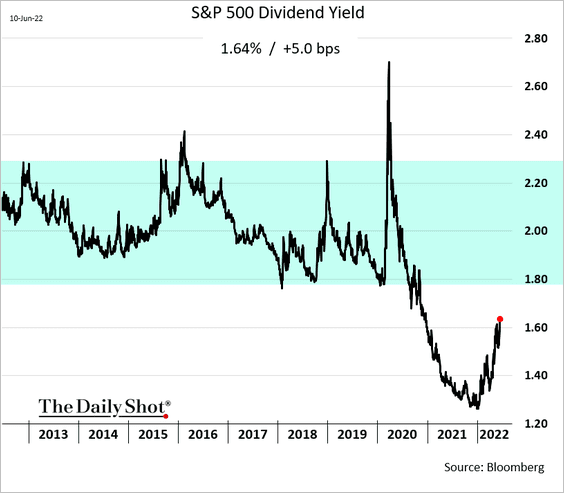
6. The S&P 500 dividend yield remains well below the pre-COVID range, even as Treasury yields surge.
7. The U Michigan survey tells us that US consumers are increasingly bearish, but their equity holdings remain elevated.
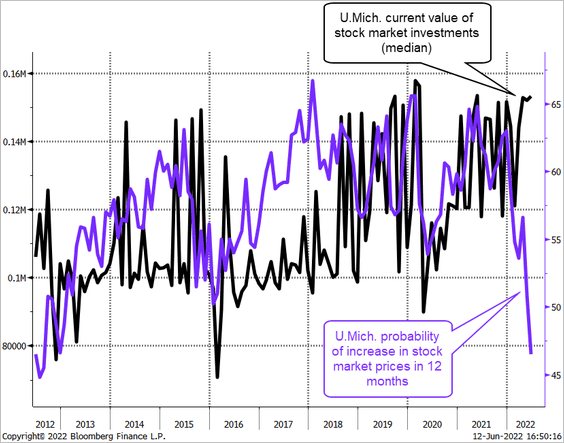 Source: @TheTerminal, Bloomberg Finance L.P.
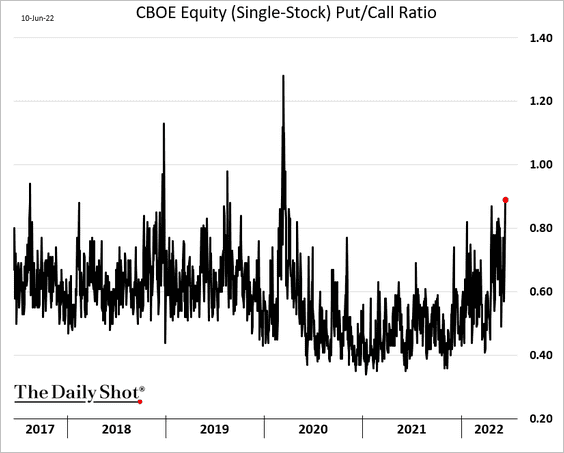
8. The put/call ratio is at the highest level since the COVID crash.
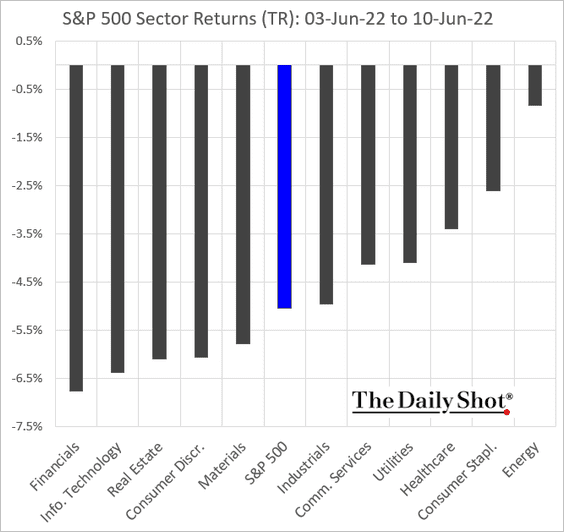
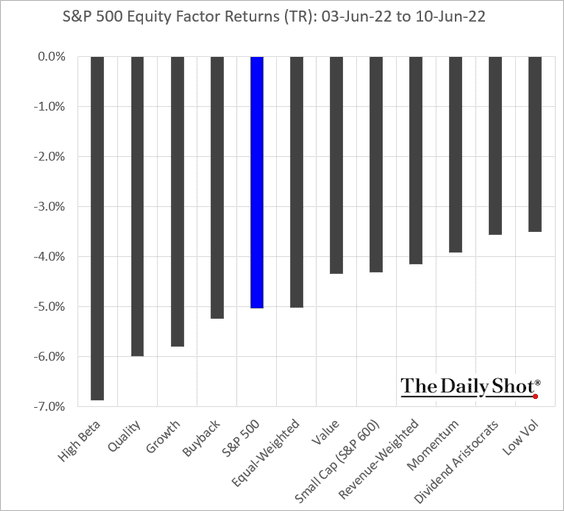
9. Finally, we have some performance data from last week.
• Sectors:
• Equity factors:
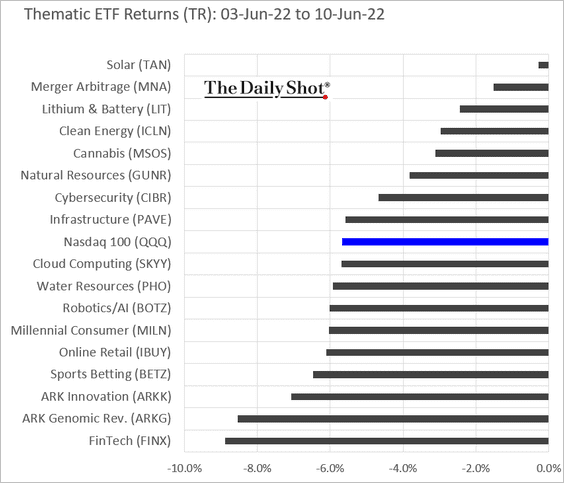
• Thematic ETFs:
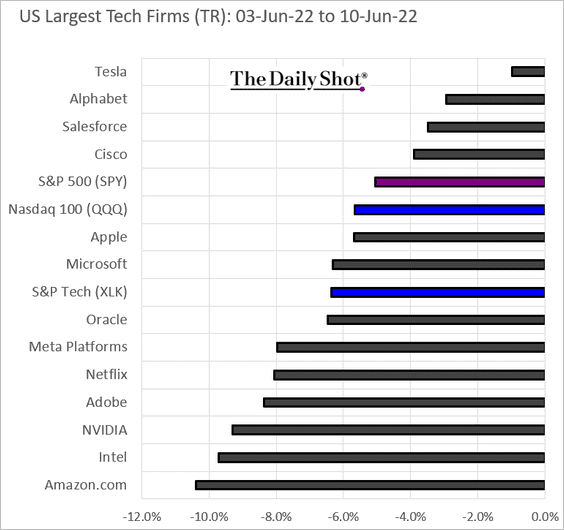
• Large US tech firms:
Back to Index
Credit
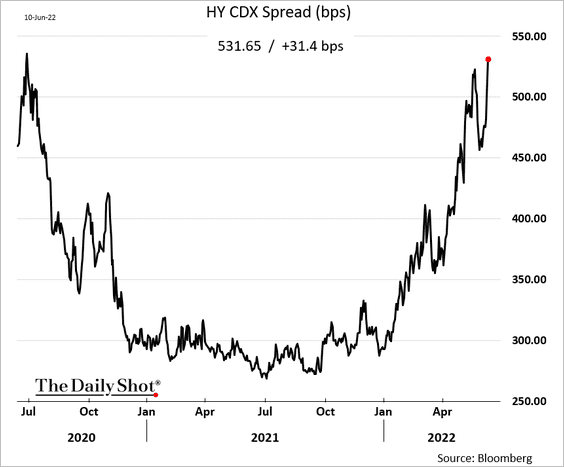
1. High-yield credit default swap spreads continue to widen as inflation surges.
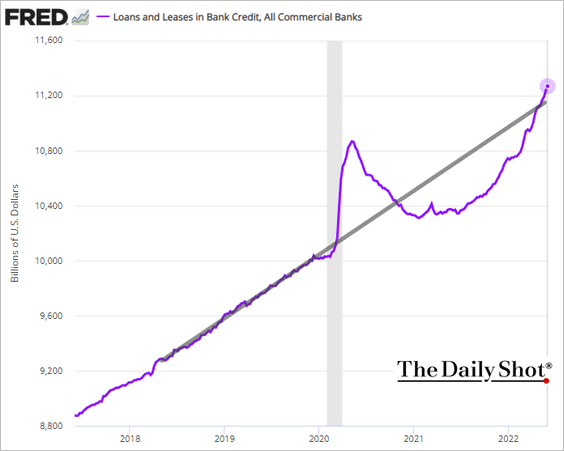
2. Corporate loan growth has picked up momentum.
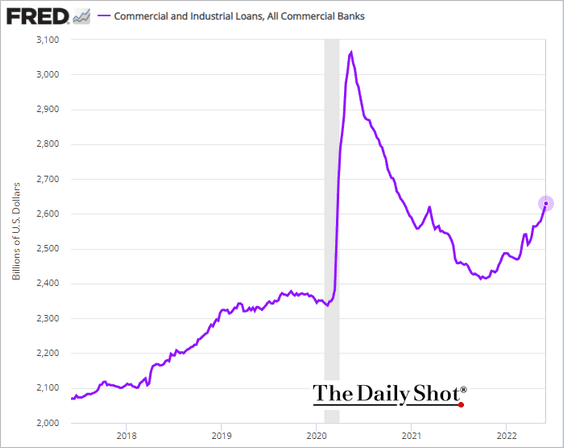
The total US loan balance is back above the pre-COVID trend, boosted by credit card debt.
——————–
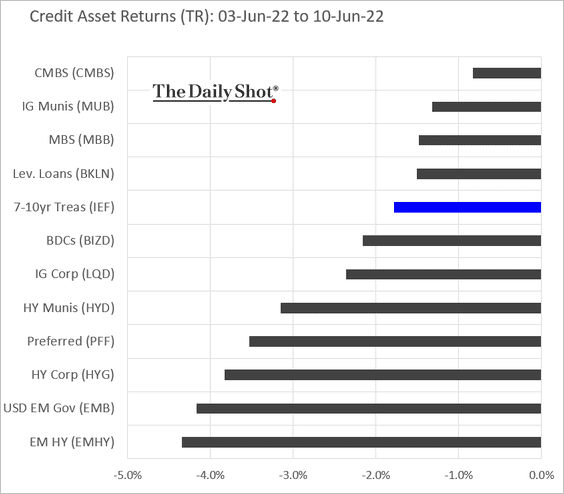
3. Here is last week’s performance by asset class.
Back to Index
Rates
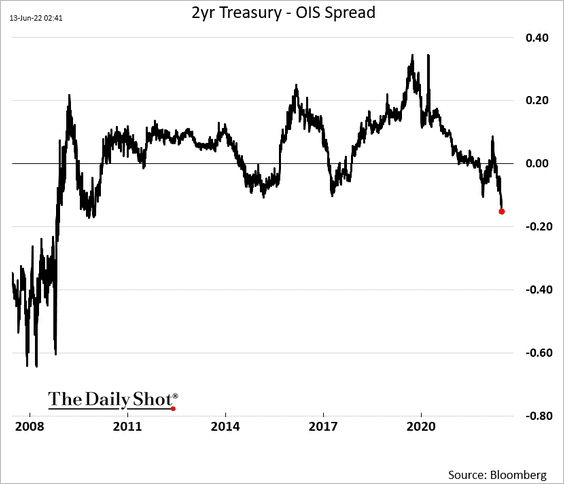
1. The 2-year Treasury – OIS spread continues to move deeper into negative territory amid robust demand (and limited supply) of short-term paper. Risk-averse investors are clamoring for cash-equivalent products.
2. Who owns Treasury securities?
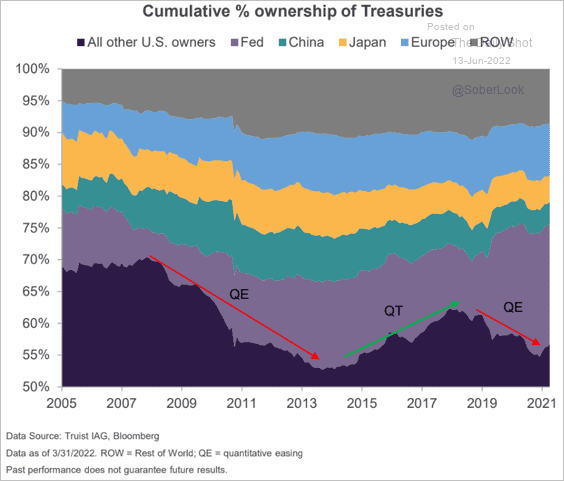 Source: Truist Advisory Services
Back to Index
Global Developments
1. The dollar appears to be overvalued, similar to what occurred in 1985 and 2001 when the USD’s path decoupled from rate differentials.
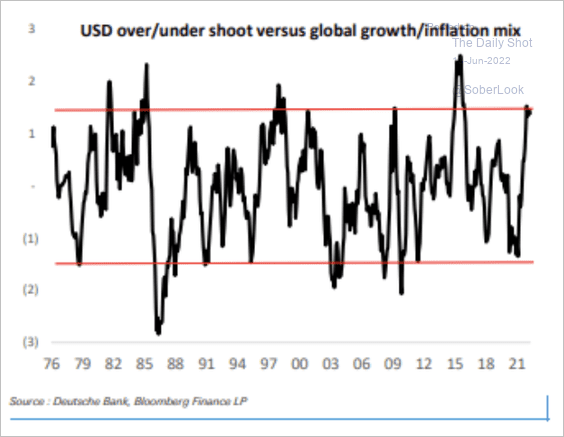 Source: Deutsche Bank Research
There has been an inverse correlation between the 60/40 equity/bond portfolio and the dollar this year. Is the greenback serving as a stagflation hedge?
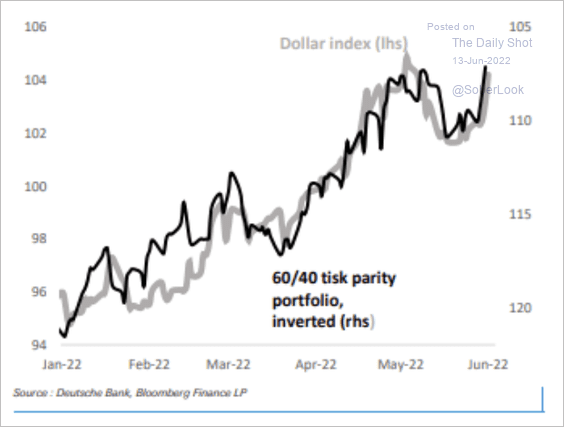 Source: Deutsche Bank Research
——————–
2. Danske Bank expects a continued slowdown in global manufacturing conditions.
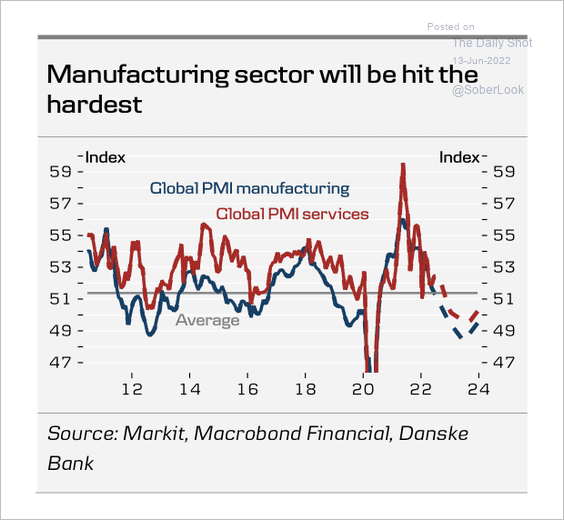 Source: Danske Bank
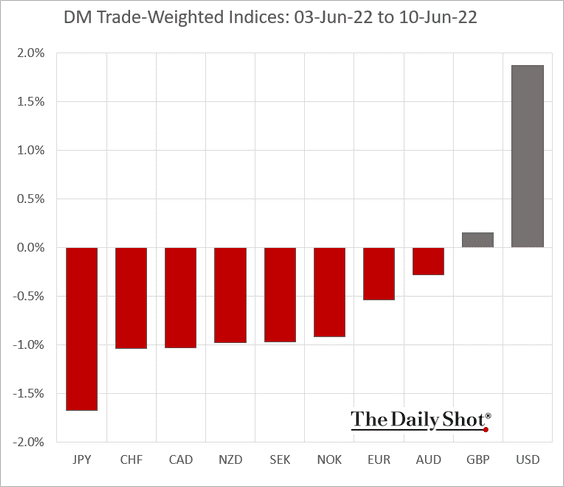
3. Next, we have some performance data from last week.
• Trade-weighted currency indices:
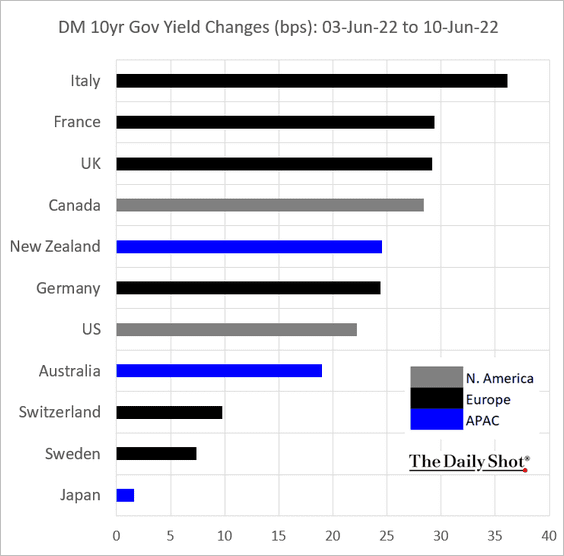
• Sovereign yields:
——————–
Food for Thought
1. Declining mobility in the US:
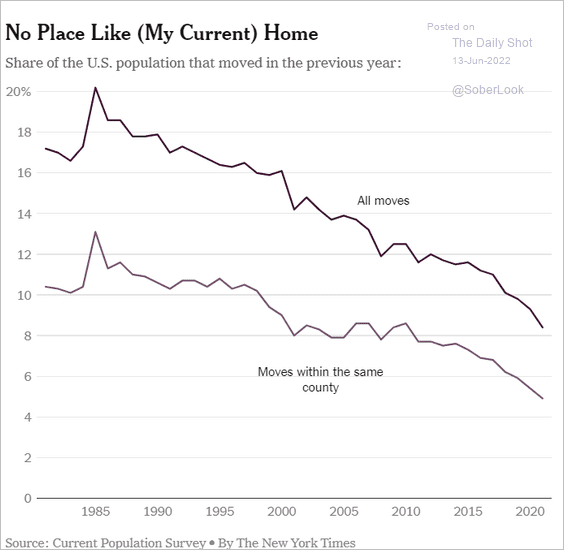 Source: @emilymbadger Read full article
2. US trading partners:
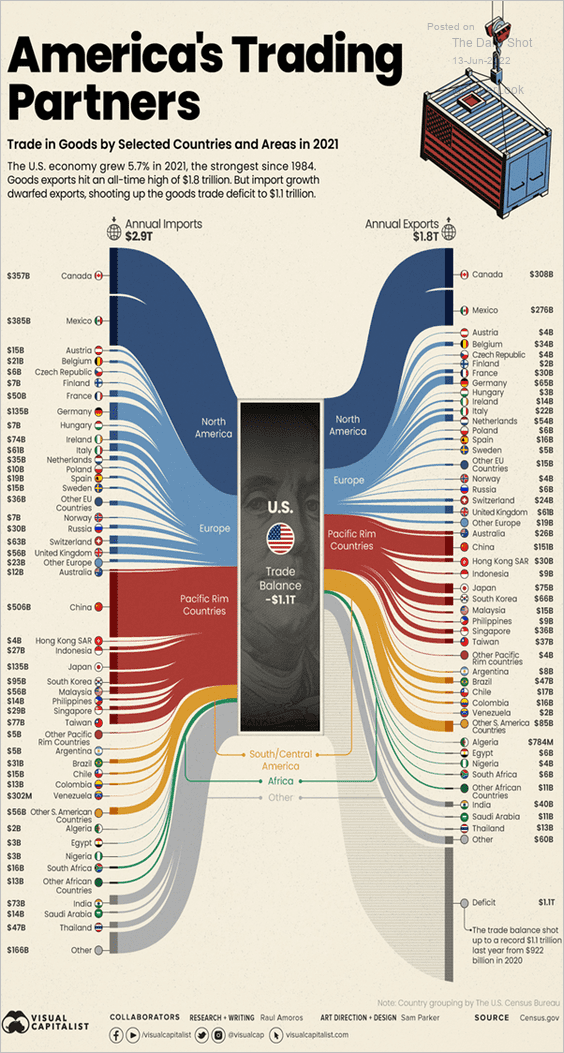 Source: Visual Capitalist Read full article
3. US office lease transactions:
![]() Source: @Mayhem4Markets
Source: @Mayhem4Markets
4. The impact of influencers:
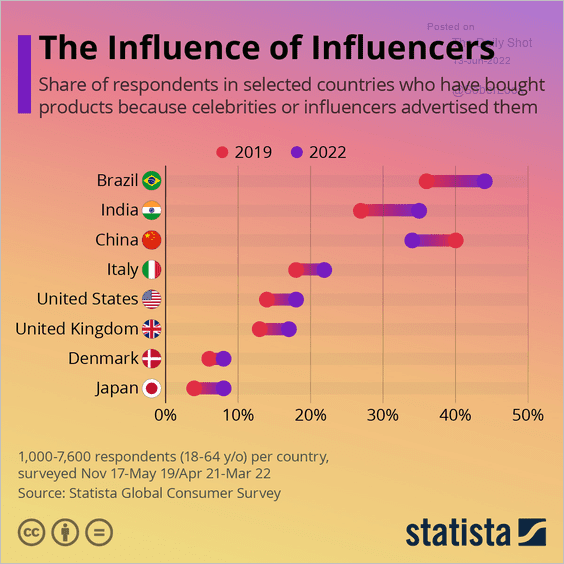 Source: Statista
5. Meta’s 1st-quarter results visualized:
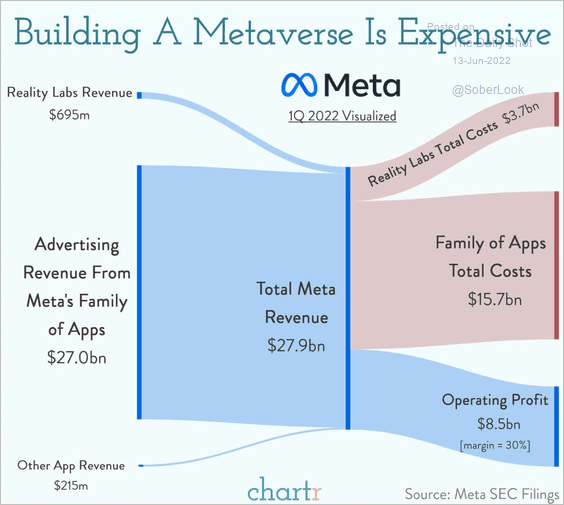 Source: @chartrdaily
6. Causes of death in US children and adolescents over time:
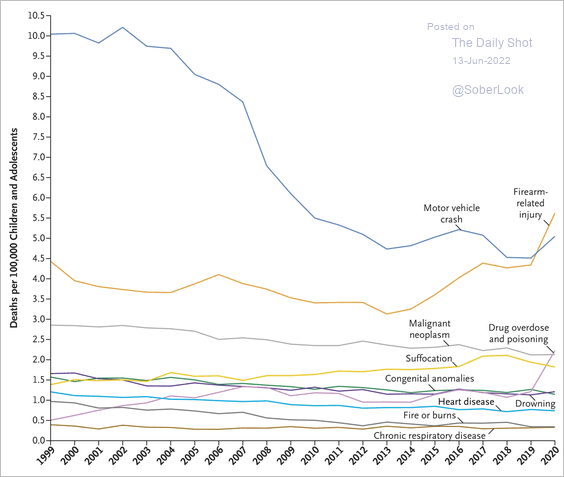 Source: The New England Journal of Medicine Read full article
7. Mexican restaurants per capita:
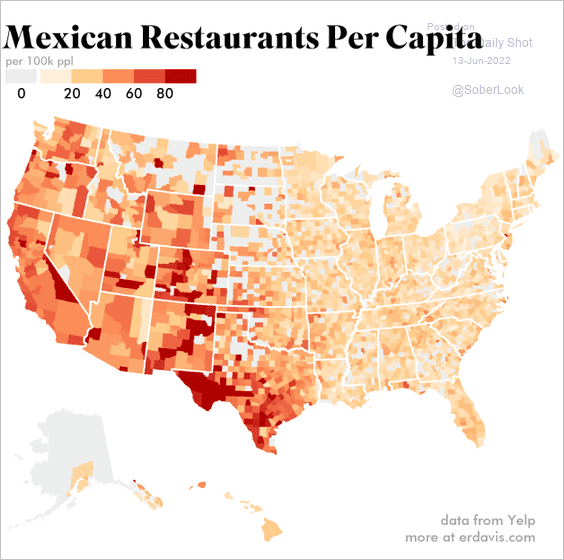 Source: @erindataviz
——————–
Back to Index