
The Daily Shot: 14-Jun-22
• The United States
• Canada
• The United Kingdom
• The Eurozone
• Europe
• Japan
• Australia
• China
• Emerging Markets
• Cryptocurrency
• Commodities
• Equities
• Credit
• Rates
• Food for Thought
The United States
1. The Treasury curve inverted as short-term yields continued to soar on Monday.
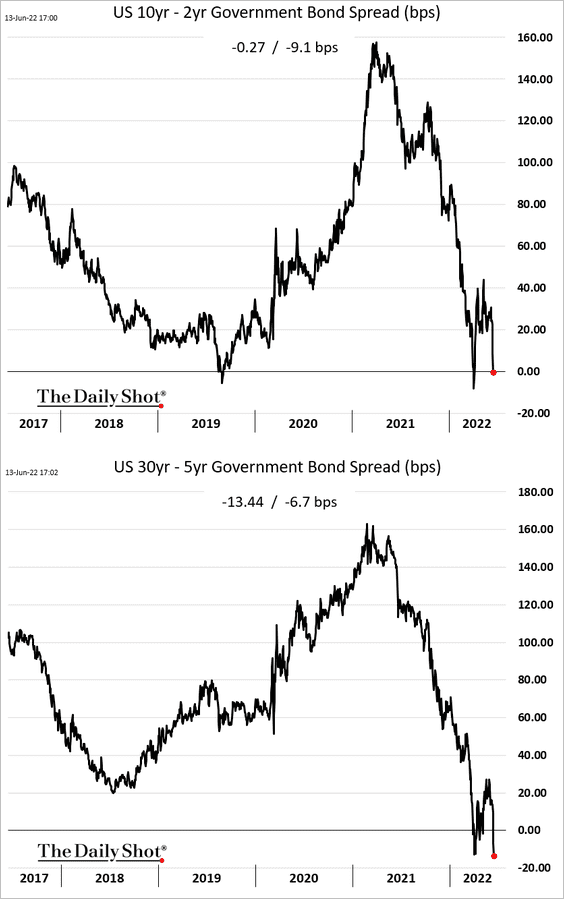
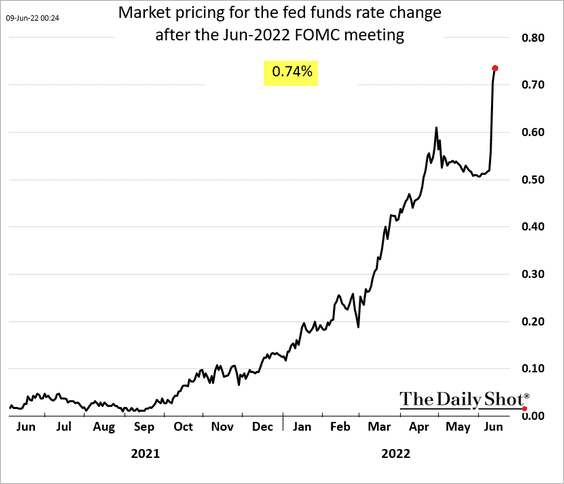
The market has massively repriced Fed rate hike probabilities amid concerns that inflation expectations are becoming unanchored. The probability of a 75 bps rate increase this week is suddenly almost a certainty, and the odds are high that we are going to see a jumbo hike in July as well.
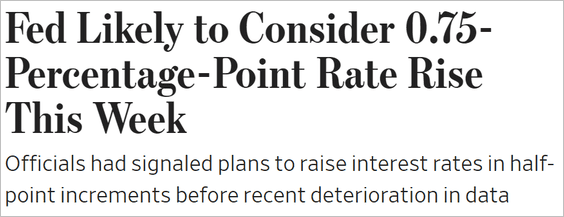 Source: @WSJ Read full article
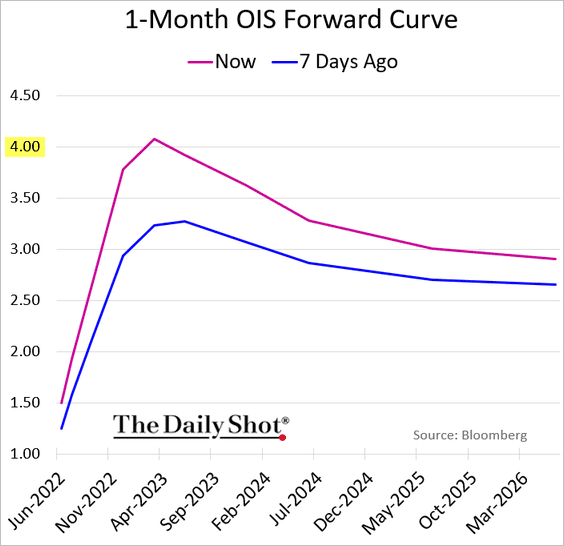
• The Fed is expected to push its policy rate above 3.6% by the end of the year, …
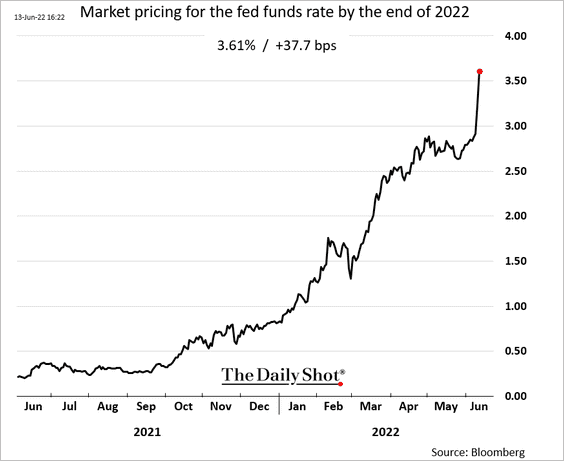
… taking it up above 4% next year.
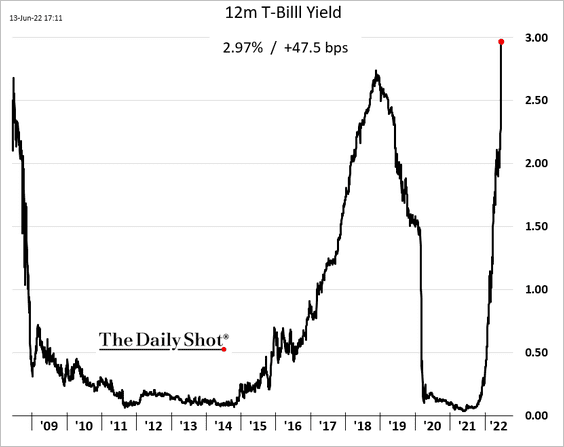
• The 2-year Treasury yield saw the largest increase in a long time, …
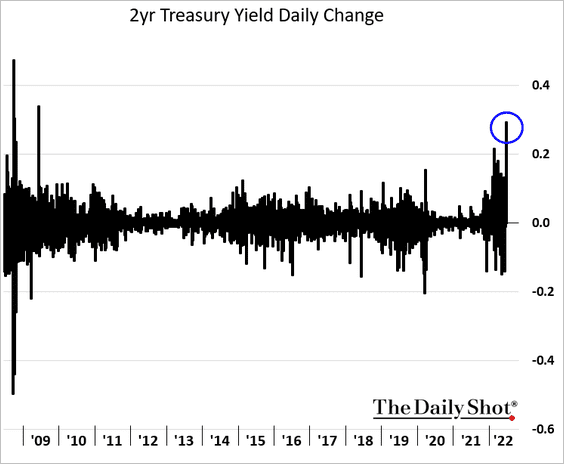
… while the one-year T-bill yield is approaching 3%.
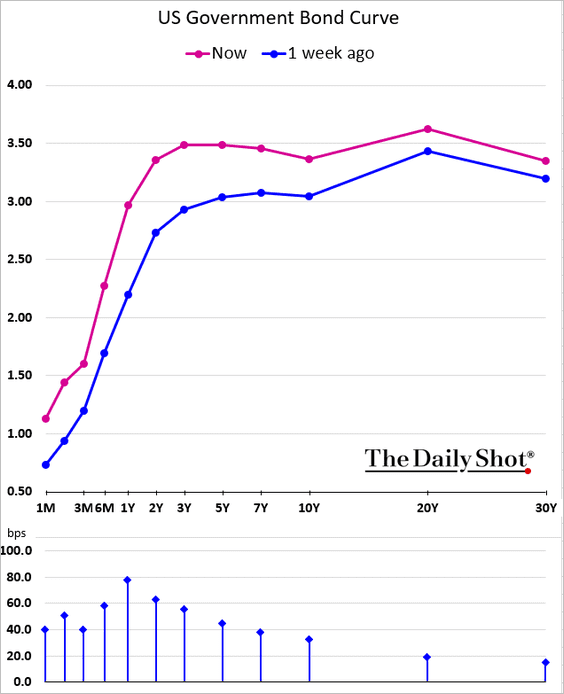
Here is the yield curve.
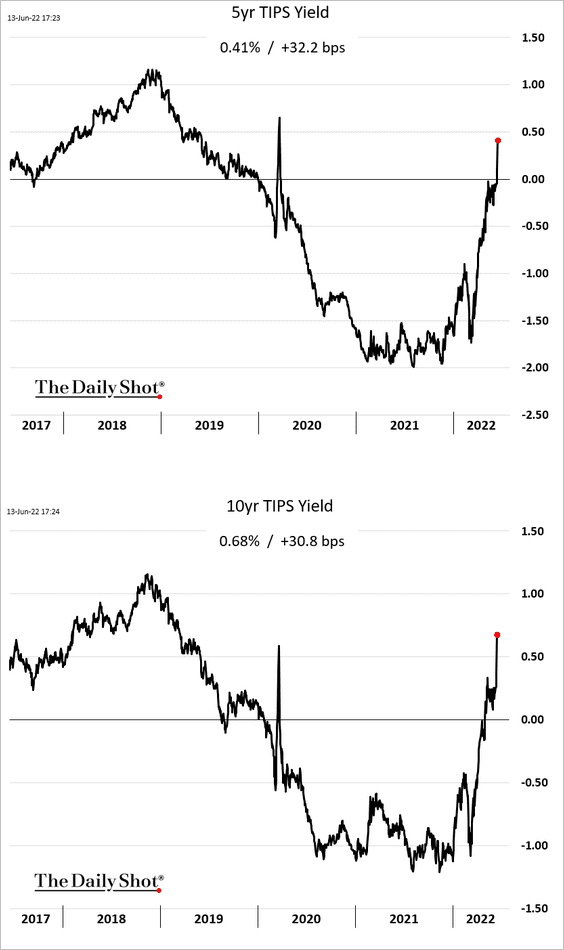
• Real yields continue to surge, which is a headwind for growth stocks.
——————–
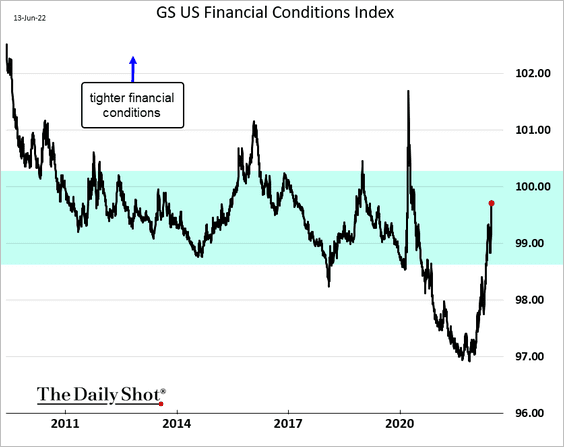
2. While financial conditions have tightened markedly, there is room to tighten further, according to Goldman’s index.
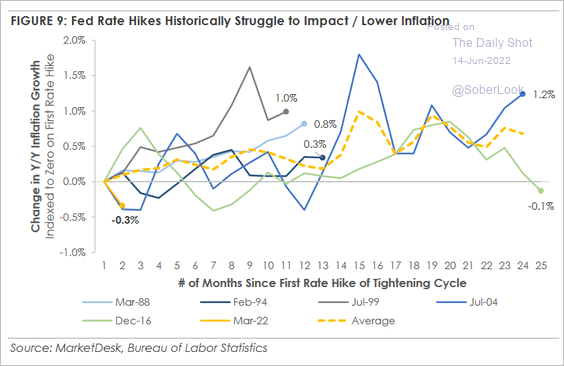
3. In the past cycles, US rate hikes were not very effective in curbing inflation (chart below). The situation is even more challenging in this cycle, with the US central bank having little control over supply issues, agricultural commodity disruptions, and global energy prices. The Fed can, however, put pressure on the labor market to curtail demand.
 Source: MarketDesk Research
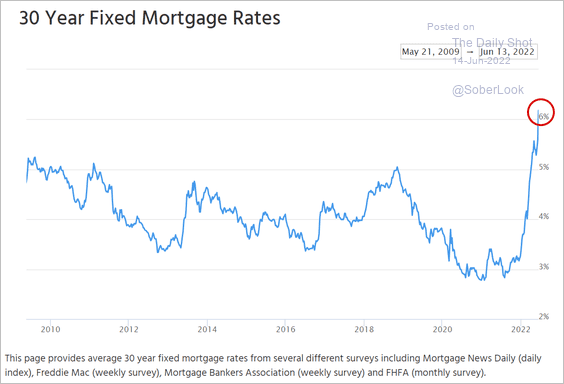
4. Mortgage rates are surging.
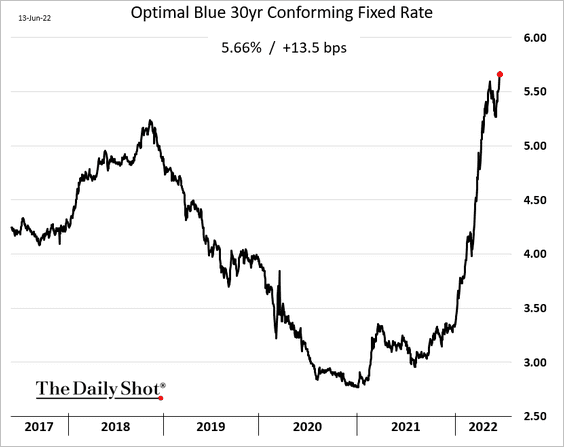
The Mortgage News Daily mortgage rate estimate is now above 6%.
 Source: Mortgage News Daily
——————–
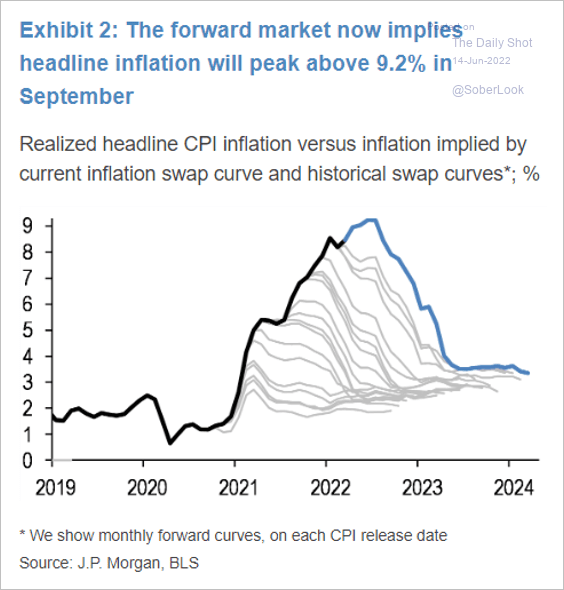
5. The inflation swaps market says that the CPI will peak above 9% in September.
 Source: JP Morgan Research; @tracyalloway
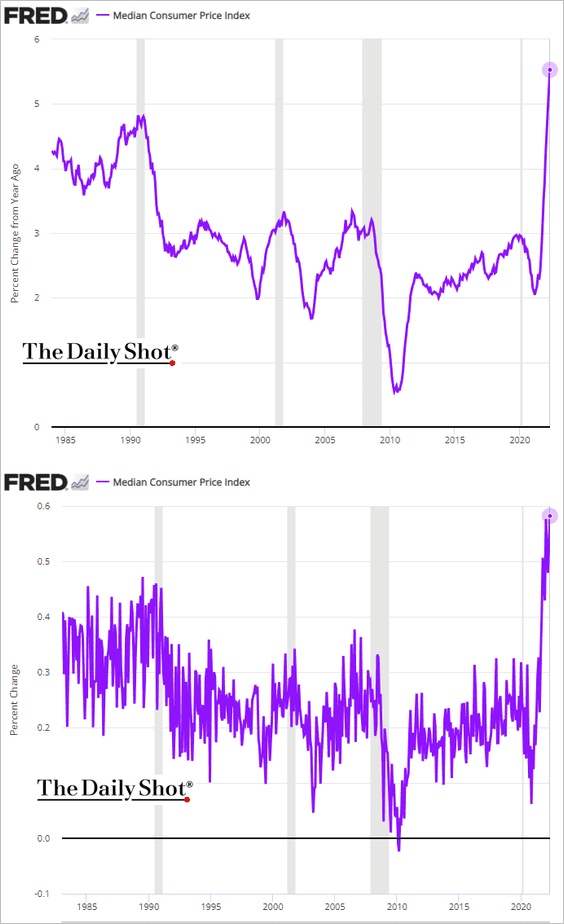
6. Here are some additional updates on the CPI report.
• Alternative core inflation measures:
– Median CPI (the second panel shows month-over-month changes):
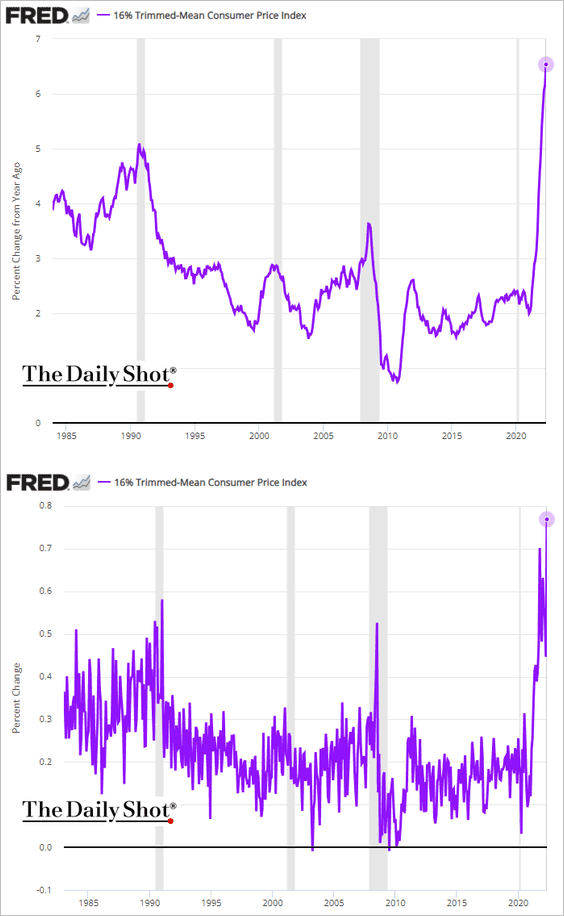
– Trimmed-mean CPI:
• The CPI index (price level) vs. the 2% target:
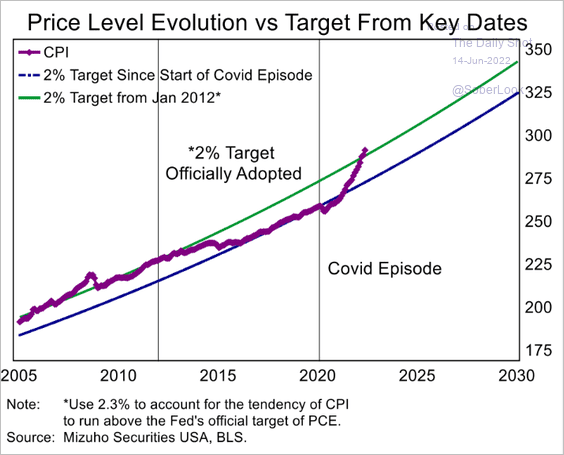 Source: Mizuho Securities USA
• The “consumer stress” components of the CPI:
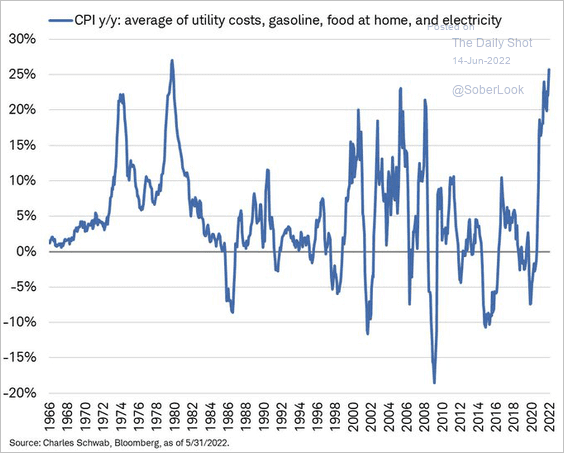 Source: @LizAnnSonders
• Services CPI with and without shelter:
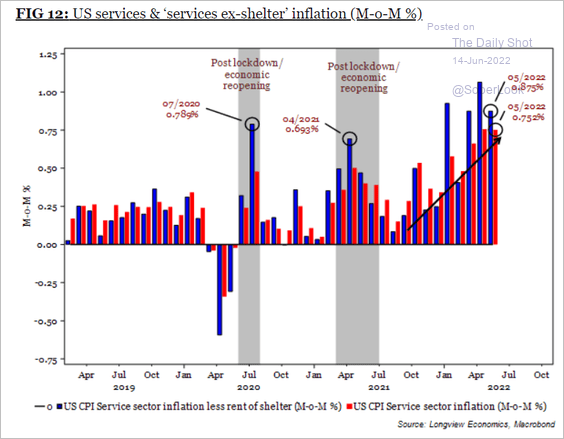 Source: Longview Economics
• Rent CPI by city size:
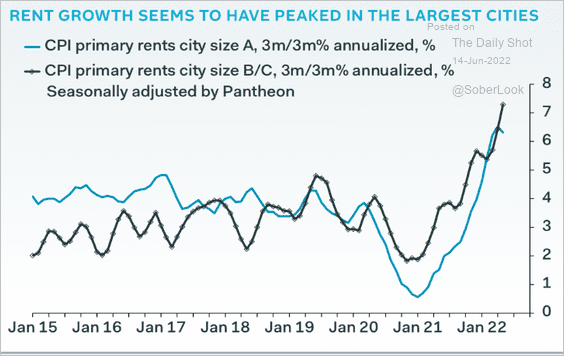 Source: Pantheon Macroeconomics
• The US CPI relative to the rest of the world:
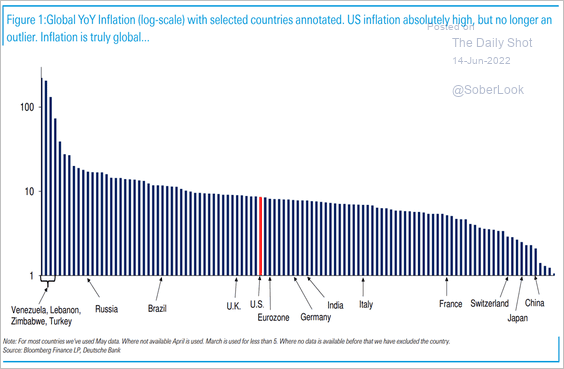 Source: Deutsche Bank Research
——————–
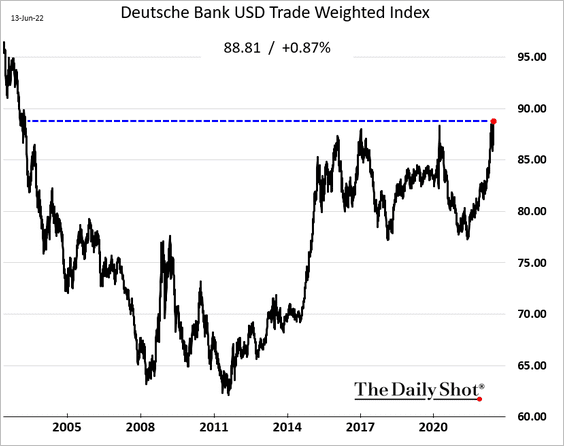
7. The trade-weighted US dollar index hit a multi-year high. This trend should help curb import price gains.
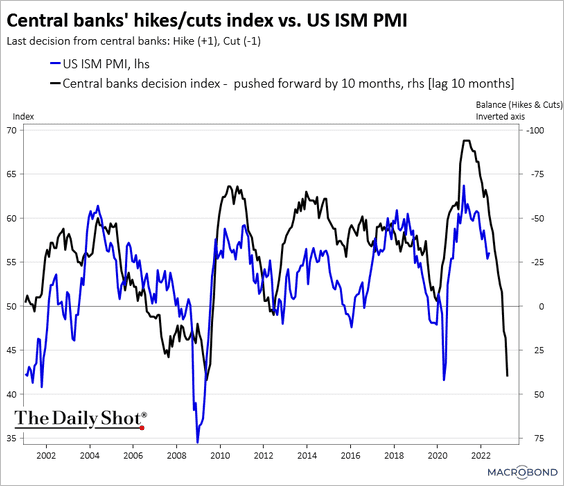
8. The global rate hike cycle points to an economic contraction in the US. Most forecasters don’t see a recession this year, but the situation looks more uncertain in 2023.
 Source: Chart and data provided by Macrobond
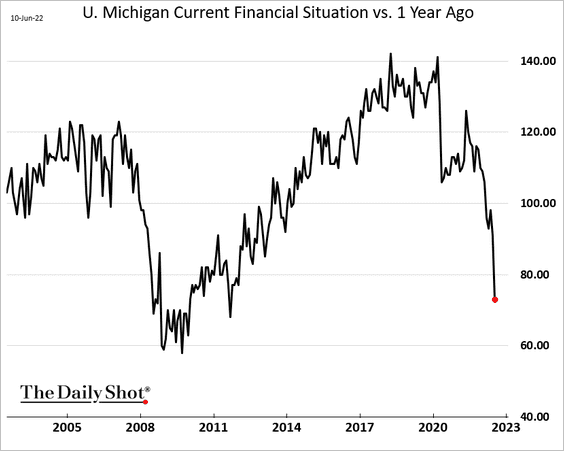
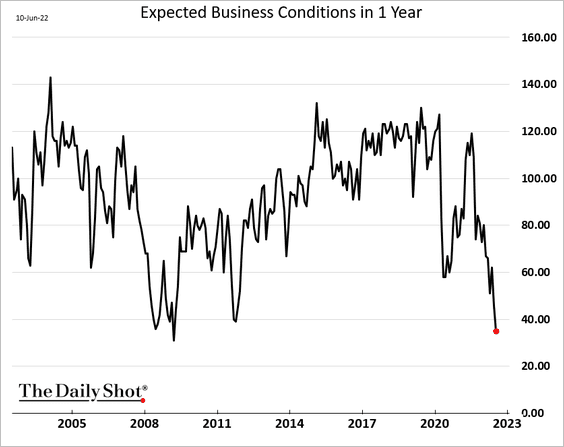
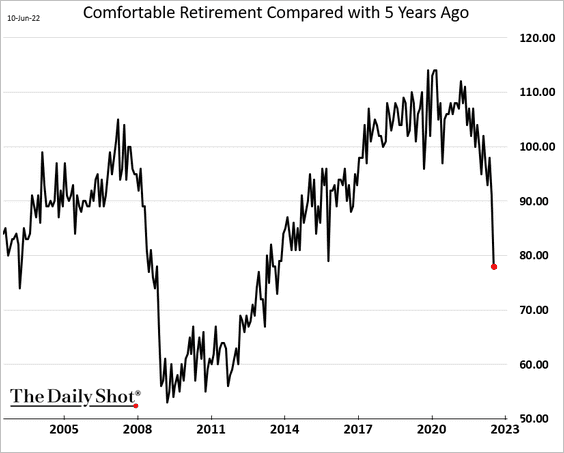
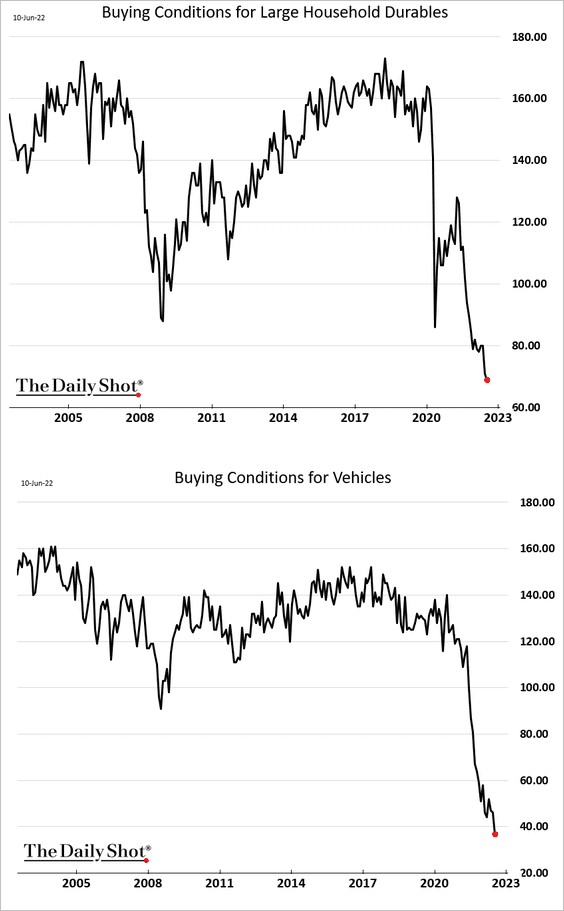
9. Next, we have some updates from the U. Michigan consumer sentiment report.
• Current financial situation:
• Expected business conditions:
• Confidence in “comfortable retirement”:
• Buying conditions:
By the way, we’ve had deteriorating sentiment for some time, but that hasn’t translated into a meaningful pullback in spending.
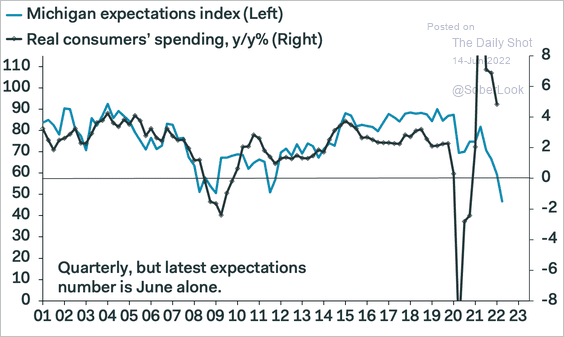 Source: Pantheon Macroeconomics
Back to Index
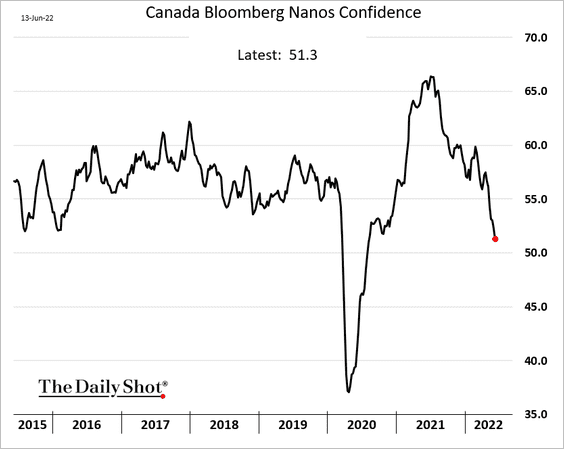
Canada
1. Consumer confidence continues to weaken.
2. Crude oil prices suggest that the loonie could go higher.
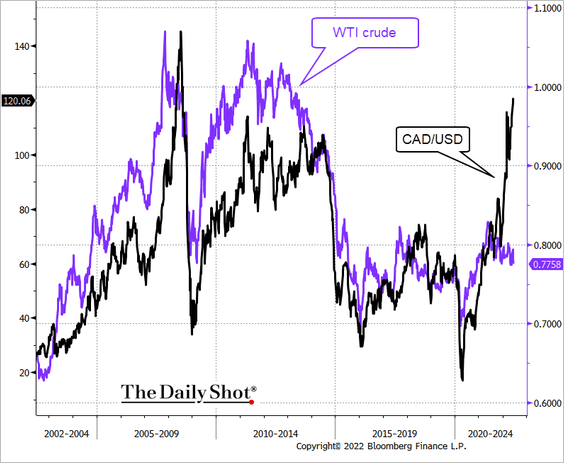 Source: @TheTerminal, Bloomberg Finance L.P.
Back to Index
The United Kingdom
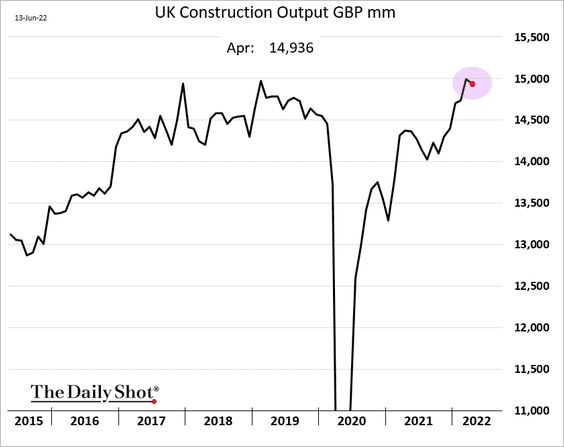
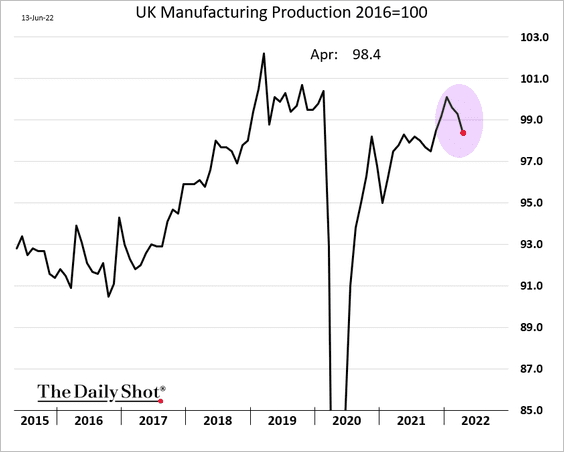
1. The GDP contracted for the second month in a row in April.
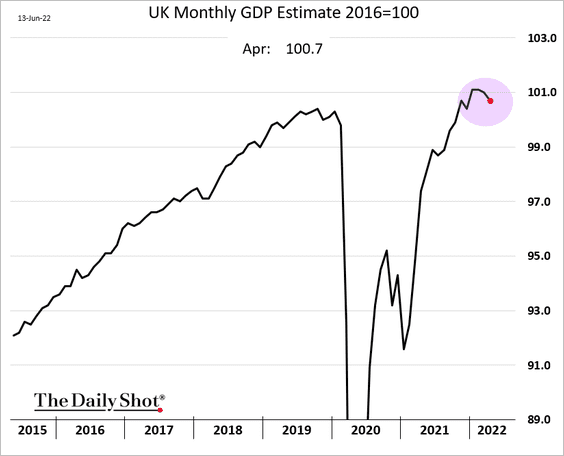
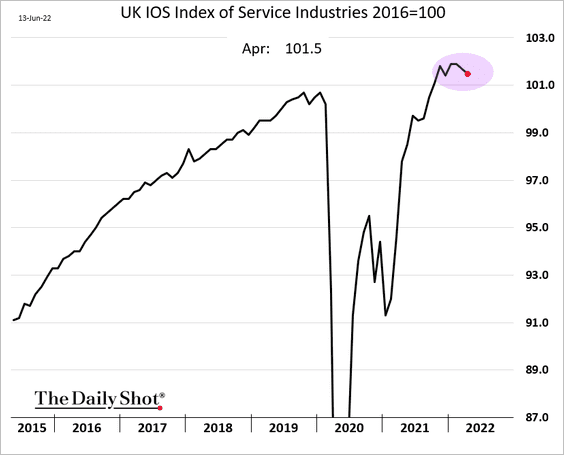
Business activity softened across the board.
• Services:
• Construction:
• Manufacturing:
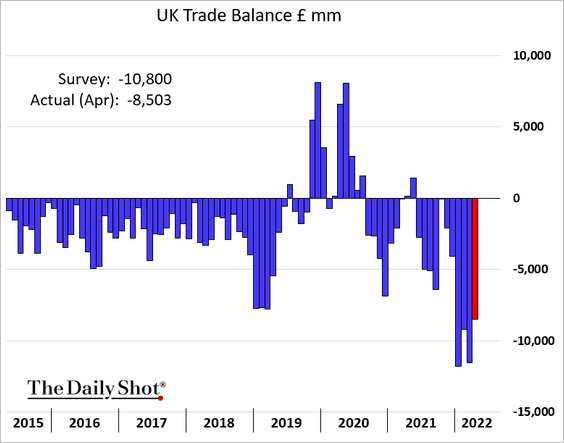
The trade deficit narrowed.
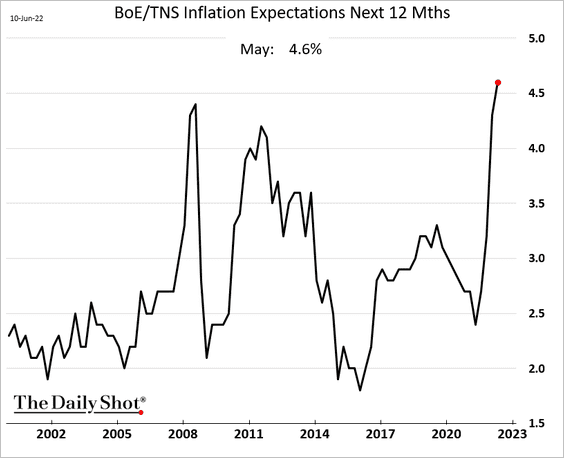
2. Inflation expectations continue to climb.
Back to Index
The Eurozone
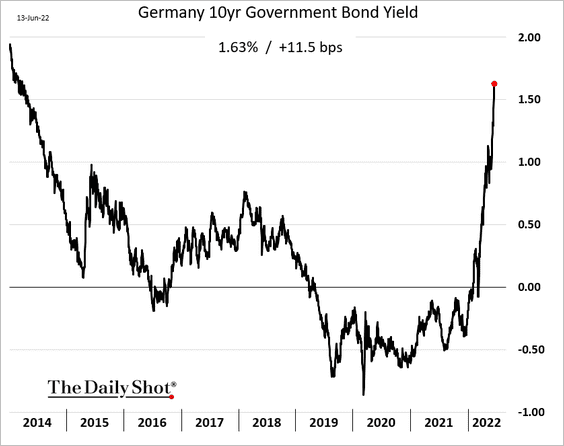
1. Yields surged further on Monday, especially at the shorter end of the curve.
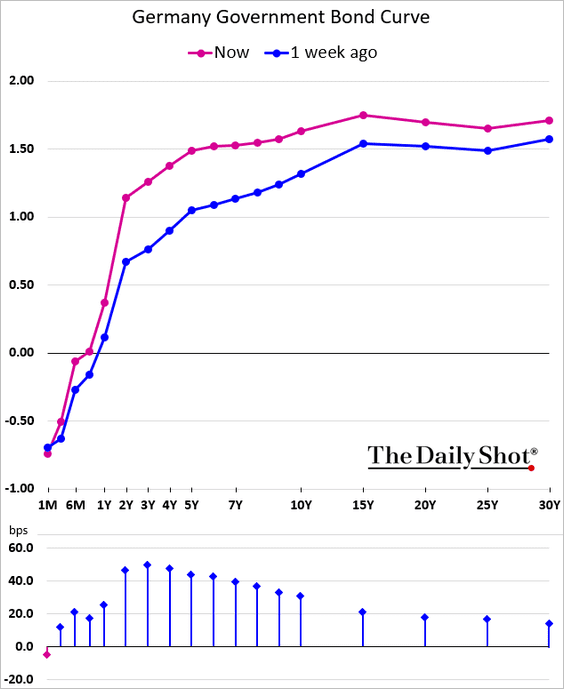
Here are the yield changes in standard deviations.
 Source: @fwred
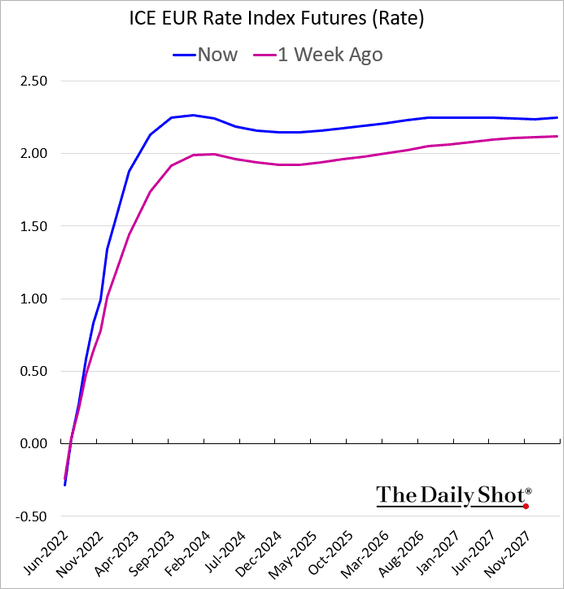
2. The ECB is now expected to hike rates above 1.6% by the end of this year, …
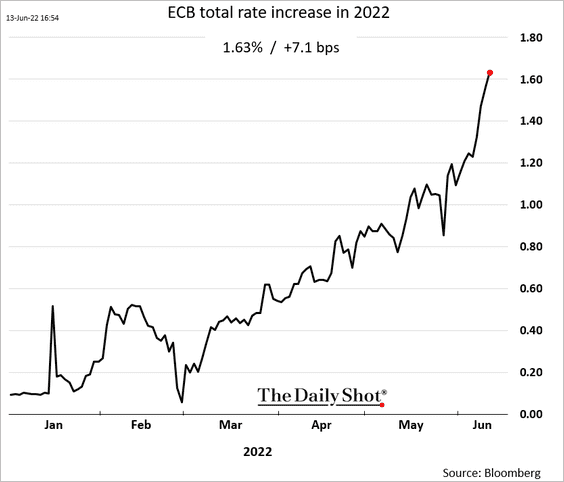
… reaching the terminal rate of 2.3% in 2023.
Back to Index
Europe
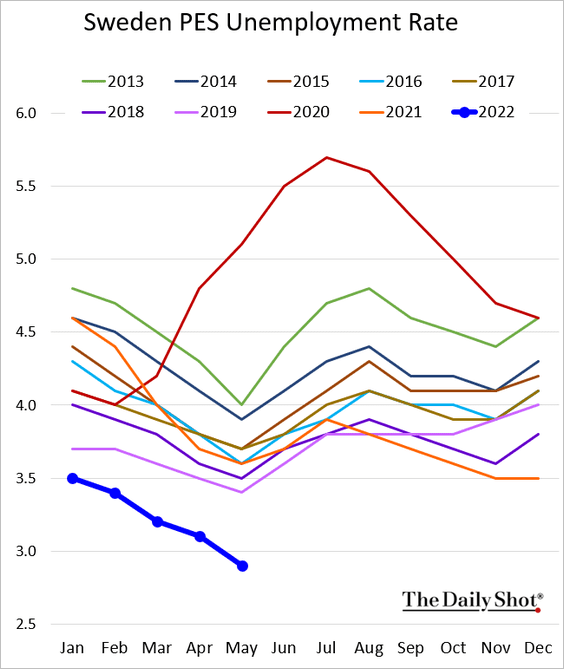
1. Sweden’s unemployment rate dipped below 3%.
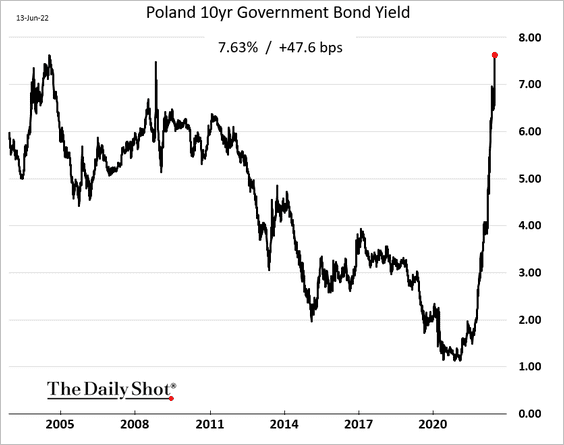
2. Here is Poland’s 10yr bond yield.
3. The gap between bond yields and bank shares’ relative performance continues to widen.
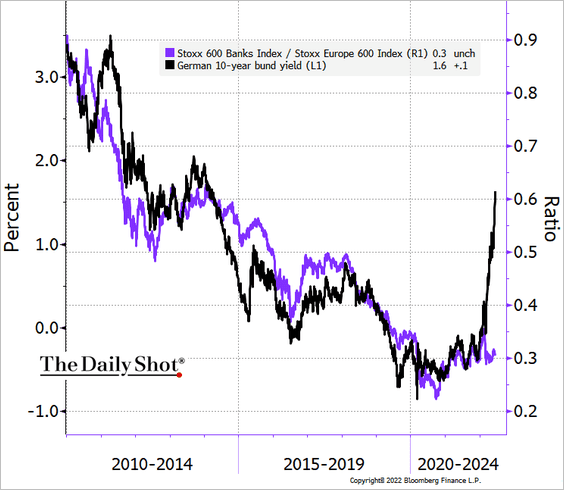 Source: @TheTerminal, Bloomberg Finance L.P.
4. Was admitting Hungary to the EU a mistake?
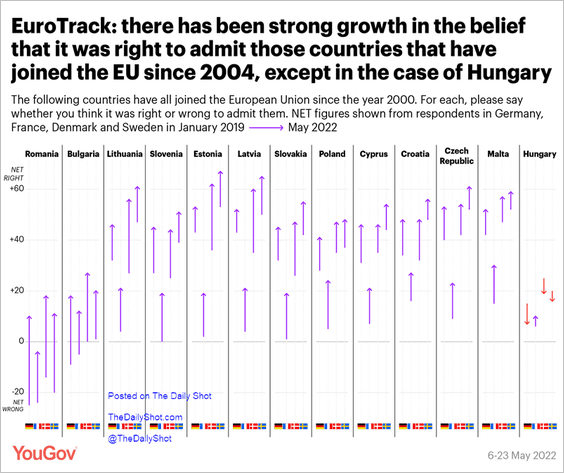 Source: @YouGov Read full article
Back to Index
Japan
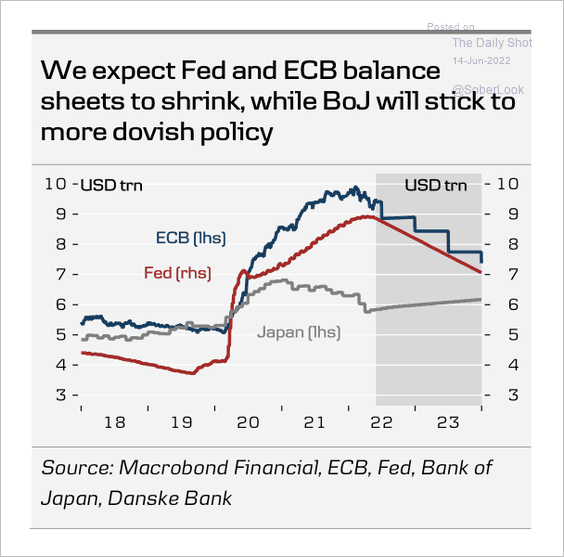
1. The BoJ bought more government bonds on Monday to defend its yield curve control target. Deutsche Bank expects additional purchases.
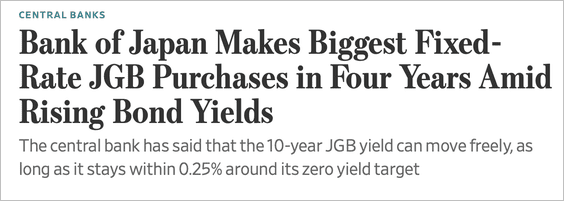 Source: @WSJ Read full article
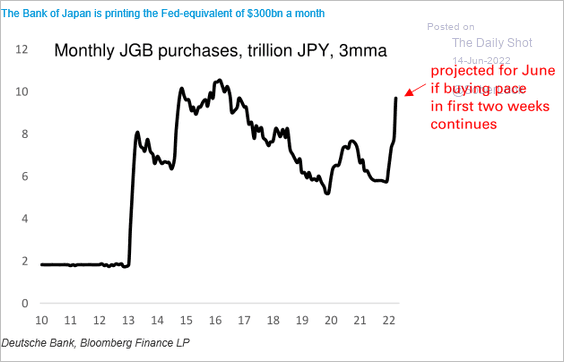 Source: Deutsche Bank Research
The BoJ may stick to a more dovish policy relative to the US and Europe, according to Danske Bank.
 Source: Danske Bank
——————–
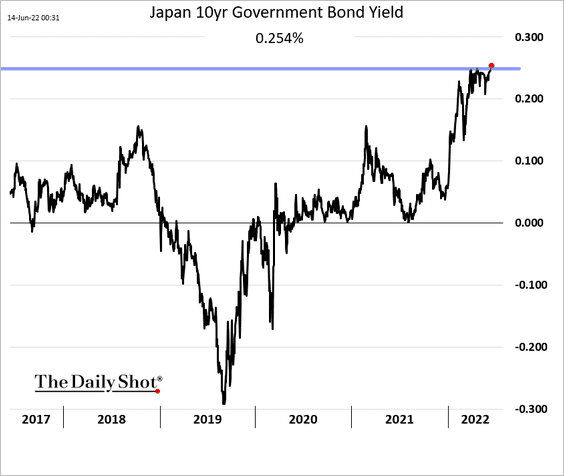
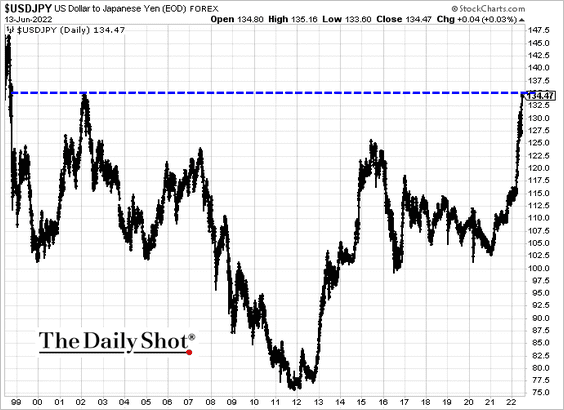
2. Dollar-yen is testing a long-term resistance.
Back to Index
Australia
1. The 2yr yield is above 3%.

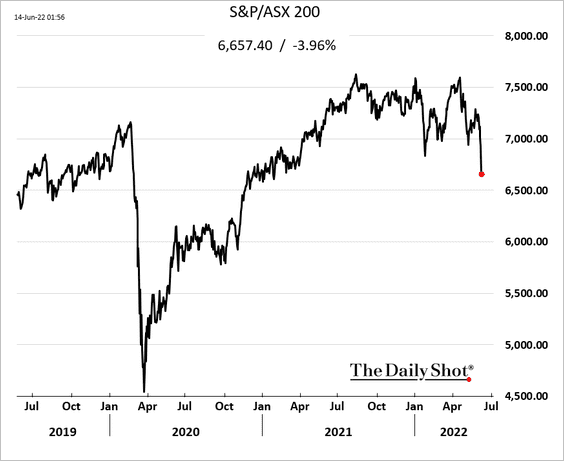
Stocks are sharply lower.
——————–
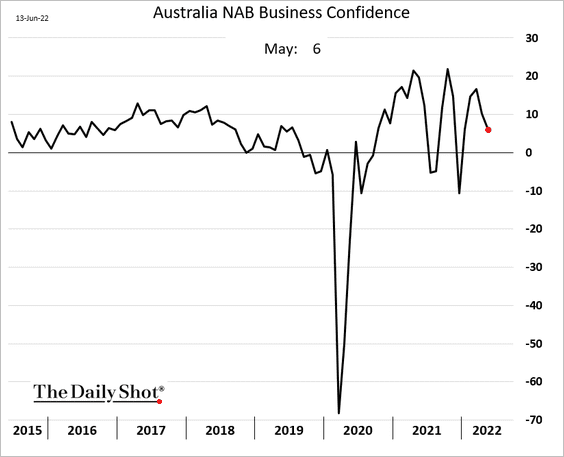
2. Business confidence eased again in May.
3. Stronger wage growth ahead?
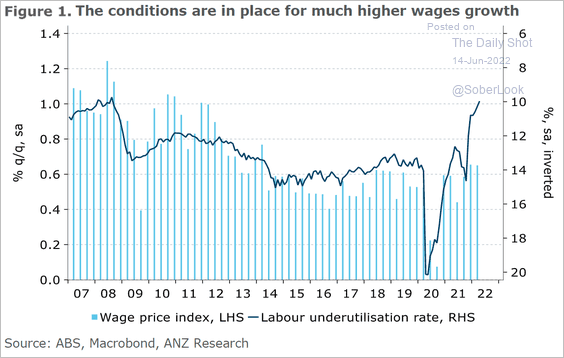 Source: @ANZ_Research
Back to Index
China
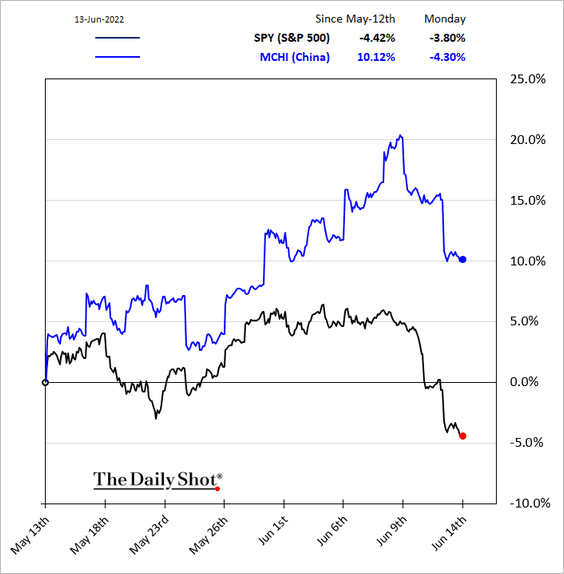
1. China’s large-cap stocks have been outperforming the S&P 500 in dollar terms.
2. Property transactions remain depressed.
![]() Source: BofA Global Research; @SofiaHCBBG
Source: BofA Global Research; @SofiaHCBBG
3. Here are the funding sources for China’s infrastructure projects.
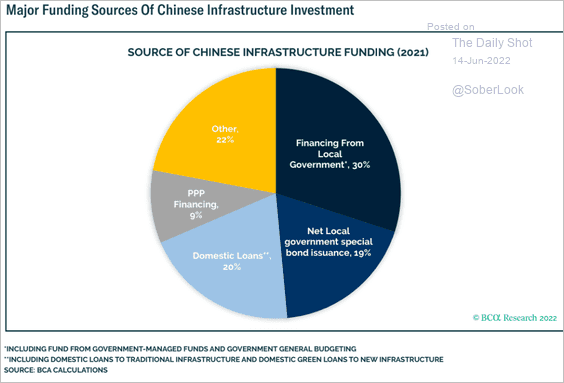 Source: BCA Research
4. China’s exporters will have a tough time boosting sales as global demand softens.
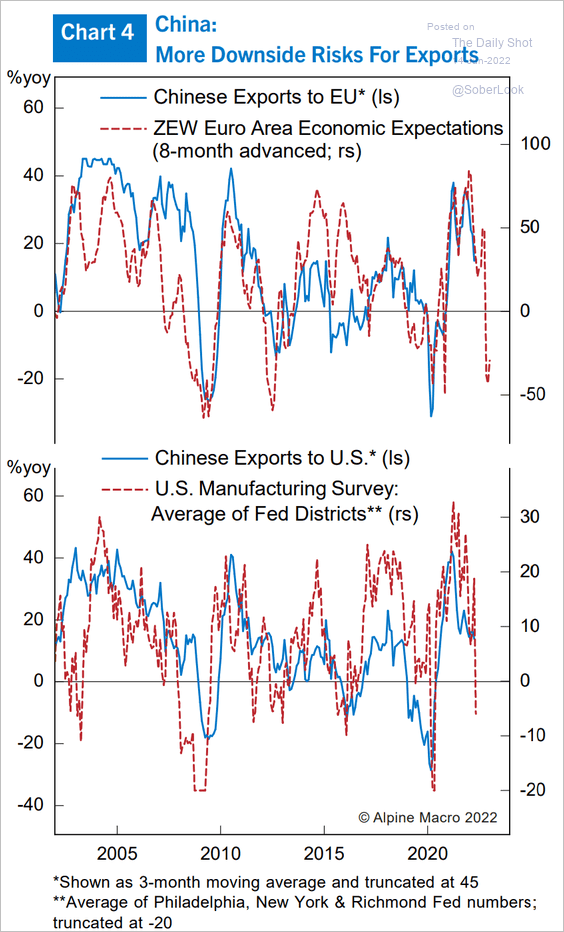 Source: Alpine Macro
Back to Index
Emerging Markets
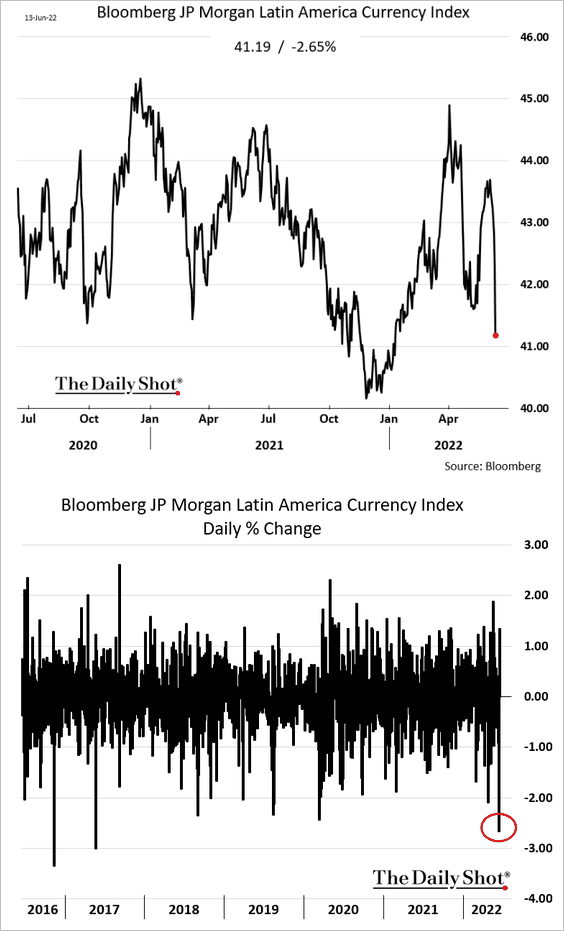
1. LatAm currencies took a hit on Monday.
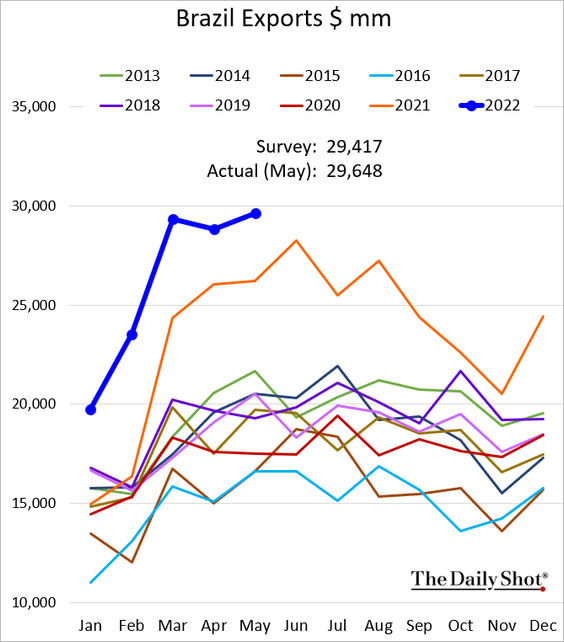
2. Brazilian exports are holding up well.
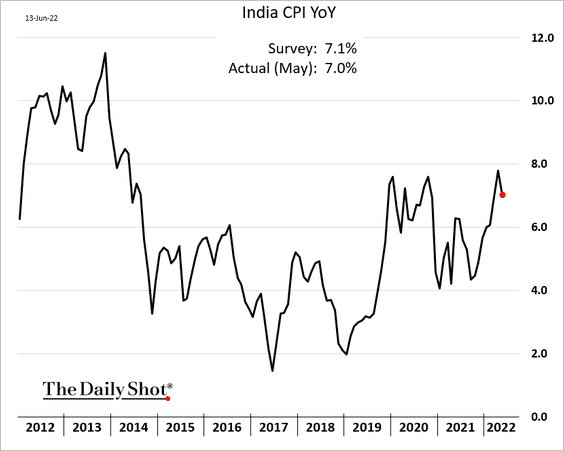
3. Indian CPI eased in May, due in part to government efforts to curtail food and fuel prices.
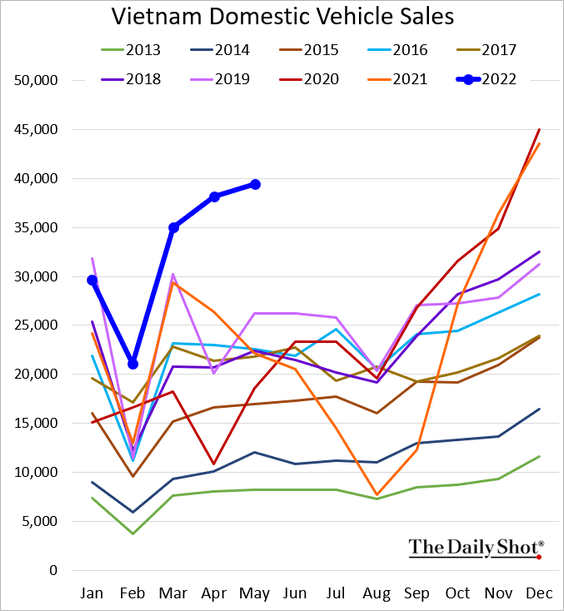
4. Vietnam’s domestic car sales have been very strong.
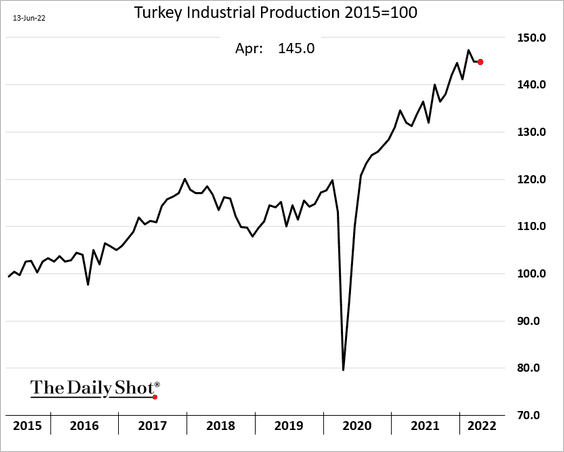
5. Turkey’s industrial production held flat in April.
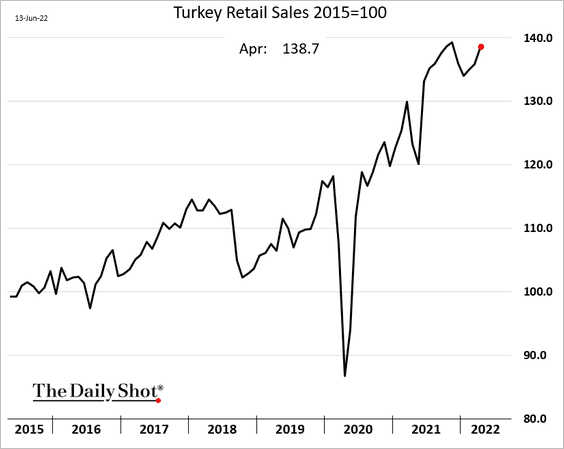
• Retail sales continue to climb.
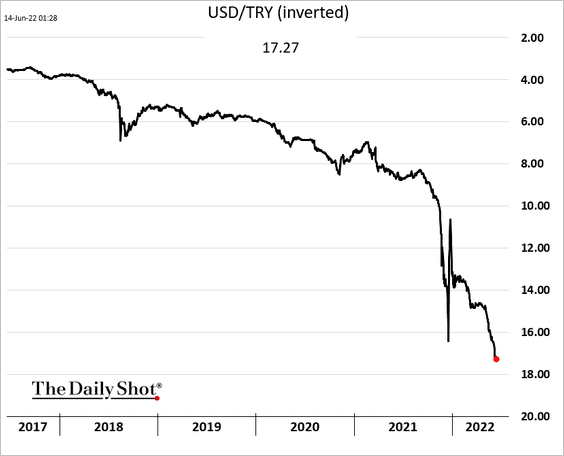
• The lira remains under pressure.
Back to Index
Cryptocurrency
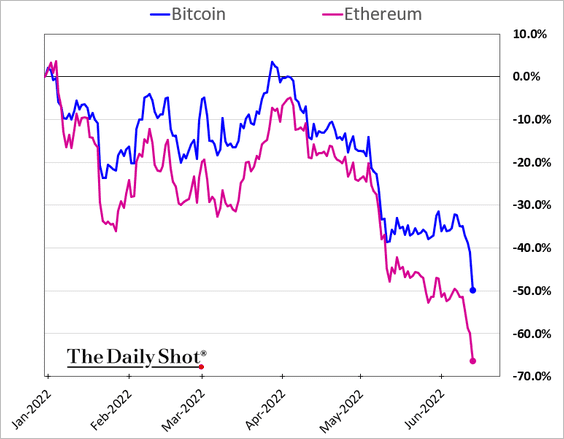
1. Bitcoin held support at $20k.
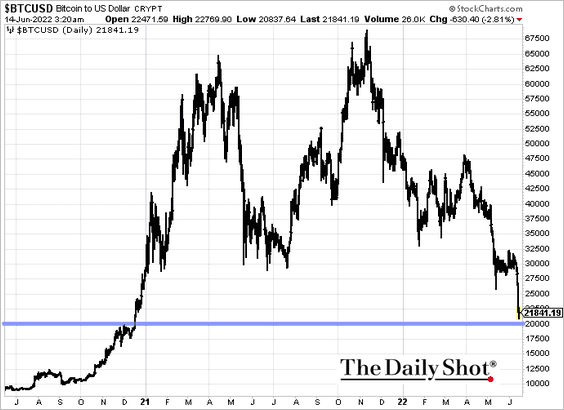
Bitcoin is down some 50% year-to-date, while ether is down over 65%.
——————–
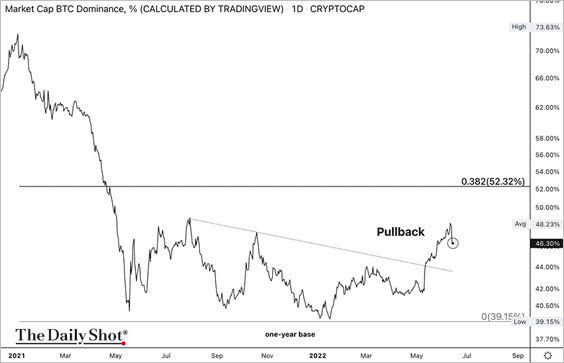
2. The bitcoin dominance ratio, or BTC’s market cap relative to the total crypto market cap dipped on Monday. That means bitcoin experienced greater selling pressure than altcoins during the latest sell-off, which is unusual during a risk-off episode.
Still, the dominance ratio remains in breakout mode since early May.
3. There was a significant spike in long BTC liquidations on Sunday.
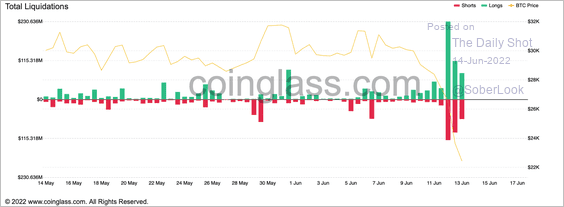 Source: Coinglass
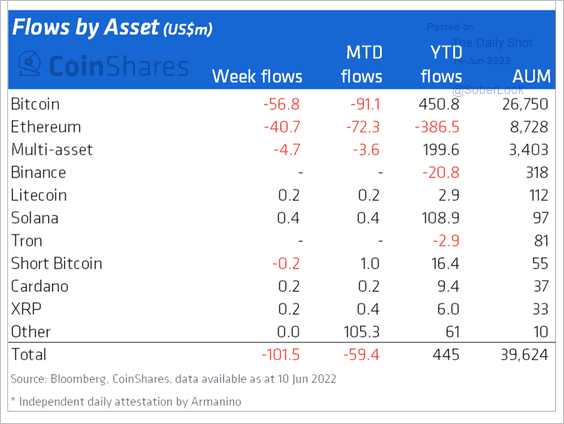
4. Crypto funds saw $102 million in outflows last week, driven by Bitcoin and Ethereum-focused products.
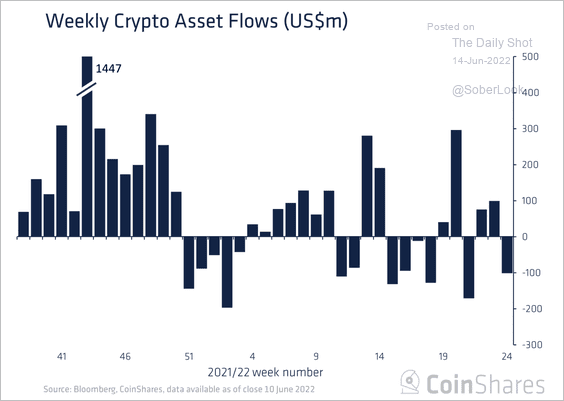 Source: CoinShares Read full article
 Source: CoinShares Read full article
Back to Index
Commodities
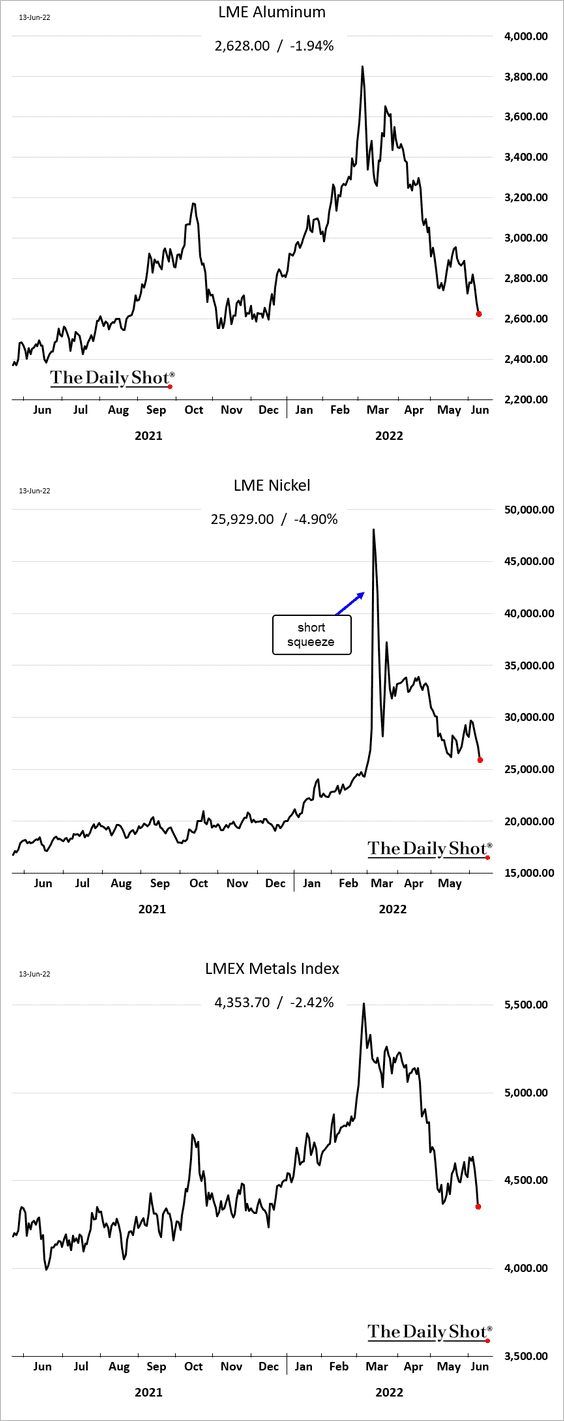
1. Industrial metals remain under pressure.
2. The US dollar’s strength poses a risk for commodities.
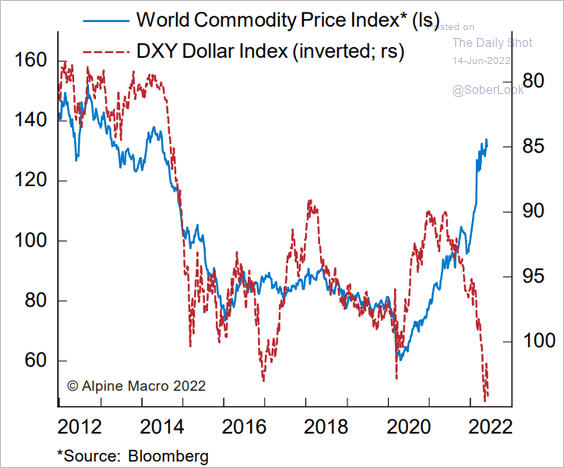 Source: Alpine Macro
Back to Index
Equities
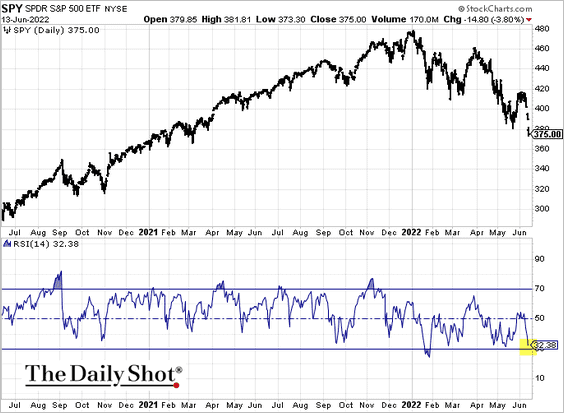
1. The COVID-era bull market is officially over.
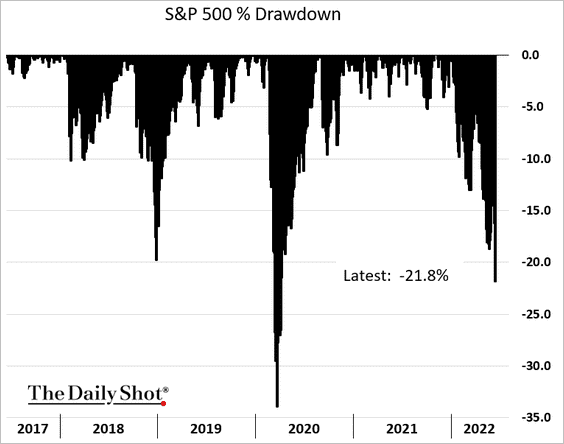
2. The S&P 500 is approaching oversold levels.
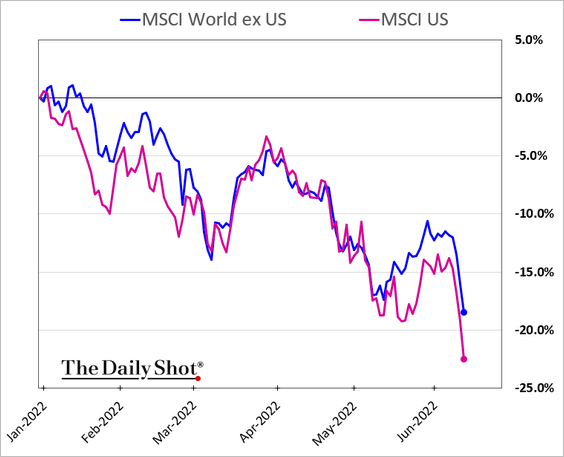
3. US shares have been underperforming the rest of the world recently.
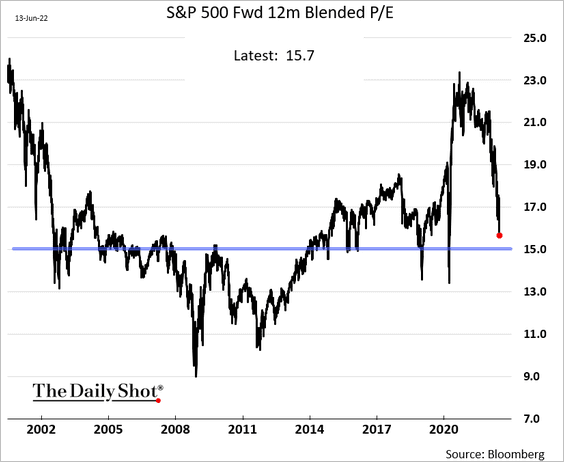
4. Is 15x the next stop for the S&P 500 P/E ratio. That’s down some 4.5% from here.
5. Share buyback activity is expected to slow.
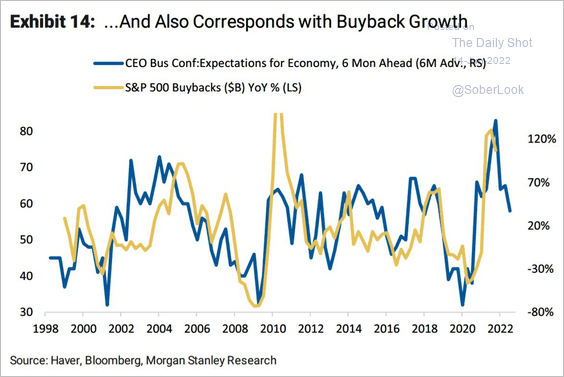 Source: Morgan Stanley Research; @WallStJesus
6. Corporate cash levels have declined sharply over the past couple of quarters.
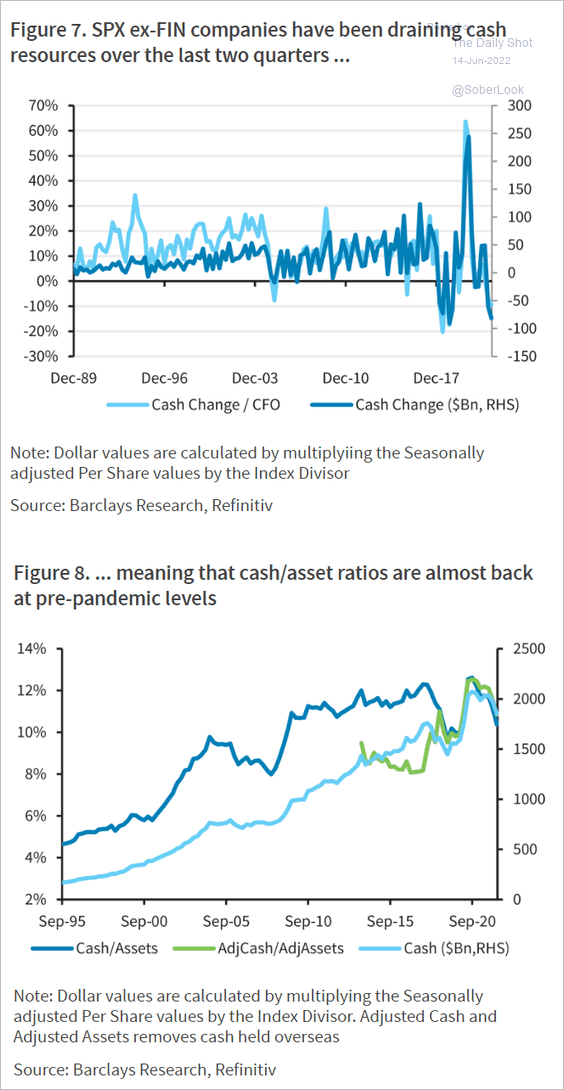 Source: Barclays Research
7. Will we see an earnings recession as the Fed continues to hike?
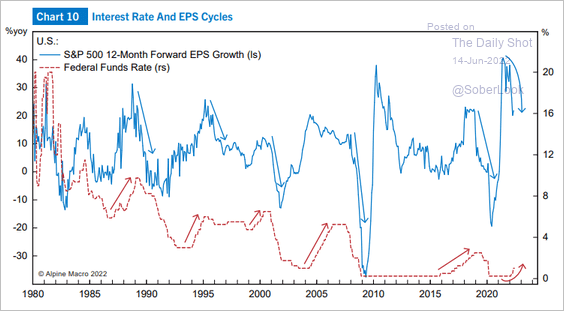 Source: Alpine Macro
Leading indicators suggest that it’s a possibility.
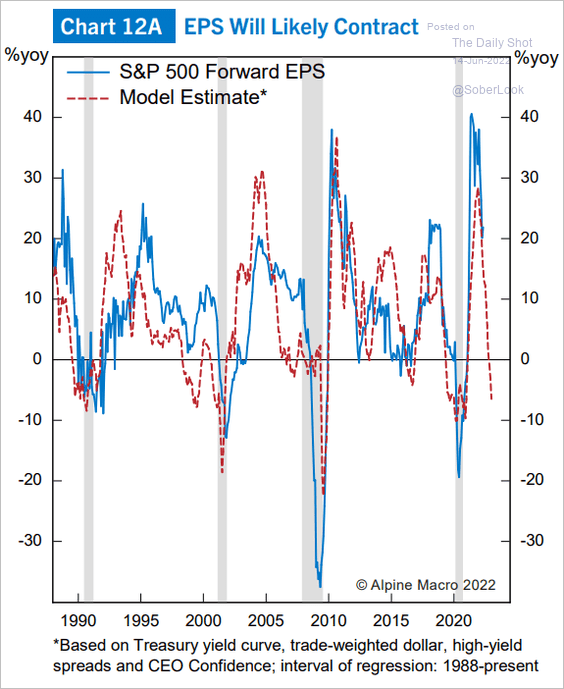 Source: Alpine Macro
And we can get an earnings recession outside of an economic recession.
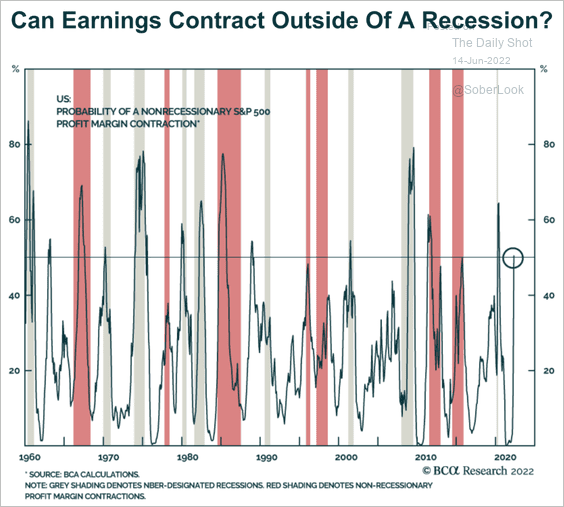 Source: BCA Research
——————–
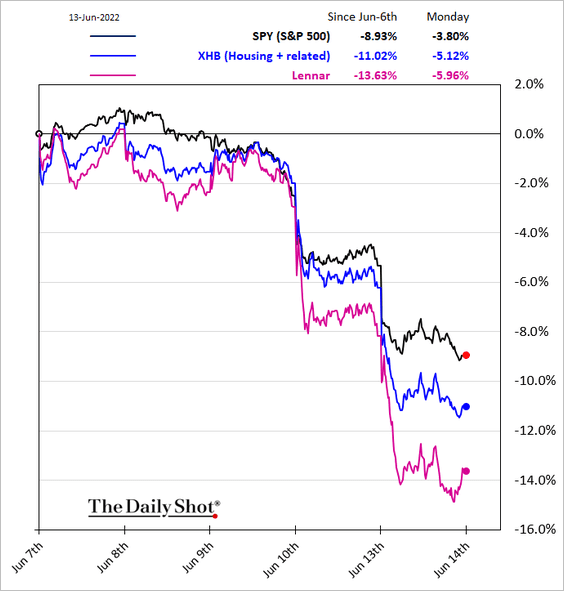
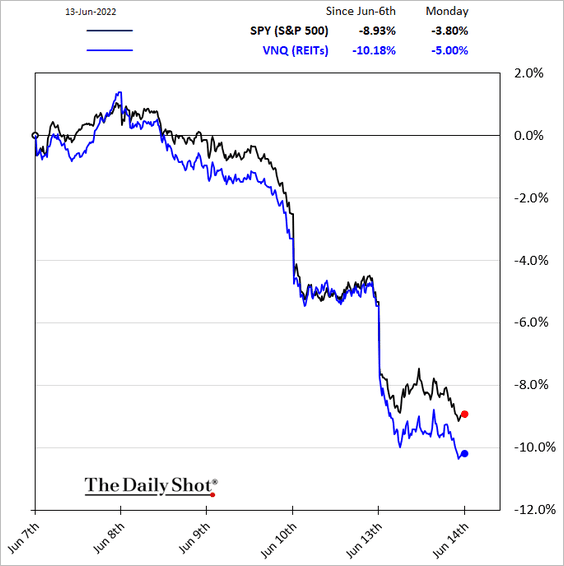
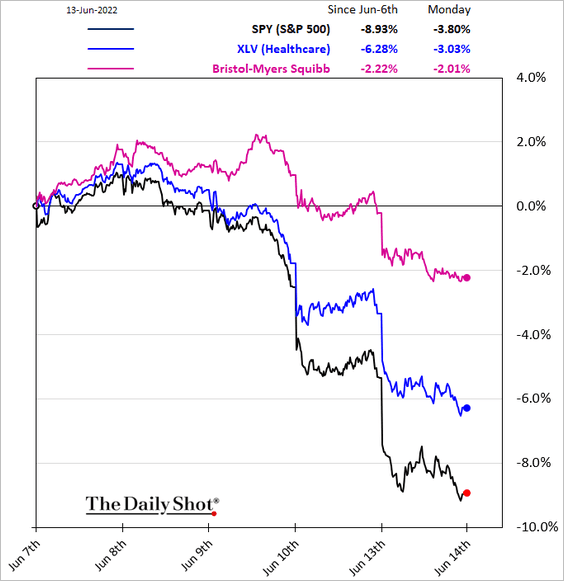
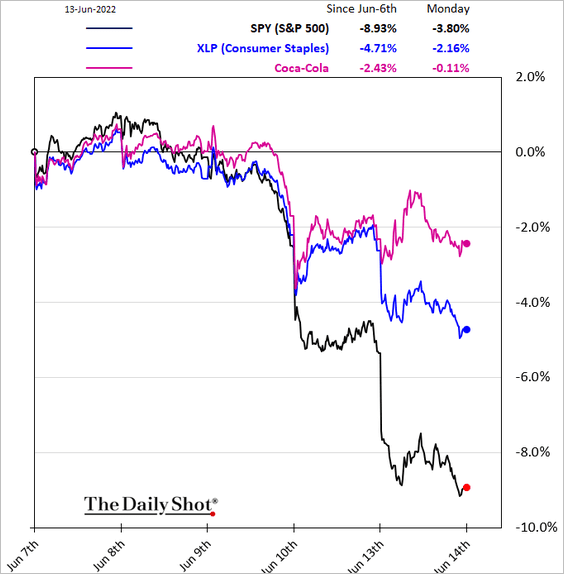
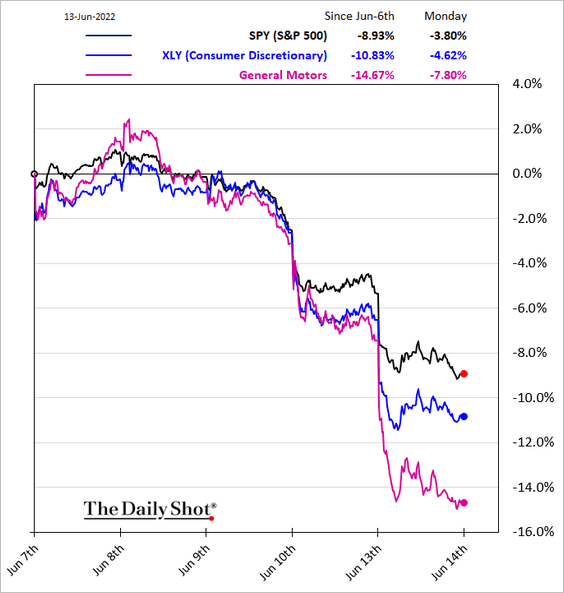
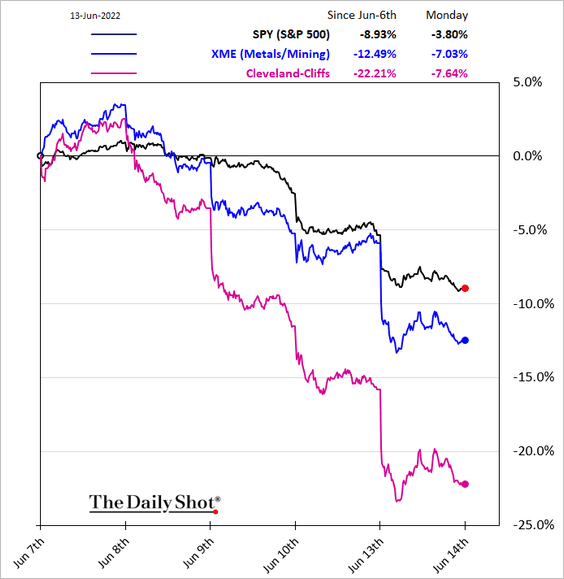
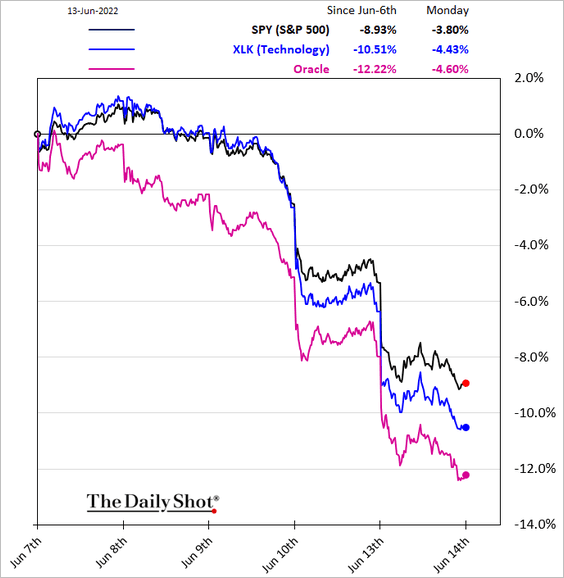
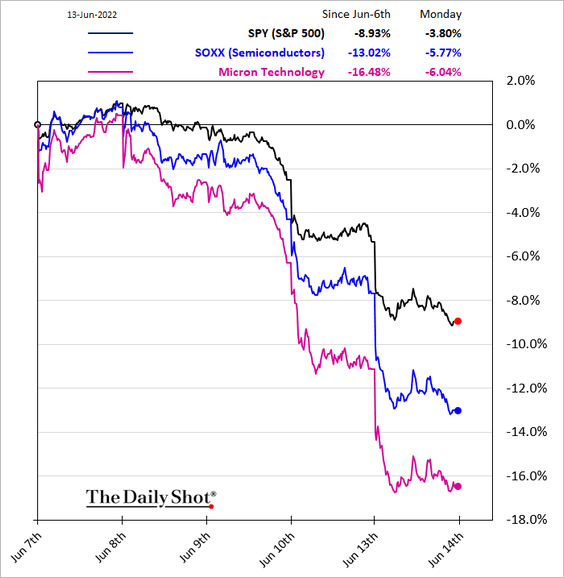
8. Next, we have some sector updates. Everything was for sale on Monday.
• Housing:
• REITs:
• Healthcare:
• Consumer Staples:
• Consumer Discretionary:
• Transportation:
![]()
• Metals & Mining:
• Tech and Semiconductors:
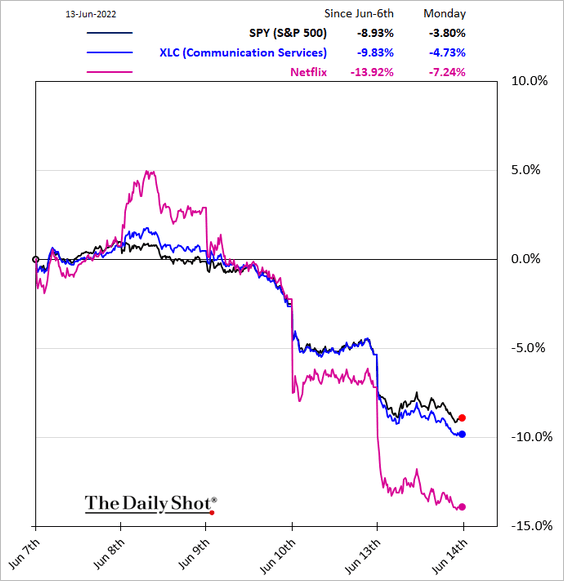
• Communication Services:
——————–
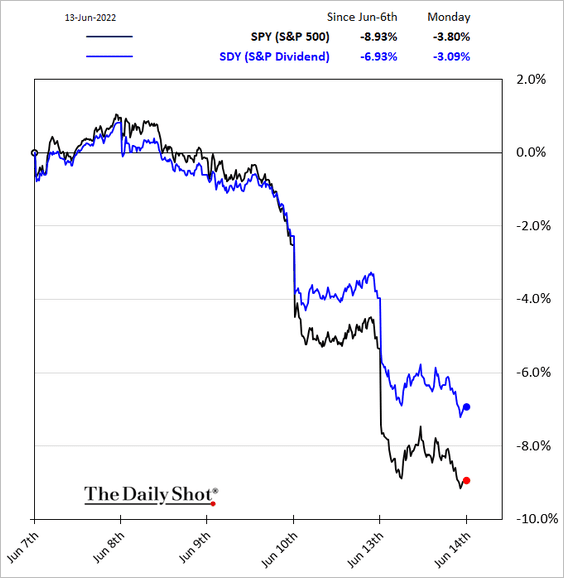
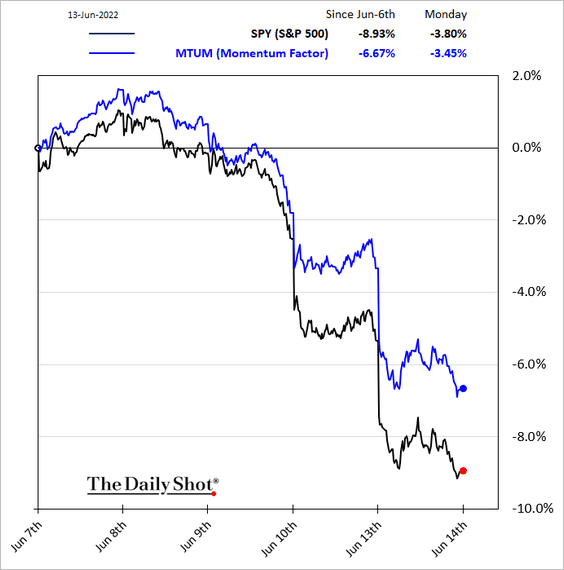
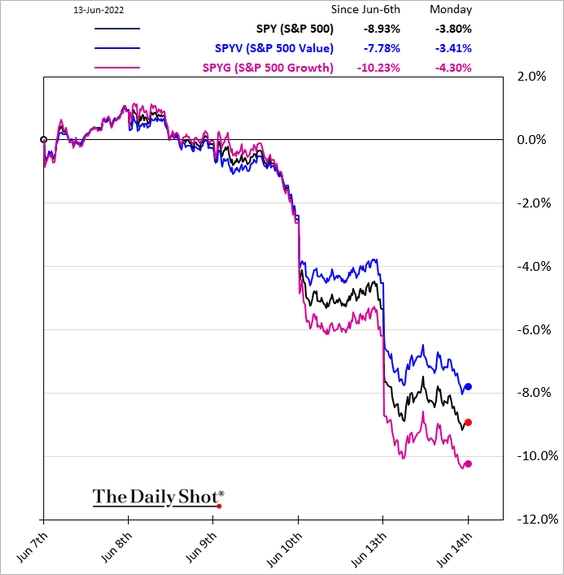
9. Finally, we have some equity factor trends.
• High-dividend:
• Momentum:
• Growth and Value:
Back to Index
Credit
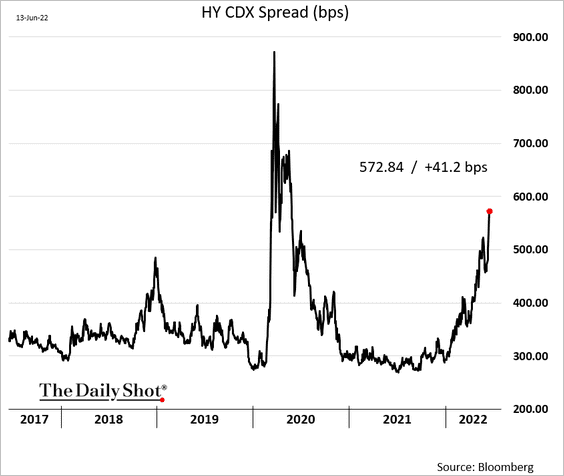
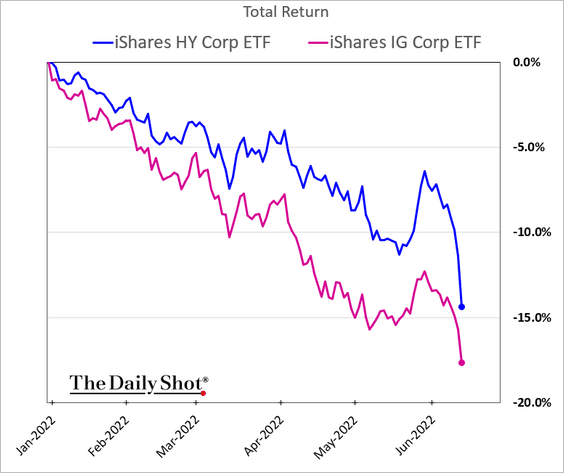
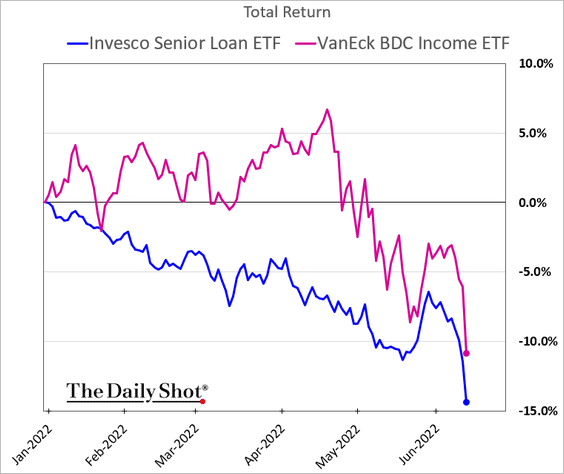
1. Credit continues to sink.
• HY CDX spread:
• High-yield and investment-grade bonds:
• Leveraged loans and BDCs:
——————–
2. This chart shows fund flows for corporate credit in the US and Europe:
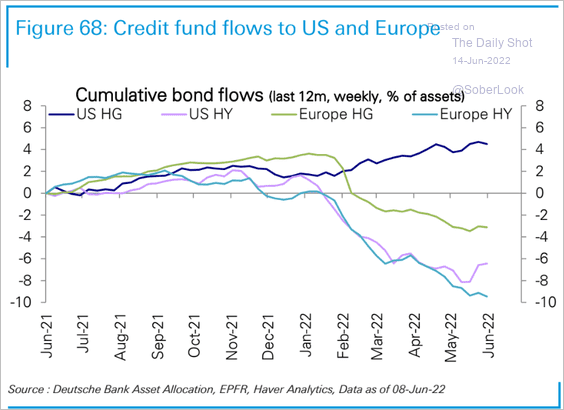 Source: Deutsche Bank Research
3. There has been remarkable stability in ‘B-‘ rated credit in recent years, driven by lower downgrades and default rates (2 charts).
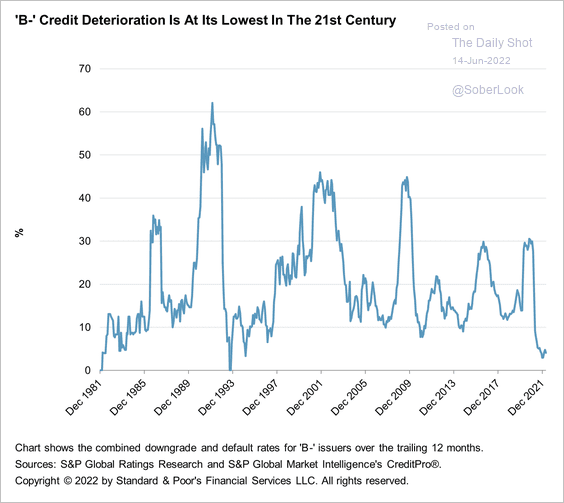 Source: S&P Global Ratings
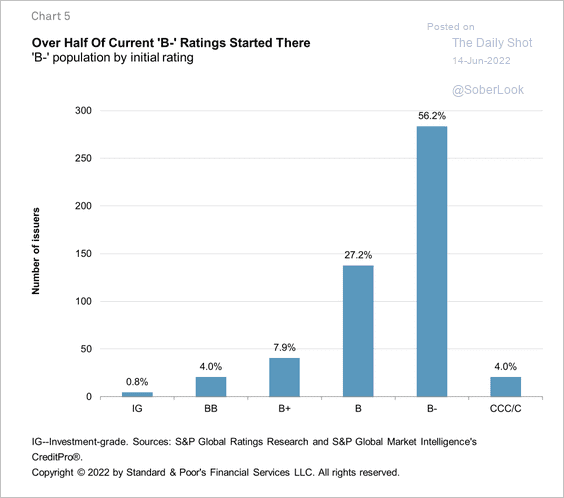 Source: S&P Global Ratings
4. Nearly all new issue first-lien leveraged loans in the US have been covenant-lite.
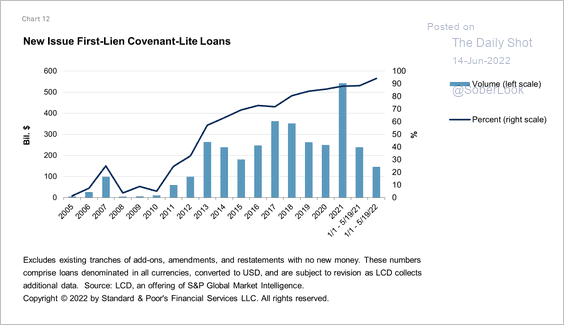 Source: S&P Global Ratings
Back to Index
Rates
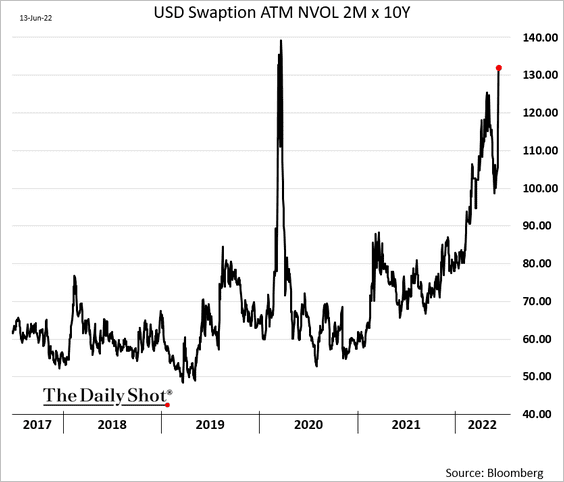
1. Rate vol surged after the CPI shock.
2. US state and local governments hold a sizeable amount of Treasury securities.
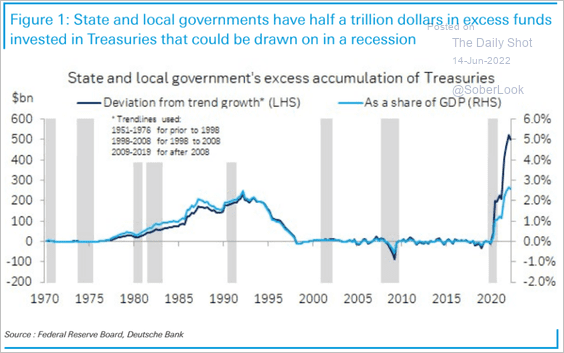 Source: Deutsche Bank Research
3. The Fed’s balance sheet could decline by 2.5 trillion by 2024.
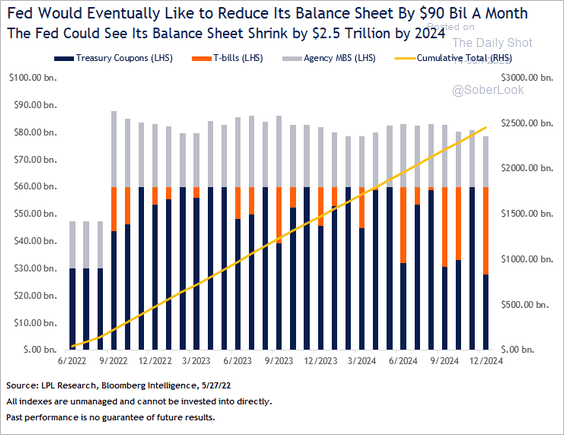 Source: LPL Research
——————–
Food for Thought
1. Large companies with the biggest losses as a share of revenue:
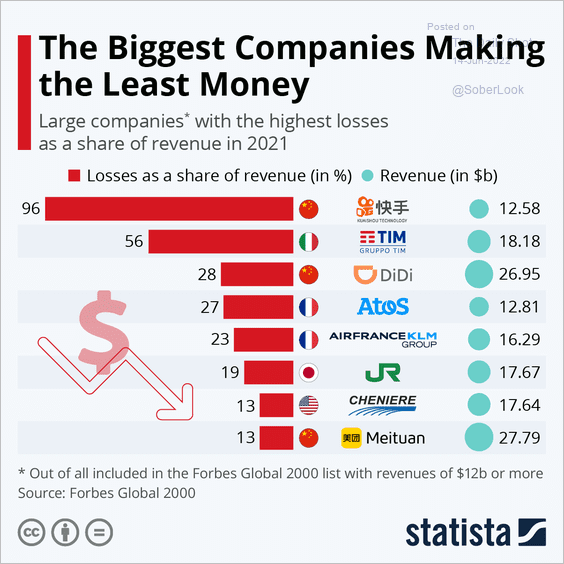 Source: Statista
2. Cybersecurity funding in Israel:
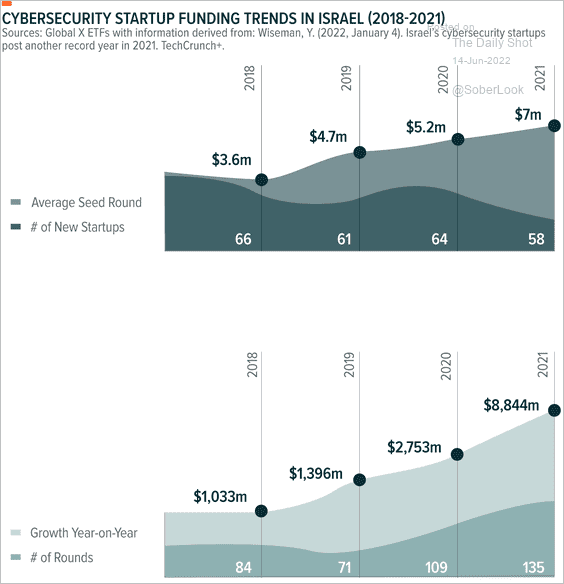 Source: Global X ETFs Read full article
3. Targets of cyber attacks:
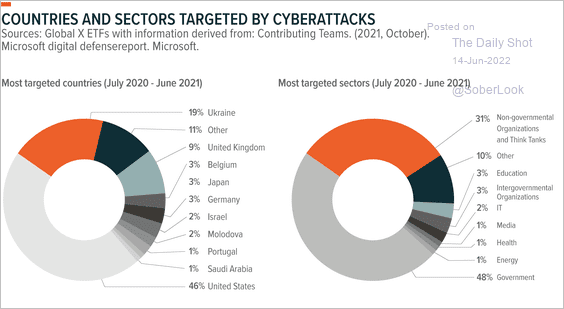 Source: Global X ETFs Read full article
4. US immigrants and native-born workers by industry:
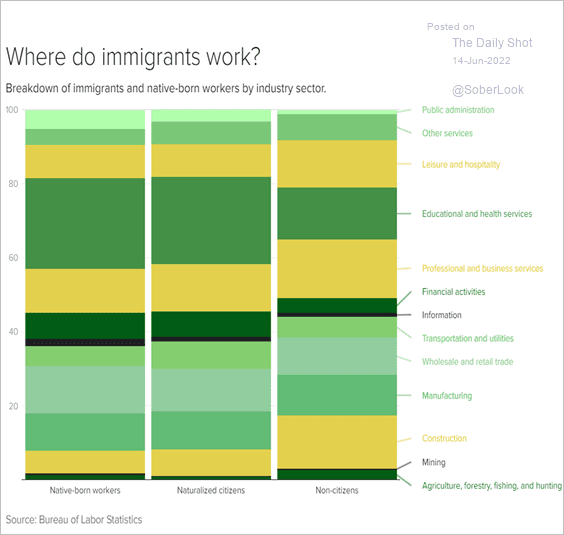 Source: CBS News Read full article
5. Soot emissions per ship type:
 Source: Statista
6. What is the key reason behind the COVID-era inflation surge?
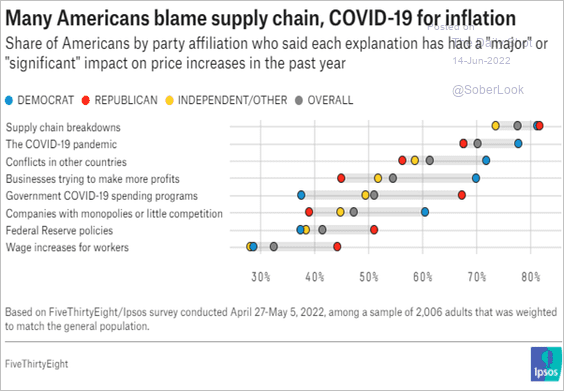 Source: FiveThirtyEight Read full article
7. The LGBT population share by state:
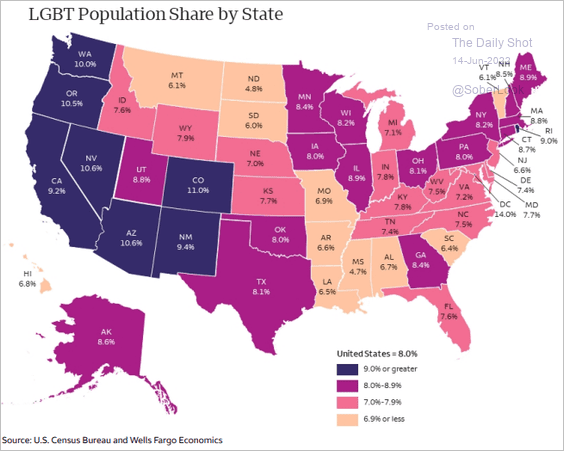 Source: Wells Fargo Securities
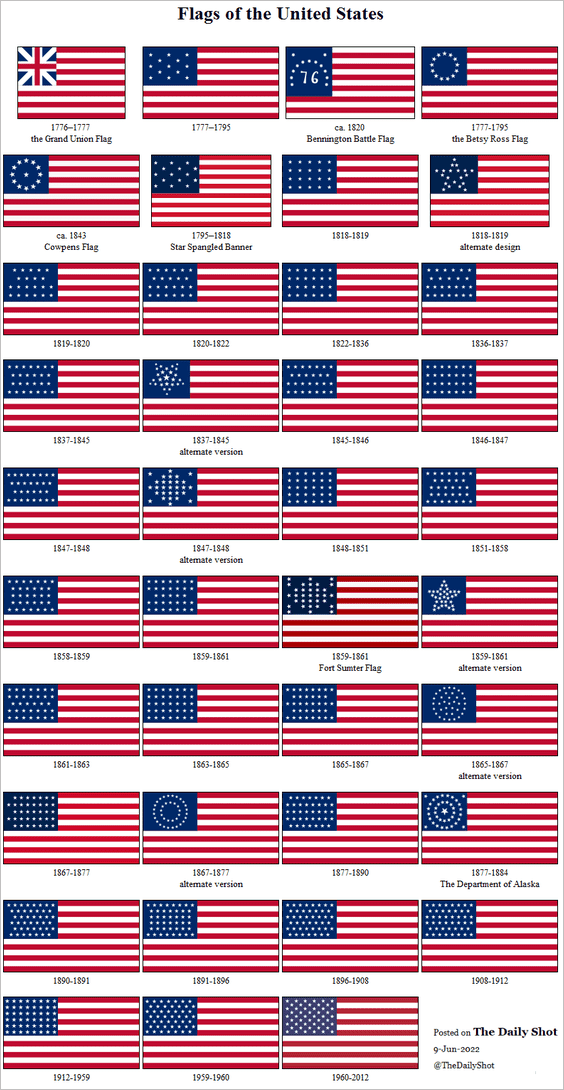
8. It’s Flag Day. Here is the typical US flag of each period as well as alternate patterns and special flags.
——————–
Back to Index