
The Daily Shot: 15-Jun-22
• The United States
• The United Kingdom
• The Eurozone
• Europe
• Asia – Pacific
• China
• Emerging Markets
• Cryptocurrency
• Energy
• Equities
• Credit
• Rates
• Global Developments
• Food for Thought
The United States
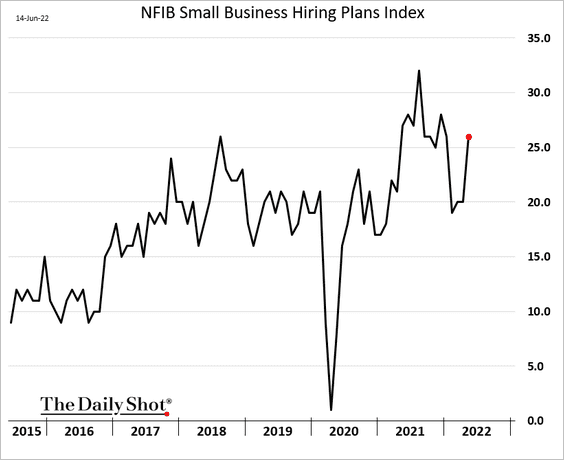
1. The NFIB small business confidence index edged lower in May.
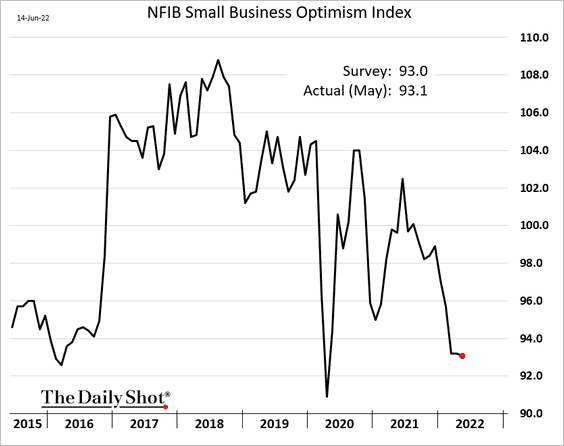
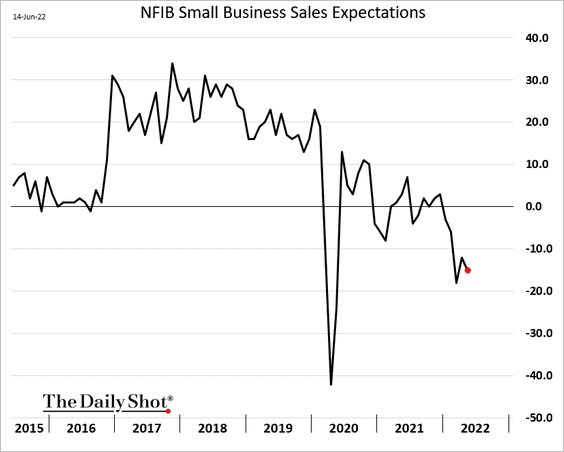
Business outlook is consistent with a deep economic slump.
– Sales expectations:
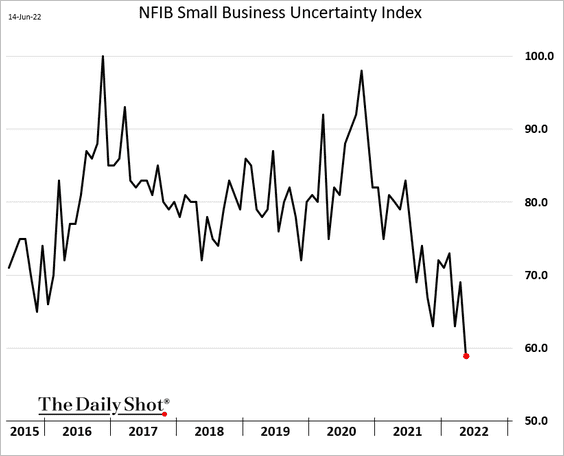
– Uncertainty:
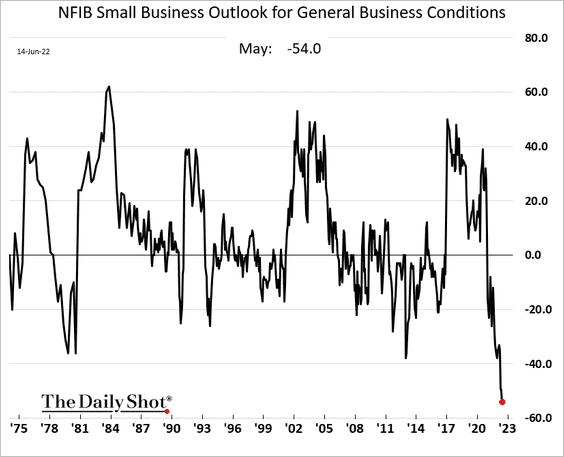
– General business conditions (record low):
Faced with a recession (as trends above suggest), companies should, in theory, curtail hiring. Instead, hiring plans picked up in May. Perhaps the situation is not as dire as sentiment suggests.
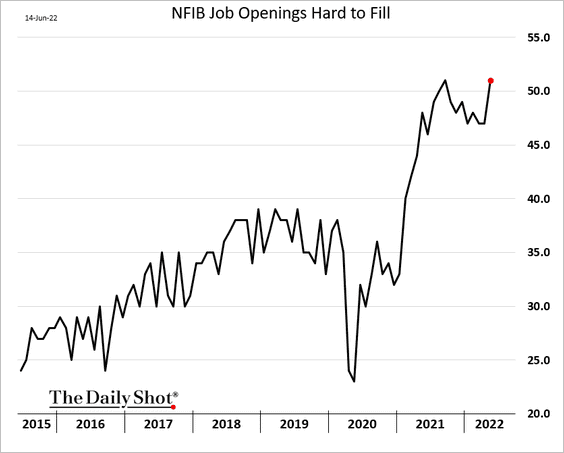
Firms are still finding it challenging to fill job openings.
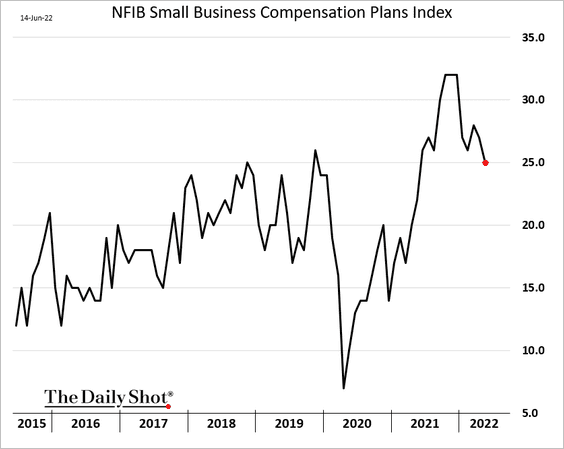
The compensation plans index is off the highs but still elevated.
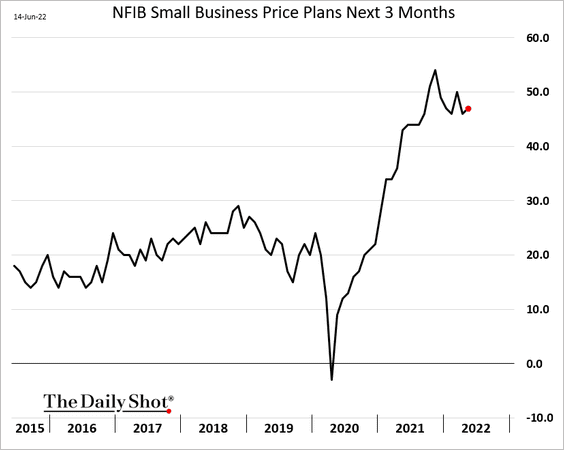
And companies believe they still have pricing power.
——————–
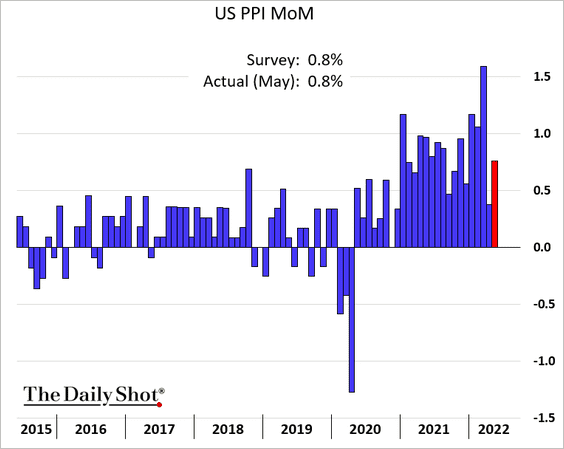
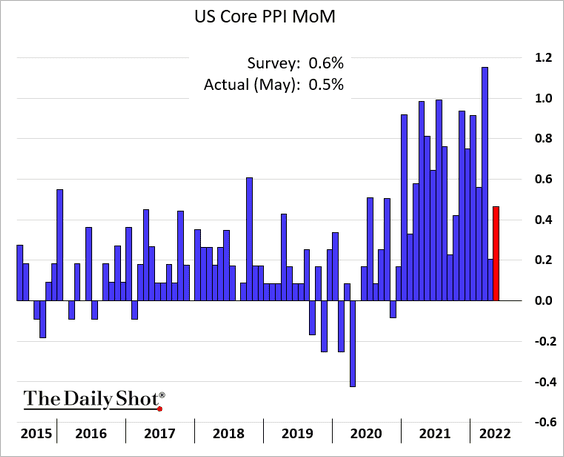
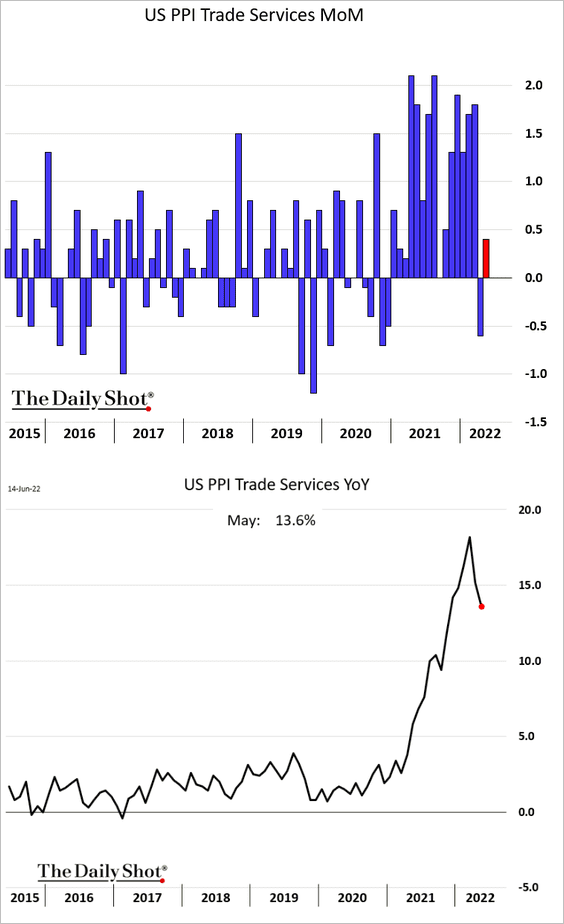
2. The PPI report showed persistent cost pressures.
• Core PPI (monthly changes):
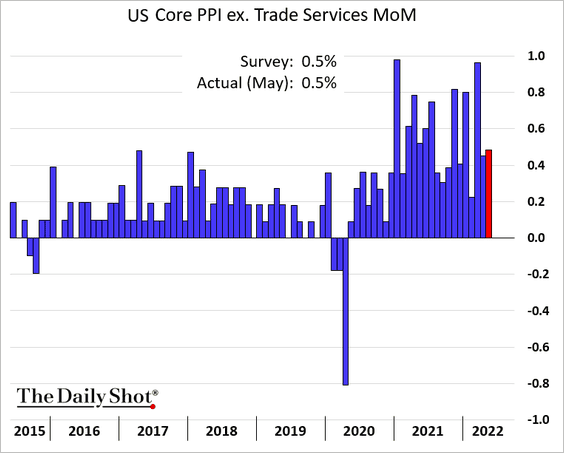
• Core PPI ex. trade services (business markups):
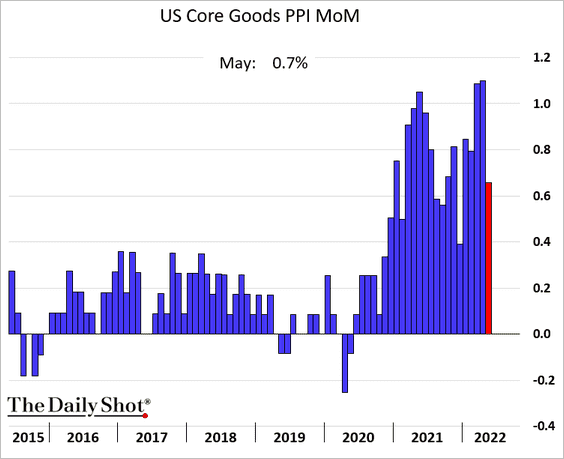
• Core goods PPI (goods prices still surging):
——————–
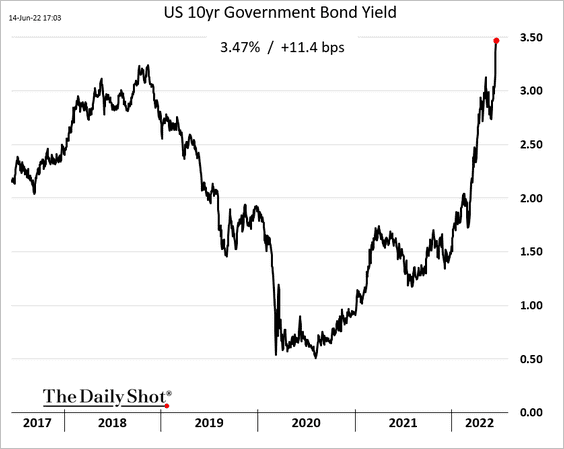
3. Treasury yields continued to soar on Tuesday. The market fully expects a 75 bps Fed hike today (and more to come).
• The 10yr Treasury yield:
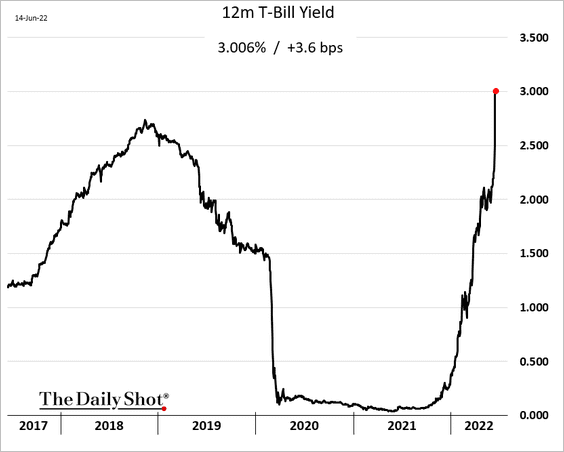
• The 12-month T-bill yield (above 3%):
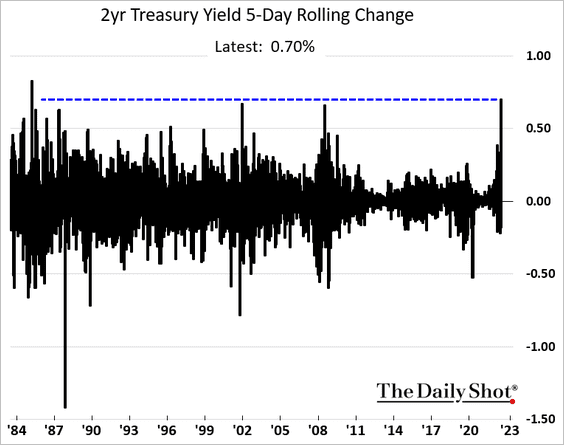
The five-day increase in the 2-year Treasury yield was the highest since the mid-1980s.
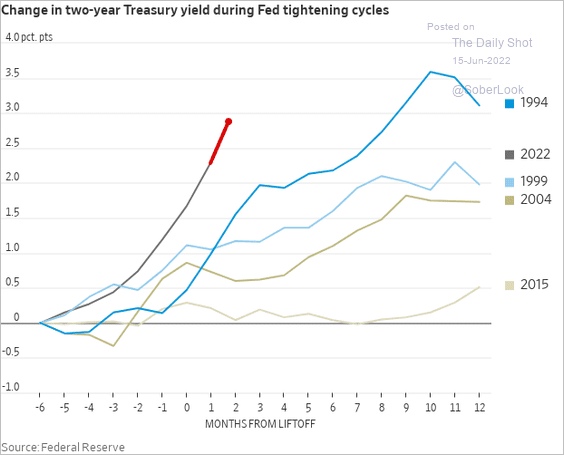
Here are the 2-year yield changes in previous hiking cycles.
 Source: @WSJ Read full article
——————–
4. What could make the Fed pause hiking rates?
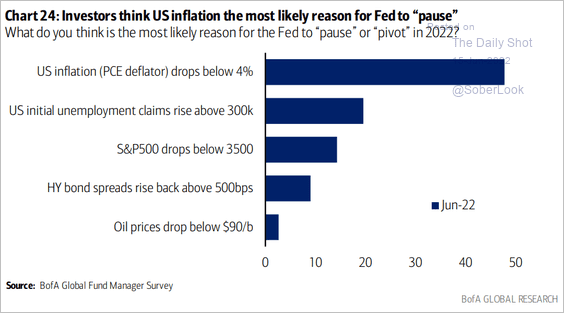 Source: BofA Global Research
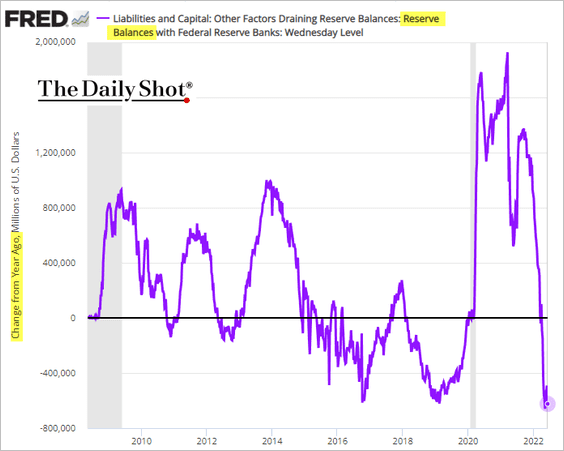
5. Reserve balances have declined sharply on a year-over-year basis even before the Fed launched quantitative tightening. Deteriorating liquidity does not bode well for risk assets such as stocks.
6. Freight inflation appears to have peaked.
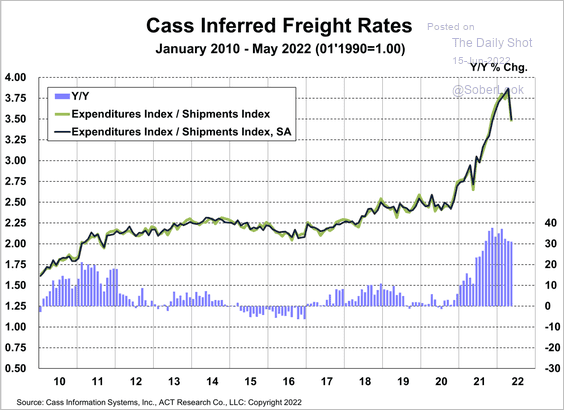 Source: Cass Information Systems
Back to Index
The United Kingdom
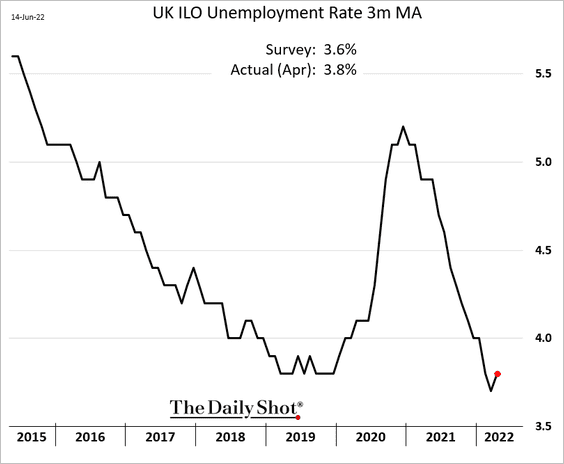
1. May payrolls growth topped expectations.
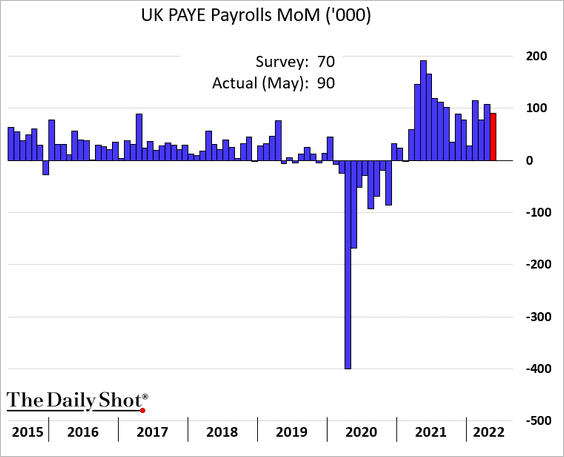
The unemployment rate edged higher.
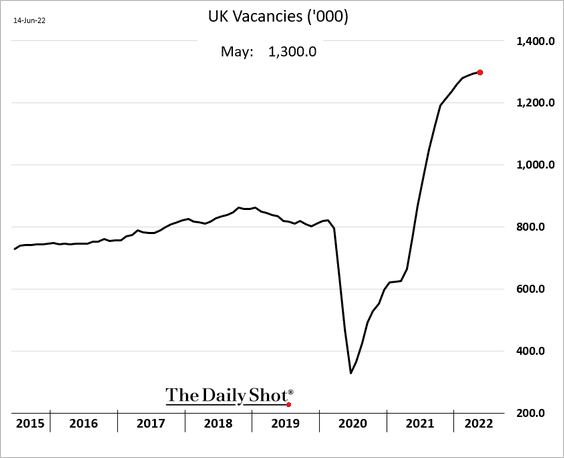
But so did job vacancies.
——————–
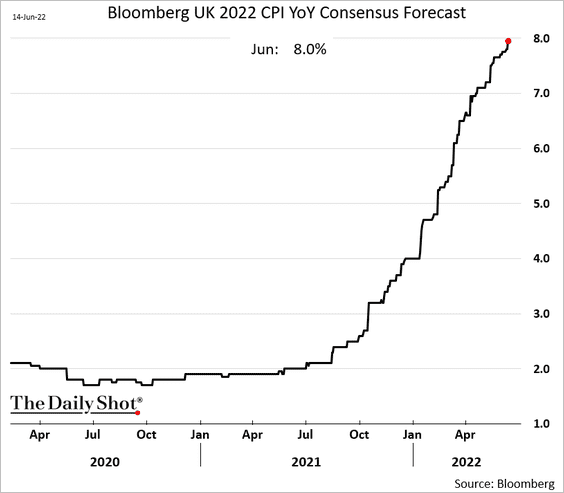
2. Economists now expect the year-over-year 2022 CPI to hit 8%.
3. The market expects the BoE to take rates above 2.8% by the end of the year.

Back to Index
The Eurozone
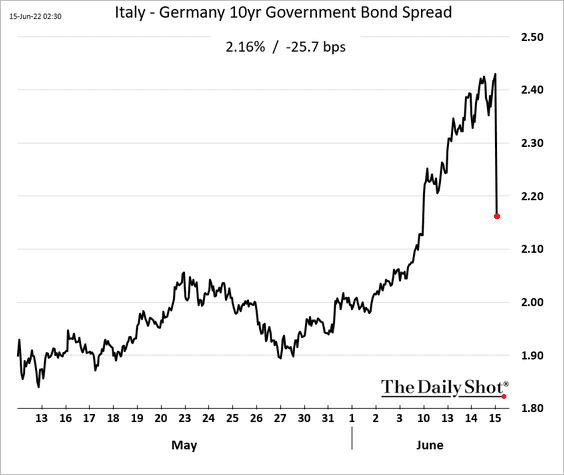
1. The ECB got spooked by this chart, which is signaling “fragmentation.”
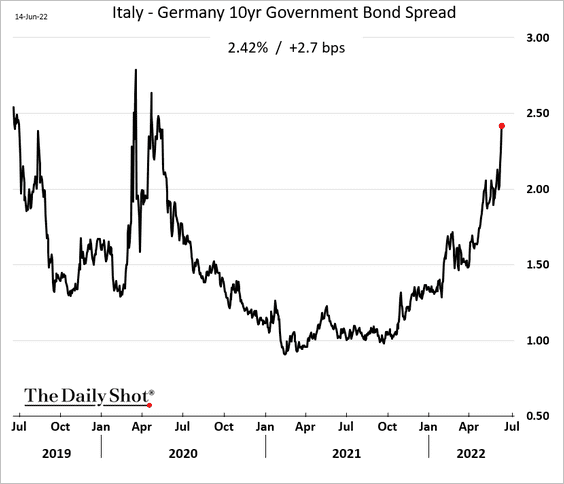
And then we got this news, …
 Source: Reuters Read full article
… sending the spread sharply lower.
——————–
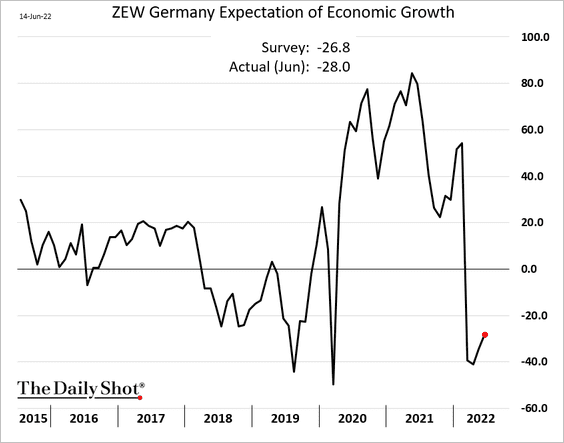
2. Germany’s ZEW expectations index edged higher but remains depressed.
 Source: MarketWatch Read full article
Back to Index
Europe
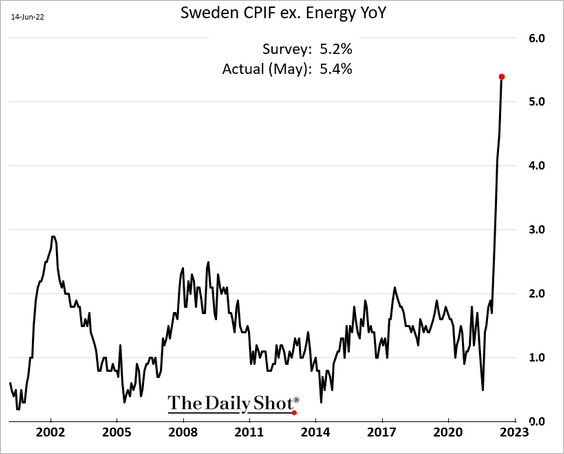
1. Sweden’s CPI surprised to the upside.
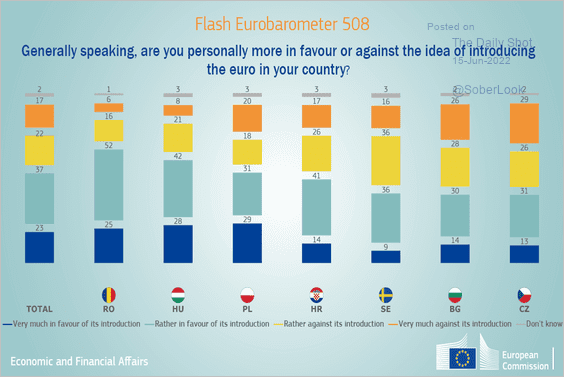
2. Who is interested in joining the EMU?
 Source: @ecfin Read full article
Back to Index
Asia – Pacific
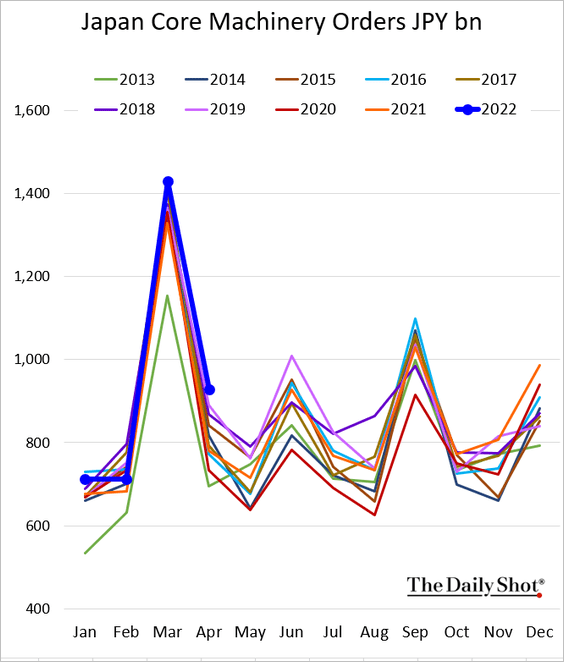
1. Japan’s machinery orders were robust in April.
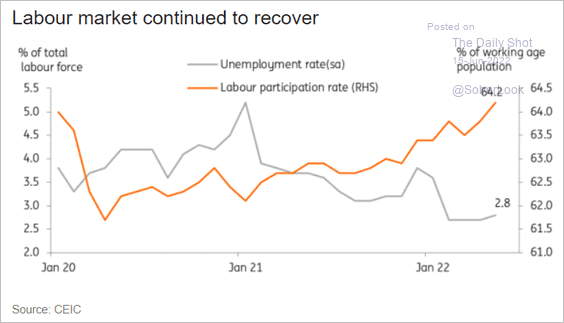
2. South Korea’s unemployment rate ticked higher.
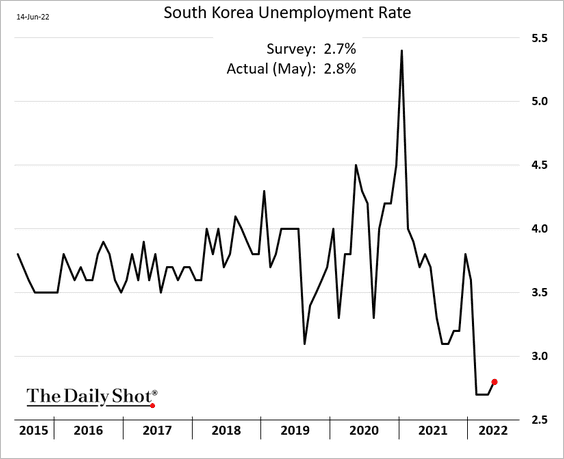
But so did the labor force participation rate.
 Source: ING
——————–
3. New Zealand’s home sales deteriorated further last month, …
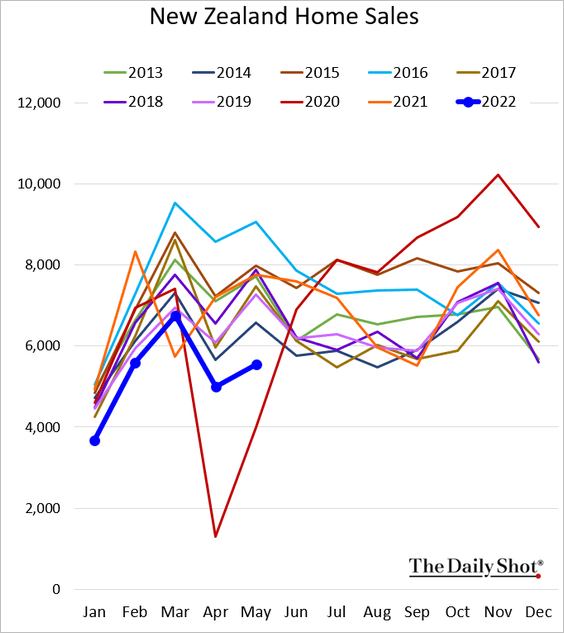
… and home price appreciation is slowing quickly.
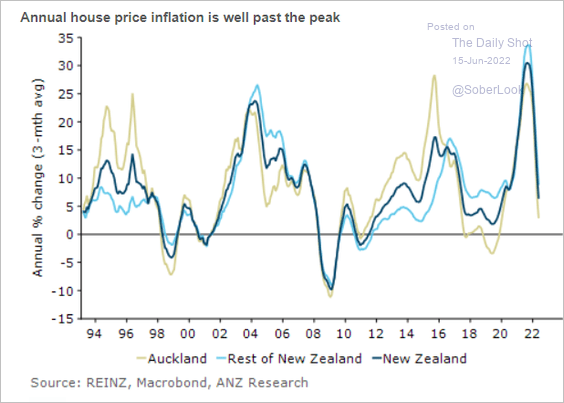 Source: @ANZ_Research
——————–
4. Next, we have some updates on Australia.
• Consumer sentiment is plunging.
– Westpac:

– ANZ/Roy Morgan:
 Source: @ANZ_Research
• The Westpac/MI consumer survey shows declining sentiment toward housing and a preference for savings via bank deposits or paying down debt.
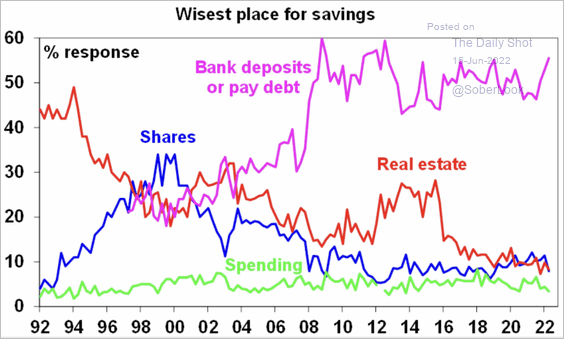 Source: @ShaneOliverAMP
• The minimum wage will increase by 5.2% next month.
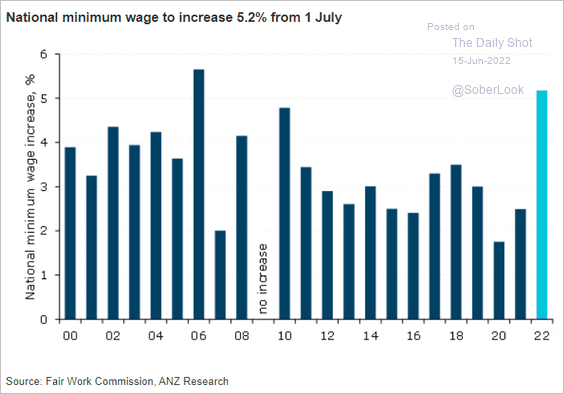 Source: @ANZ_Research
Back to Index
China
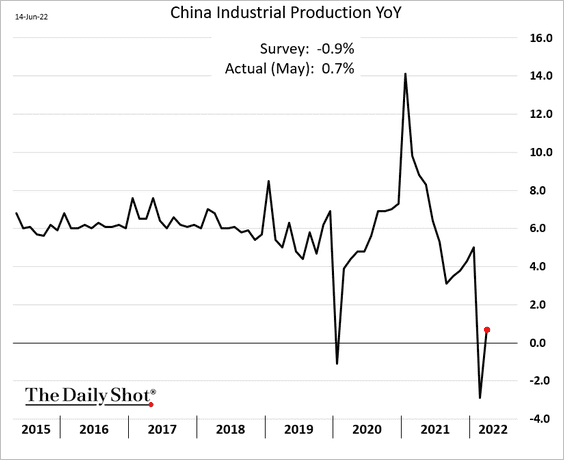
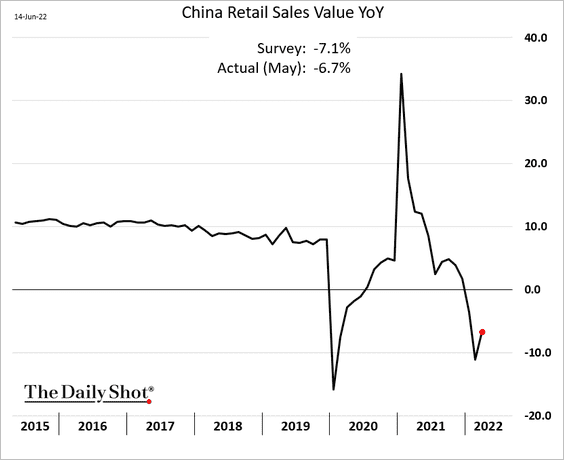
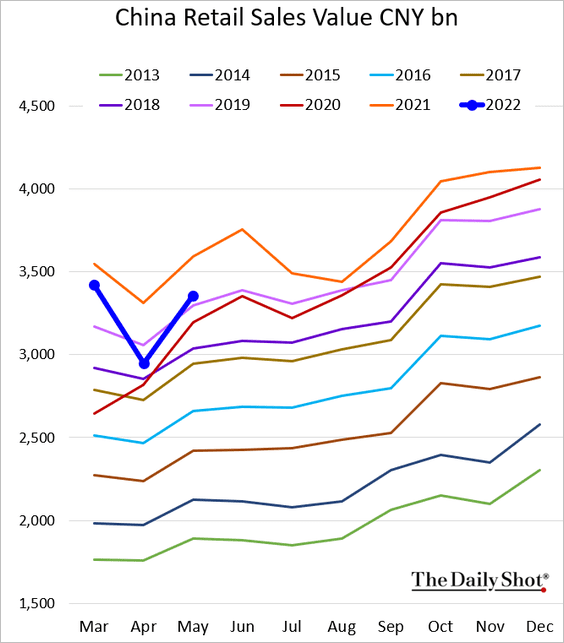
1. Economic activity was stronger than expected in May.
• Industrial production:
• Retail sales (still well below last year’s levels):
• The unemployment rate:

——————–
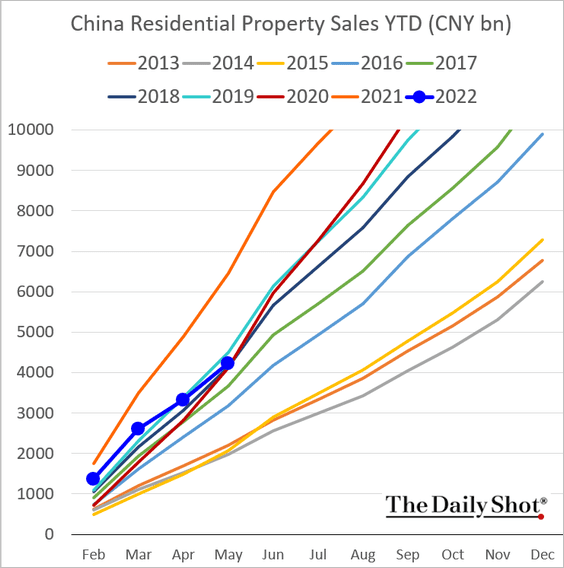
2. Residential property sales are roughly at the level they were in 2020.
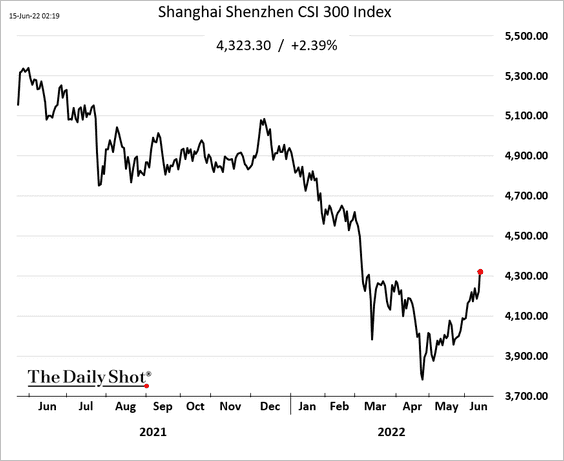
3. The stock market continues to rebound. Foreign investors are trying to escape the wrath of global central banks by hiding out in China.
4. Mobility has improved.
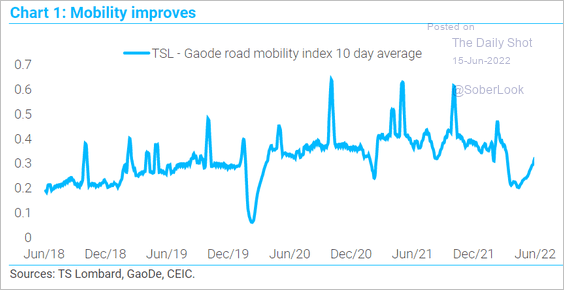 Source: TS Lombard
5. China’s RMBS market has grown substantially.
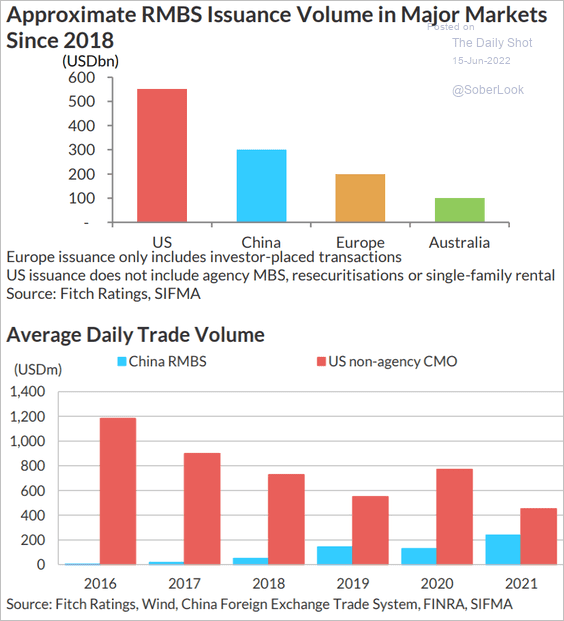 Source: Fitch Ratings
Back to Index
Emerging Markets
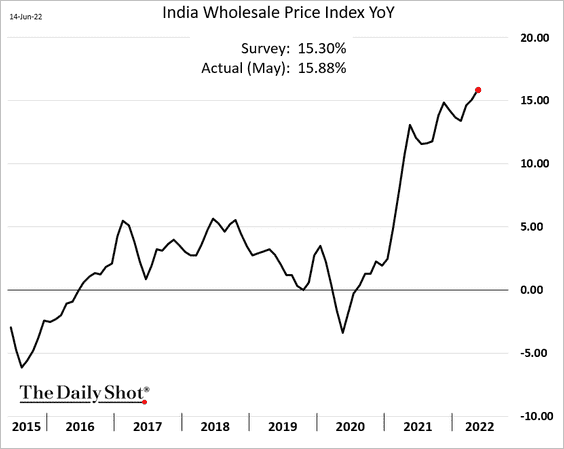
1. India’s wholesale price inflation surprised to the upside.
Indian stocks look vulnerable.
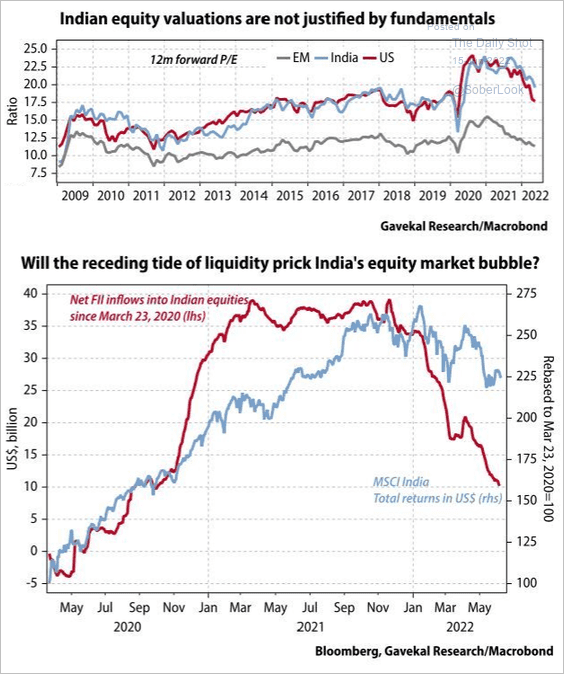 Source: Gavekal Research
——————–
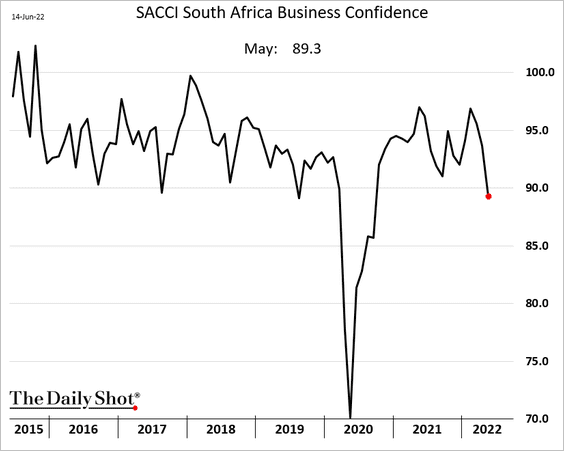
2. South Africa’s business confidence is falling.
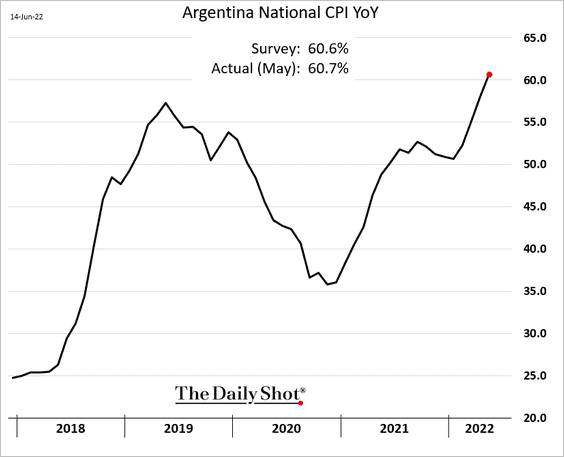
3. Argentina’s inflation exceeded 60% in May.
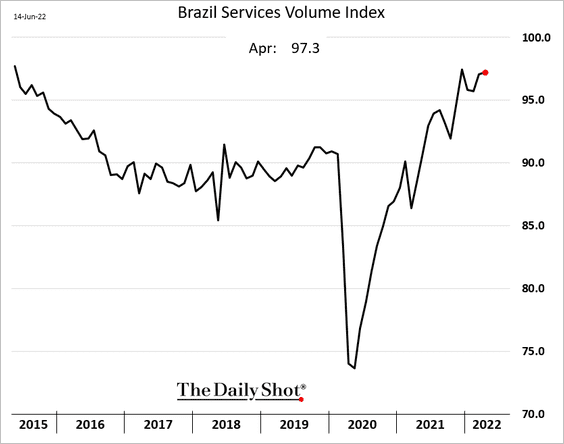
4. Brazil’s service-sector output is holding up well.
5. Here are some EM economies with large twin deficits.
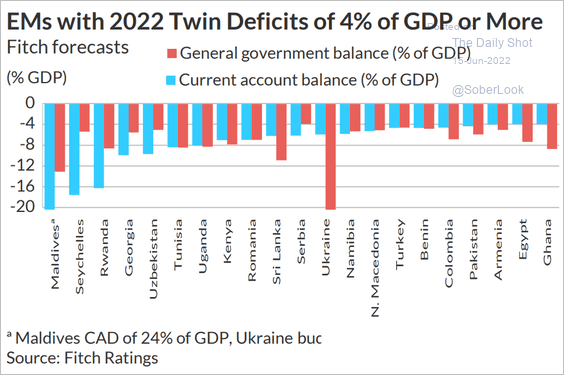 Source: Fitch Ratings
Back to Index
Cryptocurrency
1. Bitcoin now trades barely above the average purchase price of all bitcoin in circulation.
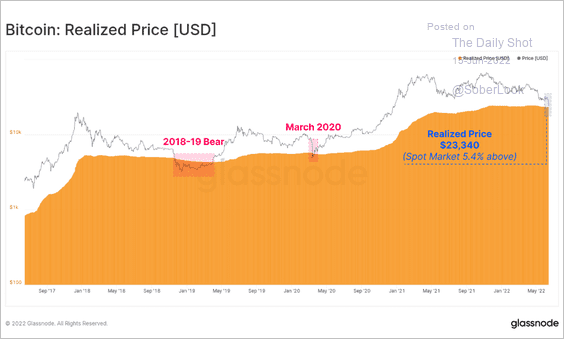 Source: Bloomberg Read full article
2. The bitcoin Fear & Greed index dipped deeper into “extreme fear” territory.
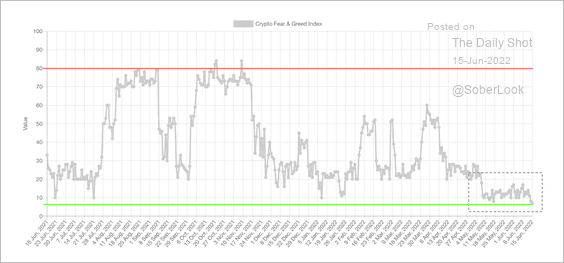 Source: Alternative.me
3. Bitcoin’s implied volatility spiked during the recent sell-off, albeit still below last month’s peak.
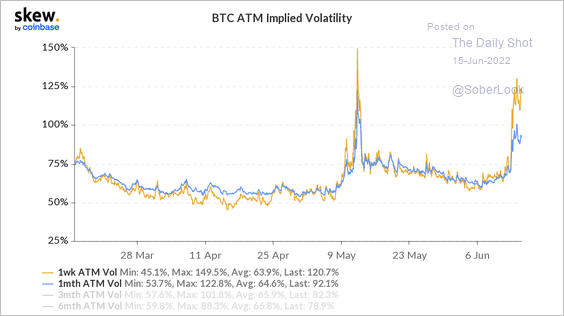 Source: @CoinbaseInsto
• Put option premium is rising relative to similar call options, reflecting heightened fear among BTC option traders.
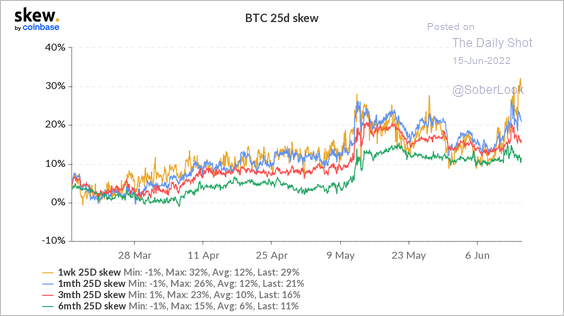 Source: @CoinbaseInsto
• The bitcoin put/call ratio remains elevated.
 Source: @CoinbaseInsto
——————–
4. The stablecoin market shrank over the past few months, mainly due to the collapse of TerraUSD (UST).
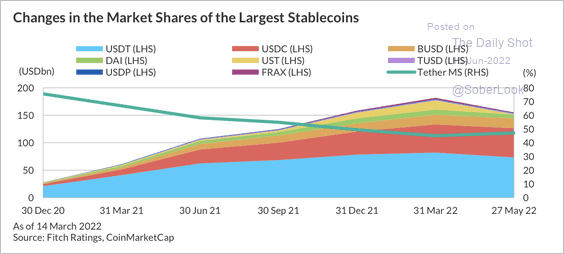 Source: Fitch Ratings
Back to Index
Energy
1. US refinery capacity is well below pre-pandemic levels, sending crack spreads sharply higher.
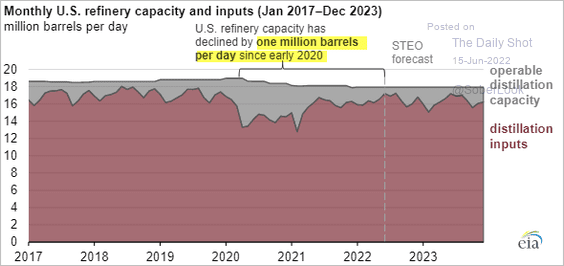 Source: @EIAgov
2. The surge in US jet fuel prices has been due to high oil costs and refinery challenges rather than increased demand.
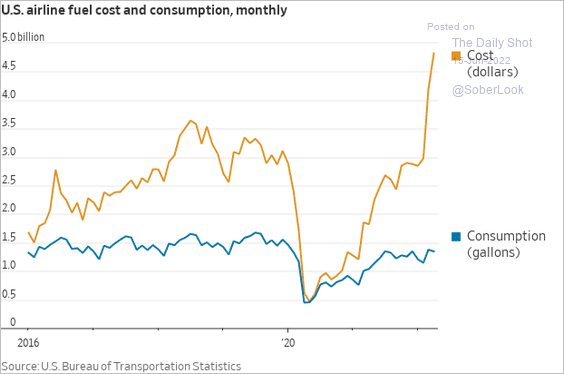 Source: @WSJ Read full article
3. European natural gas in storage is moving in the right direction.
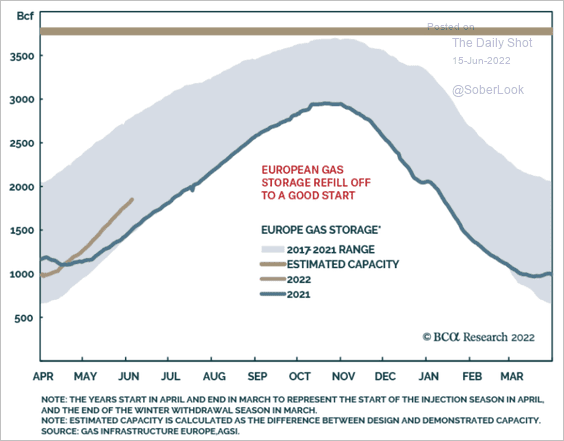 Source: BCA Research
4. Who owns the crude oil tankers departing Russia? (update)
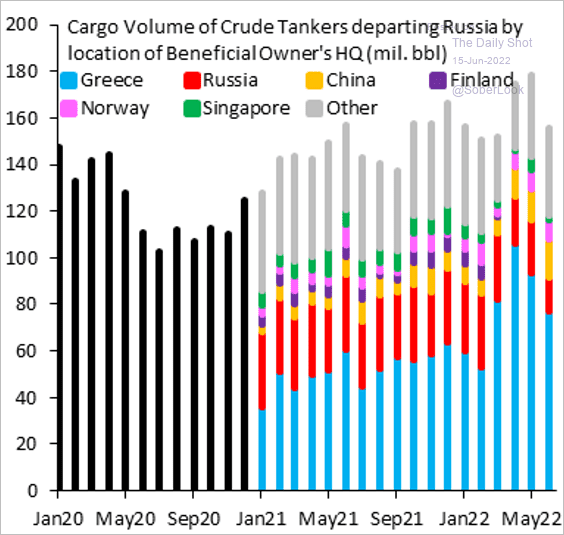 Source: @RobinBrooksIIF, @JonathanPingle
Back to Index
Equities
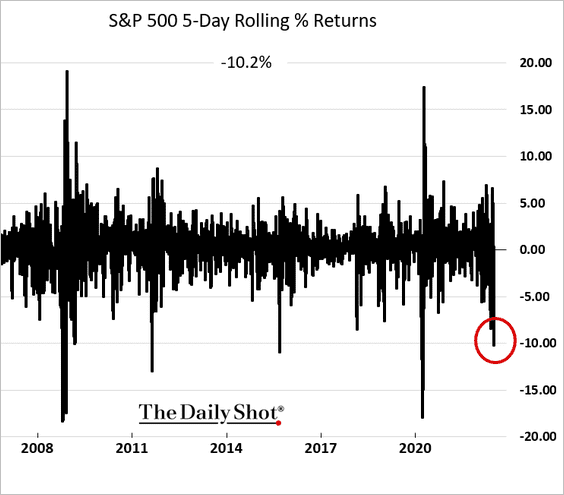
1. The S&P 500 is down 10% over the past five trading days.
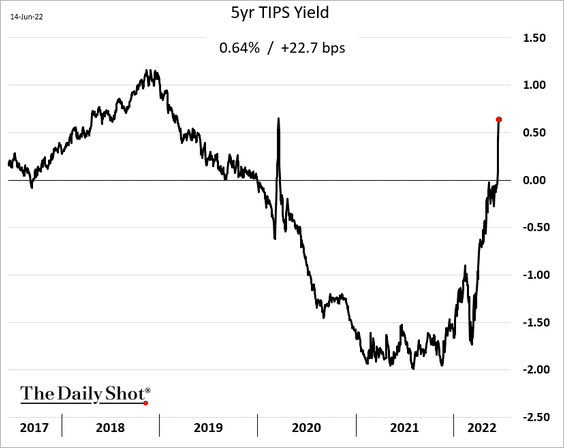
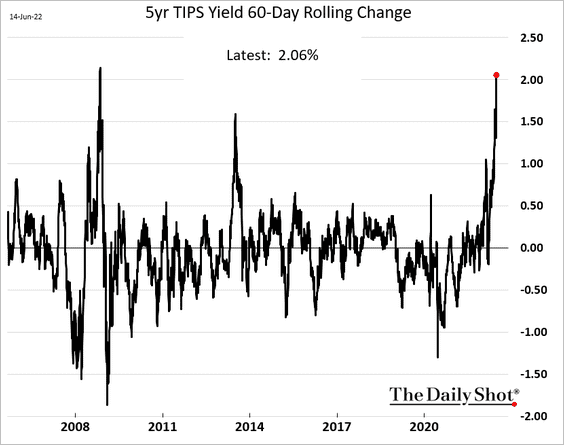
2. The massive surge in real yields has been a significant headwind for risk assets, especially growth stocks.
Here are the 60-day rolling changes in the 5-year TIPS yield.
——————–
3. Analysts continue to estimate earnings growth of about 10% this year and next for S&P 500 companies.
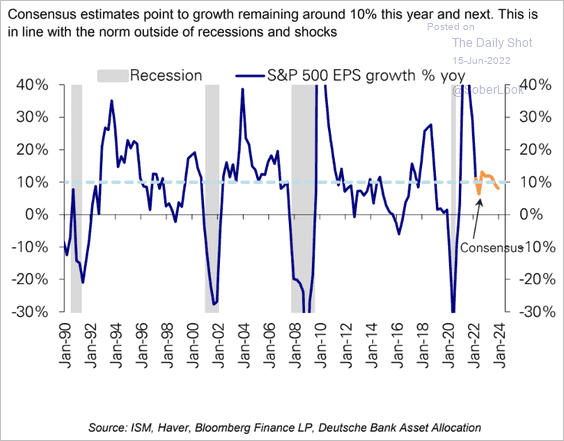 Source: Deutsche Bank Research
The market doesn’t think so.
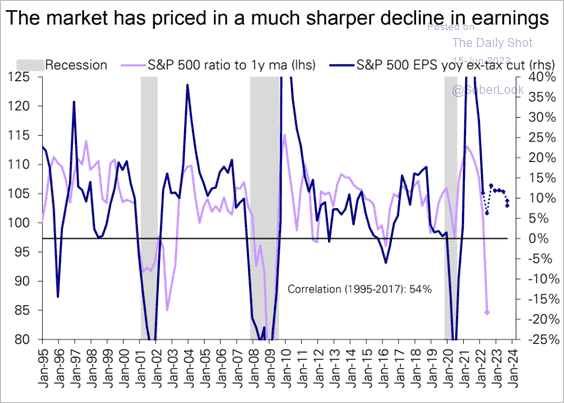 Source: Deutsche Bank Research
And neither do fund managers.
 Source: BofA Global Research
Will the upcoming downgrades in earnings forecasts catch up with the market?
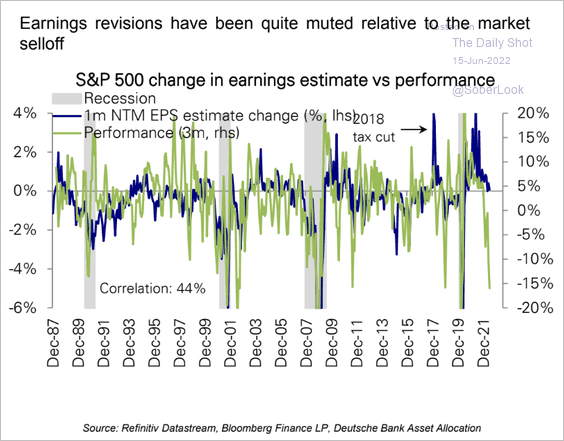 Source: Deutsche Bank Research
——————–
4. Less than 5% of S&P 500 members are above their 50-day moving average (2nd panel).
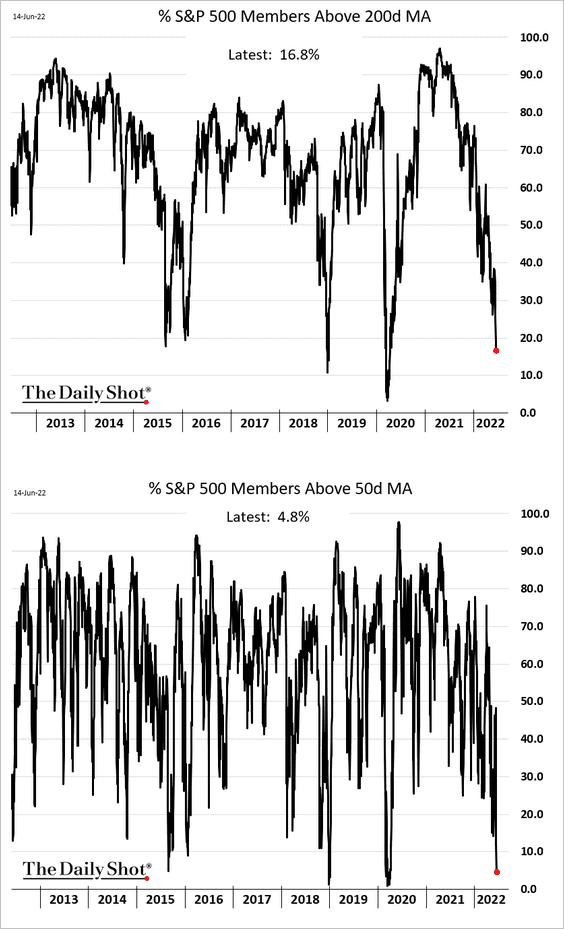
Here is what happened in the past when we hit these levels. Is it different this time?
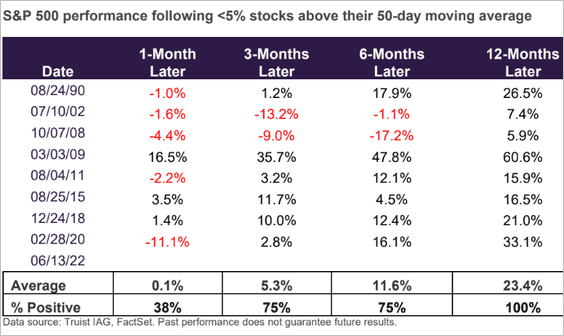 Source: Truist Advisory Services
——————–
5. How long do bear markets last?
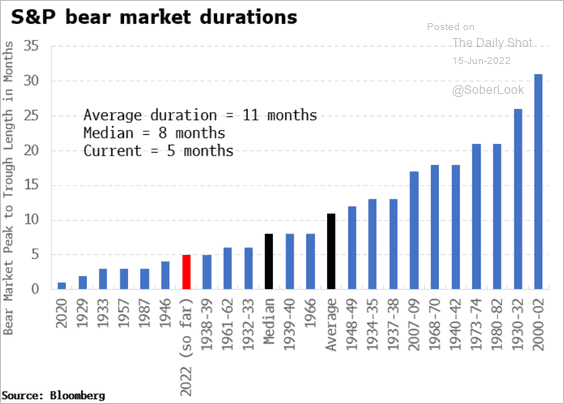 Source: Simon White, Bloomberg Markets Live Blog
Where are we relative to previous bear markets? The trajectory depends on whether we get a recession.
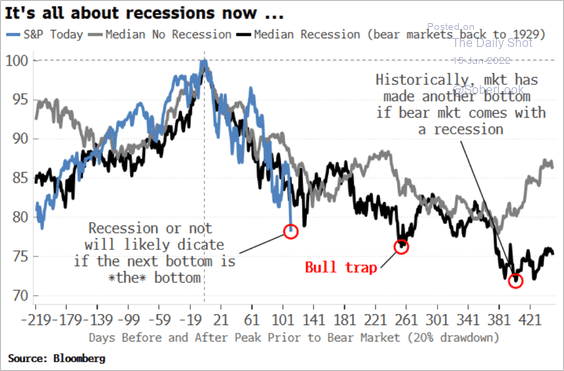 Source: Simon White, Bloomberg Markets Live Blog
——————–
6. Fund managers remain very underweight equities. Could we get a bounce after the Fed’s jumbo hike?
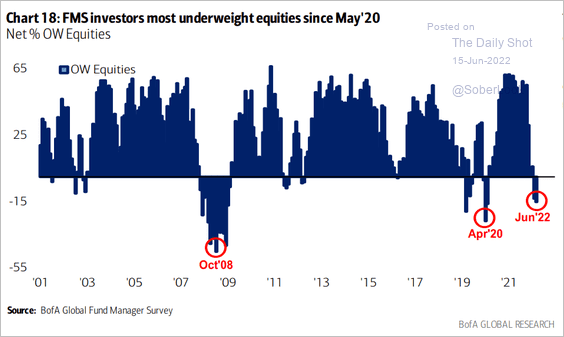 Source: BofA Global Research
7. The PPI report continues to signal a pullback in corporate margins.
8. Some positive news in the sea of red?
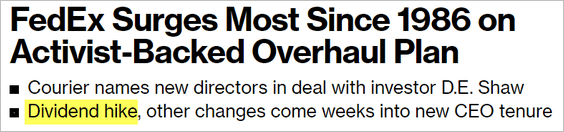 Source: Bloomberg Read full article
Back to Index
Credit
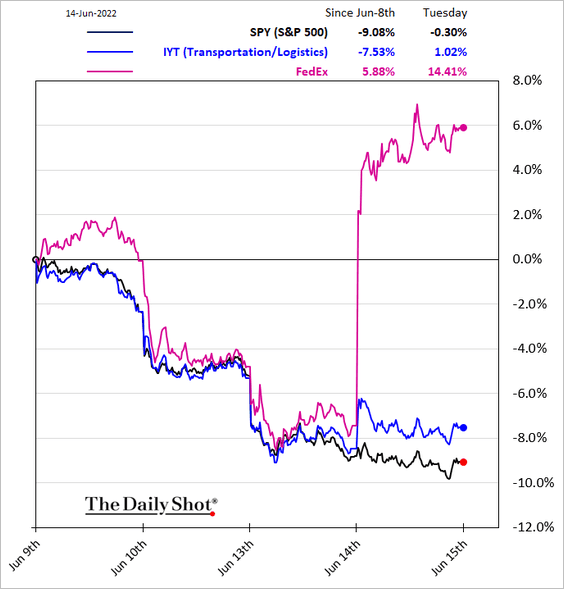
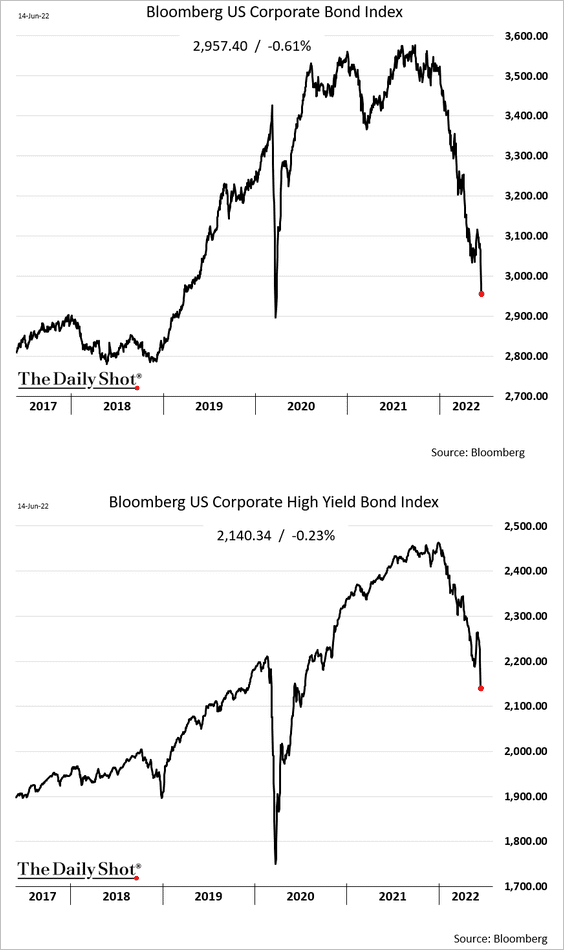
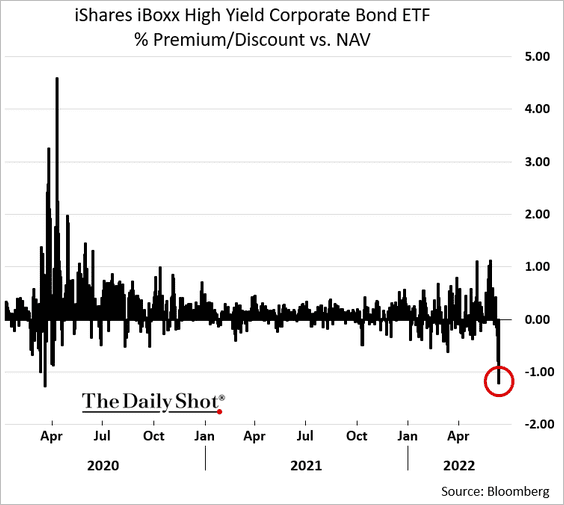
1. Corporate bond prices have taken a beating, according to Bloomberg indices.
But the HYG ETF discount to NAV suggests that bonds are not getting marked down quickly enough.
——————–
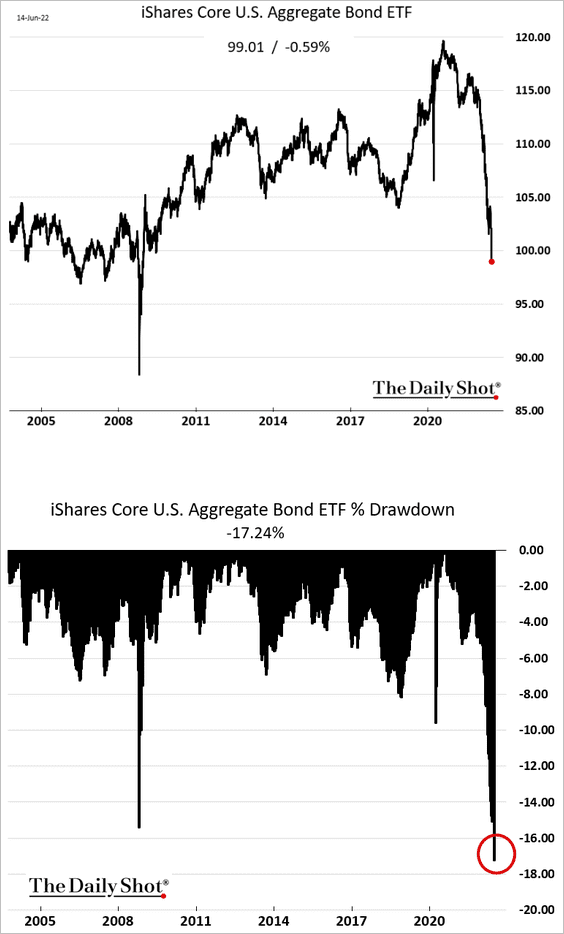
2. Here is the total US investment-grade index, which includes Treasuries, corporates, MBS, ABS, etc.
3. The pandemic default cycle in high-yield (first chart) and B-rated credit (second chart) versus the four main ones of the last 30 years.
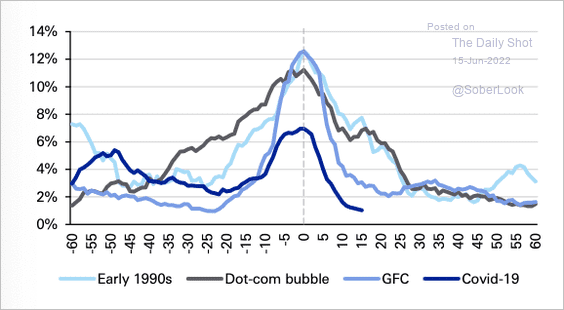 Source: Deutsche Bank Research
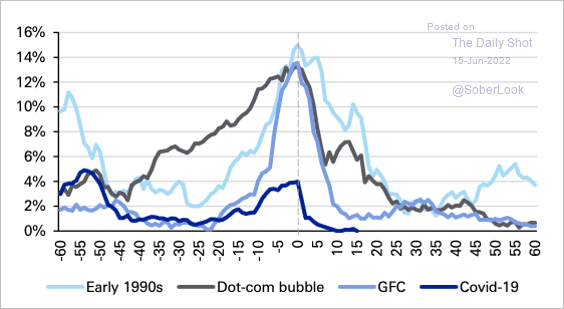 Source: Deutsche Bank Research
——————–
4. A weaker economic growth outlook and growing margin pressures could lead to an increase in expected credit default rates in Europe.
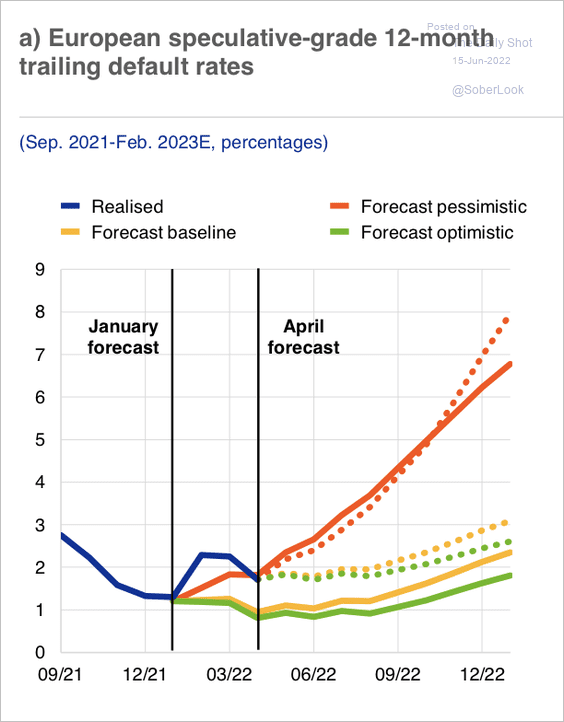 Source: ECB
Back to Index
Rates
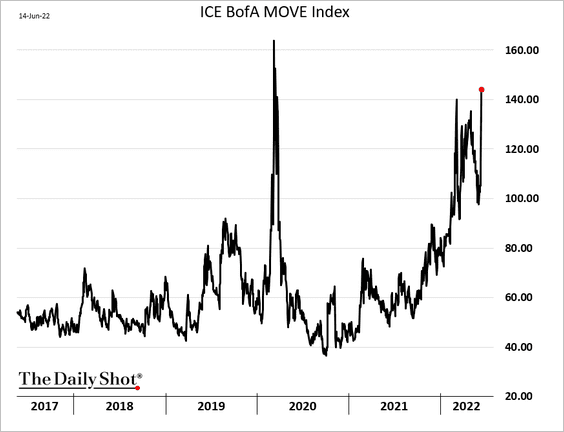
1. Treasury-market implied vol keeps surging.
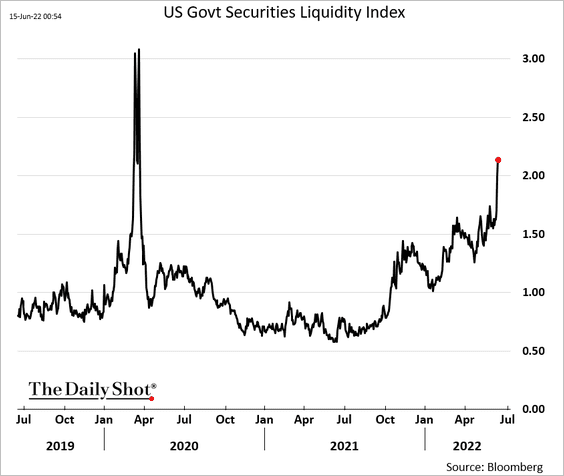
2. Bloomberg’s indicator of Treasury market liquidity shows deterioration (higher = worse liquidity). The index is based on individual securities’ deviations from the fitted yield curve.
 Source: BofA Global Research
Back to Index
Global Developments
1. The dollar has been a hedge for stocks and bonds.
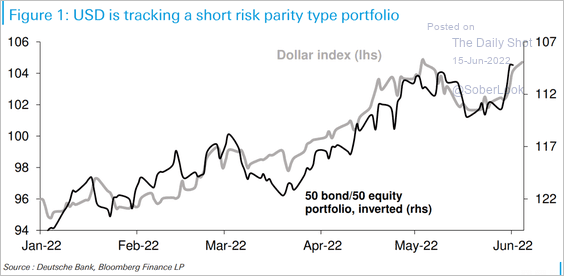 Source: Deutsche Bank Research
2. Professional investors’ risk appetite remains near the lowest levels since the Global Financial Crisis.
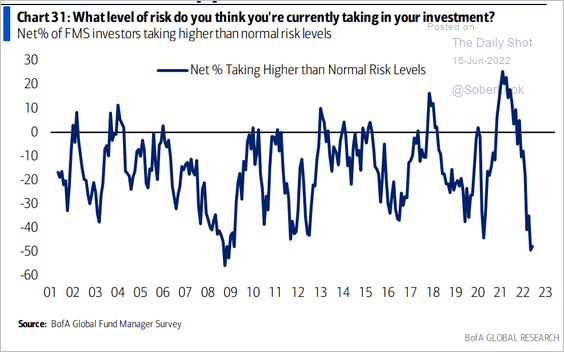 Source: BofA Global Research
3. This chart shows unemployment rates for select economies
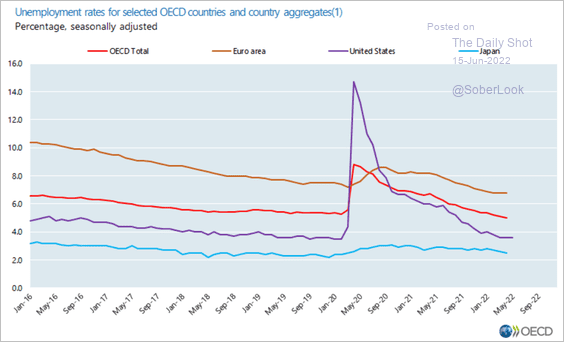 Source: OECD Read full article
——————–
Food for Thought
1. The decoupling of agricultural land use and food production:
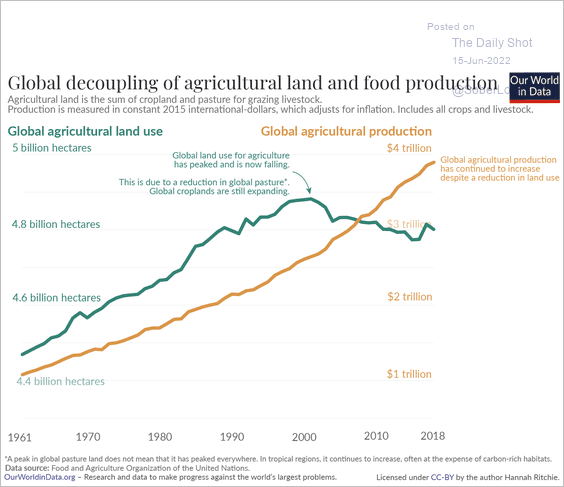 Source: @OurWorldInData Read full article
2. Countries with the highest oil reserves:
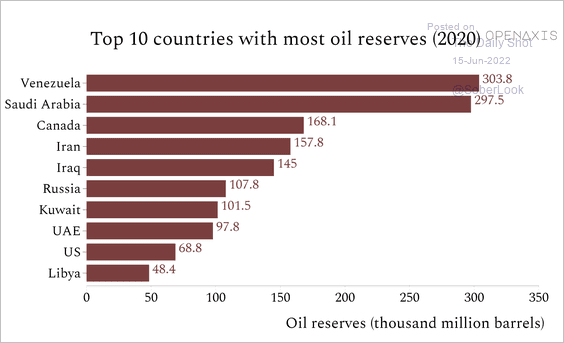 Source: @OpenAxisHQ
3. This chart shows the percent change in each state’s population over the past two years.
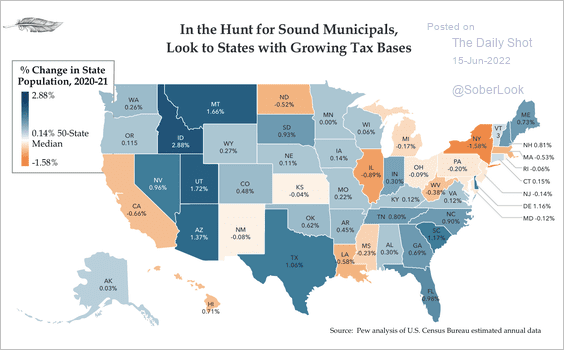 Source: Quill Intelligence
4. Hurricanes that caused $10 bn or more in damage:
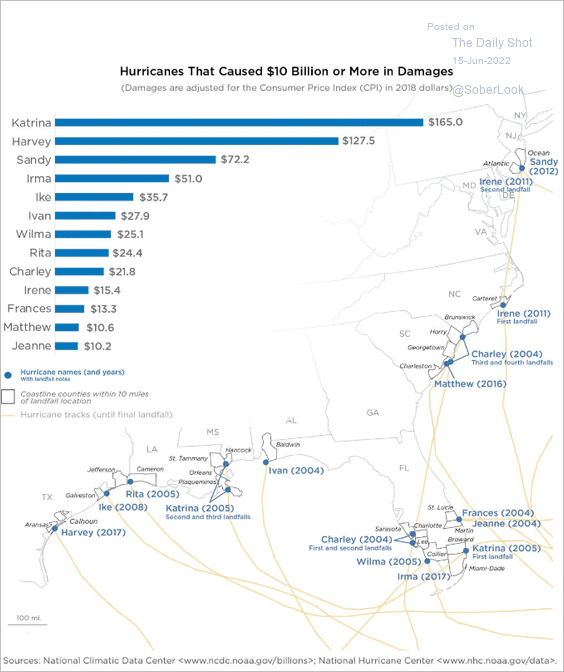 Source: US Census Read full article
5. Violent deaths involving a firearm per 100k people:
 Source: Statista
6. Recovery in the US employment-to-population ratio by age:
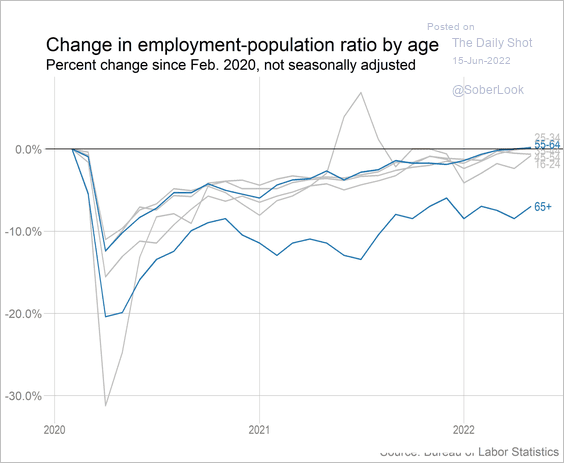 Source: @bencasselman Read full article
7. The hottest day of the year:
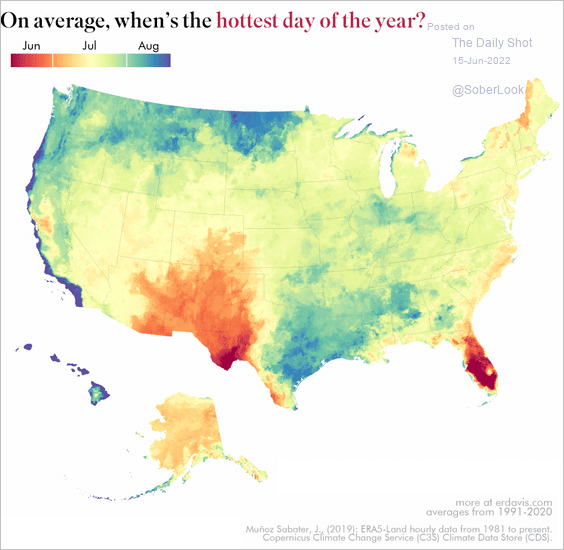 Source: @erindataviz
Back to Index