
The Daily Shot: 20-Jun-22
• The United States
• Canada
• The United Kingdom
• Europe
• China
• Emerging Markets
• Cryptocurrency
• Commodities
• Energy
• Equities
• Credit
• Global Developments
• Food for Thought
The United States
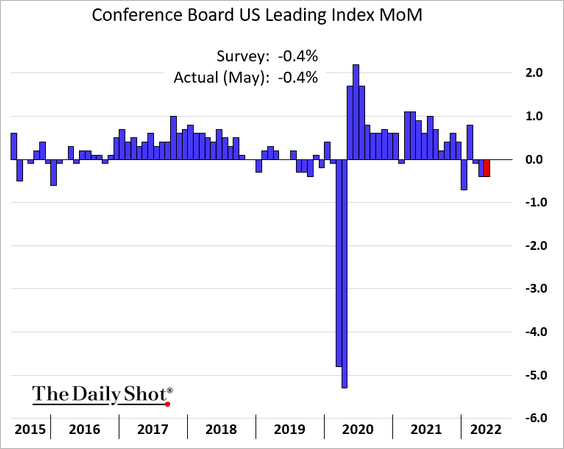
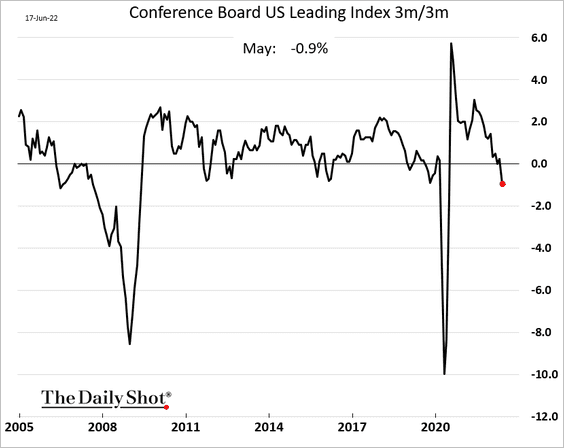
1. We continue to see evidence of slowing economic growth in the US. The Conference Board’s index of leading indicators was down for three months in a row.
This chart shows the rolling 3-month changes in the Conference Board’s index.
——————–
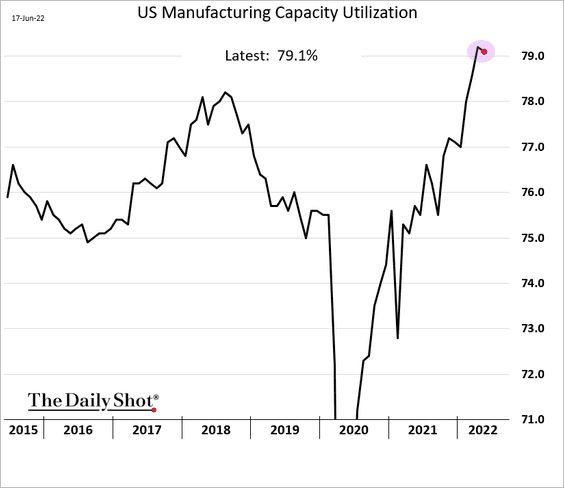
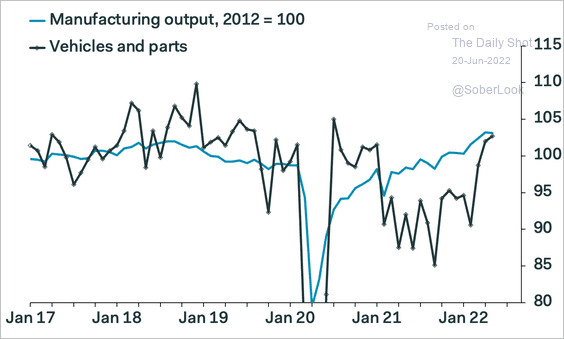
2. US manufacturing output unexpectedly declined last month.
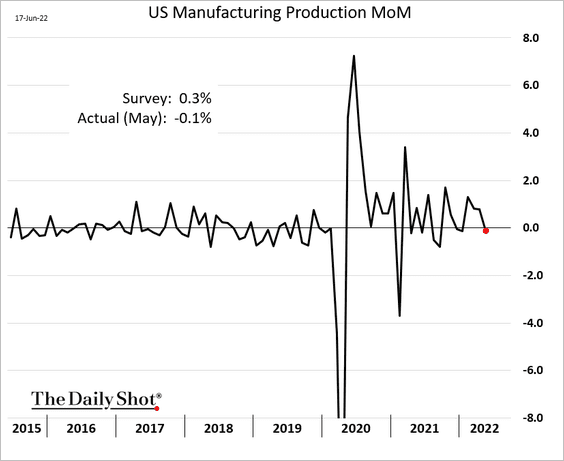
To be sure, factories remained busy in May, but these could be the first “hard data” signs of a slowdown in manufacturing activity.
Vehicle production has been rebounding (replenishing inventories).
 Source: Pantheon Macroeconomics
——————–
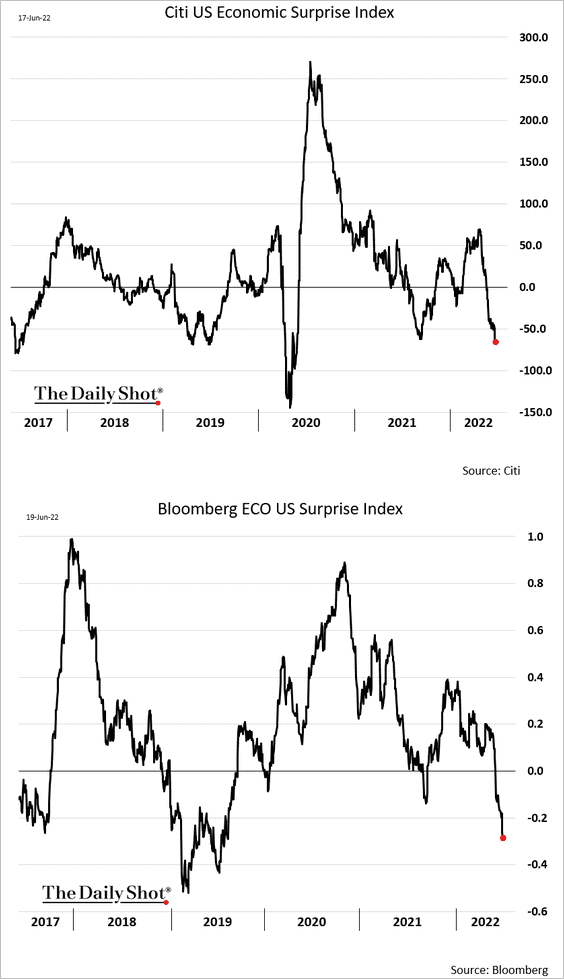
3. Economic surprise indicators are down sharply.
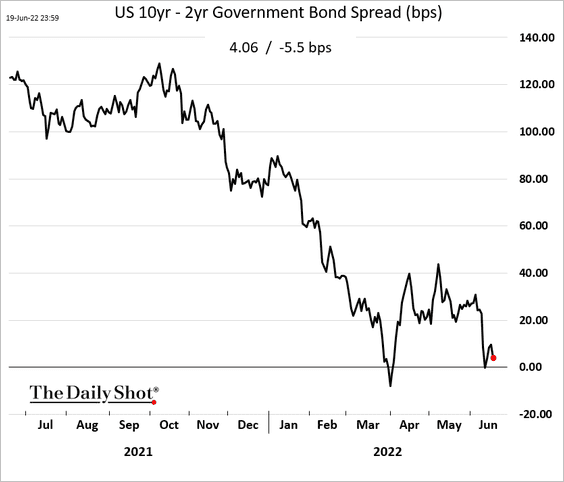
4. The 10yr – 2yr Treasury spread is flirting with inversion.
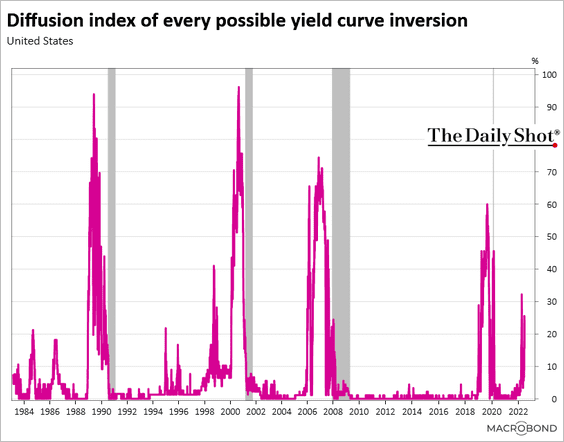
This indicator looks at inversions across the curve. The only reason it’s not higher is that the front end of the curve remains steep as the market prices in Fed rate hikes.
 Source: Chart and data provided by Macrobond
——————–
5. Wealth destruction has been massive in this cycle, which is likely to create a drag on consumption.
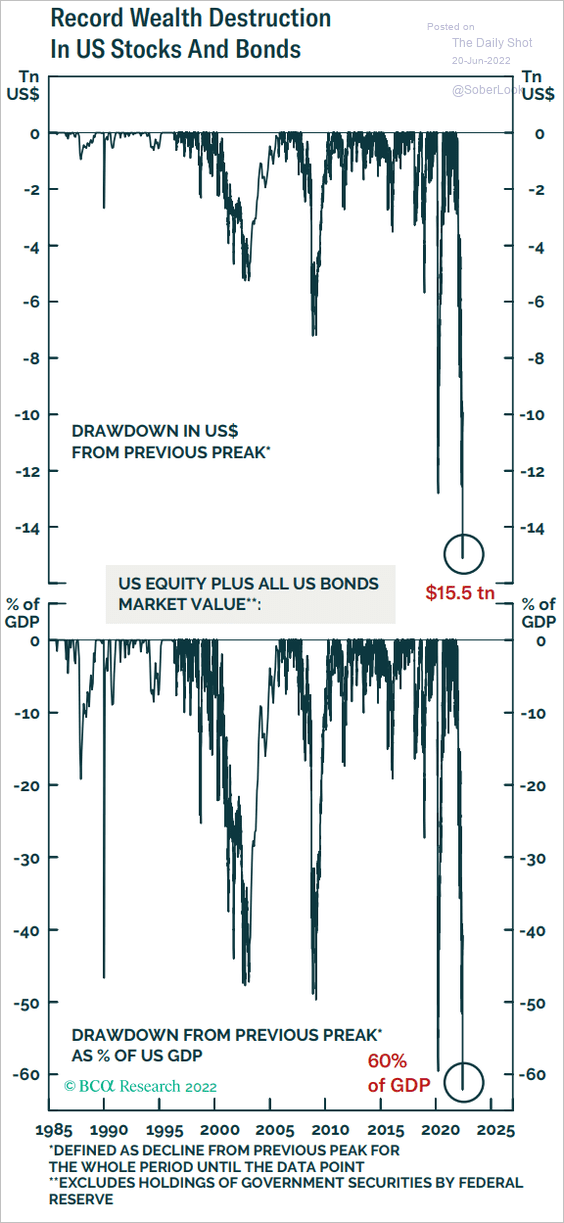 Source: BCA Research
6. The market expects faster rate hikes since the May CPI shock, but the “terminal” (maximum) rate has declined.
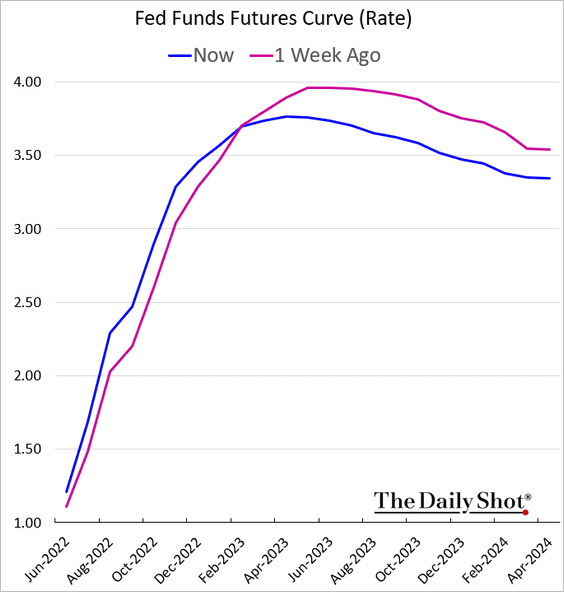
Market pricing for the terminal rate is consistent with the dot plot.
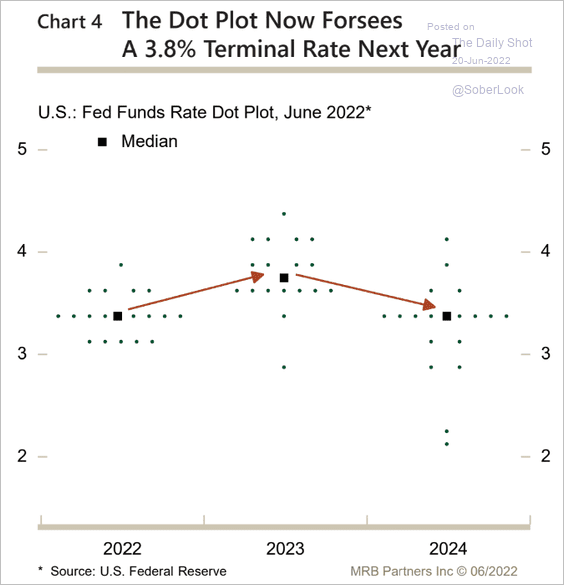 Source: MRB Partners
Will the terminal rate be high enough to achieve the Fed’s inflation-fighting goal? We want to compare it to the neutral (or “longer-run”) rate. The Fed’s expectation for the neutral rate (chart below) is roughly in line with the market (2nd chart below).
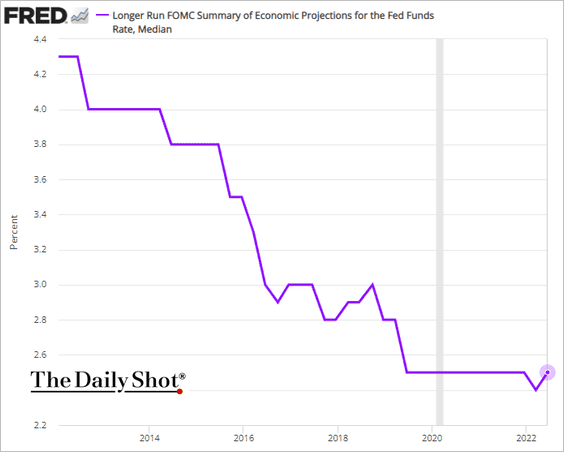

That puts the spread between the terminal and the neutral rate in the range of 110 – 130 bps. Will that be enough to sufficiently slow demand? What if the neutral rate is actually much higher?
——————–
7. The market expects the headline CPI to peak above 9%.
 Source: Morgan Stanley Research
8. The US dollar rally in this cycle has been unusually sharp.
 Source: MarketDesk Research
Back to Index
Canada
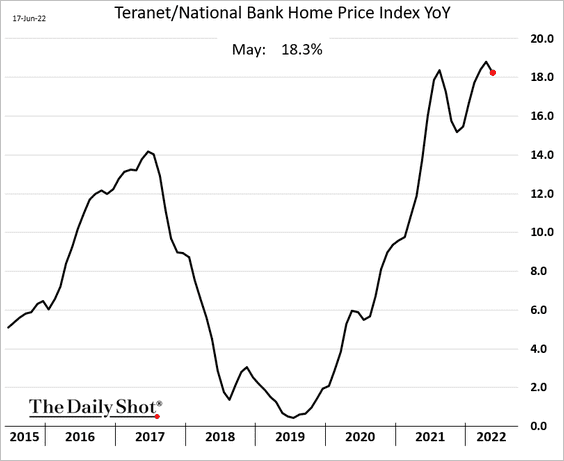
1. Home price appreciation ticked lower but remains near record levels.
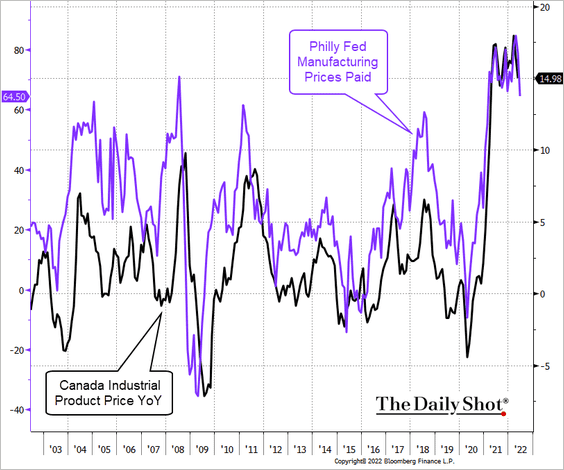
2. The US Philly Fed’s manufacturing “prices paid” indicator leads Canada’s industrial product price index. For now, there are no meaningful signs of relief.
 Source: @TheTerminal, Bloomberg Finance L.P.
Back to Index
The United Kingdom
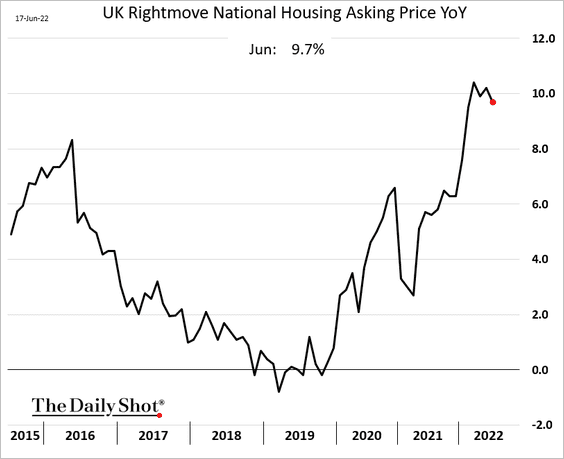
1. Home price appreciation is holding up well despite severe weakness in consumer sentiment.
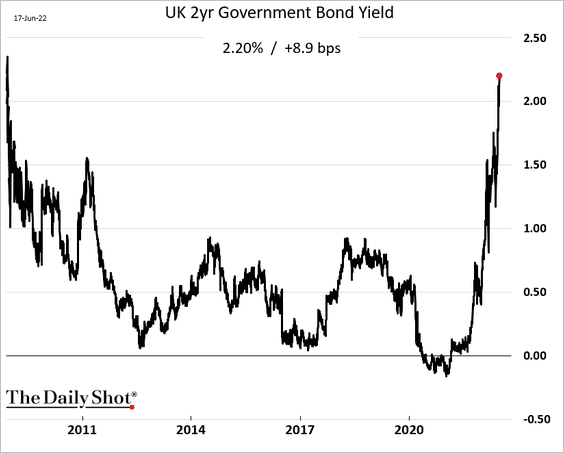
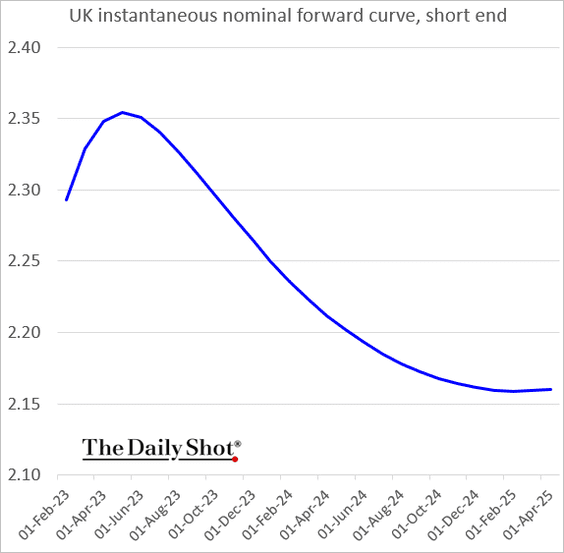
2. The 2yr gilt yield hit the highest level since 2008.
3. The market pricing for the BoE terminal (maximum) rate is slightly above 2.35%. Too low?
 Source: BoE
Back to Index
Europe
1. Growth expectations for the euro area are now higher than the US.
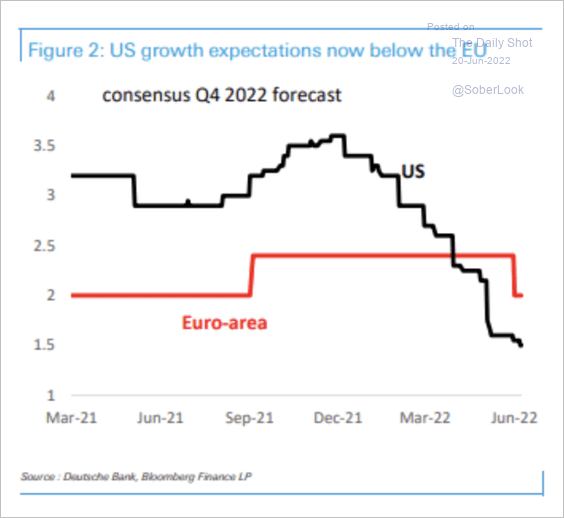 Source: Deutsche Bank Research
2. Service inflation is expected to keep climbing.
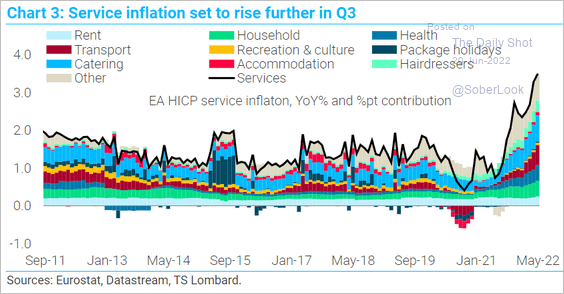 Source: TS Lombard
3. Germany is taking additional measures to reduce gas consumption as Russia slows supplies to Europe. The nation will restart coal-fired power plants and offer incentives.
 Source: Ministry of Economics and Technology, h/t @JavierBlas Read full article
4. Eurozone inventories have started to recover.
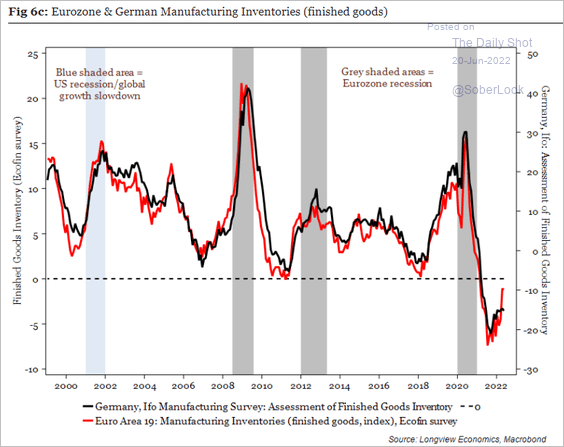 Source: Longview Economics
5. Pantheon Macroeconomics expects the SNB rate hikes to outpace the ECB.
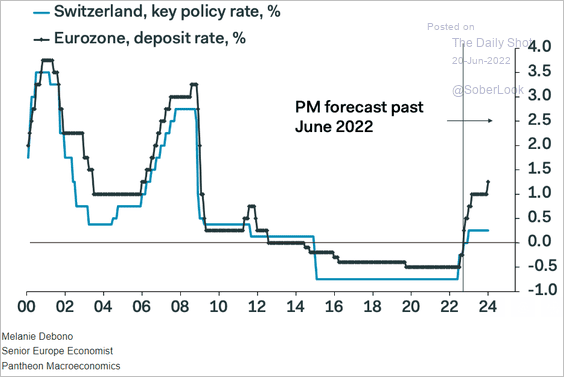 Source: Pantheon Macroeconomics
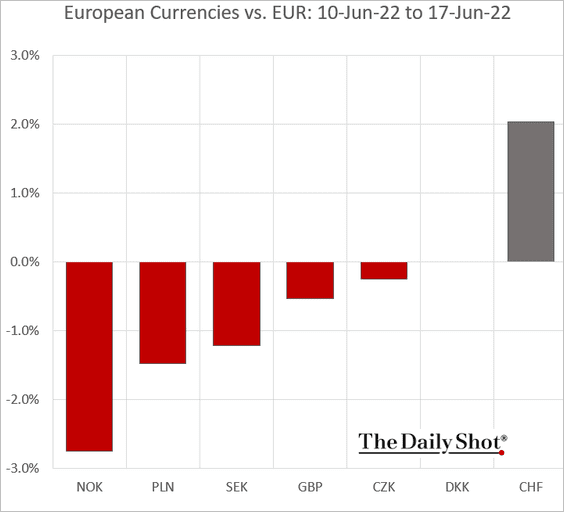
6. Here are last week’s European currency moves vs. the euro.
Back to Index
China
1. Credit growth is picking up.
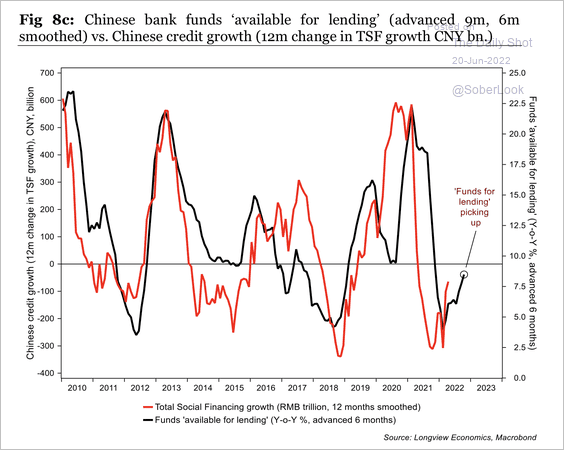 Source: Longview Economics
2. Housing starts and property transactions have reached extreme lows. Are we near the bottom?
![]() Source: Longview Economics
Source: Longview Economics
3. Bond yields are now firmly below US Treasuries.
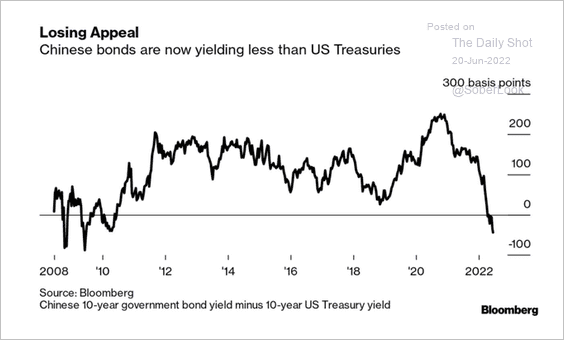 Source: @acemaxx, @markets Read full article
4. Here are the drivers of Goldman’s 2022 GDP growth forecast change.
 Source: @acemaxx, @GoldmanSachs
Back to Index
Emerging Markets
1. Brazil’s central bank is expected to keep rates elevated for some time.
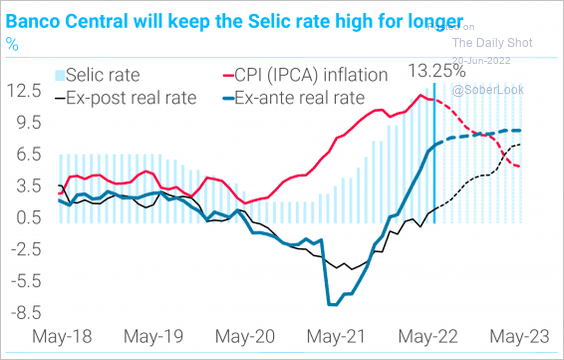 Source: TS Lombard
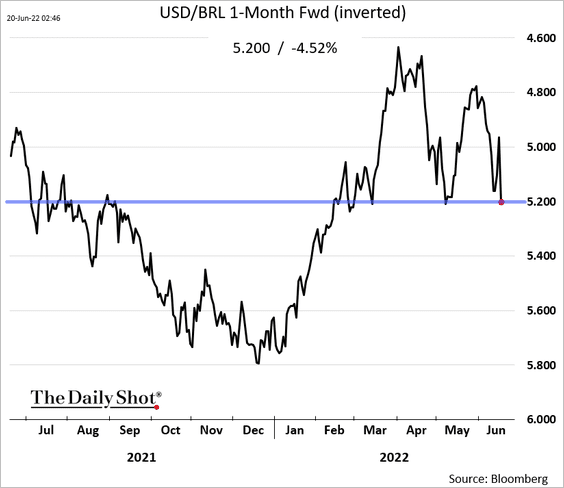
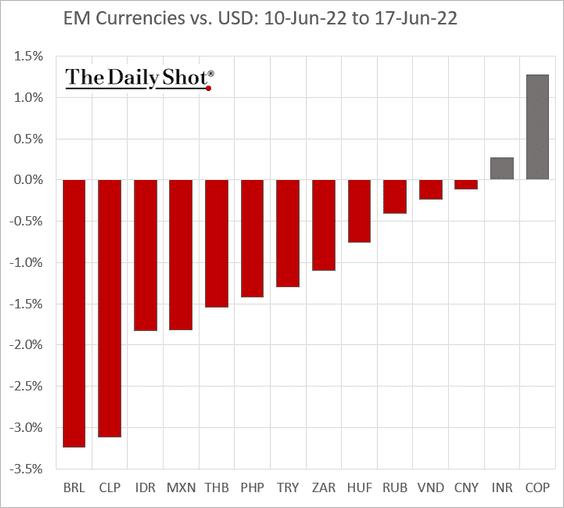
The Brazilian real took a hit on Friday.
——————–
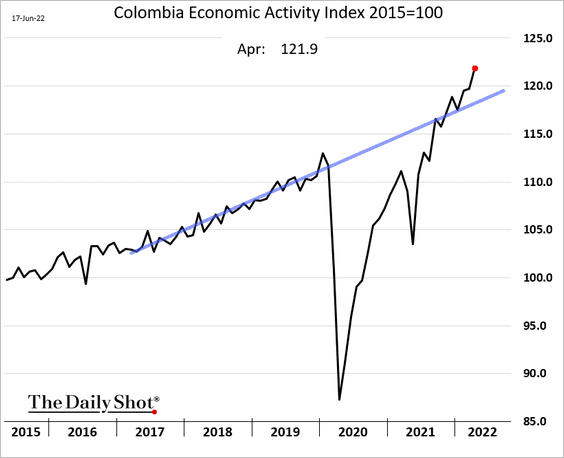
2. Colombia’s economic activity has been moving above the pre-COVID trend.
3. EM stocks and bonds have been outperforming DM.
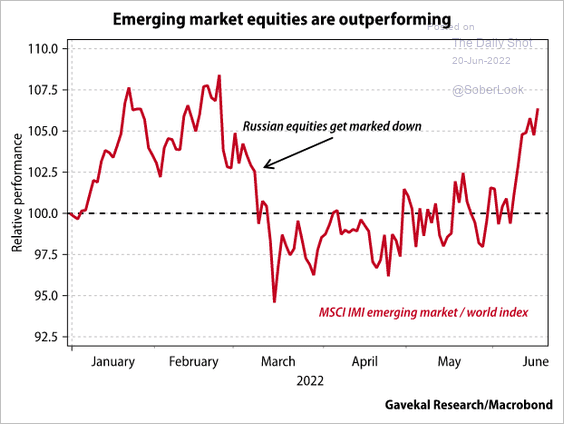 Source: Gavekal Research
 Source: Gavekal Research
——————–
4. Next, we have some performance data from last week.
• Currencies:
• Sovereign yields (European debt sold off sharply as inflation surges).

• Equity ETFs:

Back to Index
Cryptocurrency
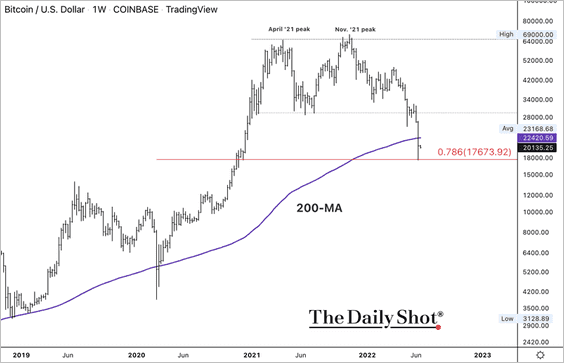
1. There was some panic selling over the weekend. Bitcoin dipped below $18k but rebounded to trade near $20k again.
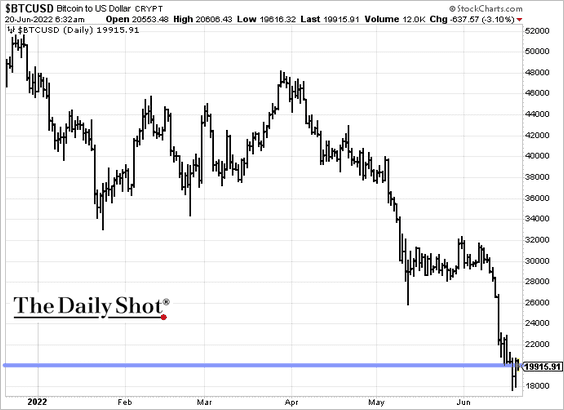
The cryptocurrency broke below its 200-week moving average but stabilized at the $17,673 support level.
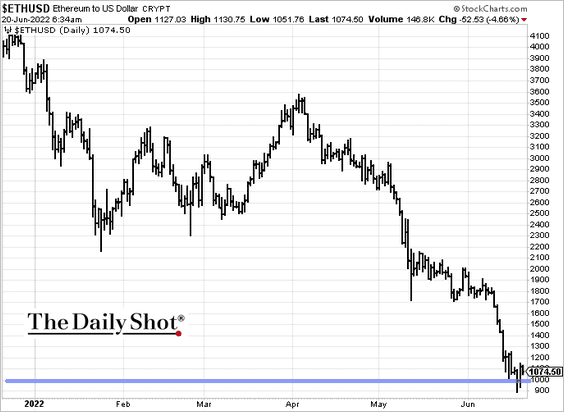
Ether dipped below $900, but is now trading near $1,100
——————–
2. The crypto market signaled capitulation as realized losses surged.
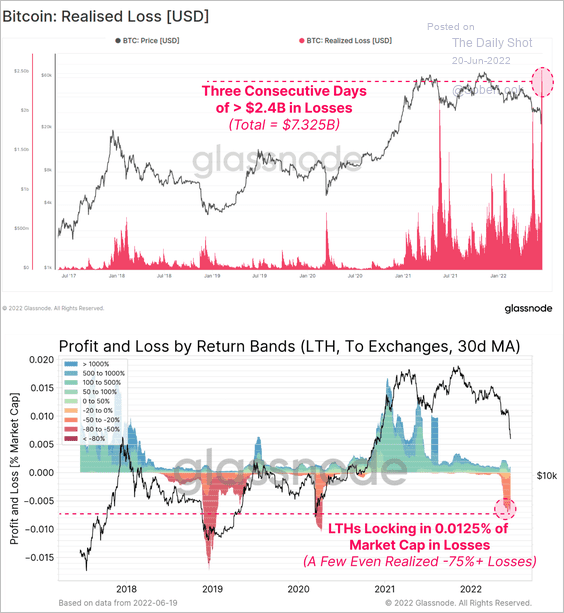 Source: @glassnode
3. Almost all bitcoin wallet cohorts (especially those holding 1-100 BTC) are facing significant unrealized losses, worse than March 2020.
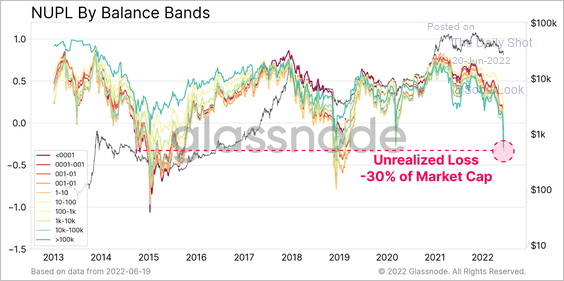 Source: @glassnode
4. Bitcoin’s current drawdown is still less than the March 2020 and December 2018 extremes.
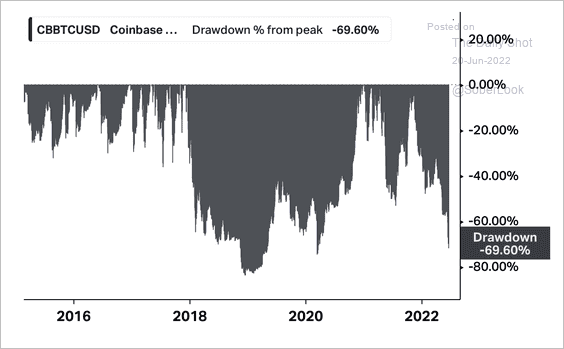 Source: Koyfin
Here is a look at ETH/USD’s drawdown.
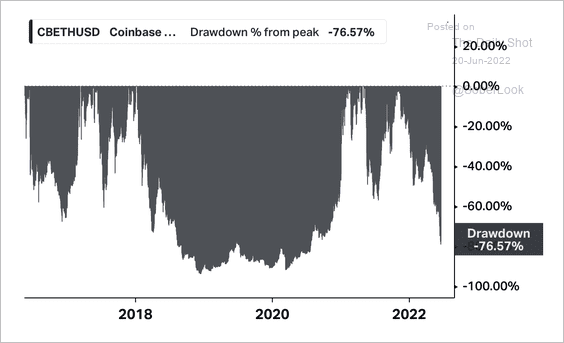 Source: Koyfin
Back to Index
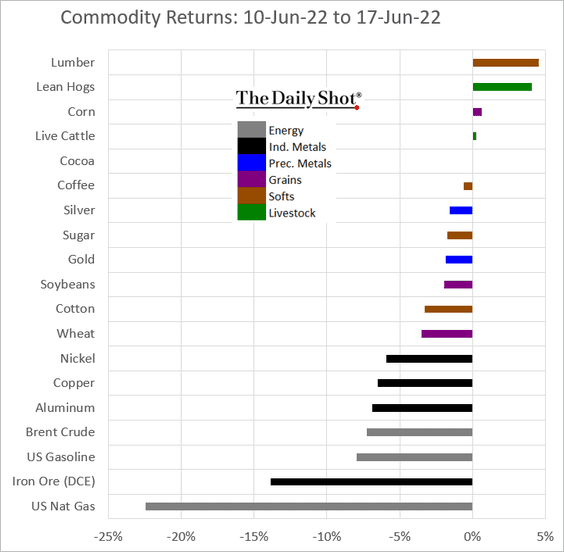
Commodities
1. Iron ore is now down year-to-date as China’s COVID-related headwinds persist.
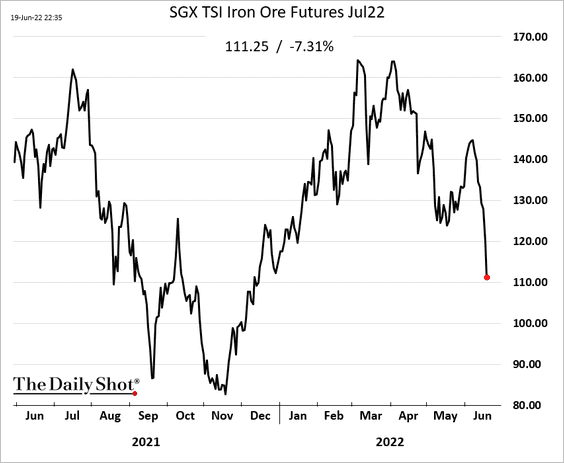
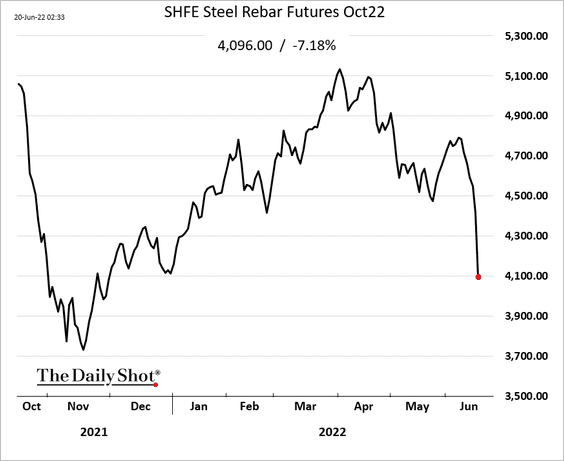
The Shanghai steel rebar futures are also down on the year.
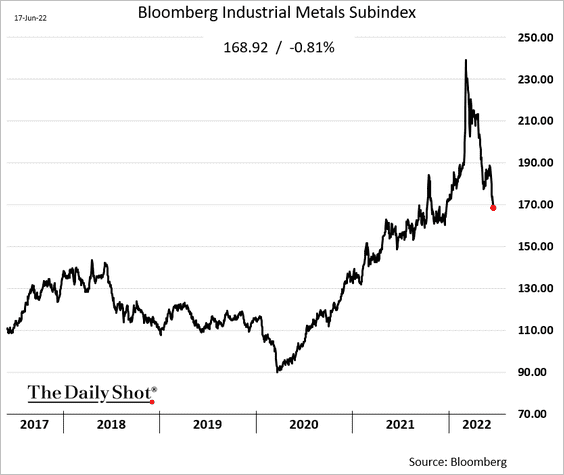
2. Here is Bloomberg’s industrial metals index.
3. Gold is holding support relative to the S&P 500.
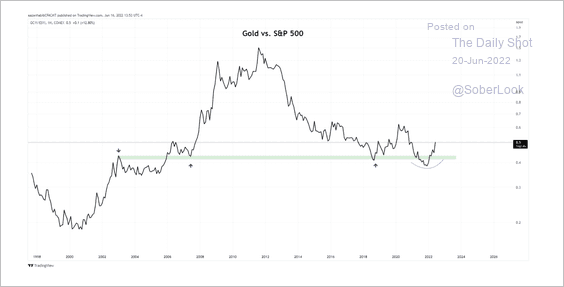 Source: Aazan Habib; Paradigm Capital
4. Next, we have last week’s performance across key commodity markets.
Back to Index
Energy
1. Europe’s LNG demand is expected to grow rapidly over the next few years, …
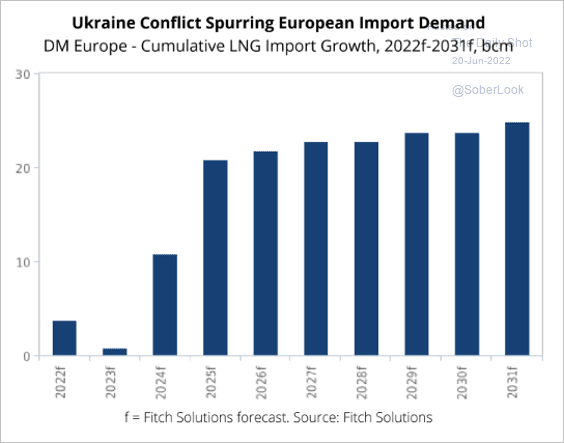 Source: Fitch Solutions Macro Research
… as it builds out its LNG import capacity.
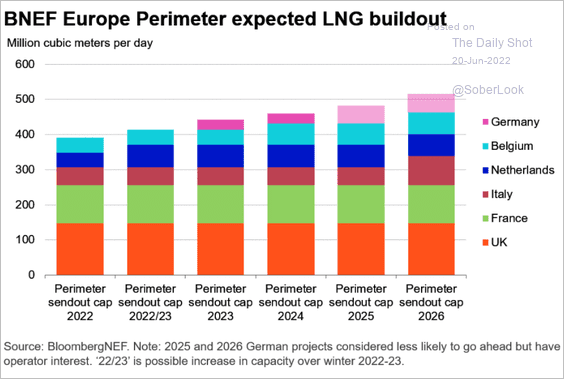 Source: @BloombergNEF Read full article
——————–
2. This chart shows Europe’s dependence on foreign natural gas suppliers.
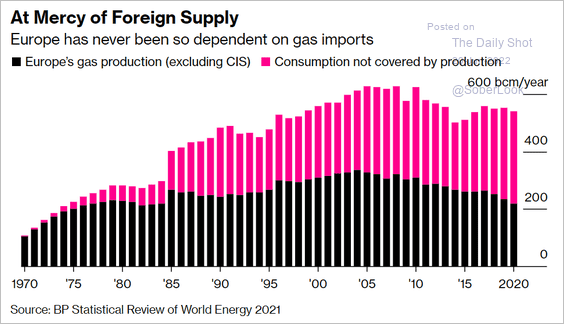 Source: @bpolitics Read full article
3. US gasoline price surge was exacerbated by shrinking refining capacity.
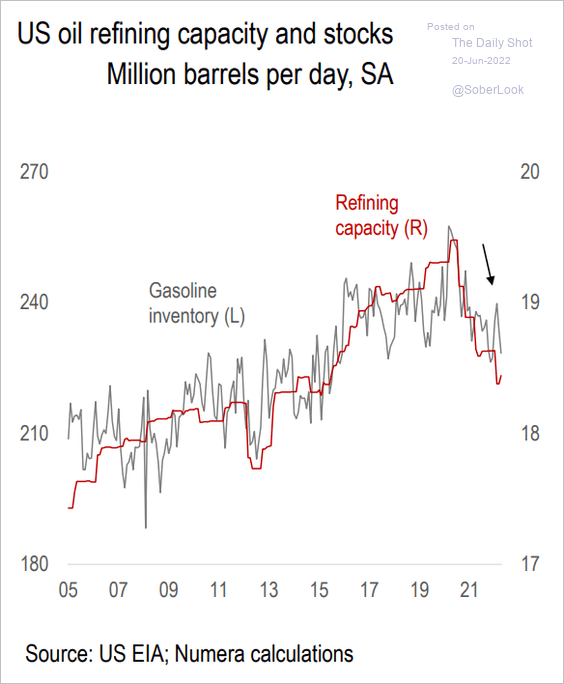 Source: Numera Analytics
Back to Index
Equities
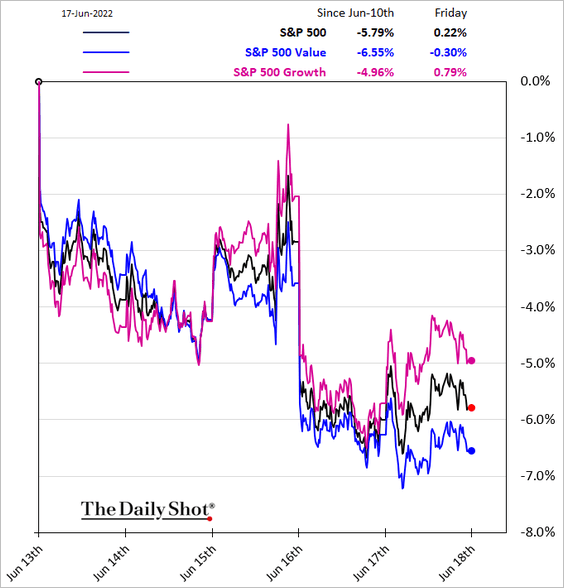
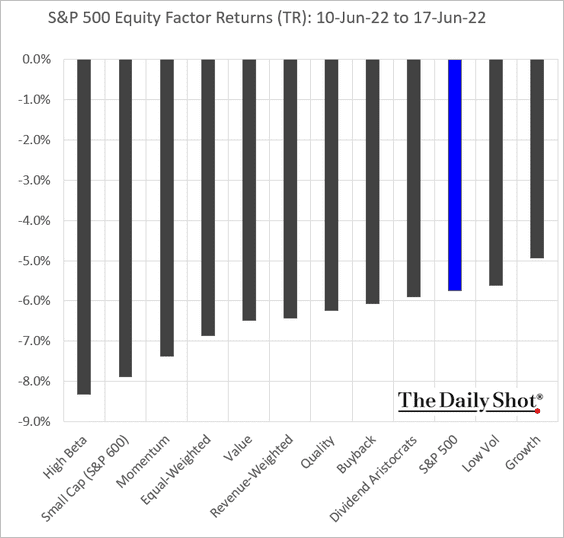
1. Let’s begin with some equity factor updates.
• Growth stocks outperformed on Friday.
By some measures, mega-cap valuations are attractive. This chart shows the ratio of enterprise value to forward earnings (EBITDA) for three of the largest firms.
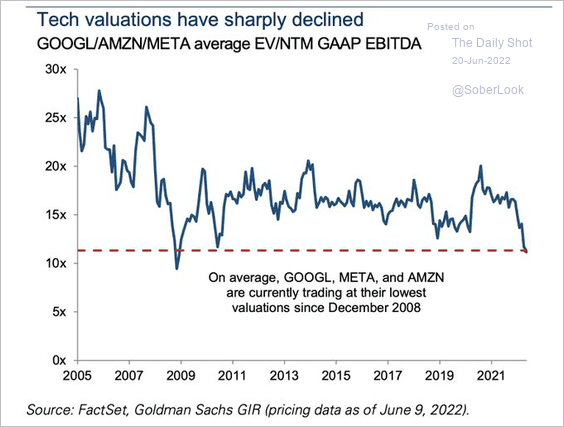 Source: @acemaxx, @GoldmanSachs
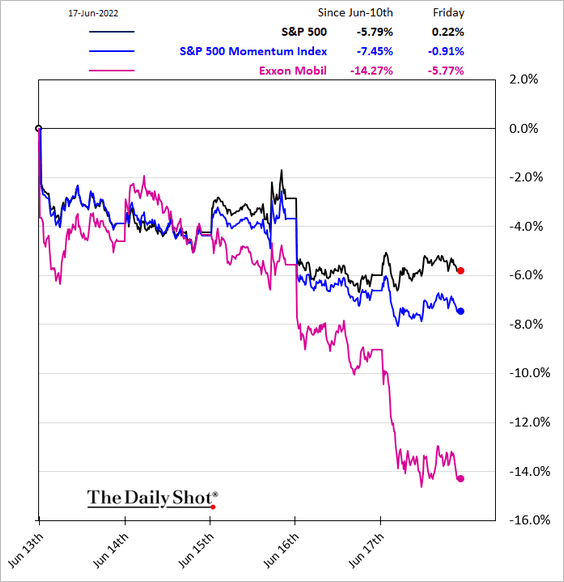
• The momentum factor got whipsawed again as energy shares sold off.
• Small caps underperformed last week.
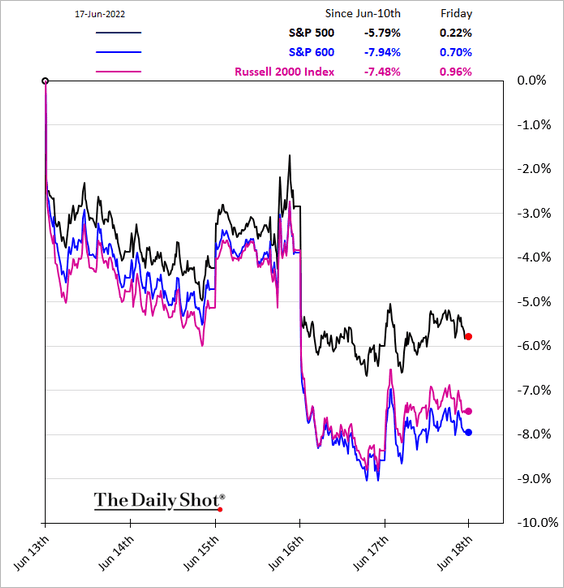
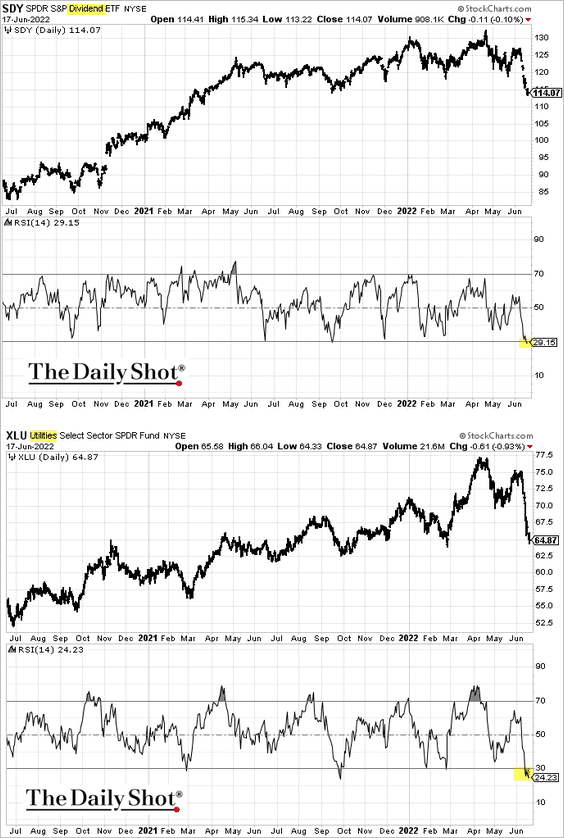
• Technical indicators suggest that high-dividend shares are oversold.
• Here is last week’s performance across equity factors.
——————–
2. The 60/40 portfolio is having the worst quarter in years.
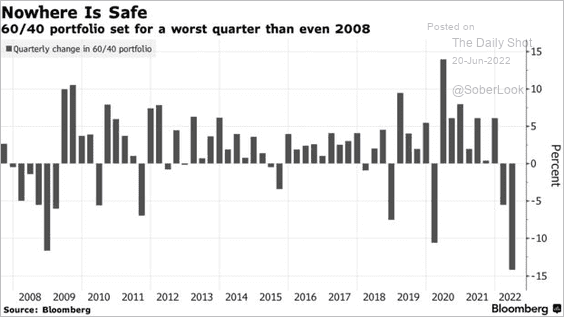 Source: @worrachate, @mccormickliz, @markets Read full article
This bear market has been more severe than previous cycles thus far.
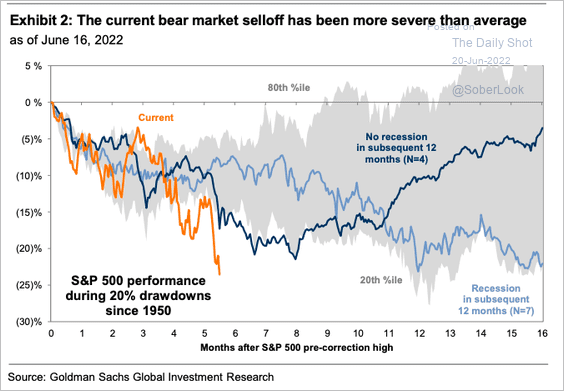 Source: Goldman Sachs; @SamRo
——————–
3. The S&P 500 is approaching initial support at its 200-week moving average.
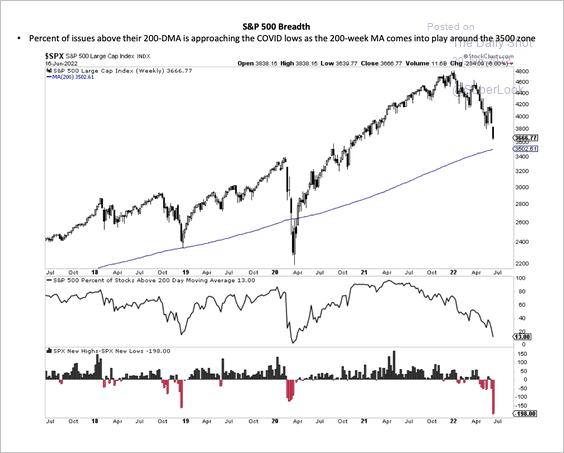 Source: Aazan Habib; Paradigm Capital
4. Volatility remains elevated.
• Number of 1%+ moves in the S&P 500:
 Source: SPDR Americas Research, @mattbartolini
• QQQ and SPY implied vol:
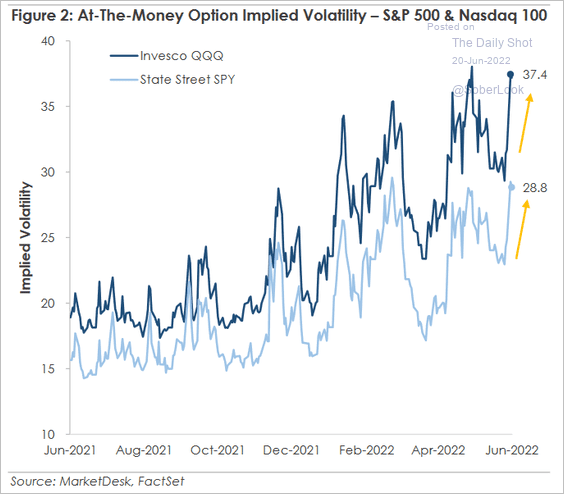 Source: MarketDesk Research
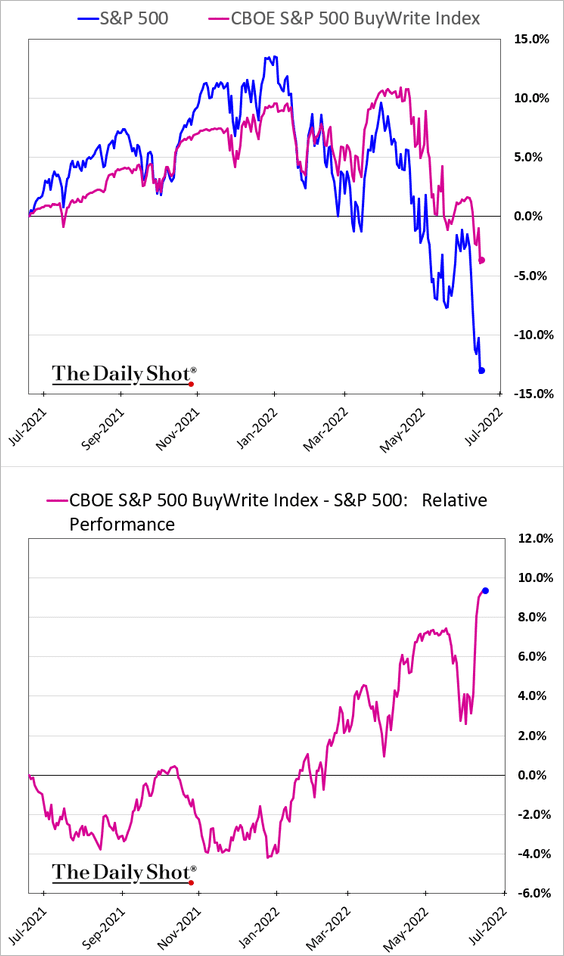
5. The buy-write strategy on the S&P 500 has been outperforming. Selling calls in the high-vol environment has been lucrative (more information here).
6. Below are the most shorted sectors.
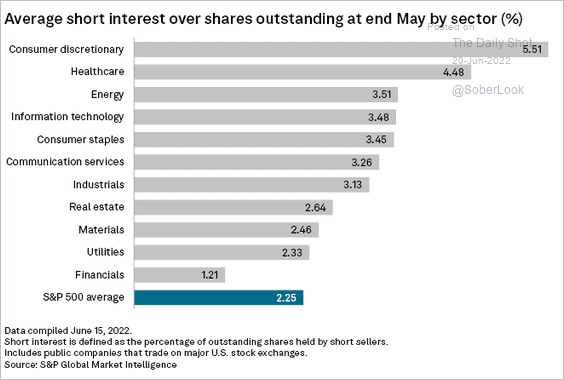 Source: S&P Dow Jones Indices
7. The US dollar strength can help offset inflationary pressures, but it’s becoming a headwind for corporate earnings.
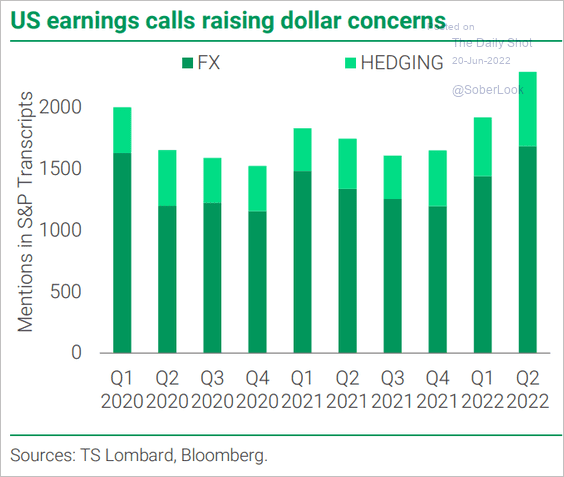 Source: TS Lombard
8. Watch the ISM manufacturing PMI for signs of deterioration in corporate earnings.
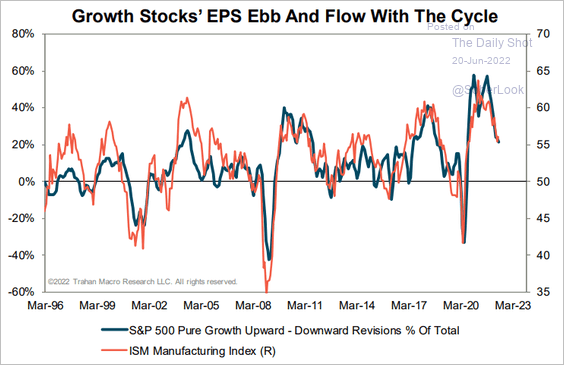 Source: Trahan Macro Research
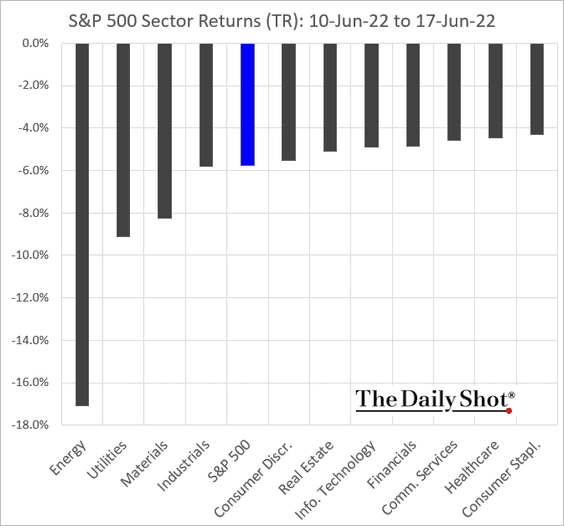
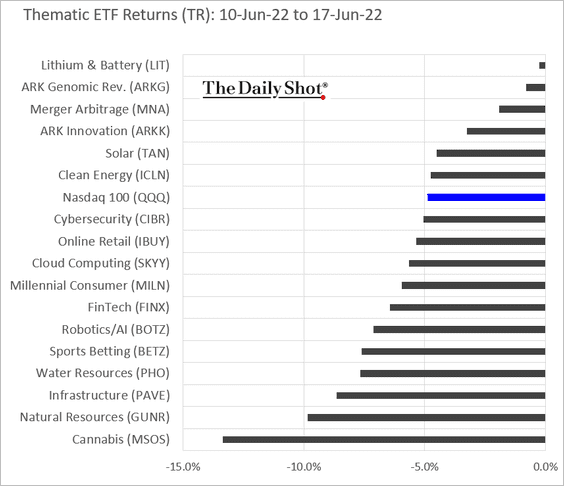
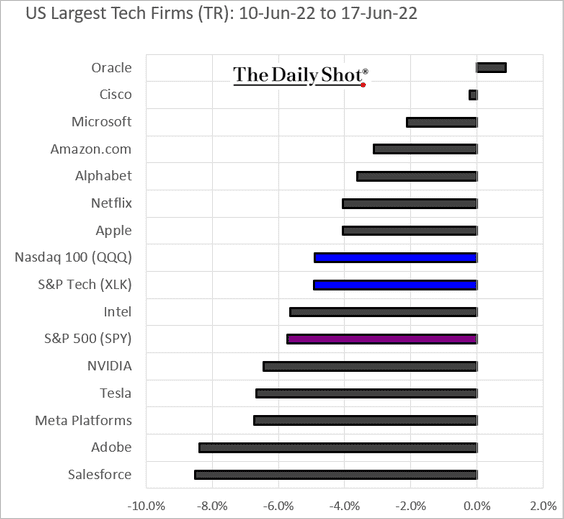
9. Next, we have some additional performance data from last week.
• Sectors:
• Thematic ETFs:
• The largest US tech firms:
Back to Index
Credit
1. Higher interest rates and an economic growth shock could challenge more indebted sovereigns.
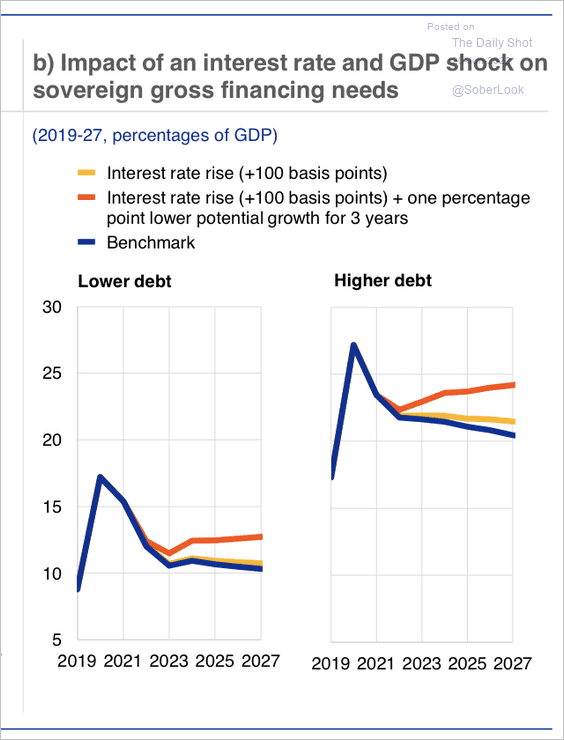 Source: ECB
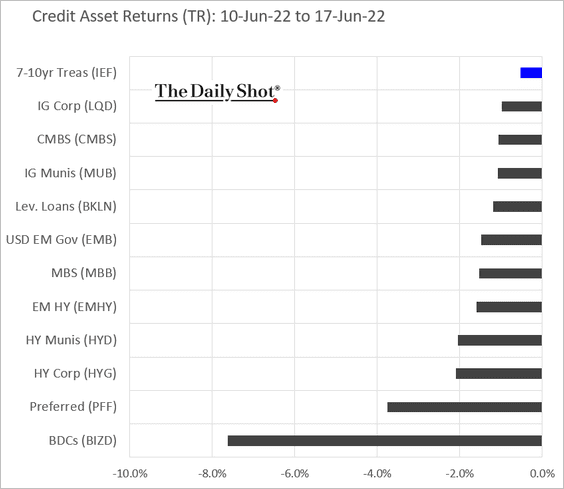
2. This chart shows last week’s returns by asset class.
Back to Index
Global Developments
1. It’s been a rough quarter for global stocks and bonds.
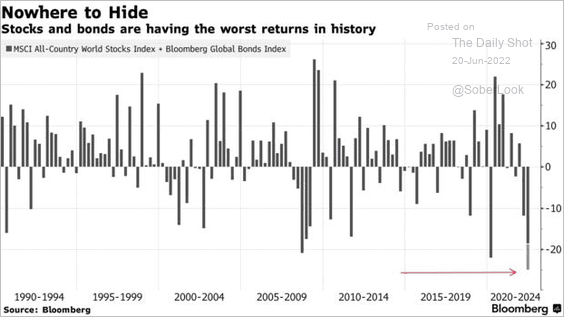 Source: @markets Read full article
2. Key metrics point to some moderation in supply-chain-driven price pressures.
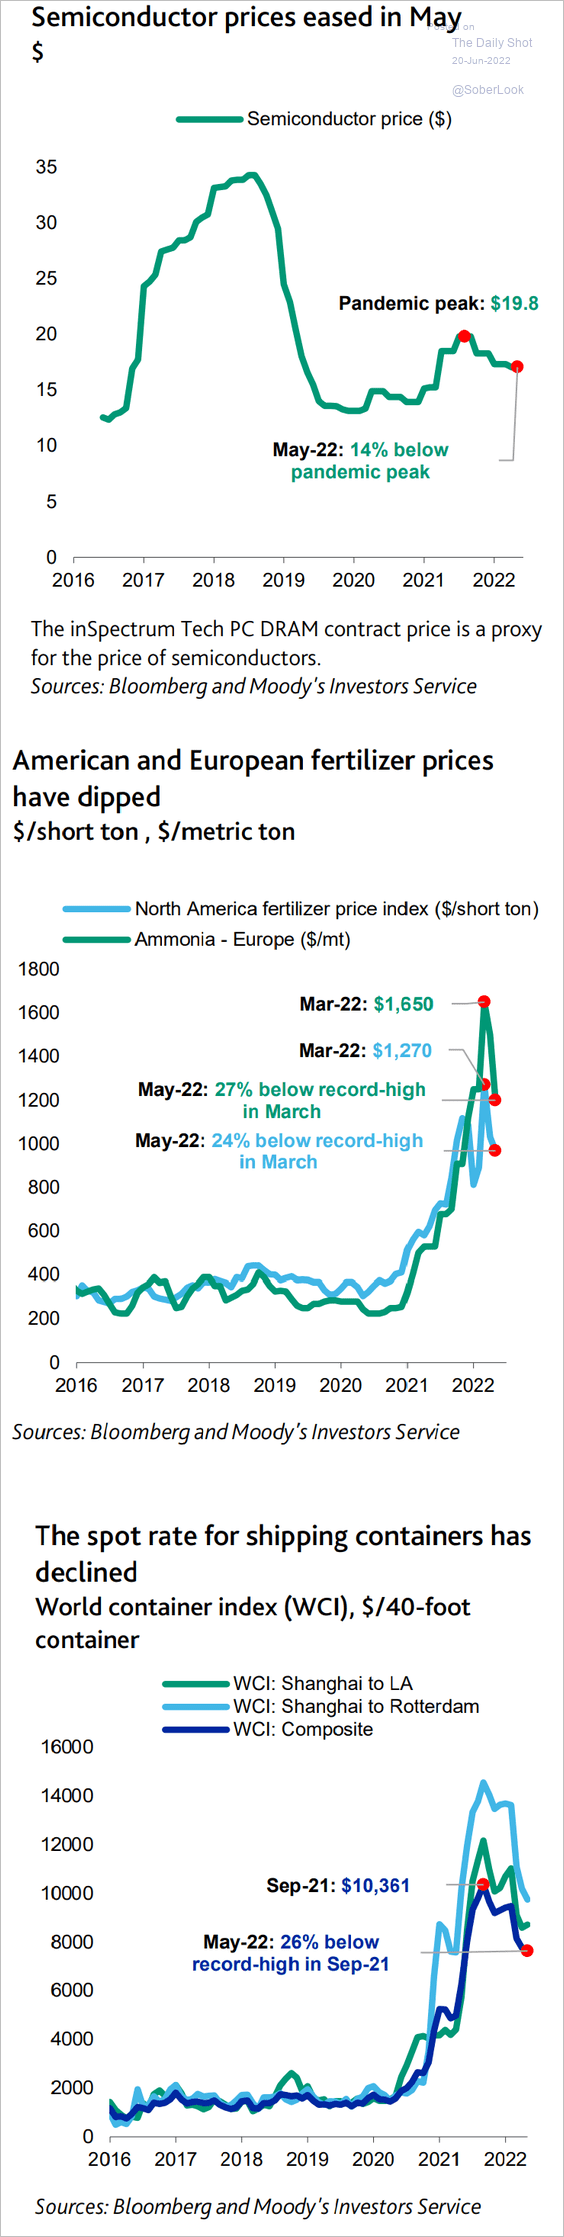 Source: Moody’s Investors Service
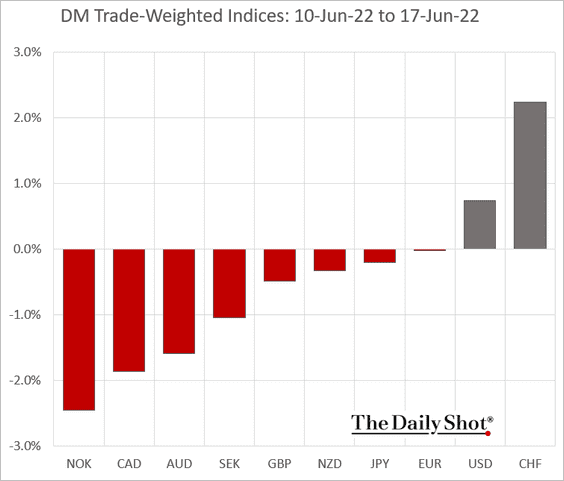
3. Next, we have some performance data from last week.
• DM currencies:
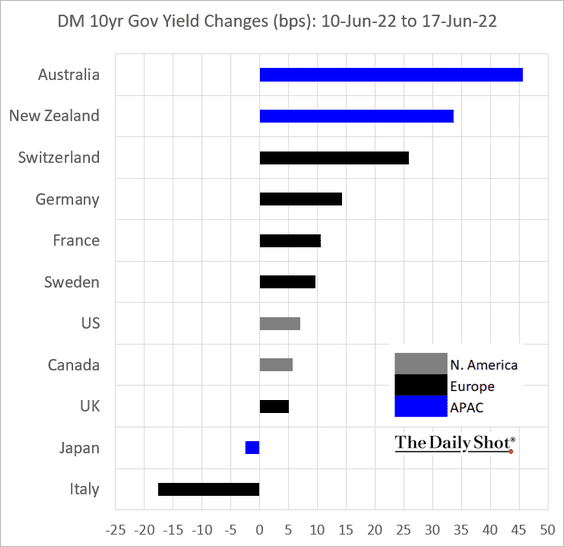
• DM bond yields:
——————–
Food for Thought
1. Economies ranked by projected GDP:
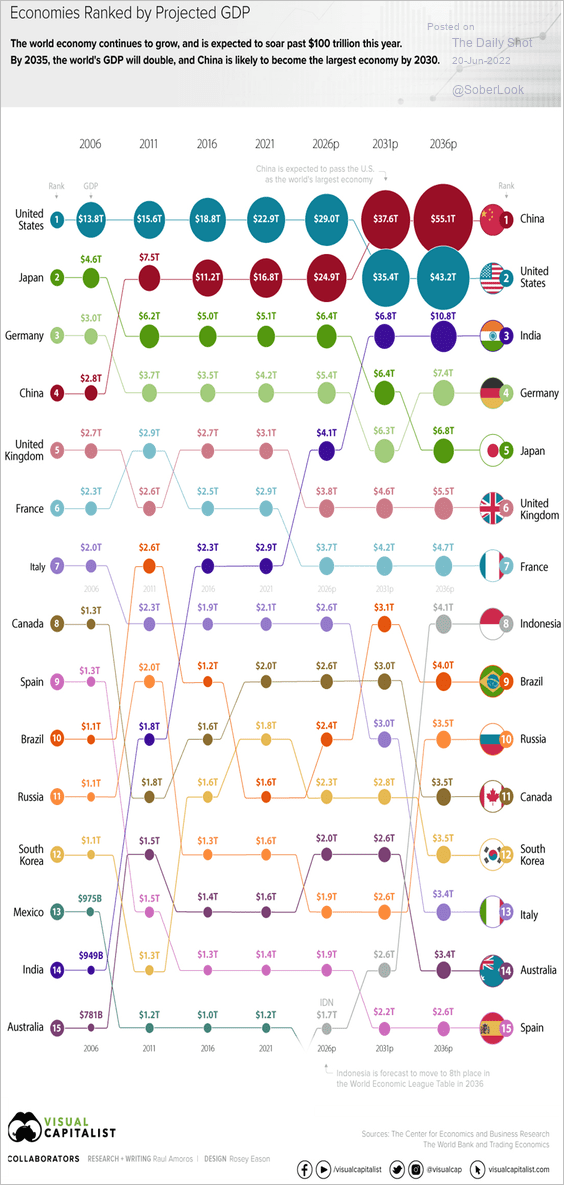 Source: Visual Capitalist Read full article
2. Share of wealth ownership by wealth group:
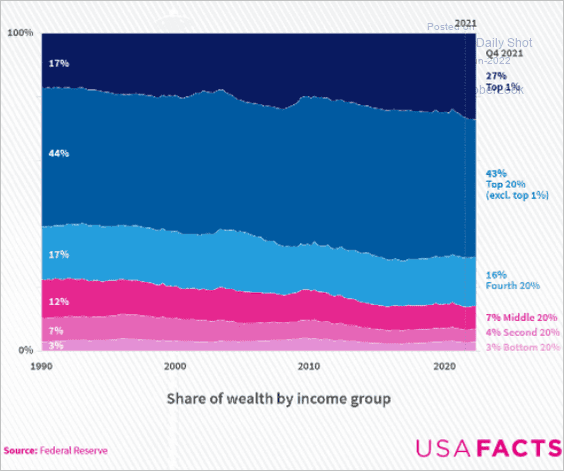 Source: USAFacts
3. Books banned in schools and libraries:
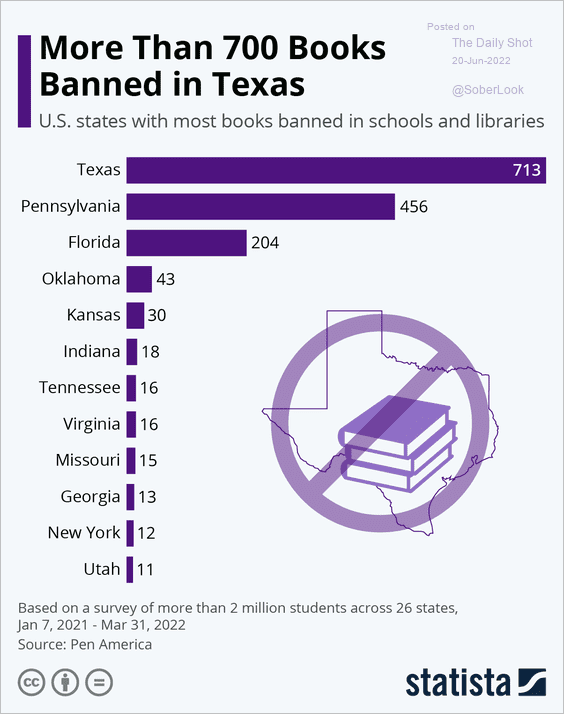 Source: Statista
4. US consumer sentiment by political affiliation (the U. Michigan survey):
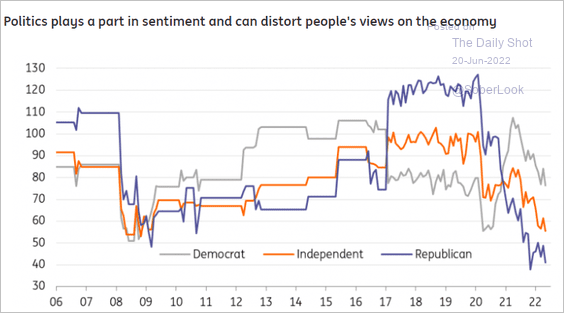 Source: ING
5. Imprisoned Hong Kong opposition leaders:
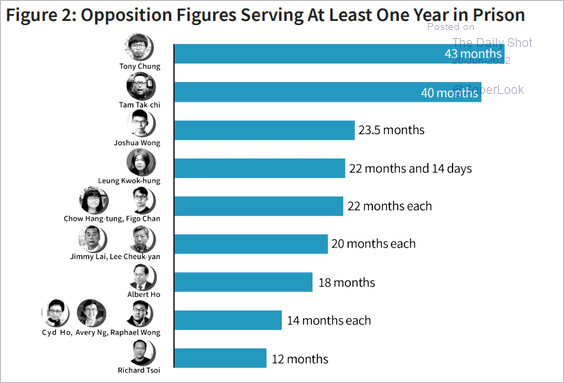 Source: HKDC Read full article
6. Countries with the highest life expectancy:
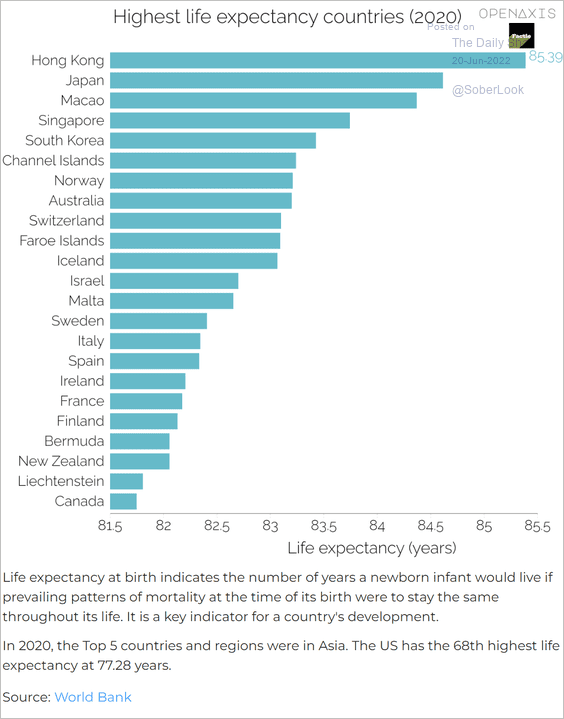 Source: OpenAxis
7. Number of enslaved people in the US (1790-1870):
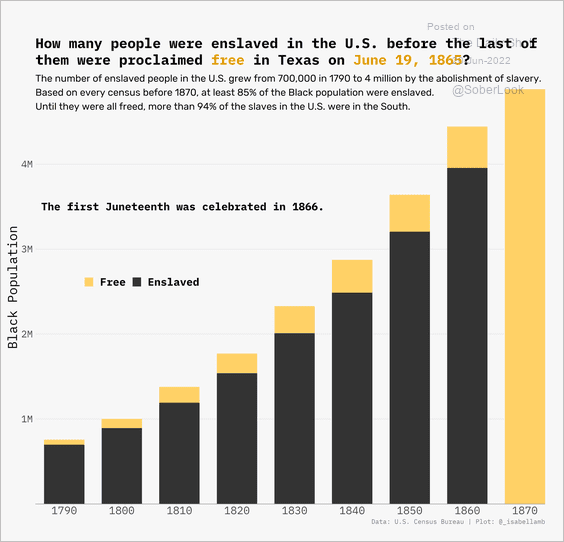 Source: @_isabellamb
——————–
Back to Index