The Daily Shot: 23-Aug-22
• The United States
• The United Kingdom
• The Eurozone
• Japan
• Asia – Pacific
• China
• Emerging Markets
• Cryptocurrency
• Commodities
• Energy
• Equities
• Rates
• Global Developments
• Food for Thought
The United States
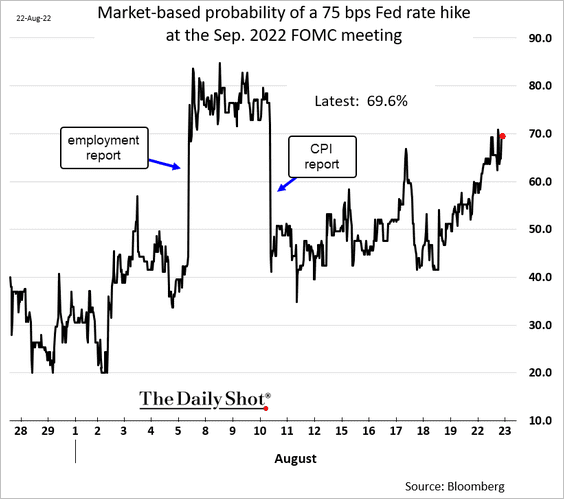
1. The probability of a 75 bps rate hike in September is near 70% as Fed officials strike a hawkish tone.
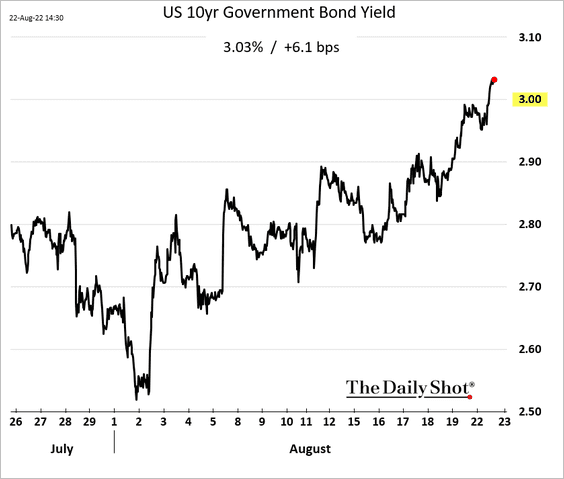
The 10-year Treasury yield is back above 3%.
——————–
2. Next, we have some updates on inflation.
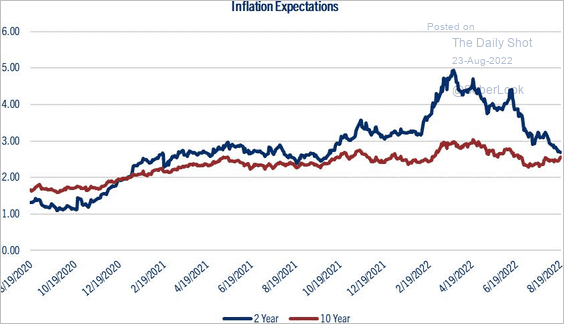
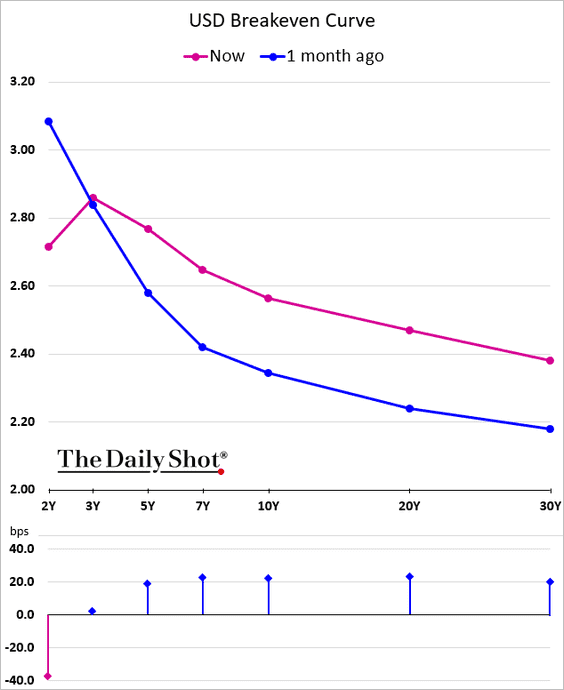
• The inflation expectations curve has flattened as oil prices moved lower.
 Source: John Lynch, Comerica Wealth Management
The market expects inflation to moderate in the short term but remain “higher for longer.”
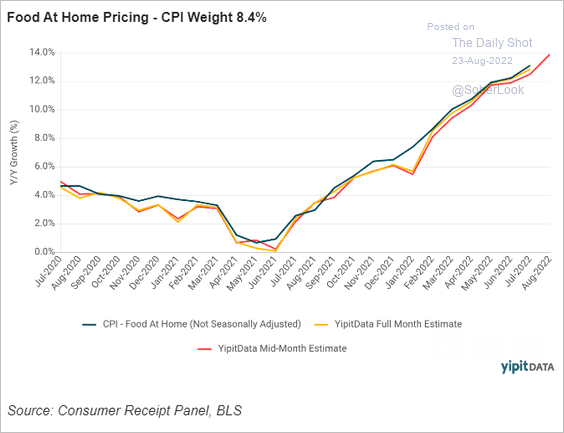
• Groceries’ inflation is nearing 14% this month, according to YipitData.
 Source: YipitData
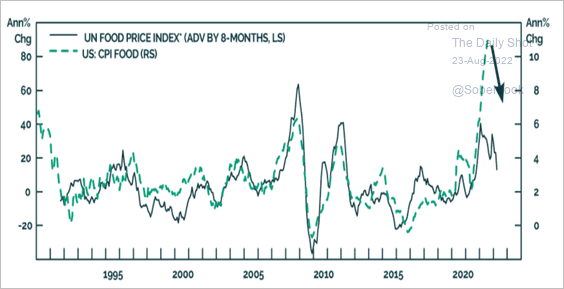
But food inflation should be on the way down in the months ahead.
 Source: BCA Research
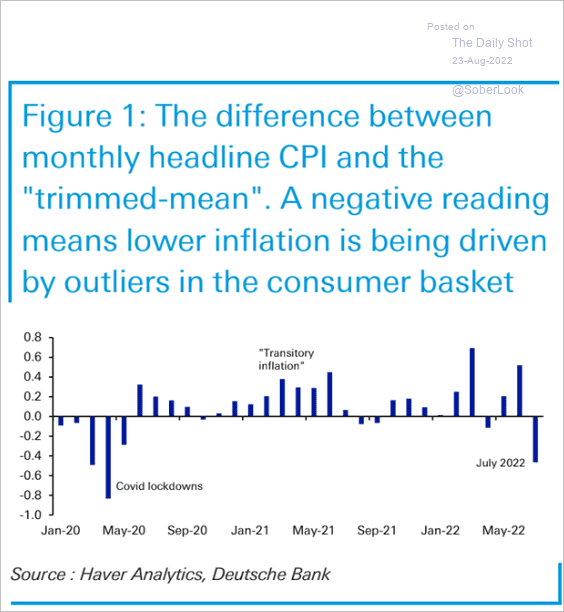
• Outliers drove the recent slowdown in the CPI. Inflation remains sticky.
 Source: Deutsche Bank Research
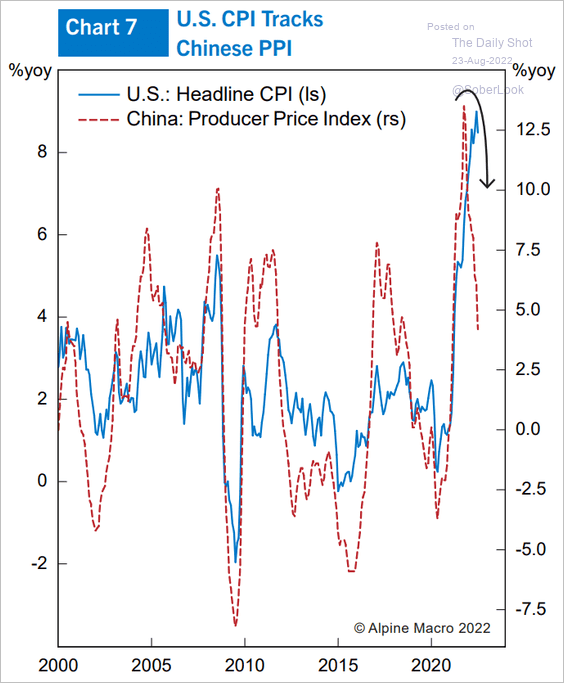
• Slower gains in China’s producer prices should help ease US consumer inflation.
 Source: Alpine Macro
——————–
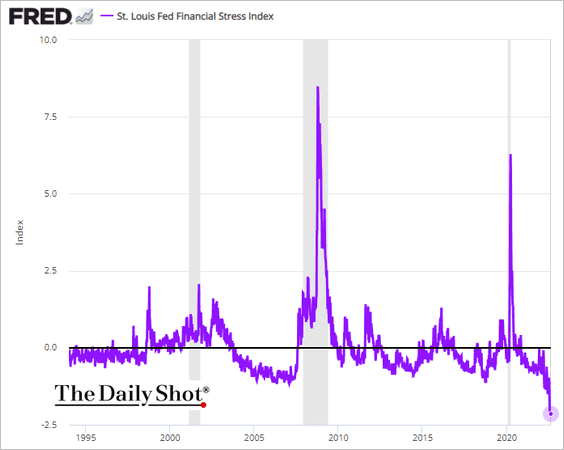
3. The St. Louis Fed’s financial stress index shows “no stress,” giving the Federal Reserve plenty of room to keep hiking rates.
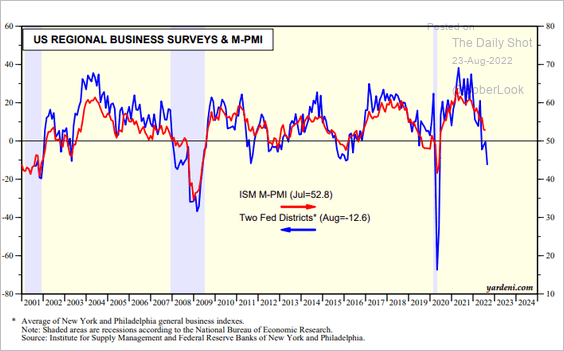
4. Regional Fed manufacturing gauges point to factory activity weakness at the national level.
 Source: Yardeni Research
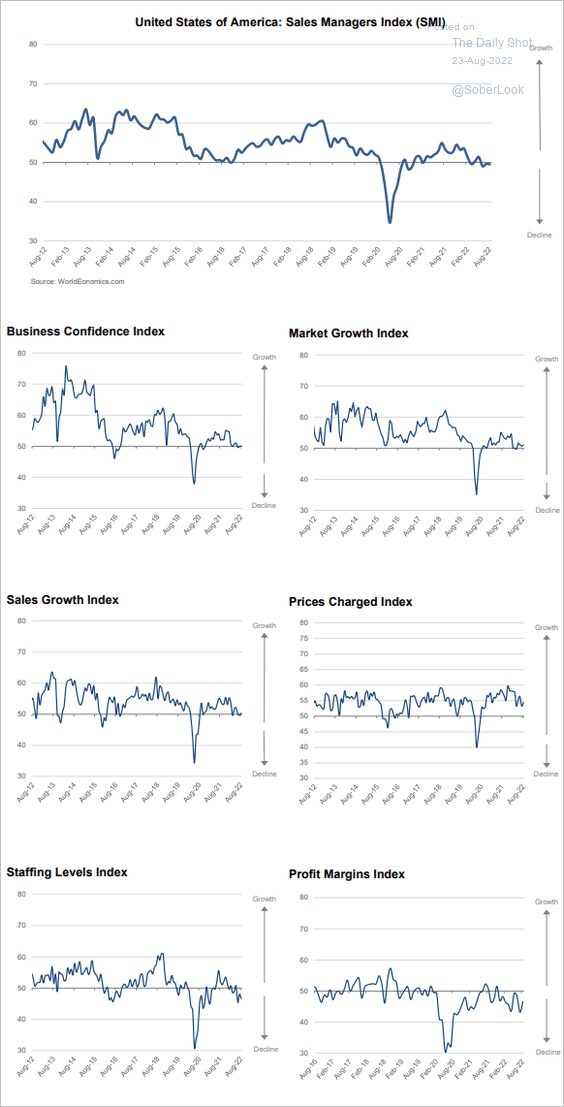
The World Economics SMI report suggests that business activity growth has stalled but is not crashing.
 Source: World Economics
——————–
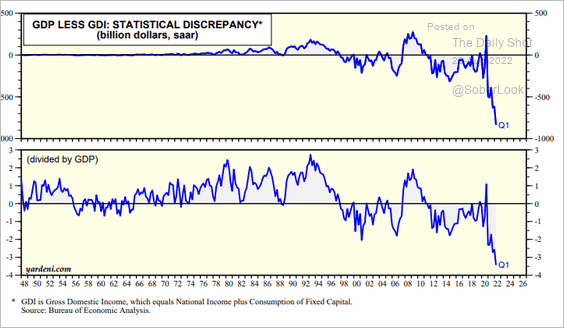
5. The GDP-GDI divergence may indicate an upward GDP revision for Q2.
 Source: Yardeni Research Read full article Further reading
6. Will we see further declines in vehicle sales?
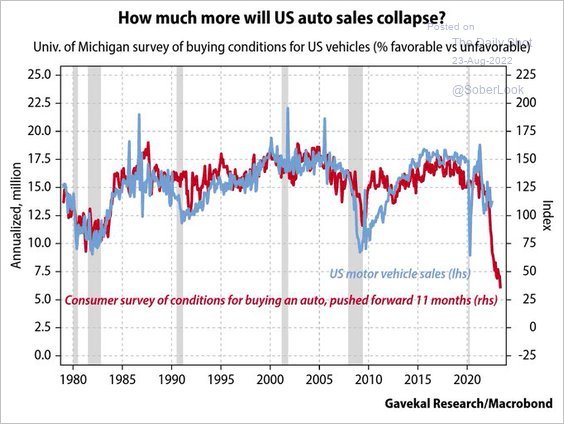 Source: @Gavekal
7. Retail sales as a share of total consumer spending remain elevated.
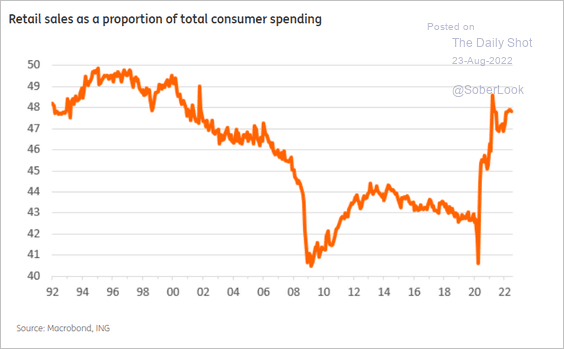 Source: ING
Back to Index
The United Kingdom
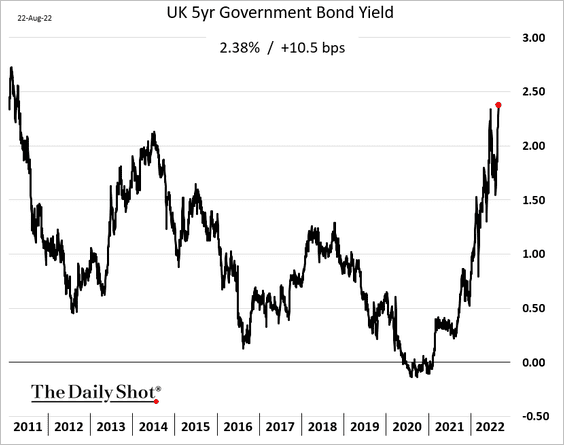
1. The 5-year gilt yield hit the highest level since 2011.
2. This chart shows the contributions to the UK workforce changes.
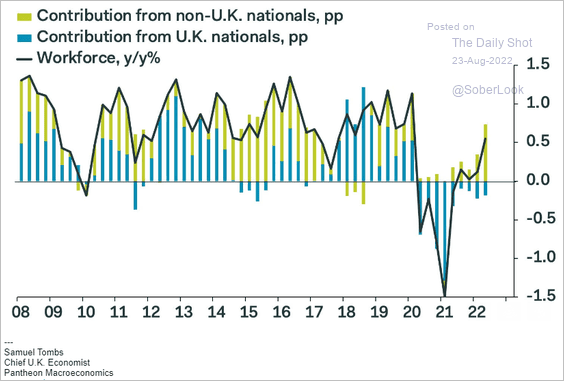 Source: Pantheon Macroeconomics
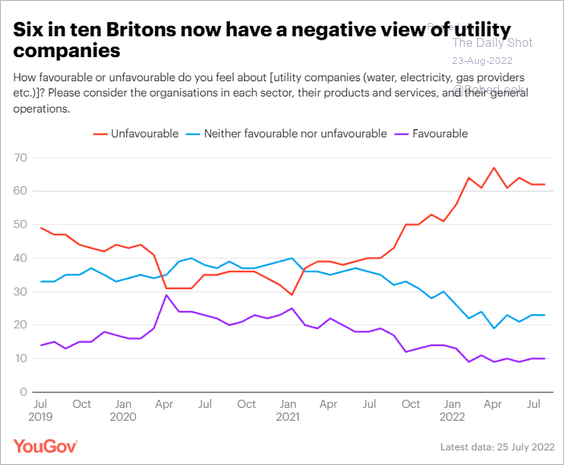
3. Utility companies have become very unpopular lately.
 Source: YouGov Read full article
Back to Index
The Eurozone
1. The euro is back below parity vs. USD …
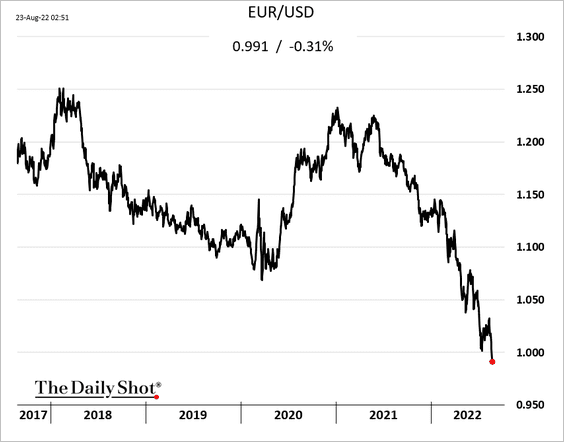
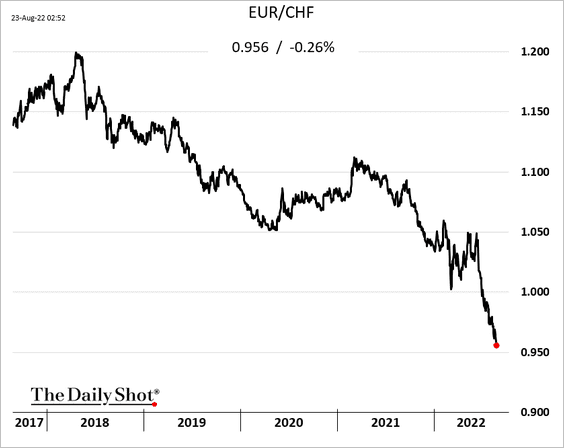
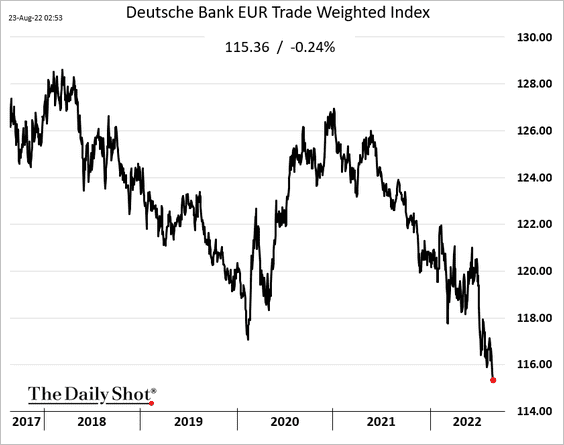
… in a broad decline.
——————–
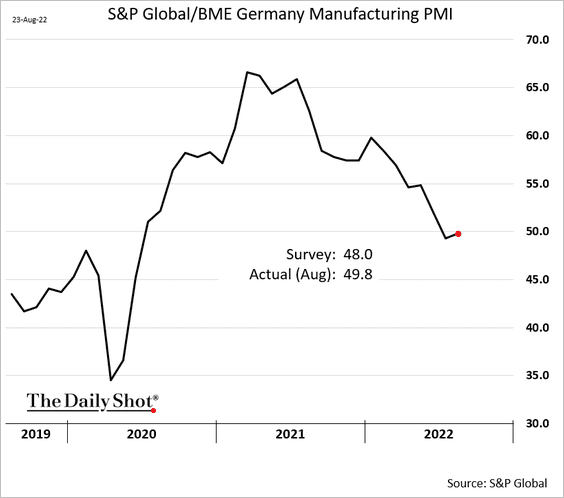
2. Germany’s manufacturing PMI surprised to the upside.
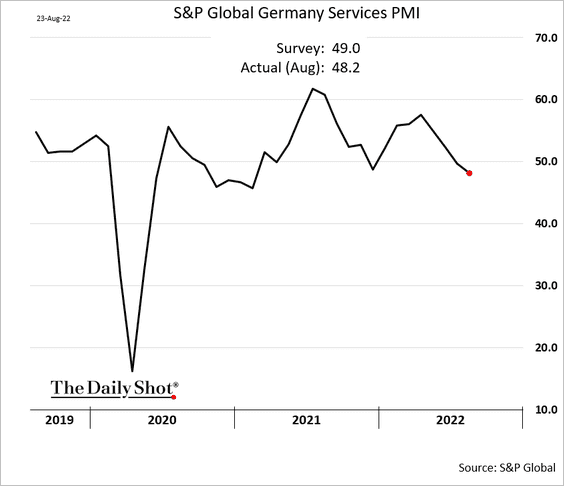
But service-sector activity is moving deeper into contraction. We’ll have more on the Eurozone PMI report tomorrow.
——————–
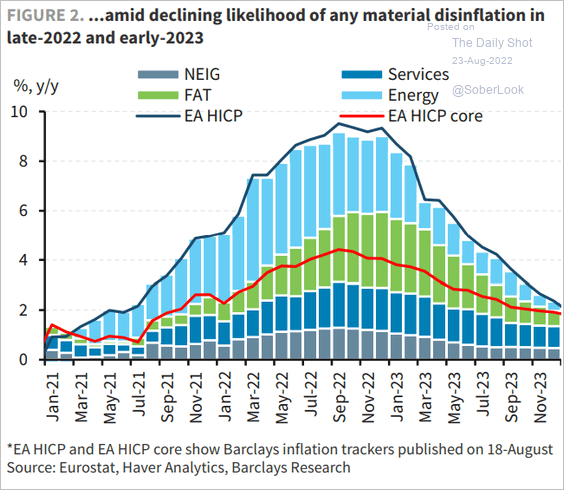
3. Euro-area inflation will remain elevated for some time.
 Source: Barclays Research
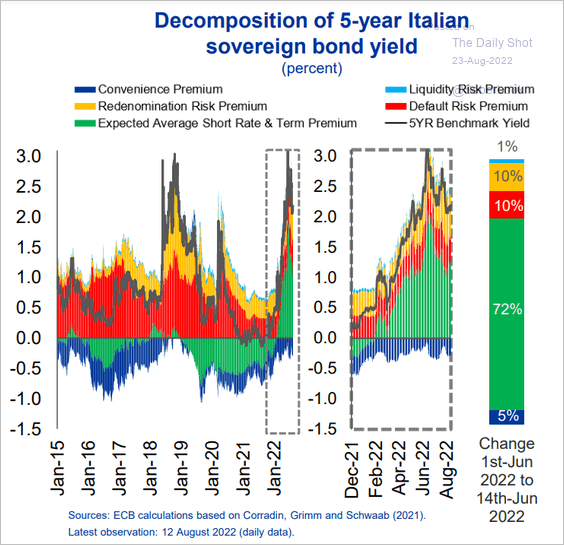
4. This chart shows the decomposition of Italian bond yields.
 Source: ECB Read full article
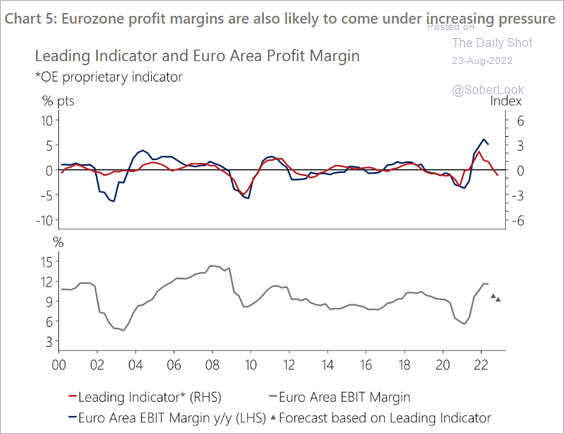
5. Corporate margins are headed lower.
 Source: Oxford Economics
Back to Index
Japan
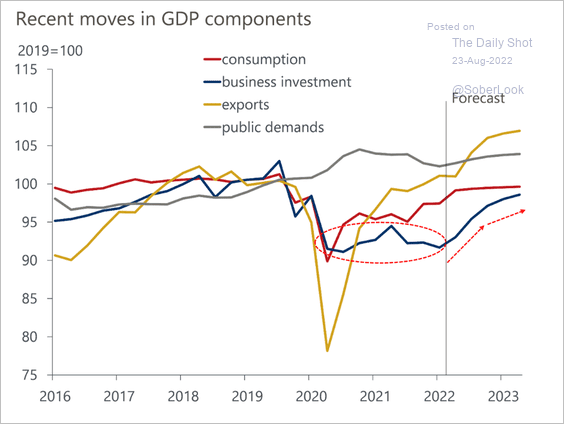
1. Oxford Economics expects a rebound in business investment driven by easy credit conditions and higher domestic consumption.
 Source: Oxford Economics
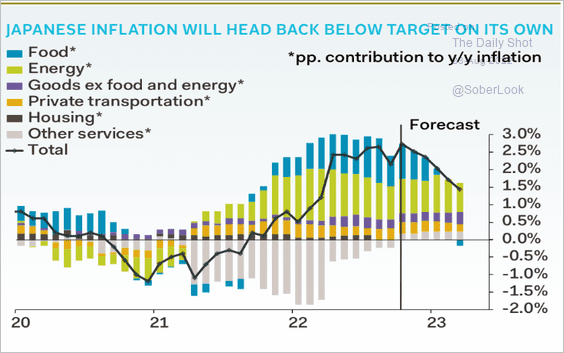
2. Inflation will moderate without the BoJ’s intervention.
 Source: Pantheon Macroeconomics
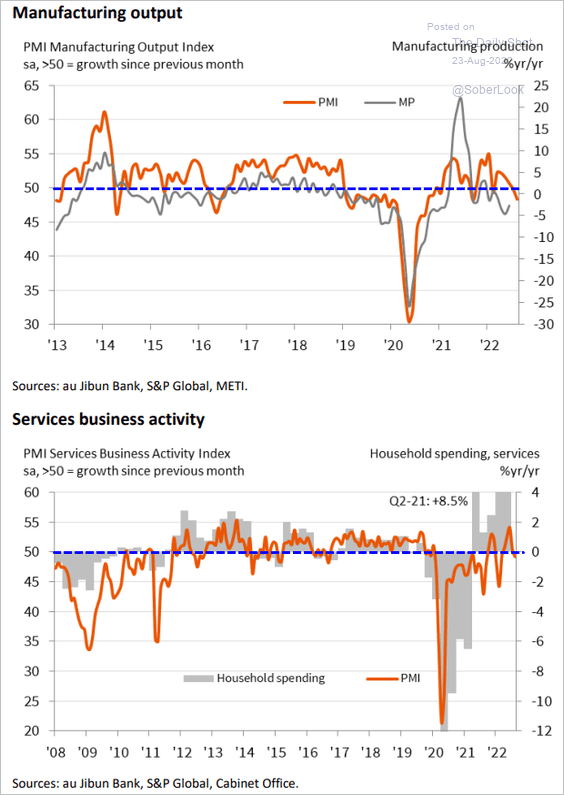
3. Business activity is in contraction territory, according to the S&P Global PMI.
 Source: S&P Global PMI
Back to Index
Asia – Pacific
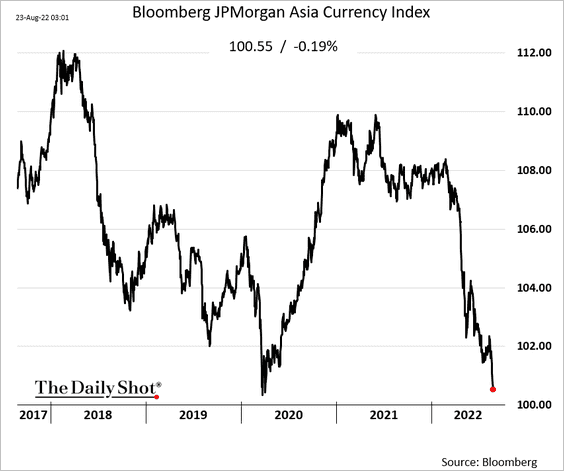
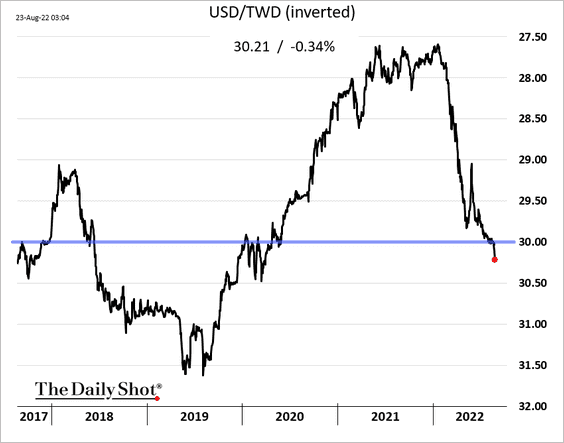
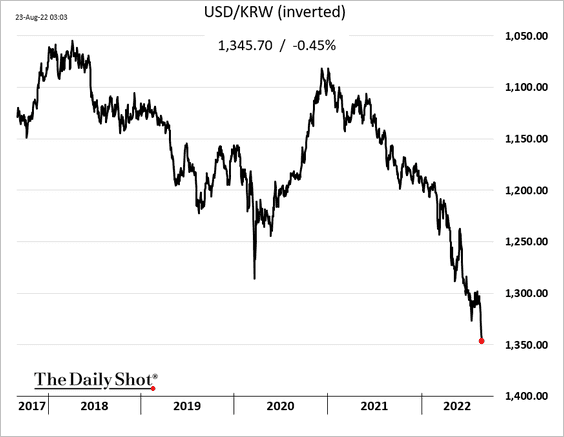
1. Asian currencies remain under pressure vs. USD.
• Currency index:
• The Taiwan dollar:
• The South Korean won:
——————–
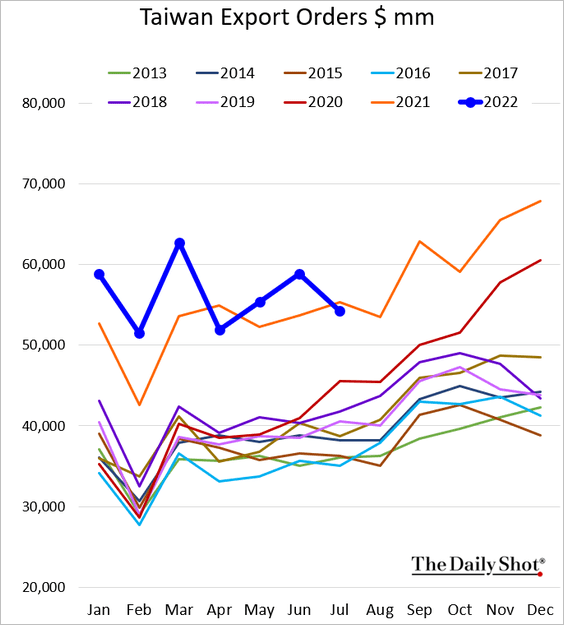
2. Taiwan’s export orders softened in July.
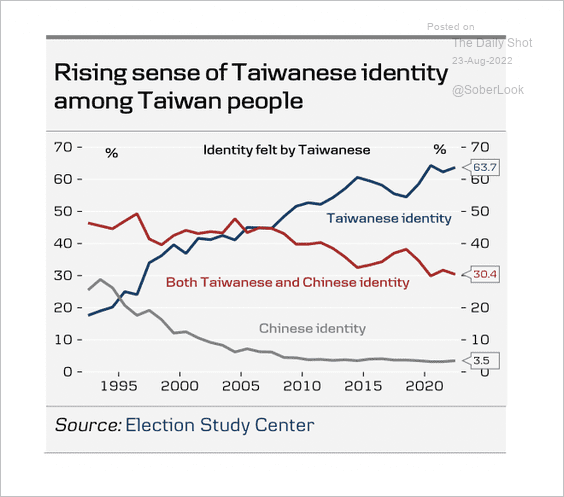
Separately, more residents have identified as Taiwanese over the past decade.
 Source: Danske Bank
——————–
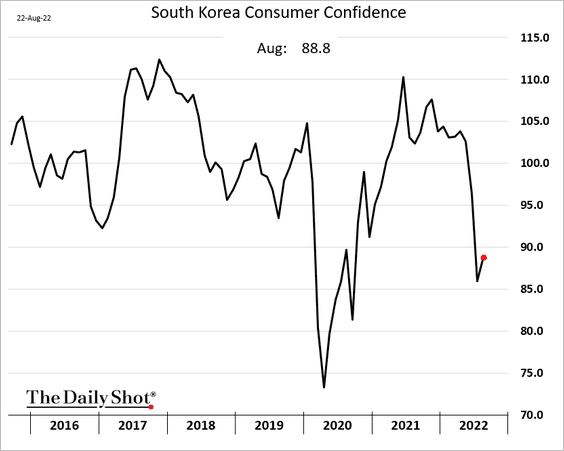
3. South Korea’s consumer confidence has stabilized.
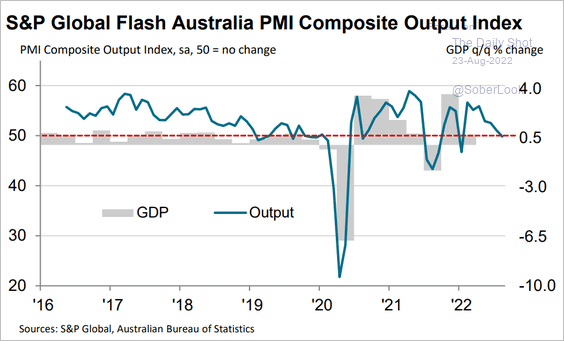
4. Growth in Australian business activity stalled this month.
 Source: S&P Global PMI
Back to Index
China
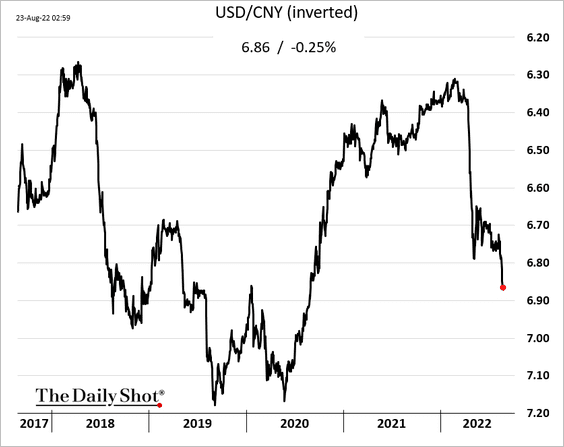
1. The renminbi remains under pressure vs. USD.
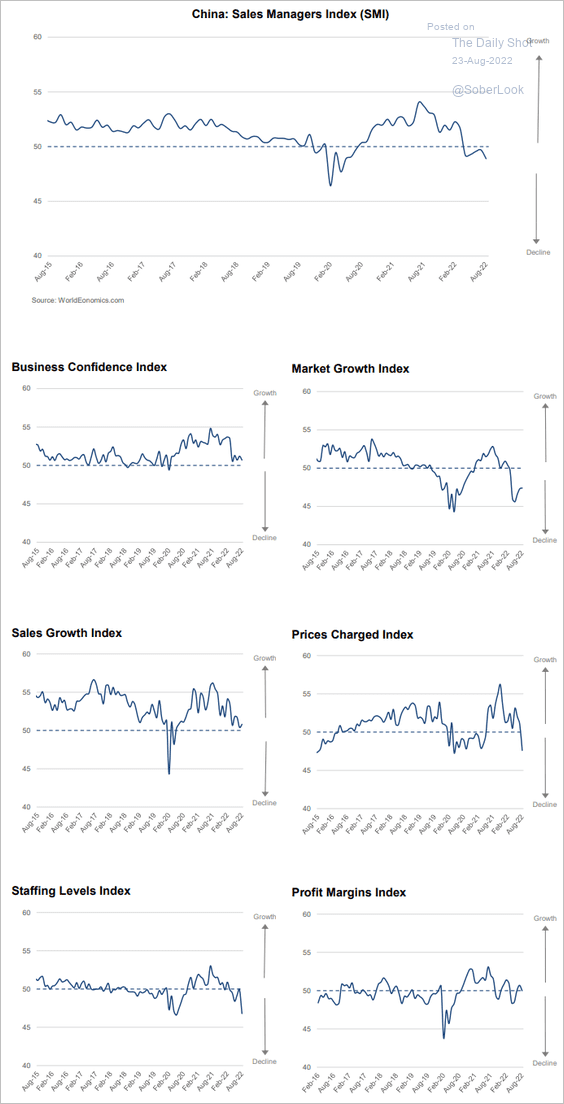
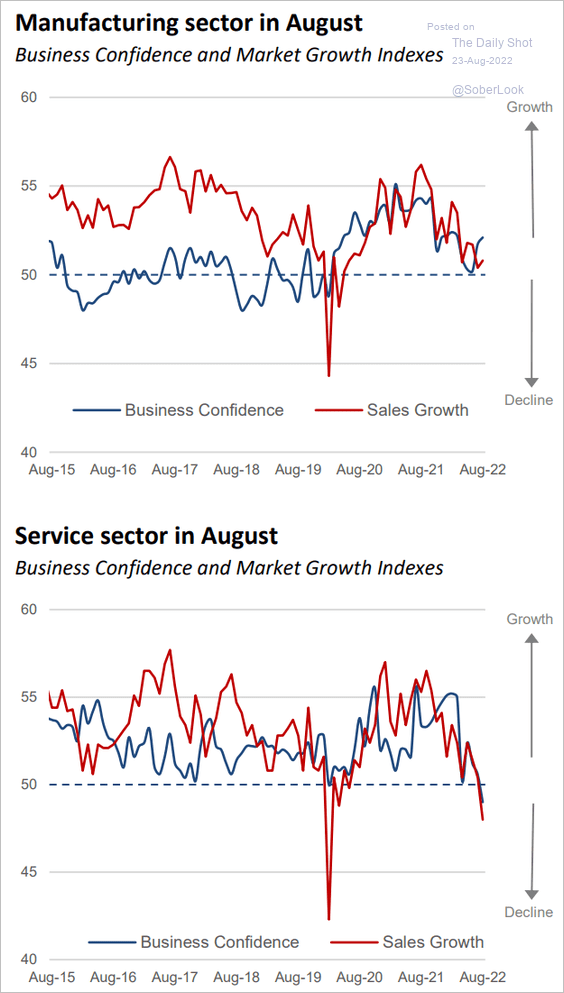
2. Business activity is still in contraction according to the August World Economics SMI report.
 Source: World Economics
Service companies are struggling.
 Source: World Economics
——————–
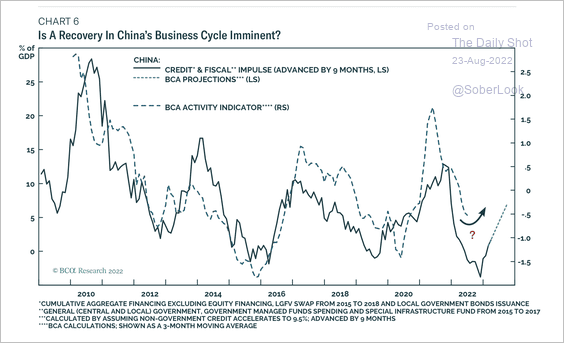
3. Some indicators point to a trough in China’s business cycle.
 Source: BCA Research
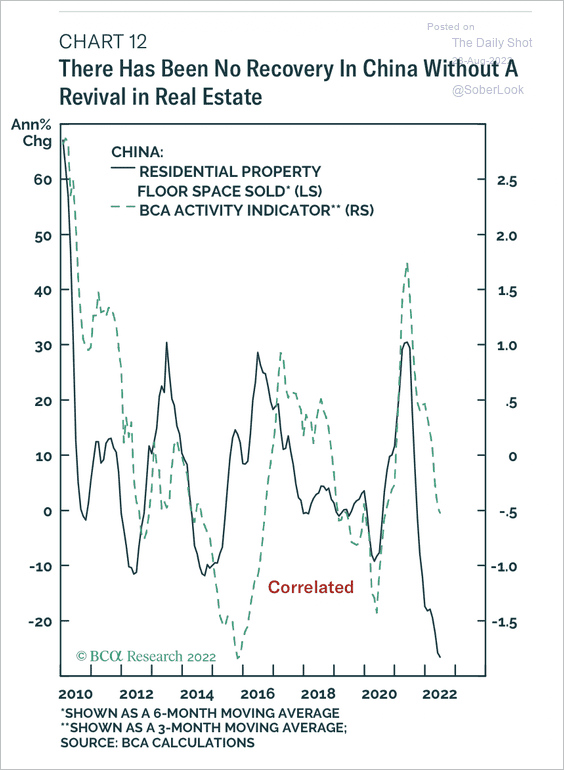
Still, without improvement in the housing market, a meaningful business cycle recovery is unlikely.
 Source: BCA Research
——————–
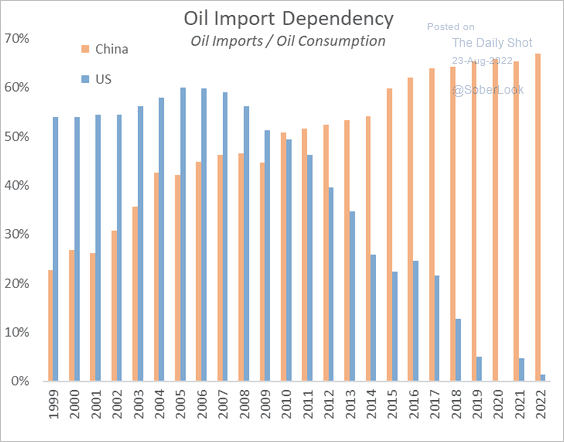
4. China remains heavily dependent on oil imports.
 Source: Princeton Energy Advisors
Back to Index
Emerging Markets
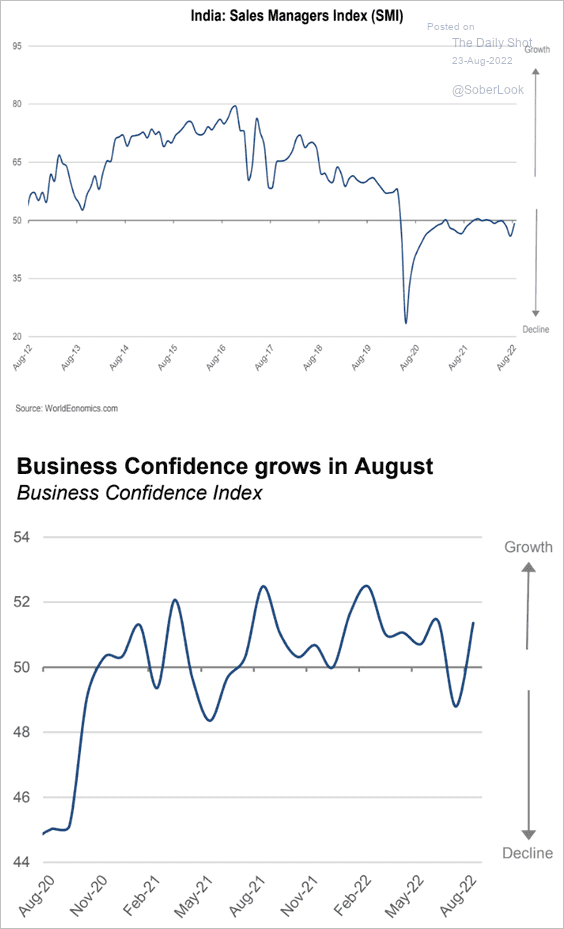
1. India’s business activity has stabilized, according to the World Economics SMI report.
 Source: World Economics
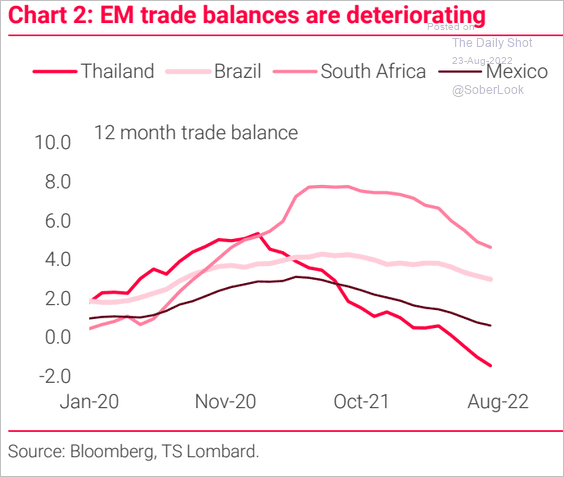
2. EM trade balances are headed lower.
 Source: TS Lombard
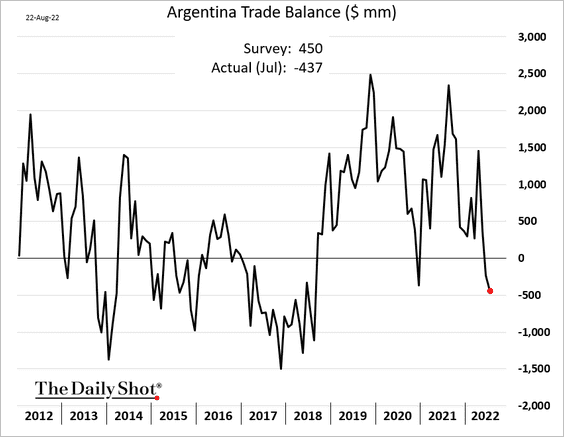
For example, Argentina’s trade balance unexpectedly shifted into deficit.
Back to Index
Cryptocurrency
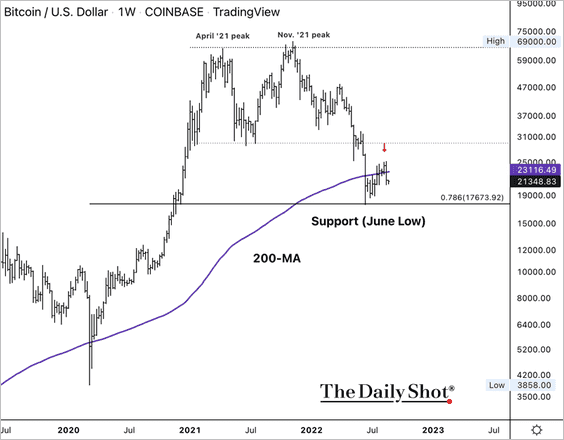
1. Bitcoin is back below its 200-week moving average. The next major support level is at $17,673, which is near the June low.
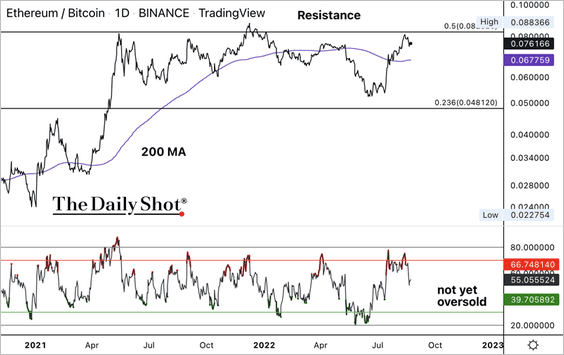
2. The ETH/BTC price ratio declined from long-term resistance and is not yet oversold.
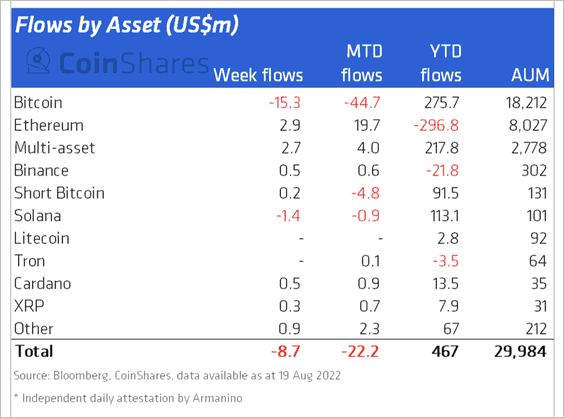
3. Crypto investment funds saw minor outflows last week, driven by bitcoin-focused products.
 Source: CoinShares Read full article
4. A bank run drained BendDAO’s reserves on Sunday.
 Source: CoinDesk Read full article
Back to Index
Commodities
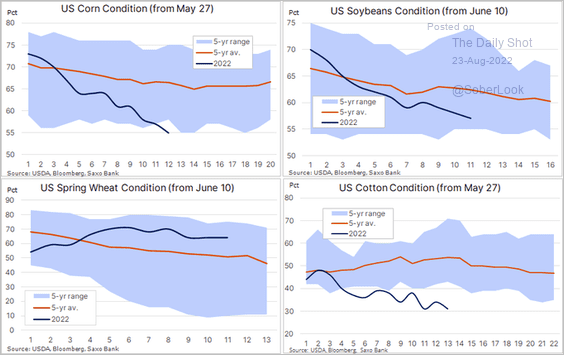
1. US crop conditions for corn, soybeans, and cotton have been deteriorating.
 Source: @Ole_S_Hansen
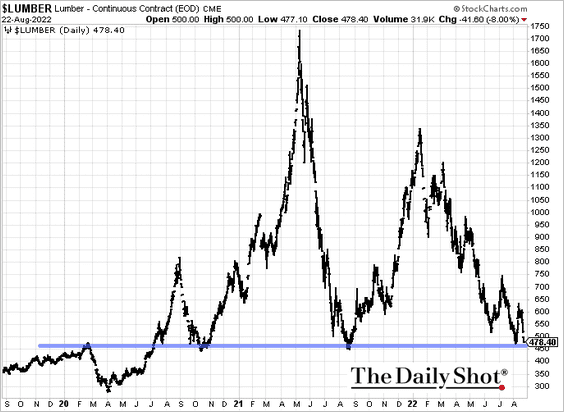
3. Lumber is at support, pressured by US housing market weakness.
Back to Index
Energy
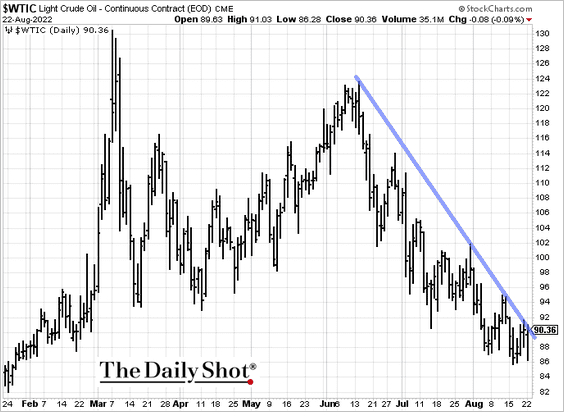
1. WTI crude is about to break above downtrend resistance.
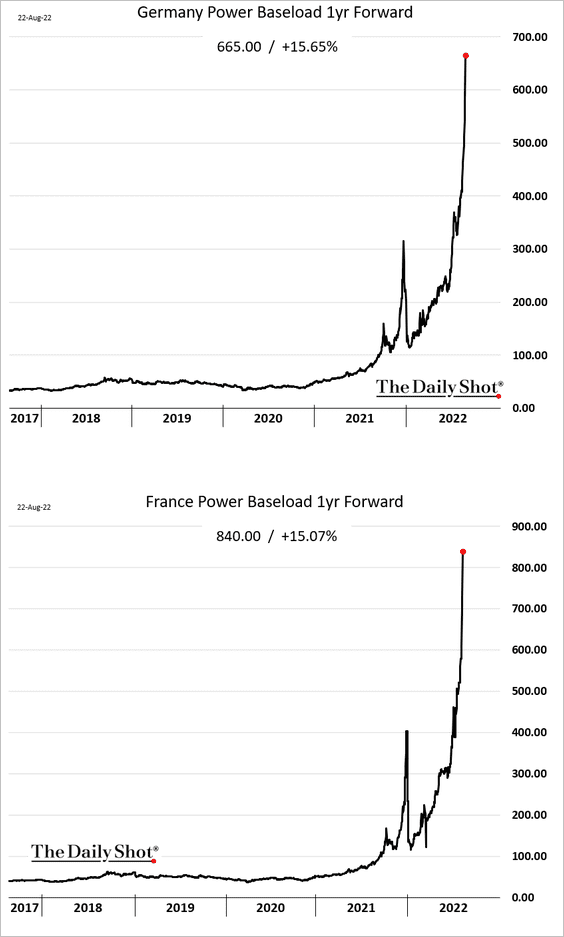
2. European electricity prices have gone vertical.
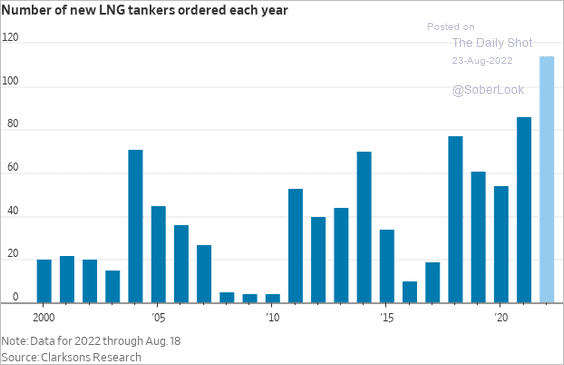
3. LNG shipping activity surged this year.
 Source: @WSJ Read full article
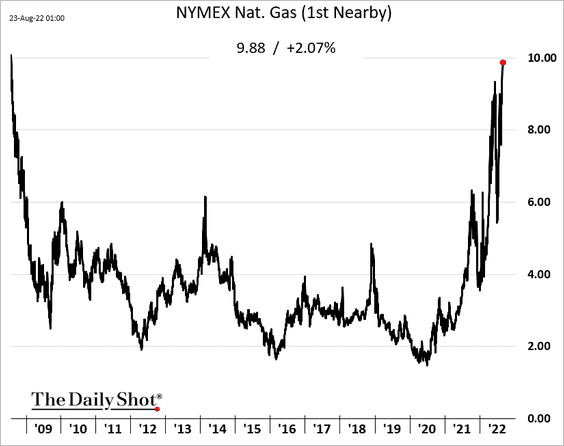
4. US natural gas futures are nearing $10/mmbtu for the first time since 2008, supported by the surge in Europe.
Back to Index
Equities
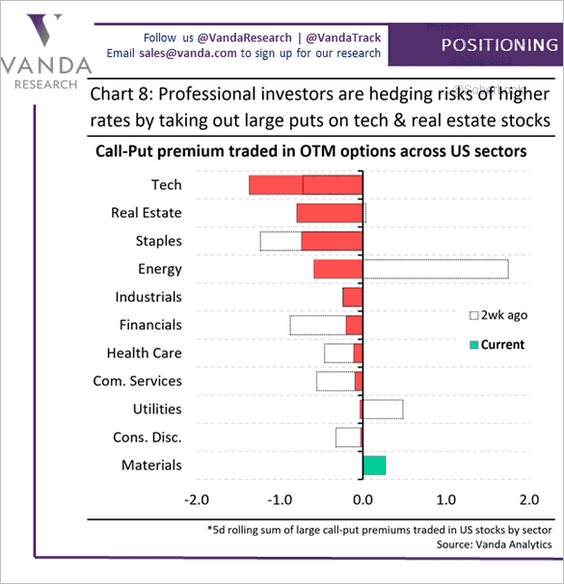
1. Professional investors remain concerned about rates, buying puts on interest-rate-sensitive names over the past two weeks.
 Source: @vandaresearch
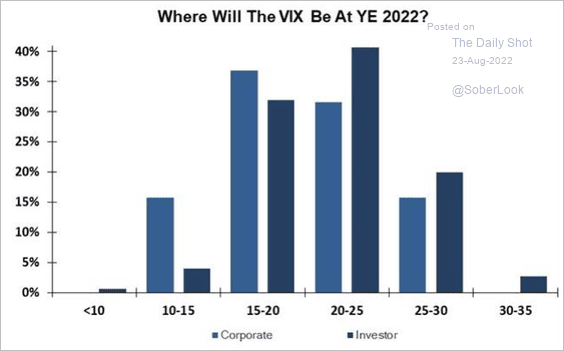
2. Where will VIX be at the end of the year? (from Evercore ISI survey)
 Source: Evercore ISI Research
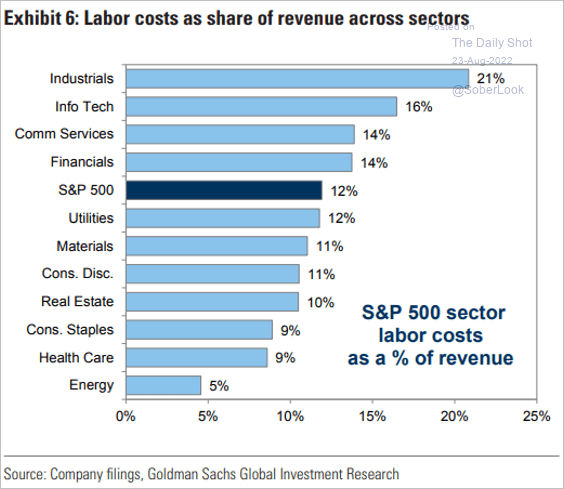
3. This chart illustrates the exposure to labor costs by sector.
 Source: Goldman Sachs; @patrick_saner
4. Will we see a market bounce today?
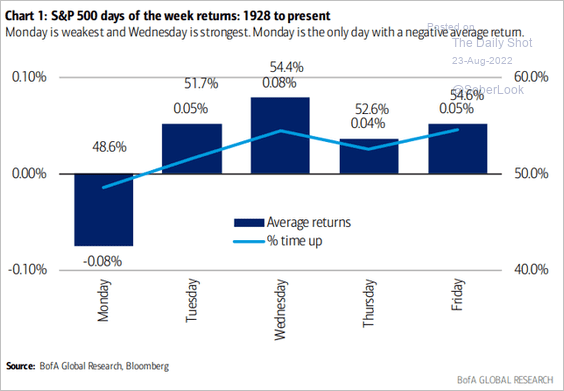 Source: BofA Global Research
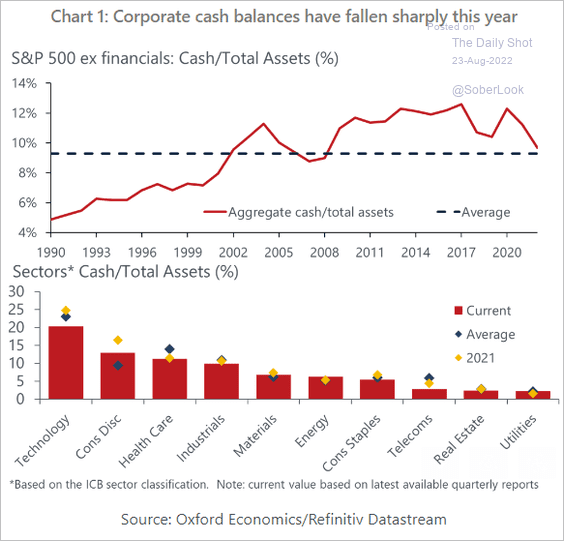
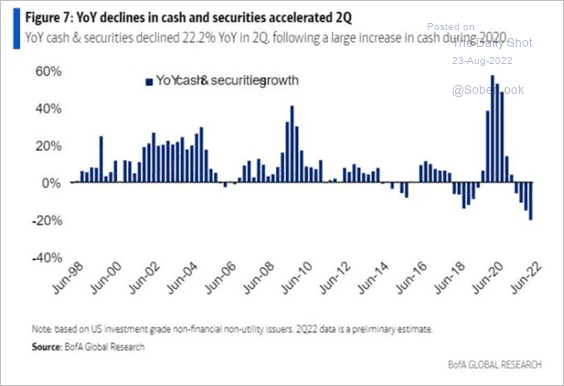
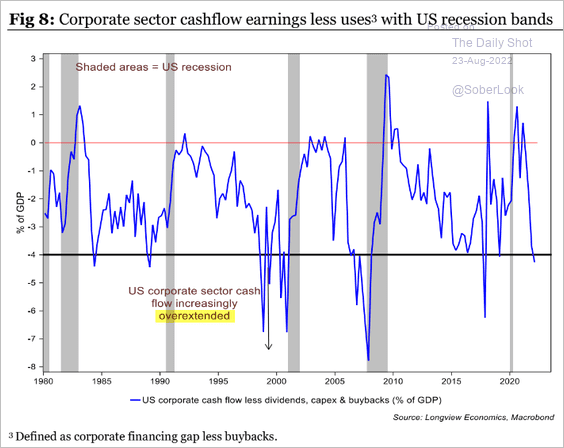
5. Corporate cash balances have been falling.
• Cash holdings:
 Source: Oxford Economics
• Year-over-year changes:
 Source: @jessefelder, @FT, BofA Global Research Read full article
• Corporate cashflow earnings less uses:
 Source: Longview Economics
——————–
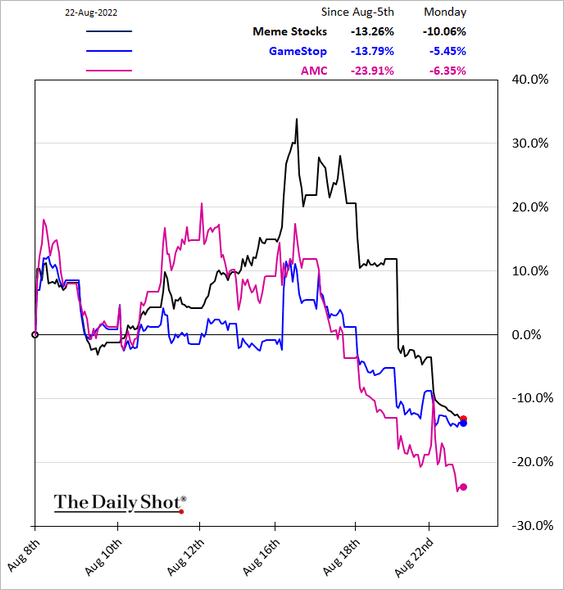
6. Meme stocks are back from the Moon.
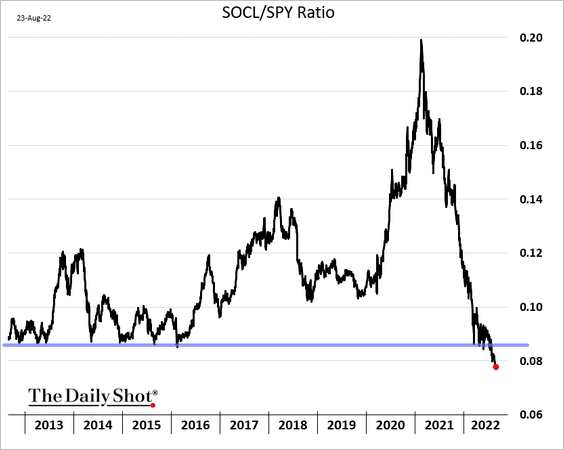
7. Social-media stocks broke below long-term support vs. S&P 500.
 h/t @adaptiv, @Callum_Thomas
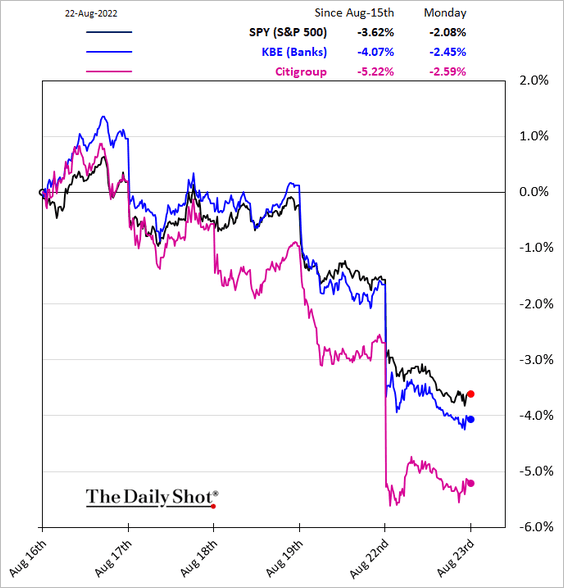
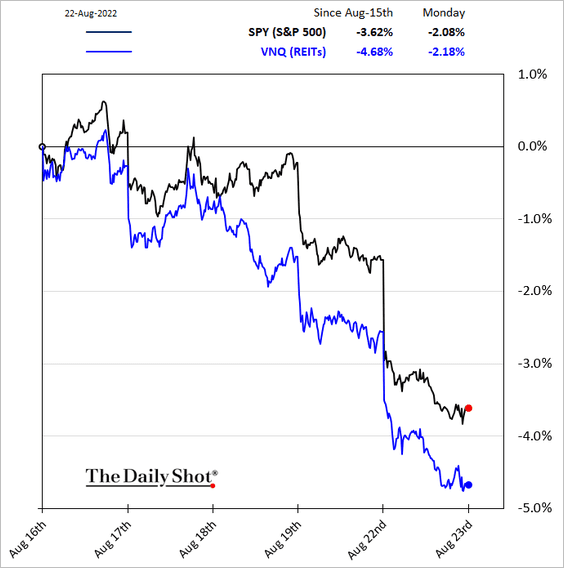
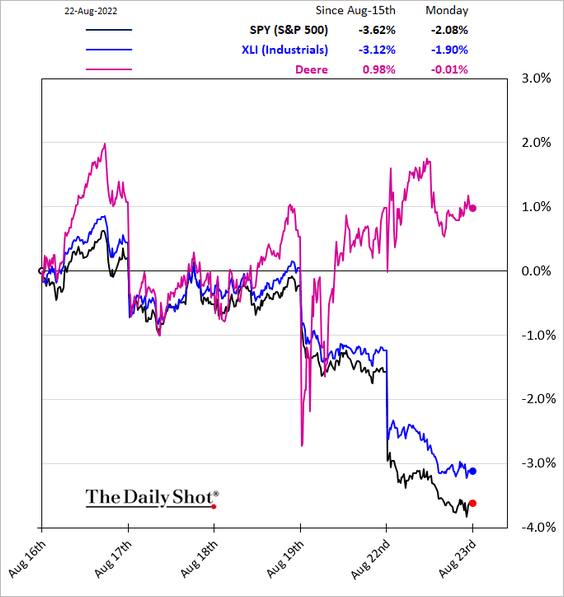
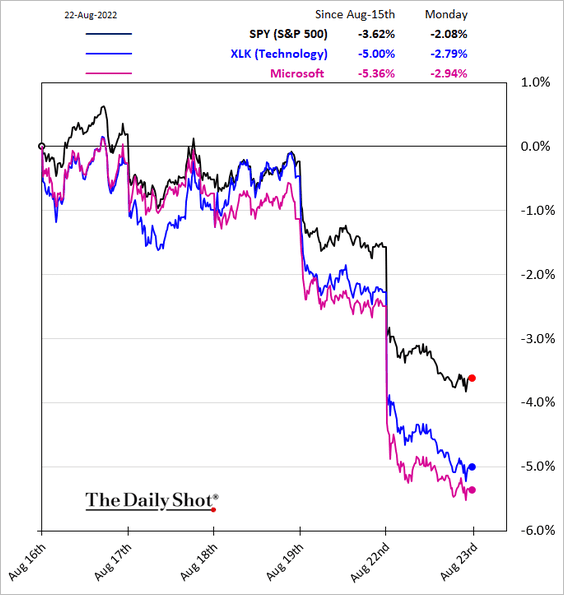
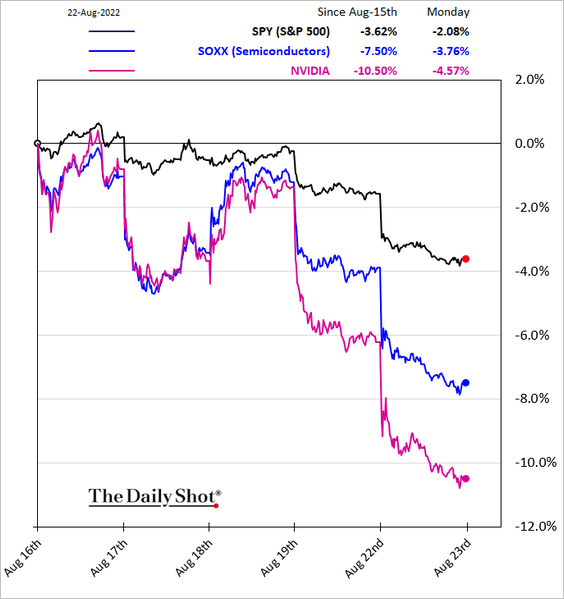
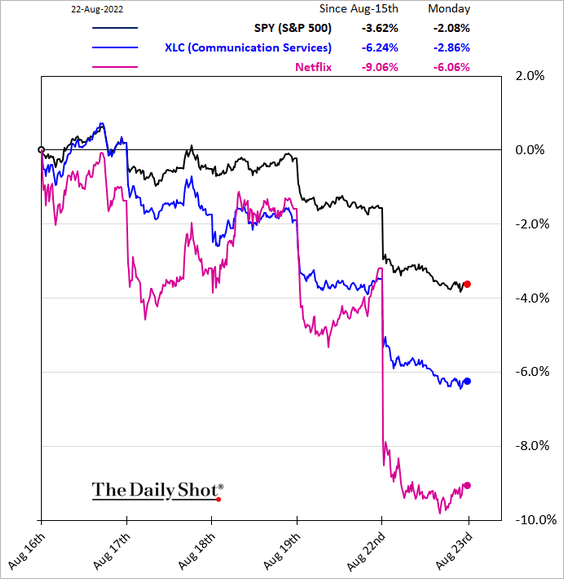
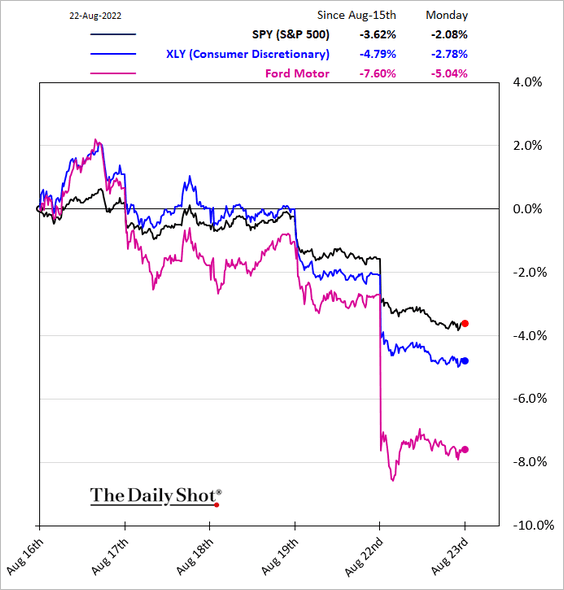
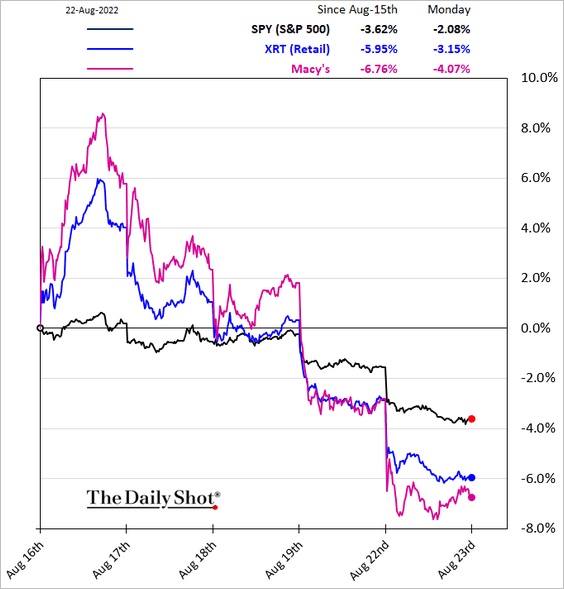
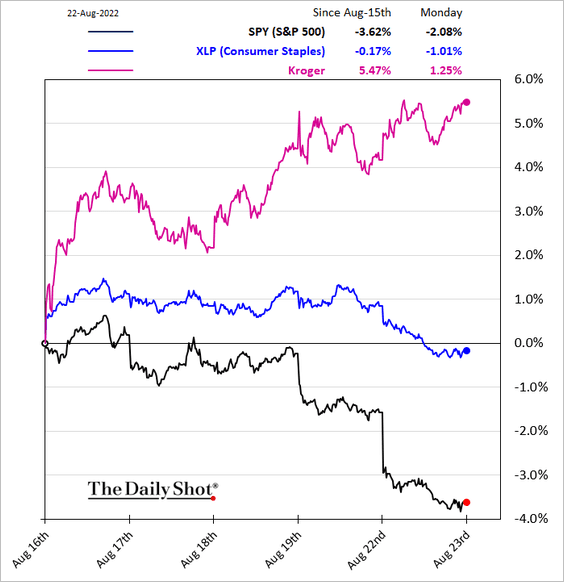
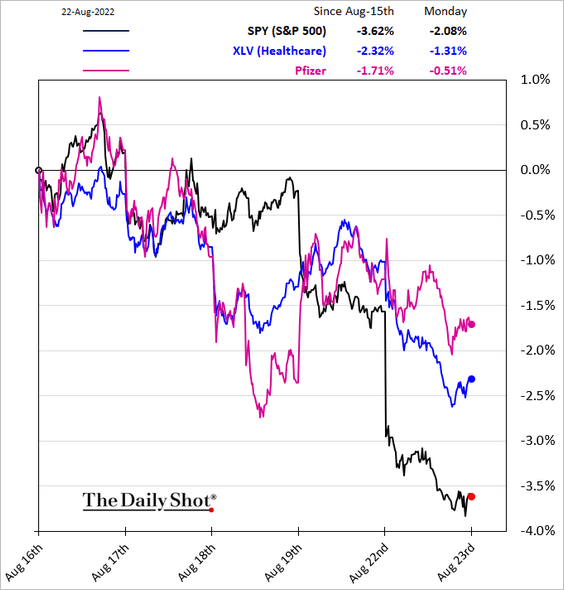
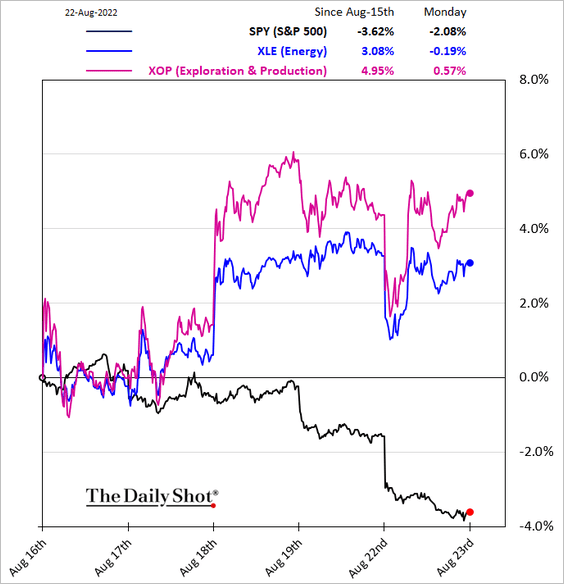
8. Next, we have some sector performance data over the past five business days.
• Banks:
• REITs:
• Industrials:
• Tech and semiconductors:
• Communication Services:
• Consumer Discretionary and Retail:
• Consumer Staples:
• Healthcare:
• Energy:
——————–
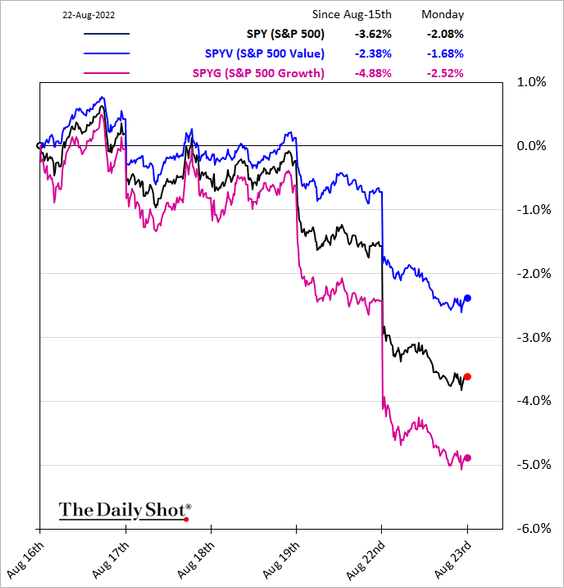
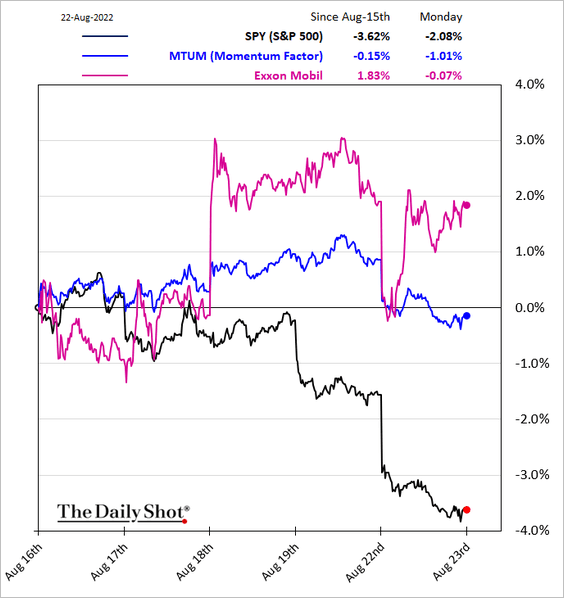
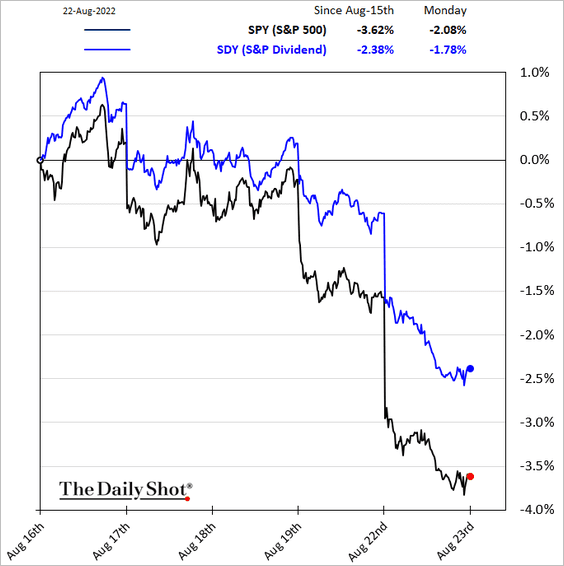
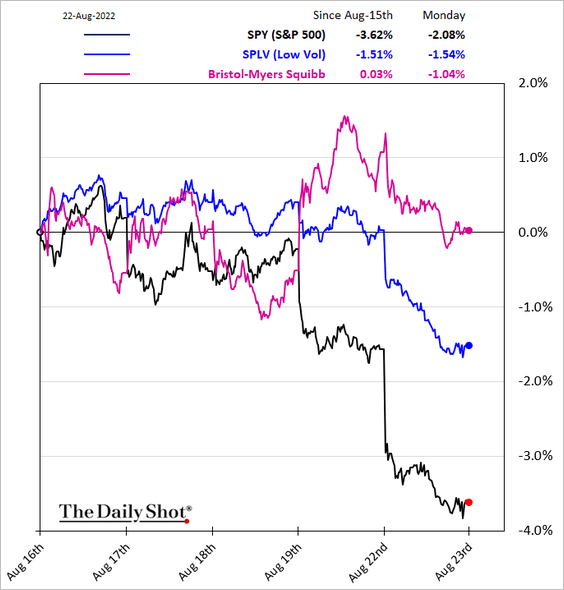
9. Finally, we have some equity factor charts:
• Value vs. growth:
• Momentum:
• High-dividend:
• Low-vol:
Back to Index
Rates
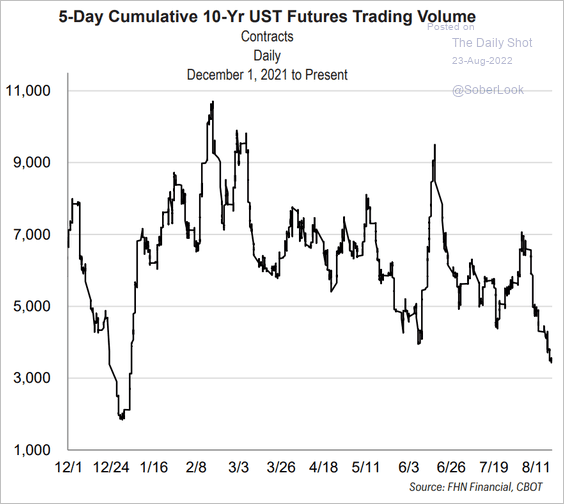
1. Trading volume on the 10-year Treasury futures has been falling.
 Source: FHN Financial
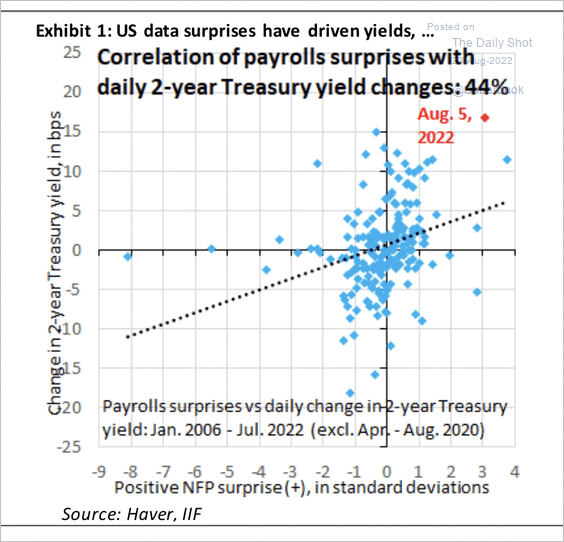
2. The 2-year Treasury yield has been sensitive to payroll surprises.
 Source: IIF
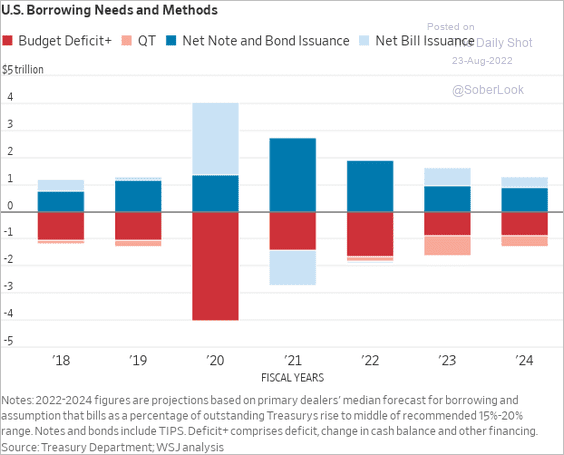
3. Slower Treasury issuance has been offsetting QT.
 Source: @WSJ Read full article
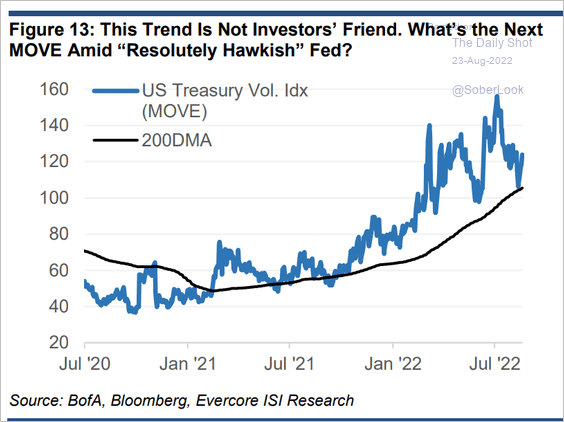
4. Treasury vol is rebounding.
 Source: Evercore ISI Research
Back to Index
Global Developments
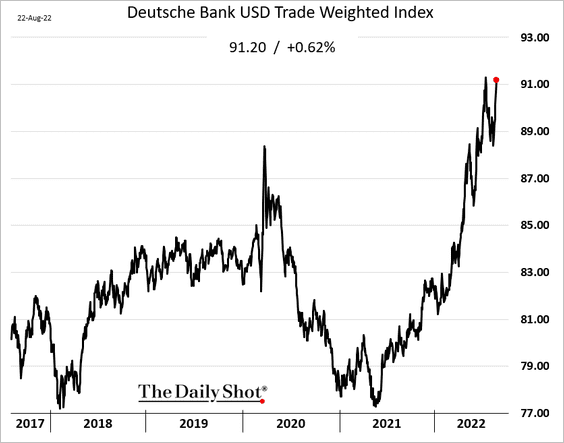
1. The dollar is nearing the multi-year high reached in July.
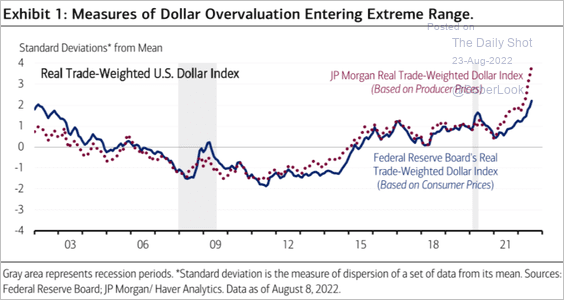
Is the dollar overvalued?
 Source: Merrill Lynch
——————–
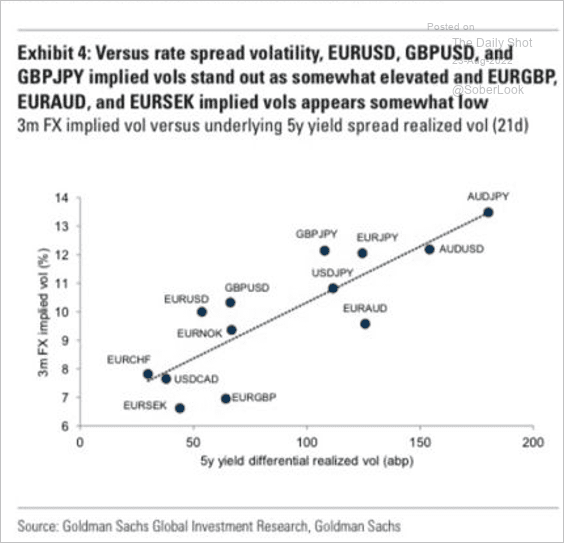
2. This scatterplot shows FX implied volatility vs. rate differentials’ realized vol.
 Source: Goldman Sachs
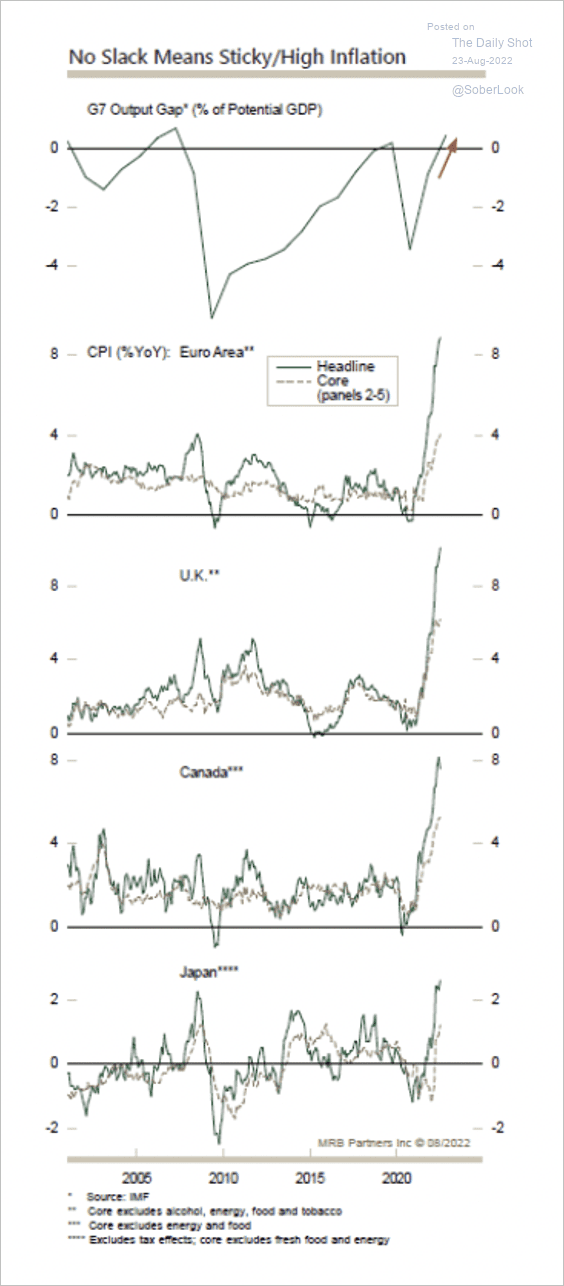
3. The output gap among G7 nations has significantly narrowed, which typically spurs inflation.
 Source: MRB Partners
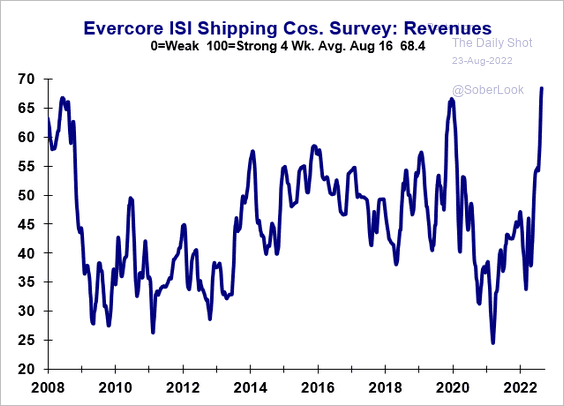
4. Shipping companies’ revenues have been surging, boosted by tanker activity.
 Source: Evercore ISI Research
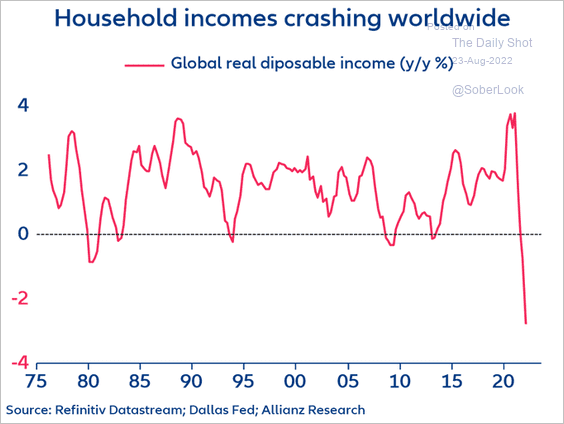
5. Households haven’t seen such a sharp decline in real incomes in decades.
 Source: @PatrickKrizan
——————–
Food for Thought
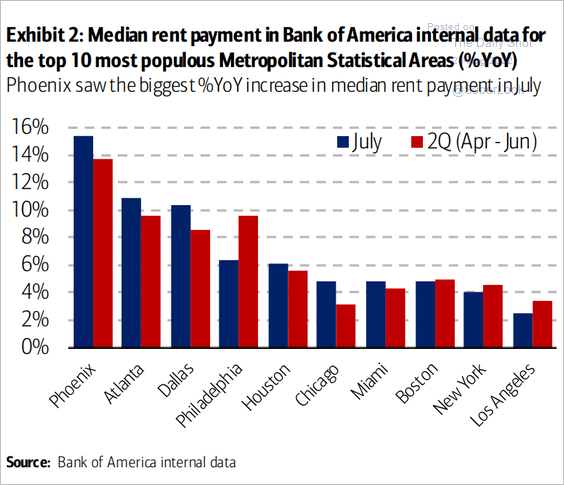
1. Year-over-year rent payment increases in the largest metro areas:
 Source: Bank of America Institute
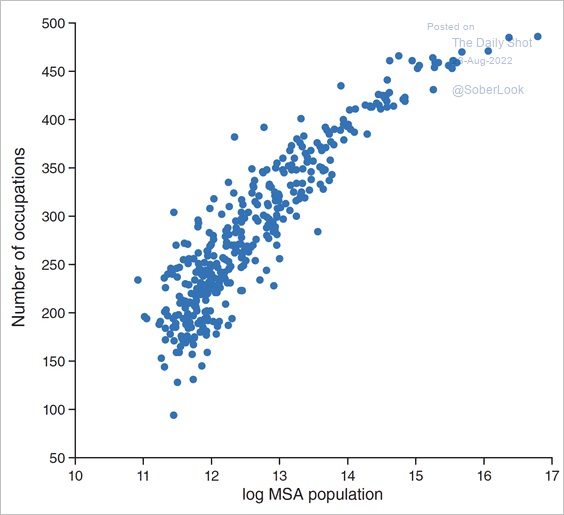
2. Number of occupations vs. US metropolitan area population:
 Source: AEA Read full article
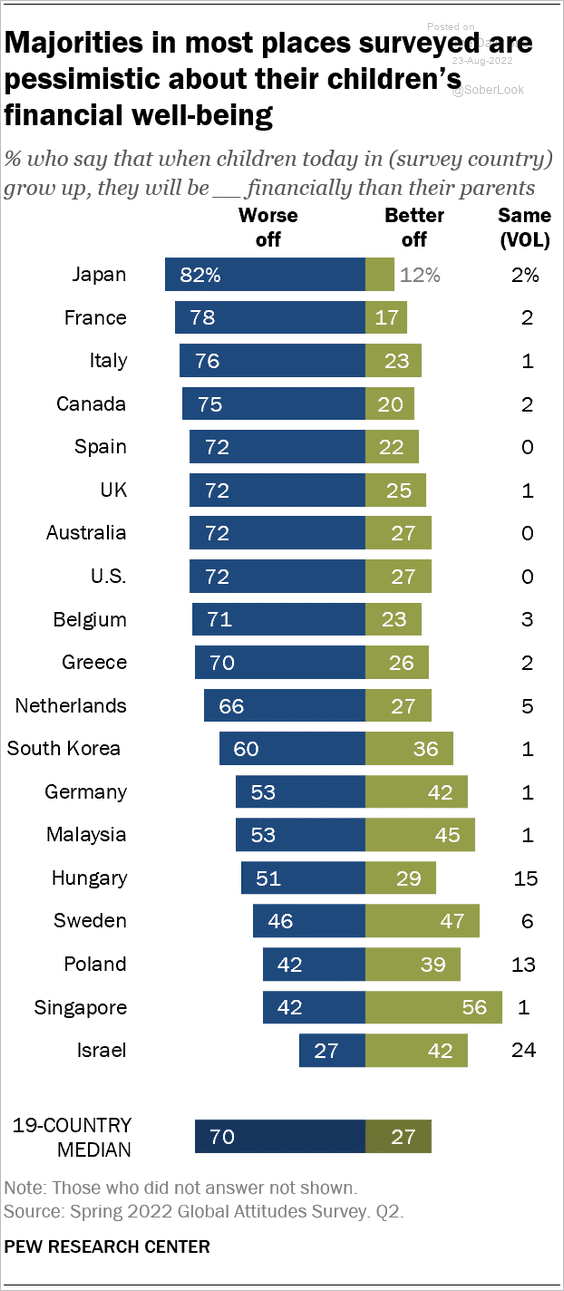
3. Views on the next generation’s financial well-being:
 Source: Pew Research Center Read full article
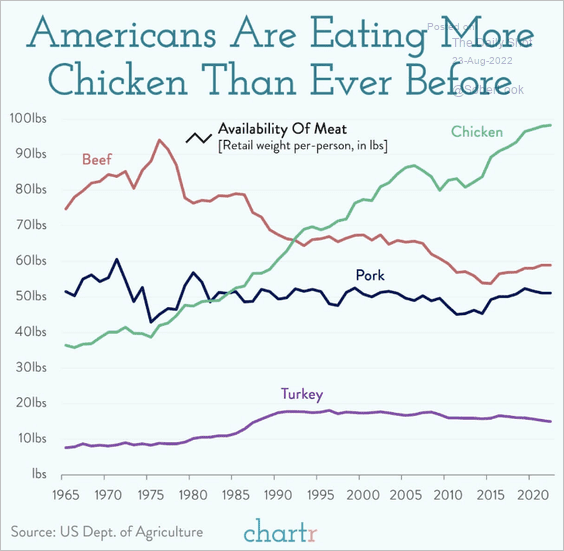
4. US meat consumption:
 Source: @chartrdaily Read full article
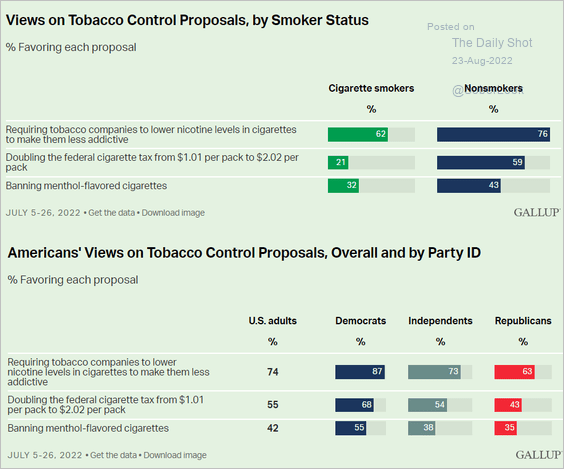
5. Views on tobacco control proposals:
 Source: Gallup Read full article
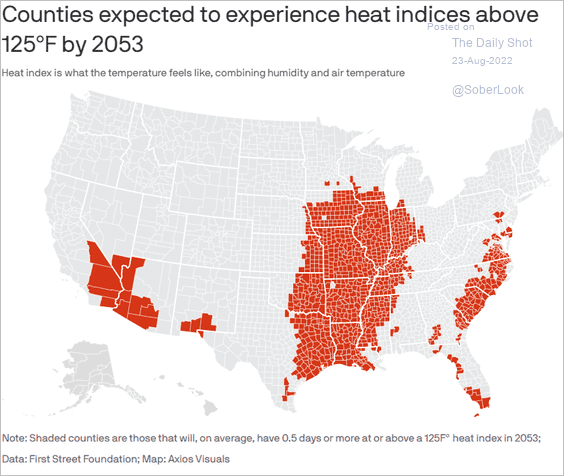
6. The Extreme Heat Belt:
 Source: @axios Read full article
7. The most detailed image of a human cell:
 Source: Alfred Hendriks
——————–
Back to Index
