
The Daily Shot: 26-Aug-22
• Administrative Update
• The United States
• Canada
• The United Kingdom
• The Eurozone
• Europe
• Japan
• Asia – Pacific
• China
• Emerging Markets
• Energy
• Equities
• Credit
• Global Developments
• Food for Thought
Administrative Update
The Daily Shot will not be published on Friday, September 2nd and Monday, September 5th.
Back to Index
The United States
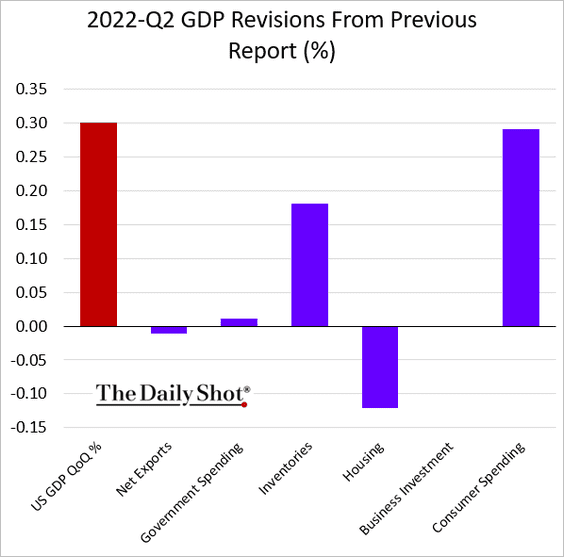
1. The Q2 GDP growth was revised higher, …
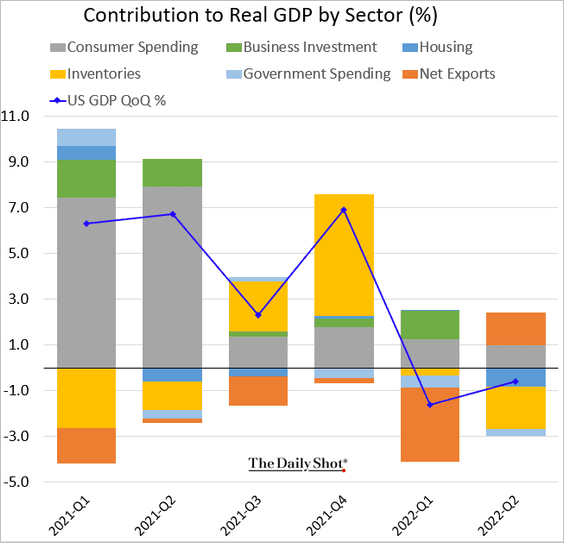
… with a boost from better than initially reported consumer spending.
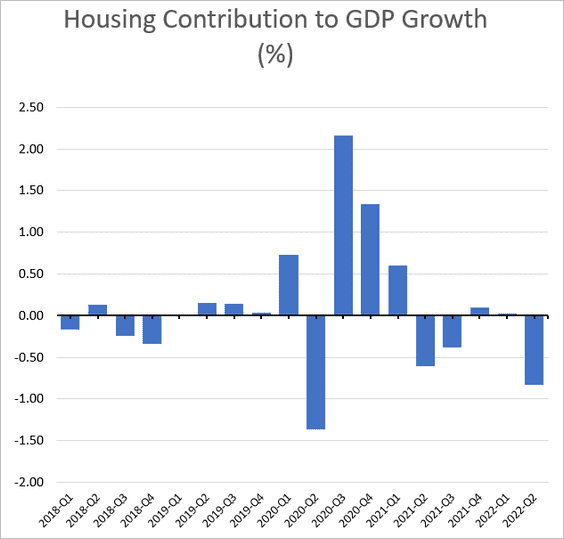
Housing was a drag on growth (and will be again in Q3).
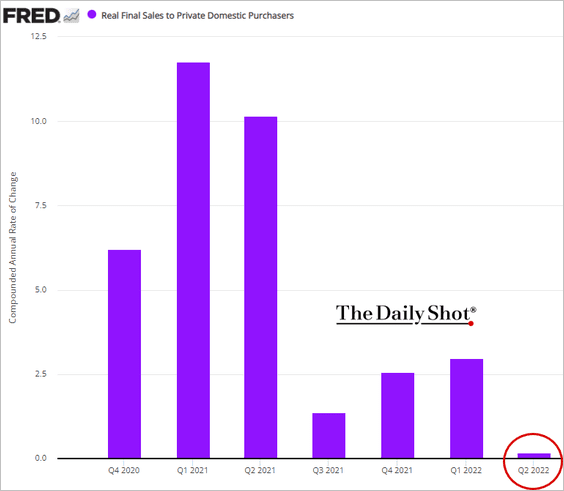
• Despite a small decline, the GDP report does not signal a recession (yet). Private demand has slowed sharply, but the “final sales to private domestic purchasers” indicator (the “core” GDP) was up slightly.
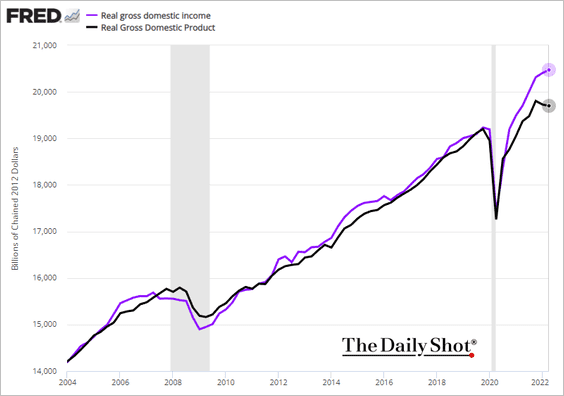
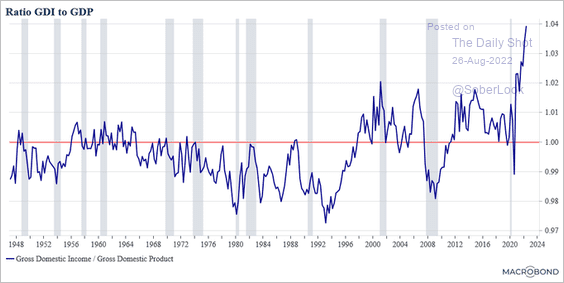
• Moreover, the GDI continued to grow, …
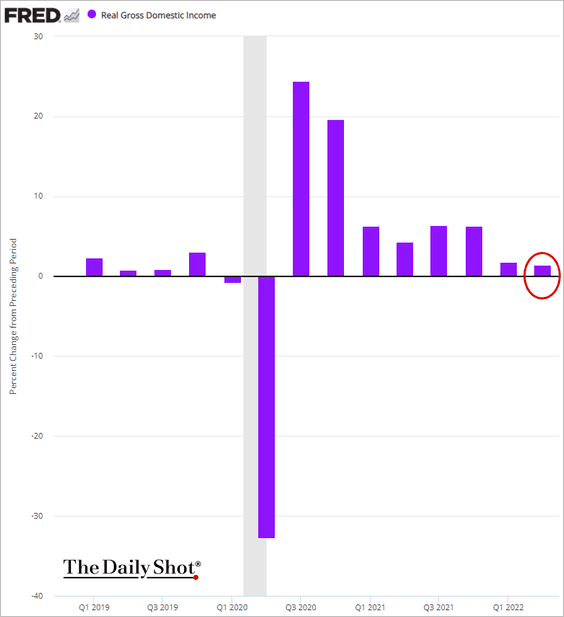
… sharply outpacing the GDP measure (2 charts).
 Source: @RiccardoTrezzi
——————–
2. Below are some additional updates on economic growth.
• There is no recession signal yet in corporate profits.
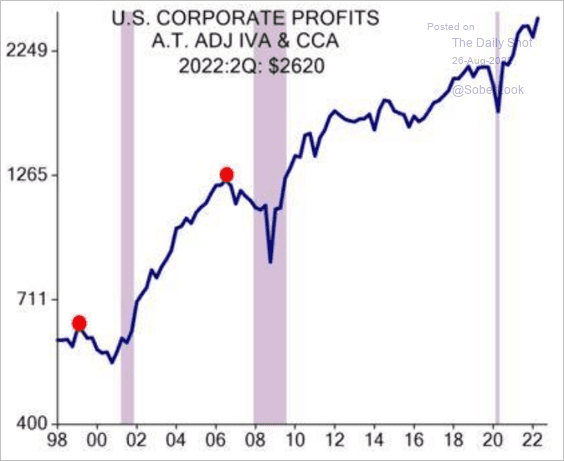 Source: Evercore ISI Research
• The Atlanta Fed’s GDPNow model estimate continues to show stable consumer spending growth this quarter.
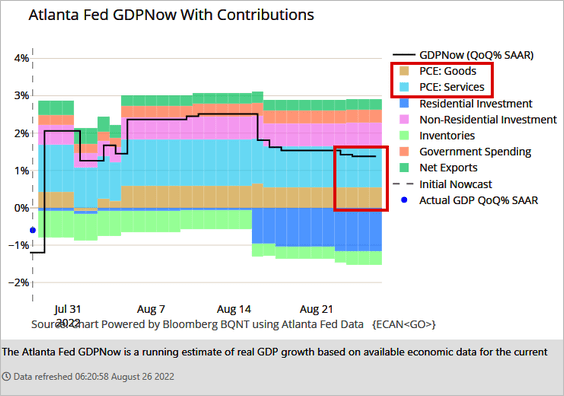 Source: @TheTerminal, Bloomberg Finance L.P., h/t BCA Research
• The FIBER leading index points to further deterioration in economic growth.
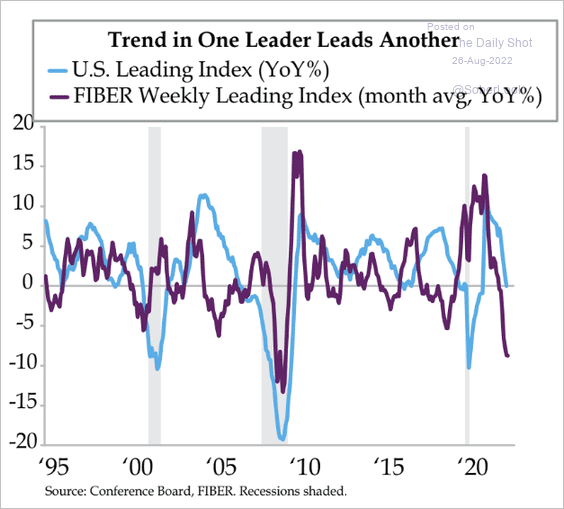 Source: Quill Intelligence
• Here is a look at US recessions since 1857.
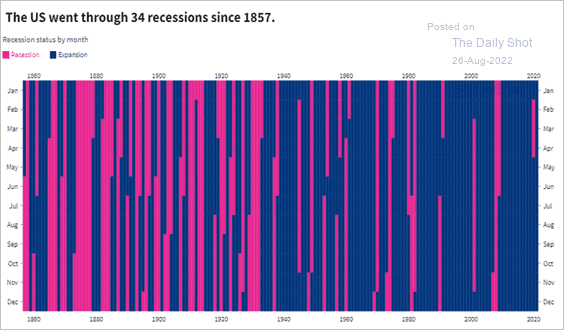 Source: USAFacts Read full article
——————–
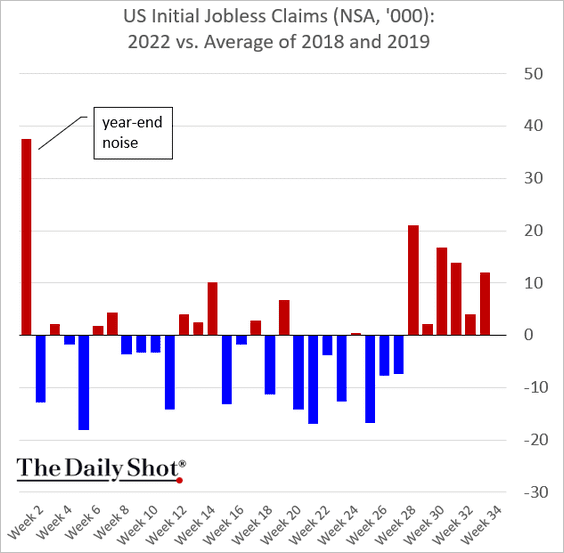
3. Next, we have some updates on the labor market.
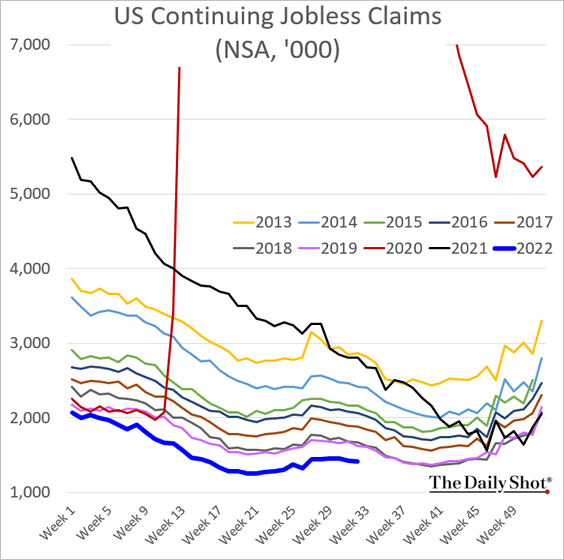
• Initial jobless claims are still above pre-COVID levels, but not by much. The labor market is still tight.
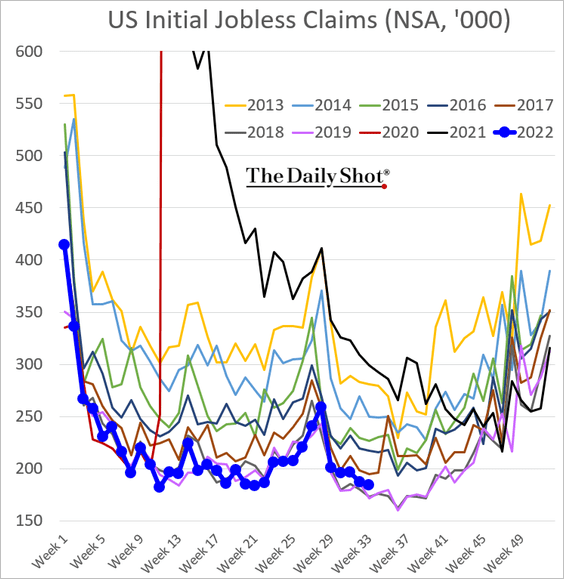
This chart shows the continuing claims.
• Here is the percentage of workers not getting raises.
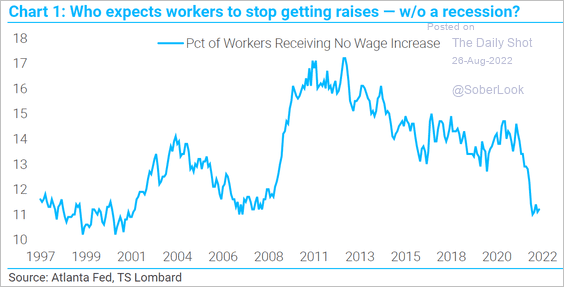 Source: TS Lombard
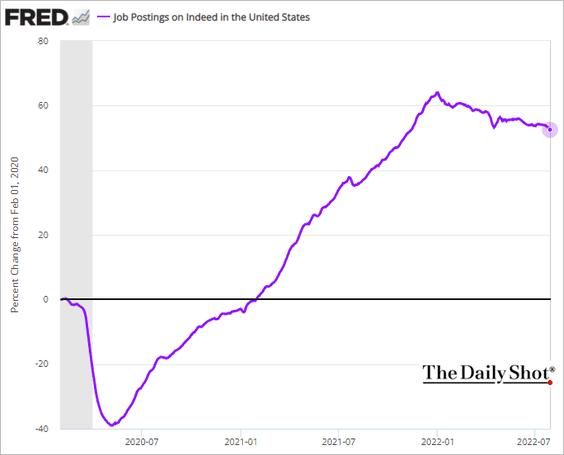
• Job postings on Indeed are drifting lower. The Fed will want to see this indicator move closer to pre-COVID levels.
• Layoffs at startups remain elevated.
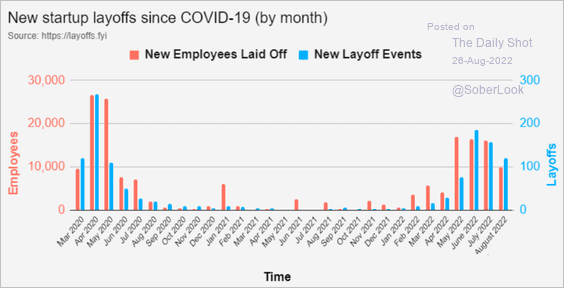 Source: @roger_lee
• Pandemic-era payrolls data have been very noisy.
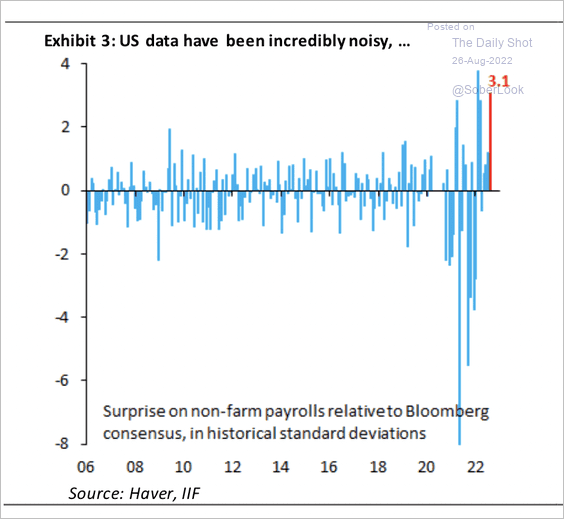 Source: IIF
——————–
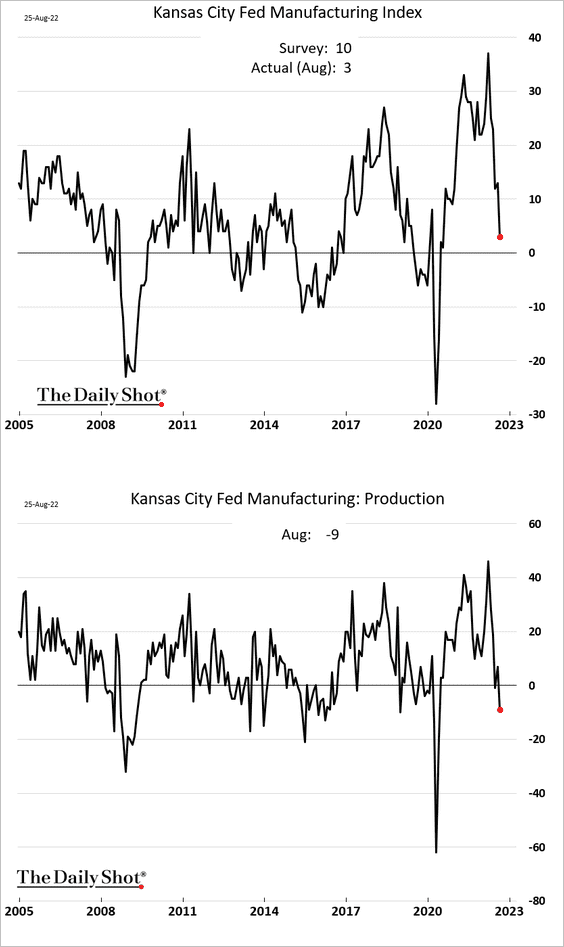
4. The Kansas City Fed regional manufacturing index fell sharply this month, with production moving into contraction territory.
• Demand is falling.
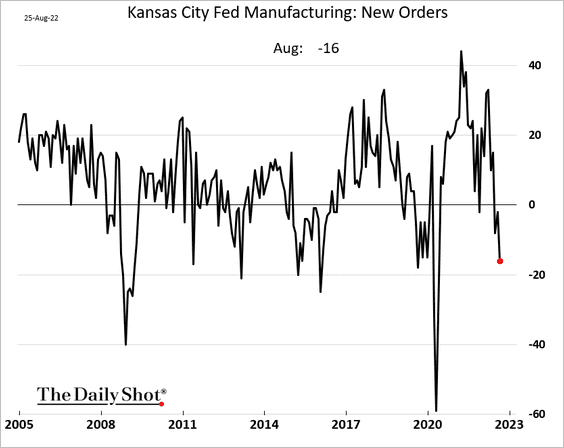
This chart shows new orders across the regional Fed reports we got this month.
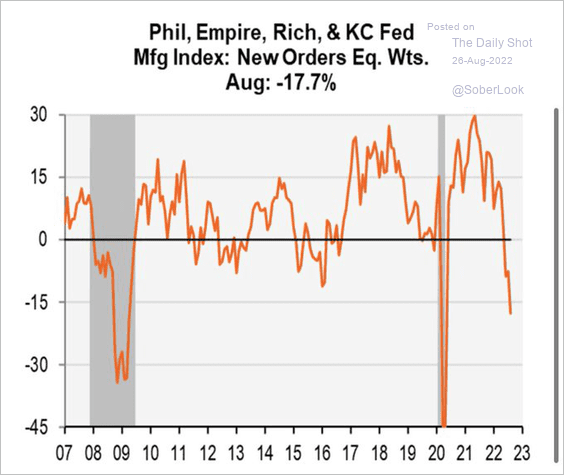 Source: @MichaelKantro
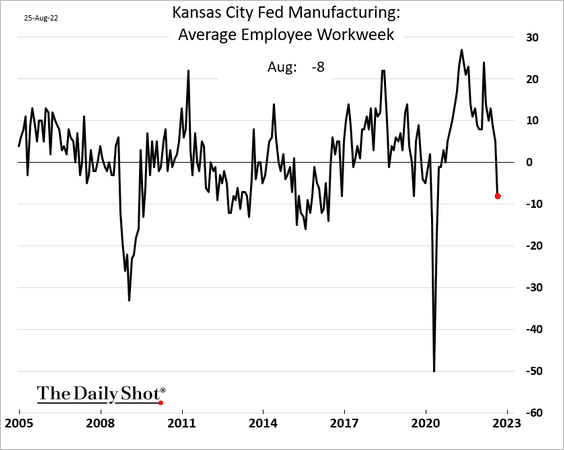
• The Kansas City Fed report showed factories rapidly reducing employee hours.
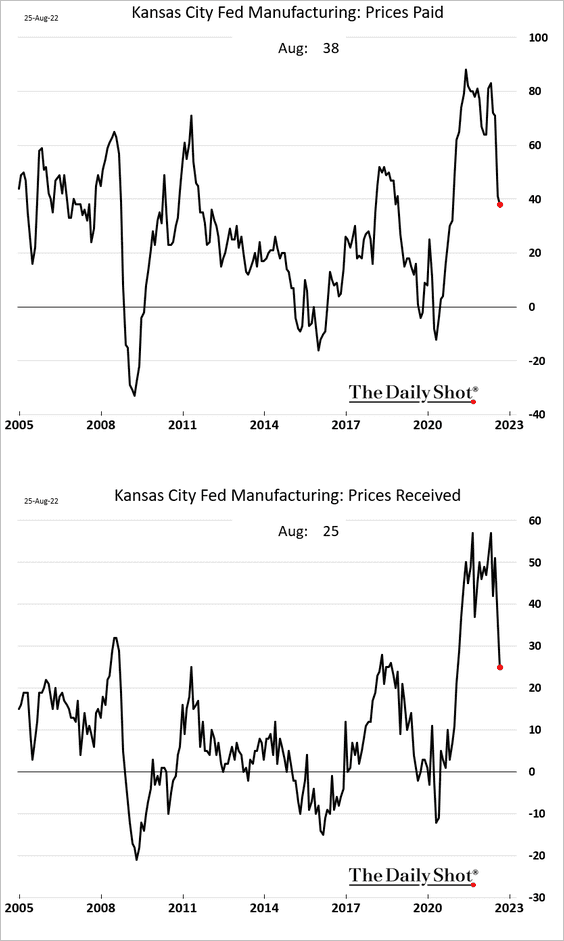
• Price pressures are moderating.
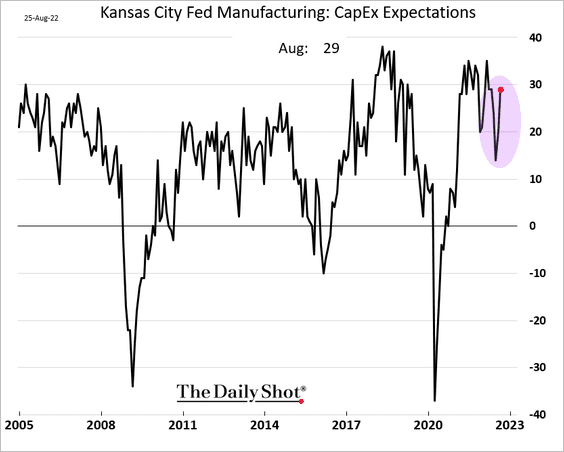
• CapEx expectations improved.
——————–
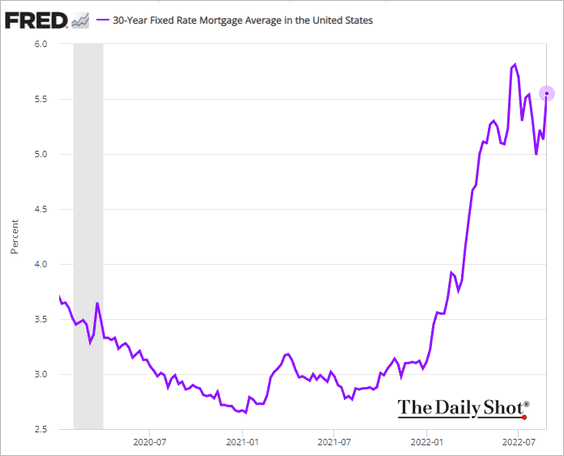
5. Now, let’s take a look at housing.
• Mortgage rates climbed this week with Treasury yields.
• The Commonwealth Demand/Supply Ratio points to a sharp deceleration in home price appreciation.
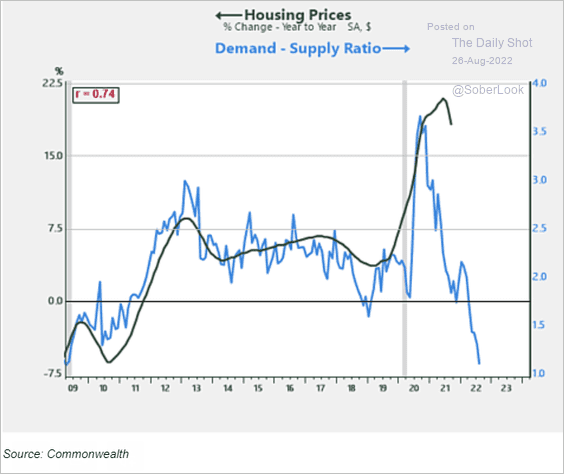 Source: Peter Essele, Commonwealth
• Sellers are going on strike.
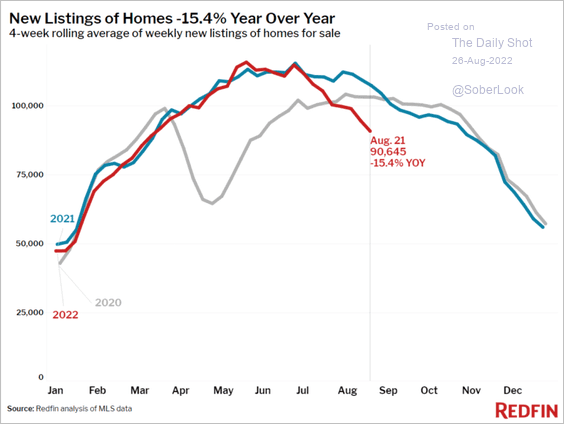 Source: Redfin
• Housing demand is down but not out.
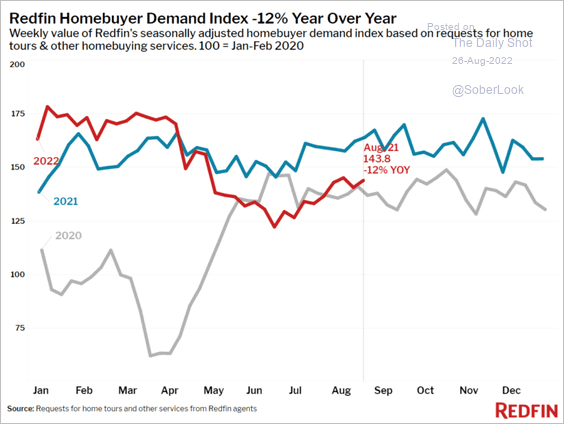 Source: Redfin
——————–
6. Consumer confidence appears to have stabilized.
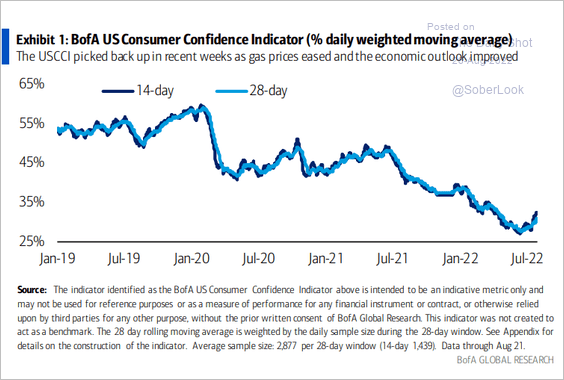 Source: BofA Global Research
Back to Index
Canada
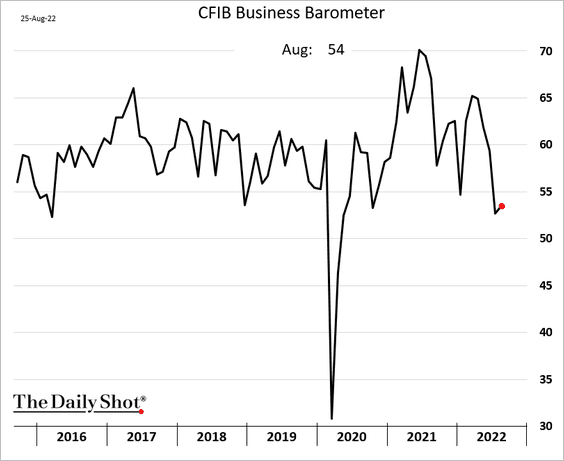
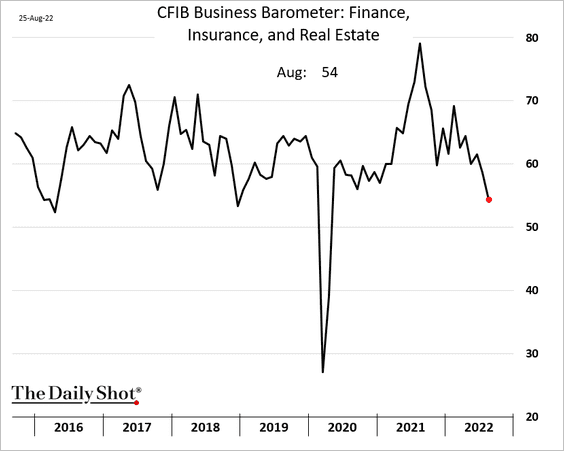
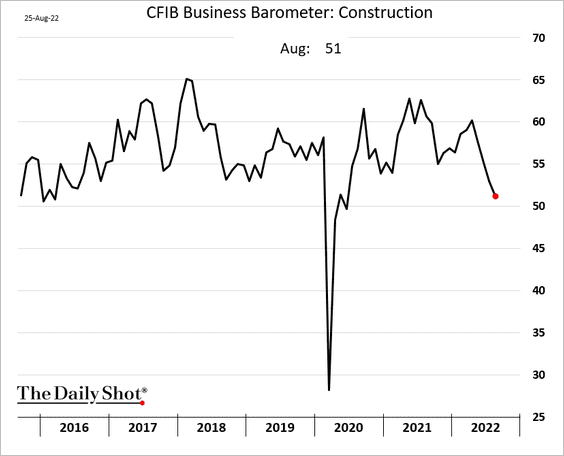
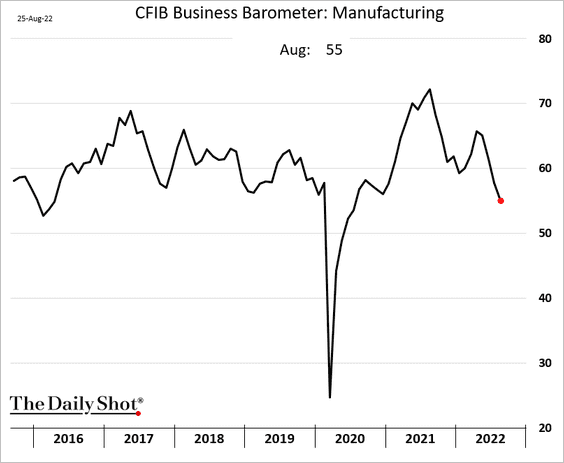
1. The CFIB small/medium-size business indicator edged higher this month.
• Housing-related components have softened (2 charts).
• Manufacturing is also weaker.
——————–
2. Net share buybacks have been surging.
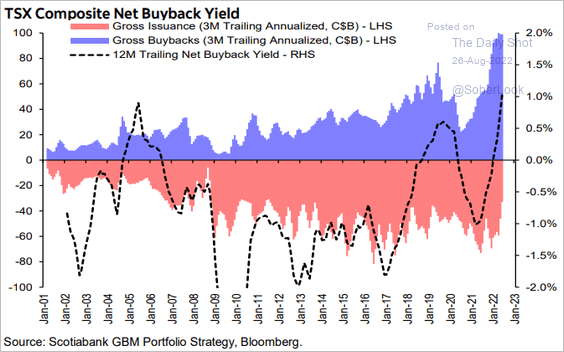 Source: Hugo Ste-Marie, Portfolio & Quantitative Strategy Global Equity Research, Scotia Capital
Back to Index
The United Kingdom
1. The CBI retail sales index unexpectedly jumped this month, driven by grocery purchases.
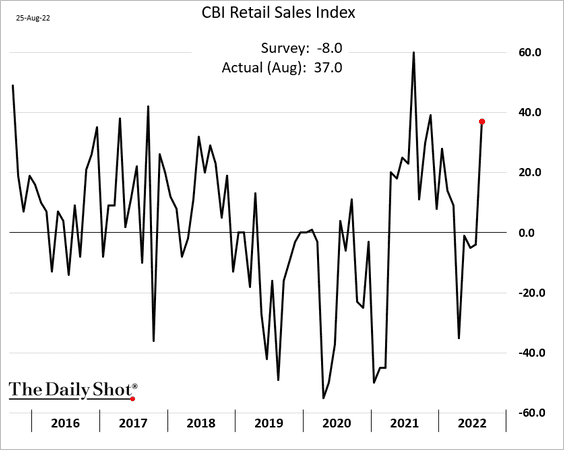
 Source: Reuters Read full article
2. Rising inventories point to some moderation in goods CPI.
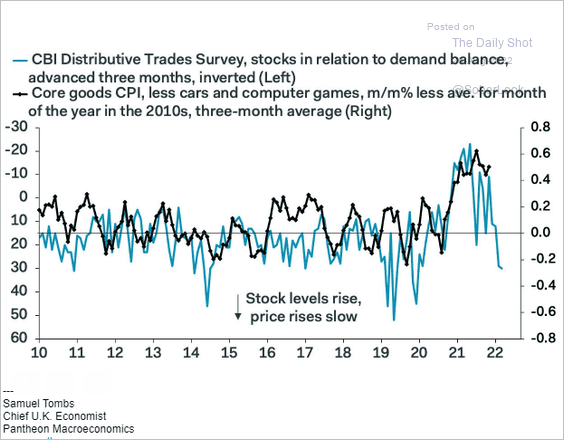 Source: Pantheon Macroeconomics
3. Inflation-linked bonds will be costly for the government.
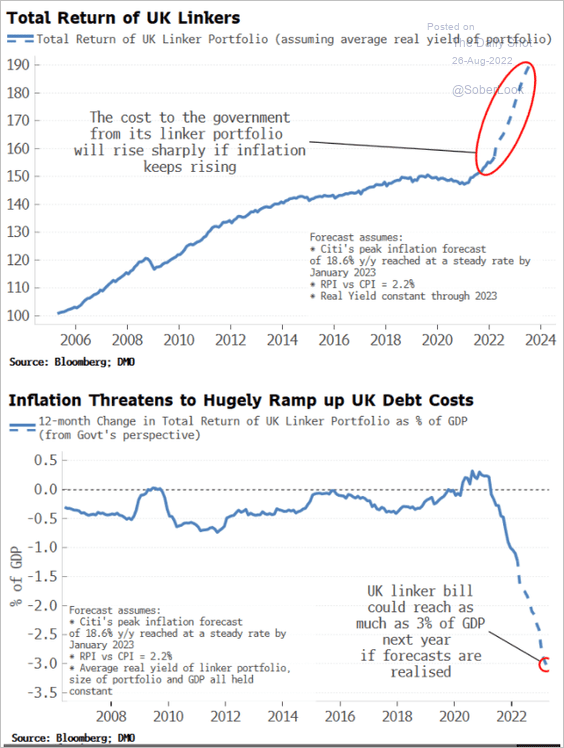 Source: Simon White, Bloomberg Markets Live Blog
Back to Index
The Eurozone
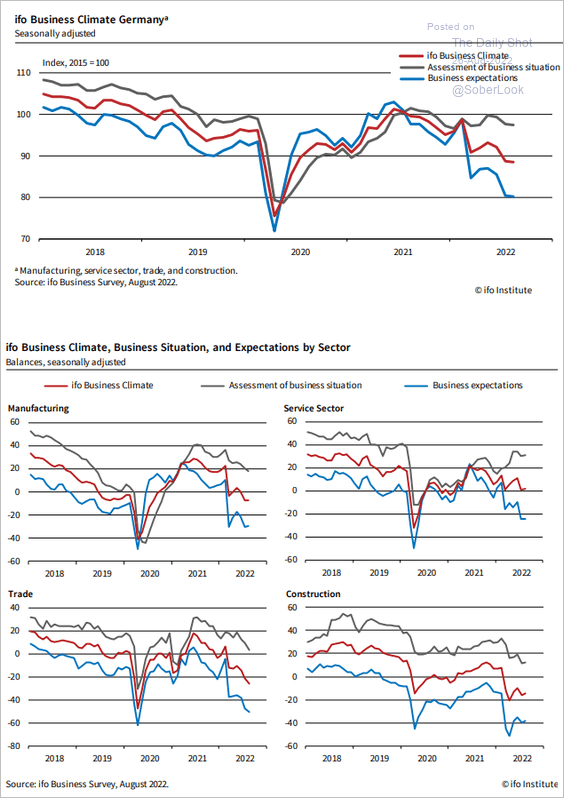
1. Germany’s Ifo expectations index was a touch better than expected, but business sentiment remains depressed, …
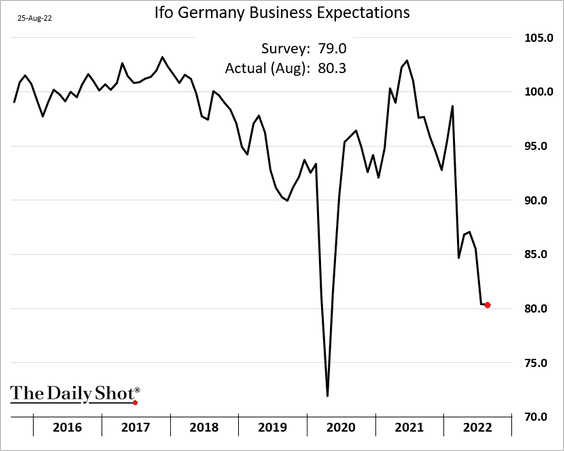
… pointing to a GDP contraction.
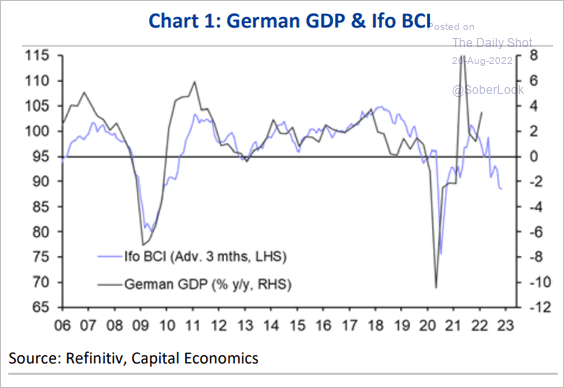 Source: Capital Economics
The combination of Ifo and PMI indicators signals a recession in Germany.
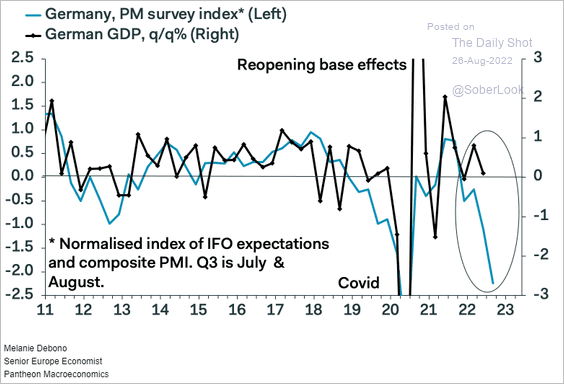 Source: Pantheon Macroeconomics
Here is the Ifo sector breakdown.
 Source: ifo Institute
——————–
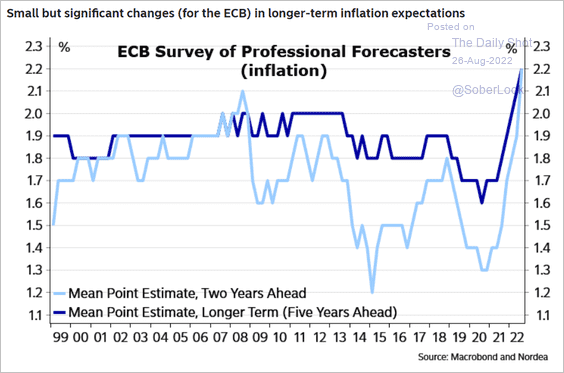
2. Inflation expectations signal more ECB rate hikes ahead.
 Source: Nordea Markets
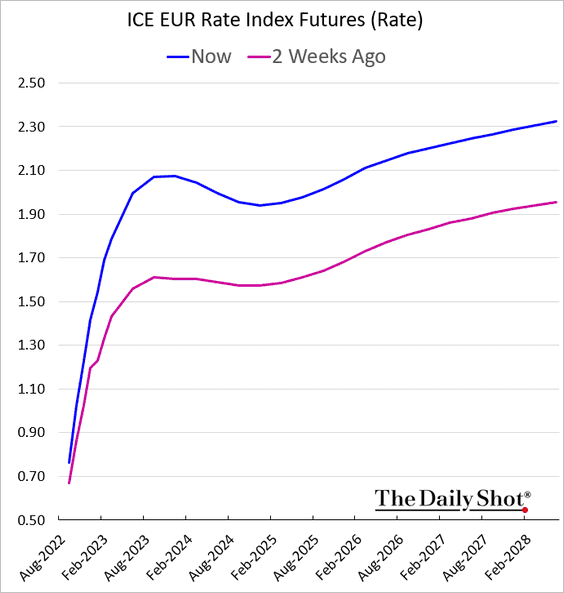
Here is the market-implied rate hike trajectory.
——————–
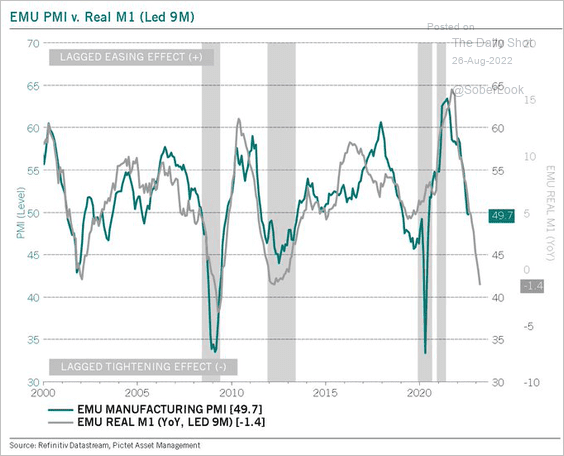
3. Tighter liquidity conditions point to further deterioration in the Eurozone’s business activity.
 Source: @steve_donze
Leading indicators do as well.
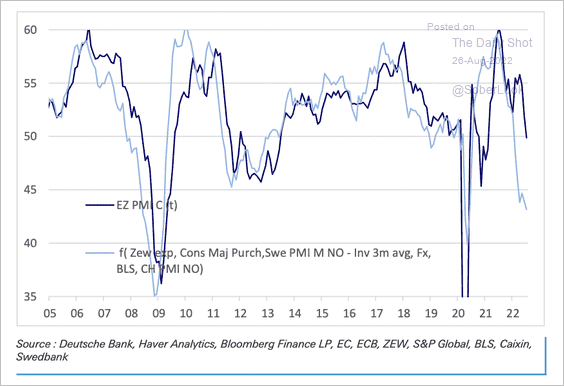 Source: Deutsche Bank Research
——————–
4. Hedge funds are betting against Italian debt ahead of the elections.
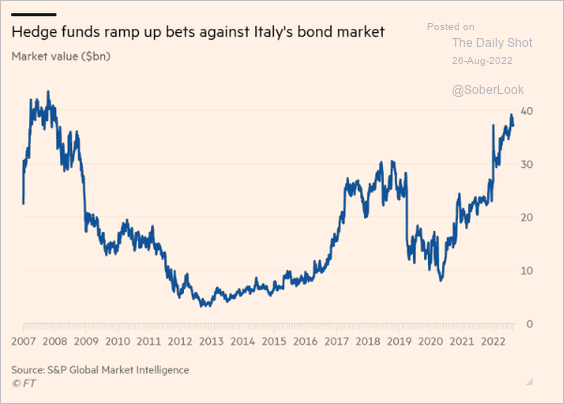 Source: @financialtimes Read full article
5. Euro-area growth was dampened by deleveraging over the past decade.
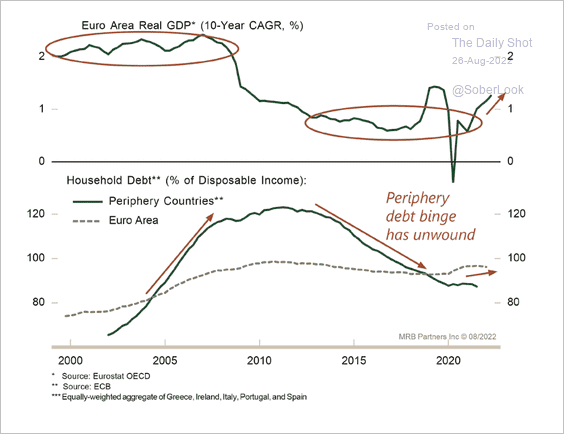 Source: MRB Partners
Back to Index
Europe
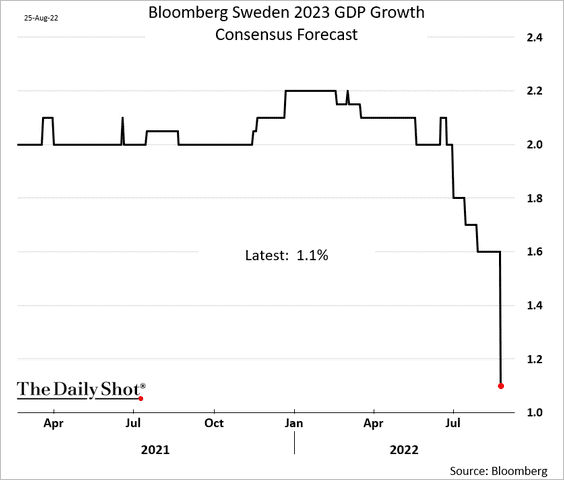
1. Economists sharply downgraded their 2023 growth forecasts for Sweden.
2. European nations are rapidly building their natural gas inventories, …
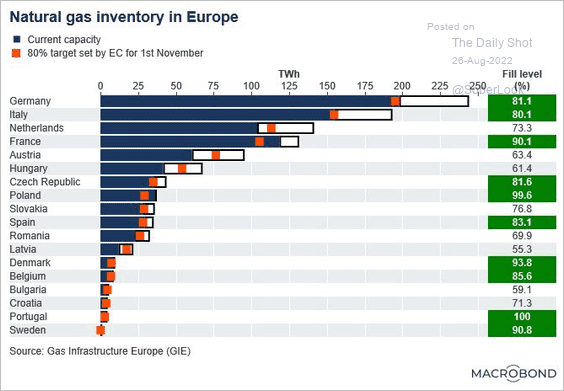 Source: @AndreasSteno
… by cutting demand (and praying for a warm winter).
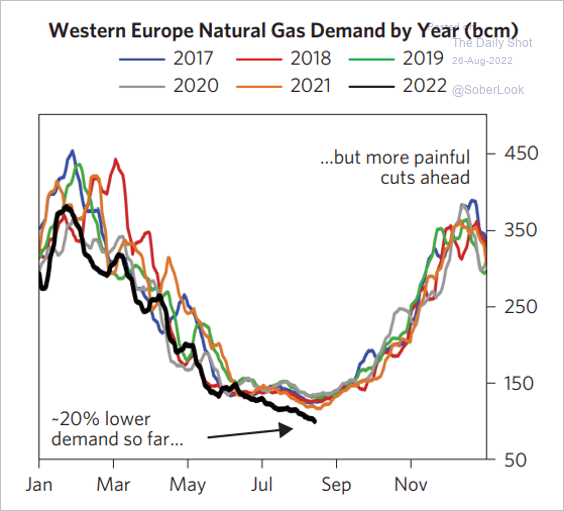 Source: Bridgewater Associates Read full article
——————–
3. Here is the expected duration of working life in the EU.
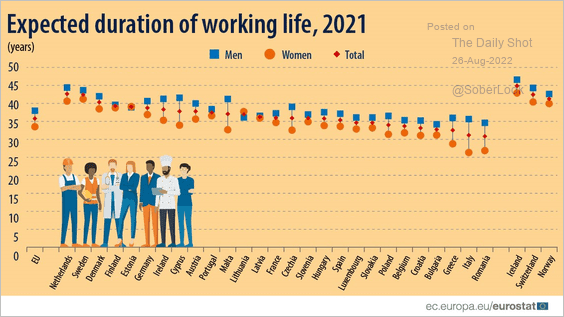 Source: Eurostat Read full article
Back to Index
Japan
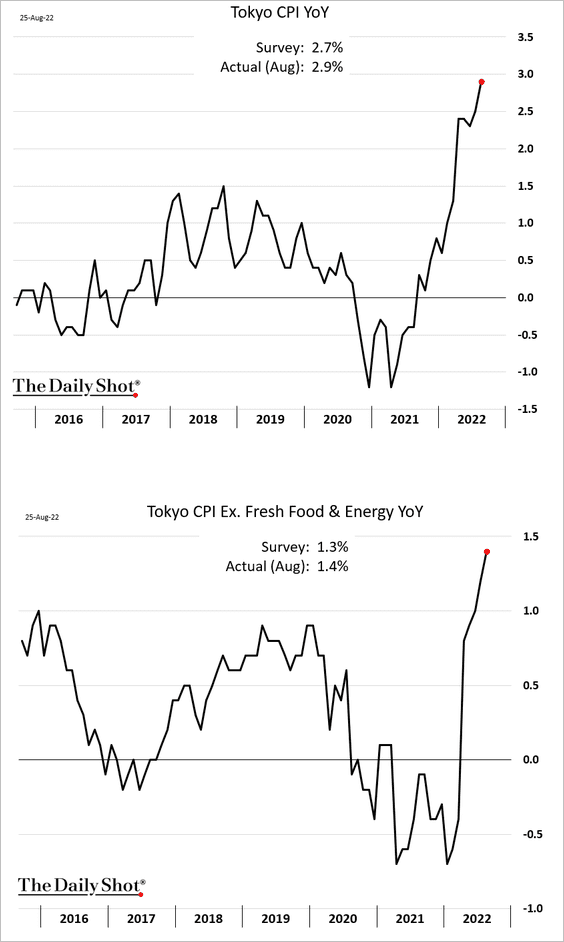
1. The August Tokyo CPI, which comes out well ahead of the national figures, surprised to the upside.
2. COVID cases in Japan are surging.
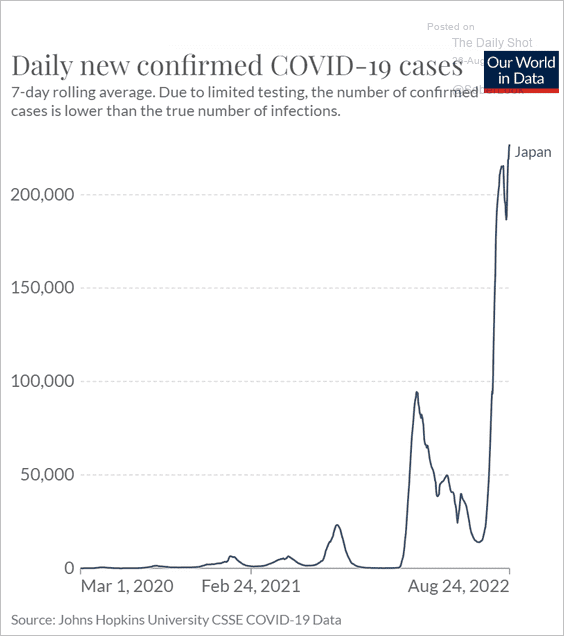 Source: Our World in Data
3. Japan’s total energy consumption has been declining over the past decade.
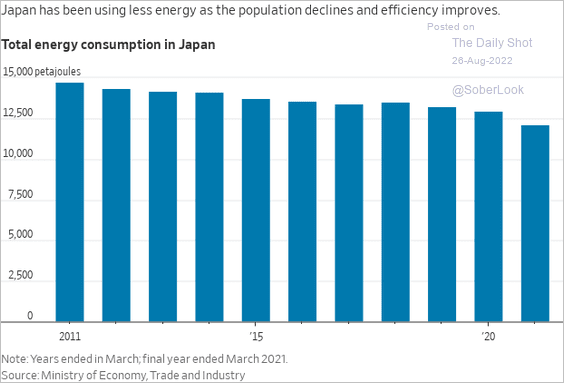 Source: @WSJ Read full article
Back to Index
Asia – Pacific
1. South Korea’s demographics continue to deteriorate.
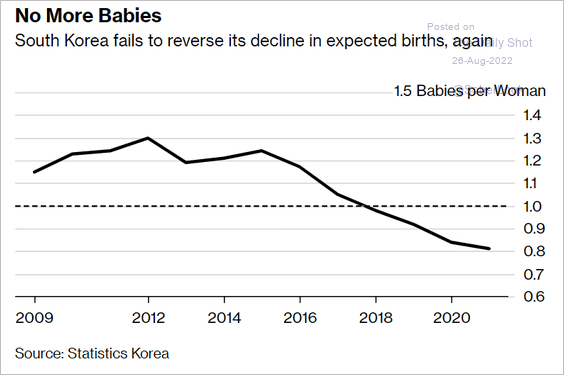 Source: @samkimasia, @business Read full article
2. New Zealand’s home prices are taking a hit.
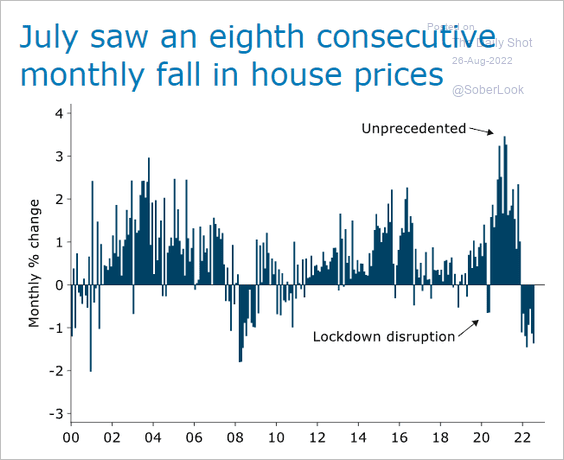 Source: @ANZ_Research
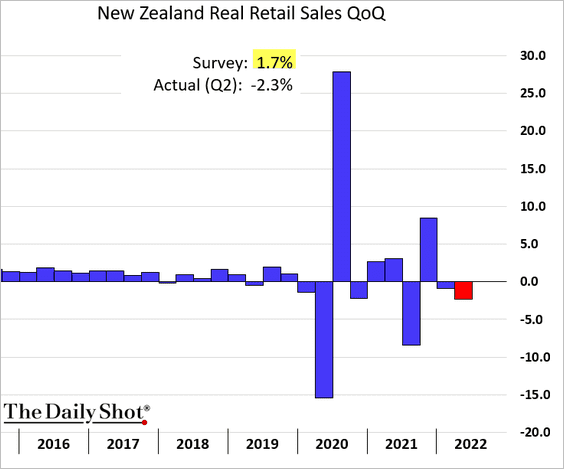
Separately, the nation’s retail sales unexpectedly declined last quarter.
——————–
3. Australia’s households are heavily indebted.
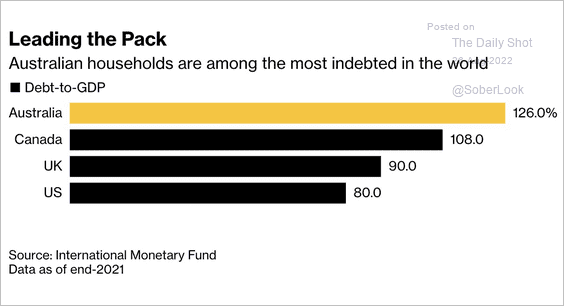 Source: @acemaxx, @economics Read full article
Back to Index
China
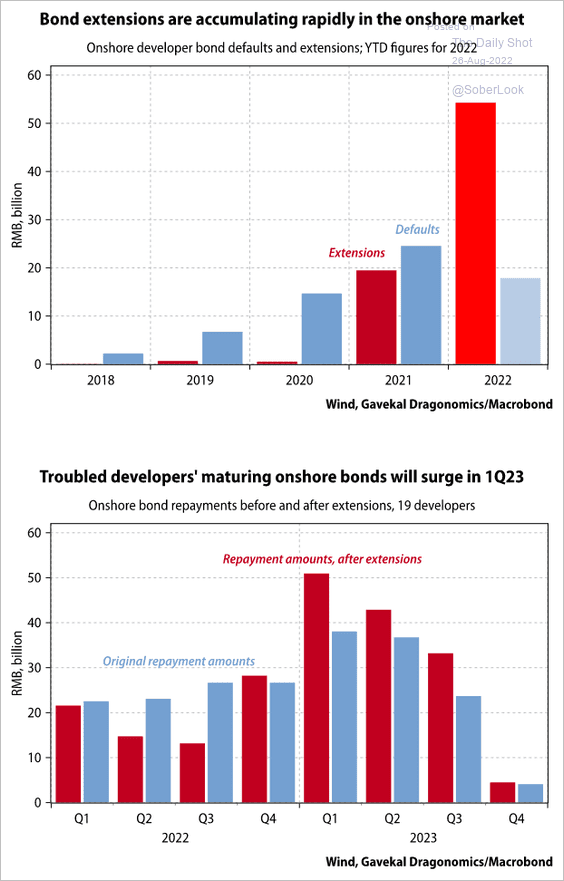
1. Developers’ onshore debt extensions have been rapidly accumulating, according to Gavekal Research. Next year’s maturity wall looks ugly.
 Source: Gavekal Research Read full article
• Domestic bond issuance has been shut off for private-sector developers.
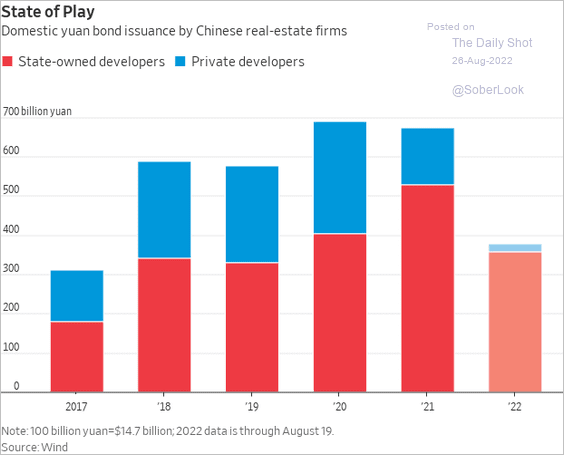 Source: @WSJ Read full article
• Offshore debt markets are mostly shut off for the nation’s developers.
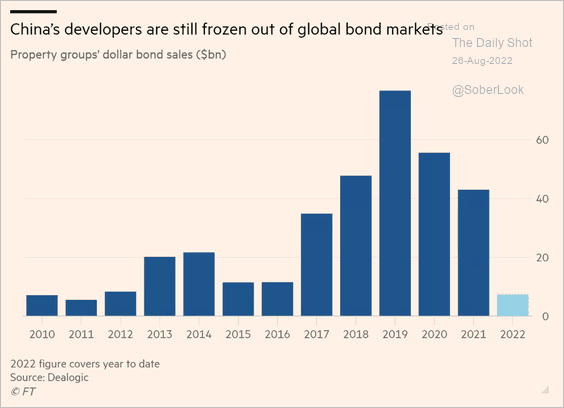 Source: @financialtimes Read full article
——————–
2. Here is China’s total debt as a share of GDP.
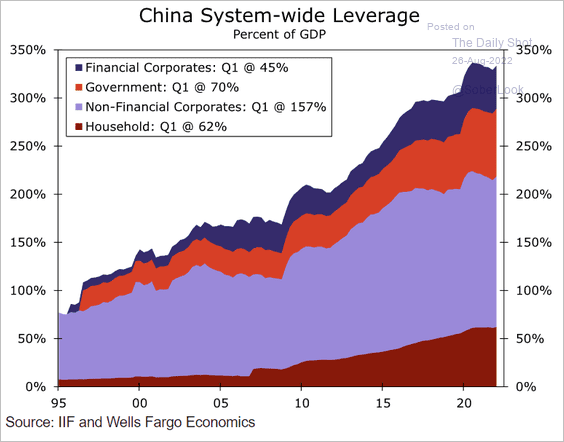 Source: BofA Global Research
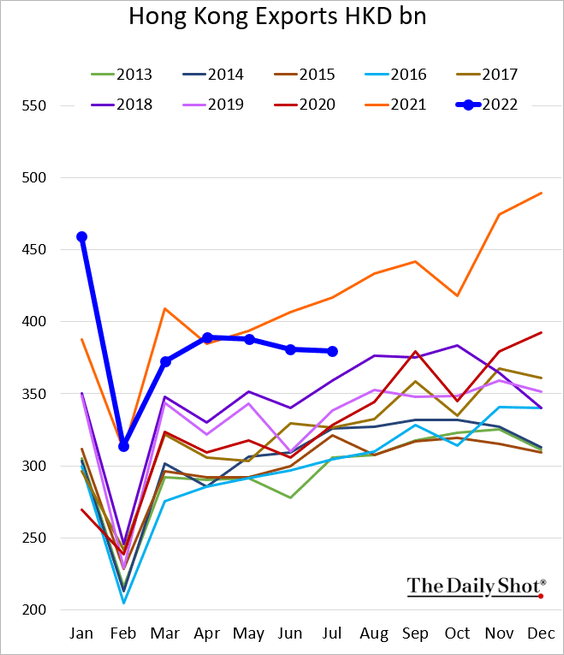
3. Hong Kong’s exports have been slowing.
Back to Index
Emerging Markets
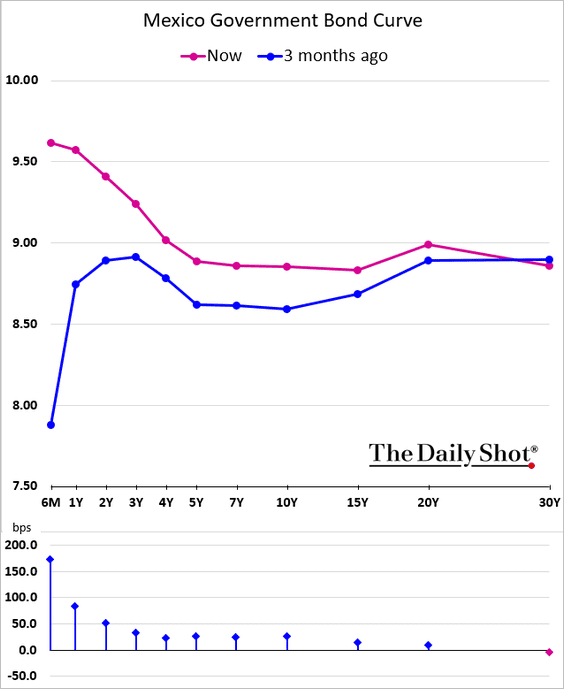
1. Let’s begin with Mexico.
• Economic activity has been underperforming due to weak investment.
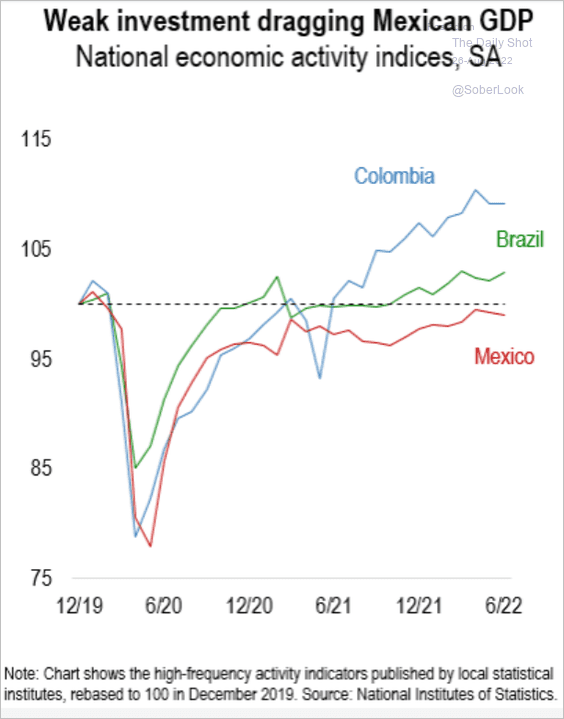 Source: Numera Analytics
• The yield curve is heavily inverted now.
• The peso has outperformed other EM currencies.
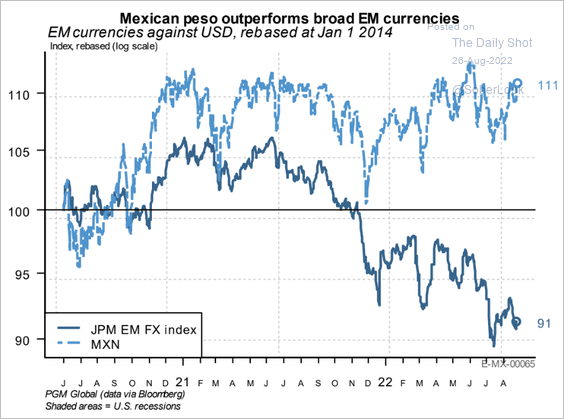 Source: PGM Global
——————–
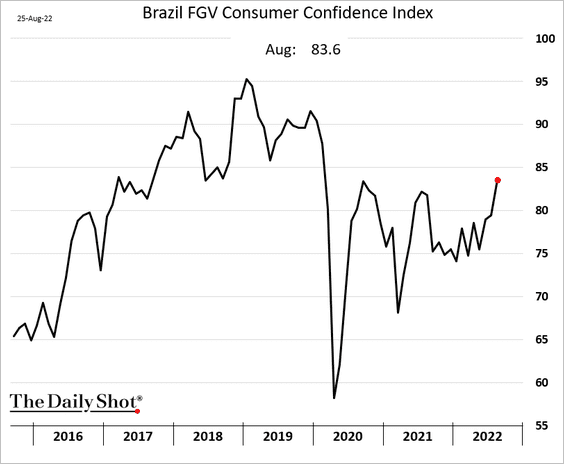
2. Brazil’s consumer sentiment is rebounding.
3. Chile’s CPI will moderate as liquidity tightens.
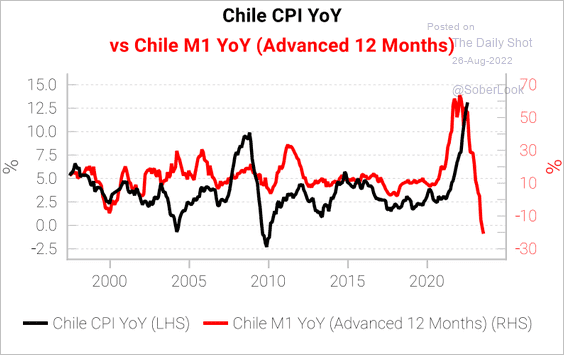 Source: Variant Perception
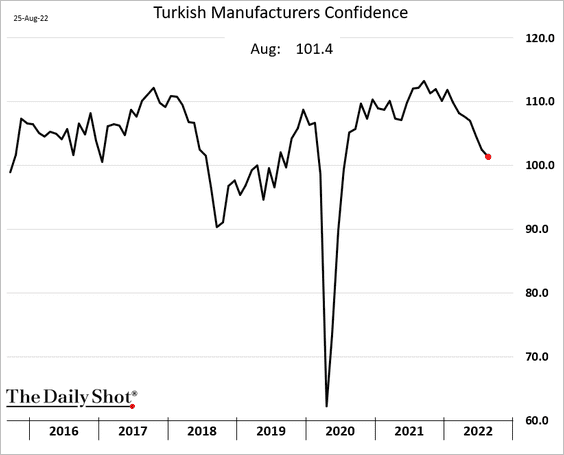
4. Turkey’s manufacturing confidence is deteriorating.
5. EM corporate earnings could decline as liquidity tightens.
 Source: BCA Research
Back to Index
Energy
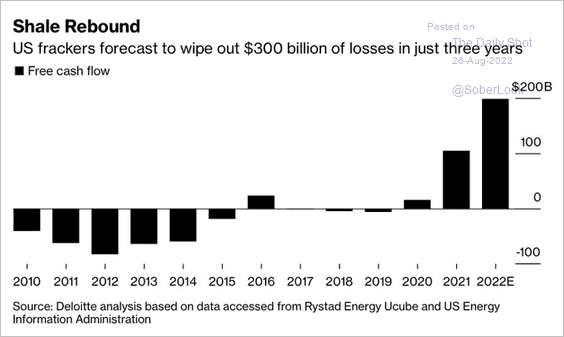
1. US frackers are expected to make $200 billion this year.
 Source: @jessefelder, Bloomberg Read full article
2. Has US crude oil production peaked for now?
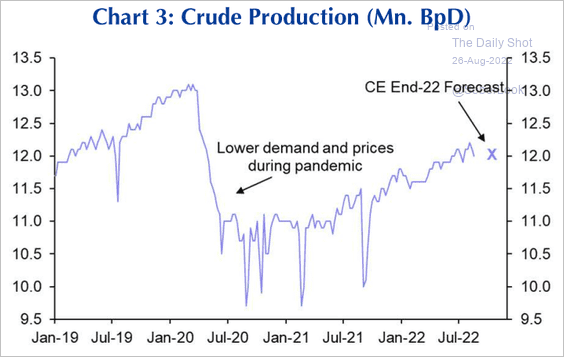 Source: Capital Economics
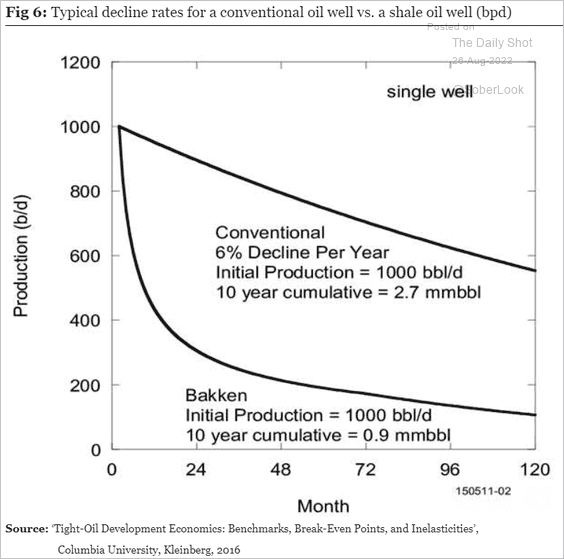
By the way, shale wells have a much shorter lifespan than conventional wells.
 Source: Longview Economics
——————–
3. Next, we have some updates on Russia’s crude oil output.
• Exports:
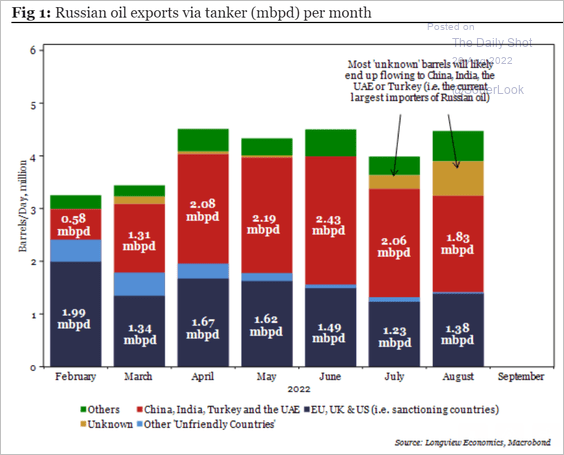 Source: Longview Economics
• Tanker traffic:
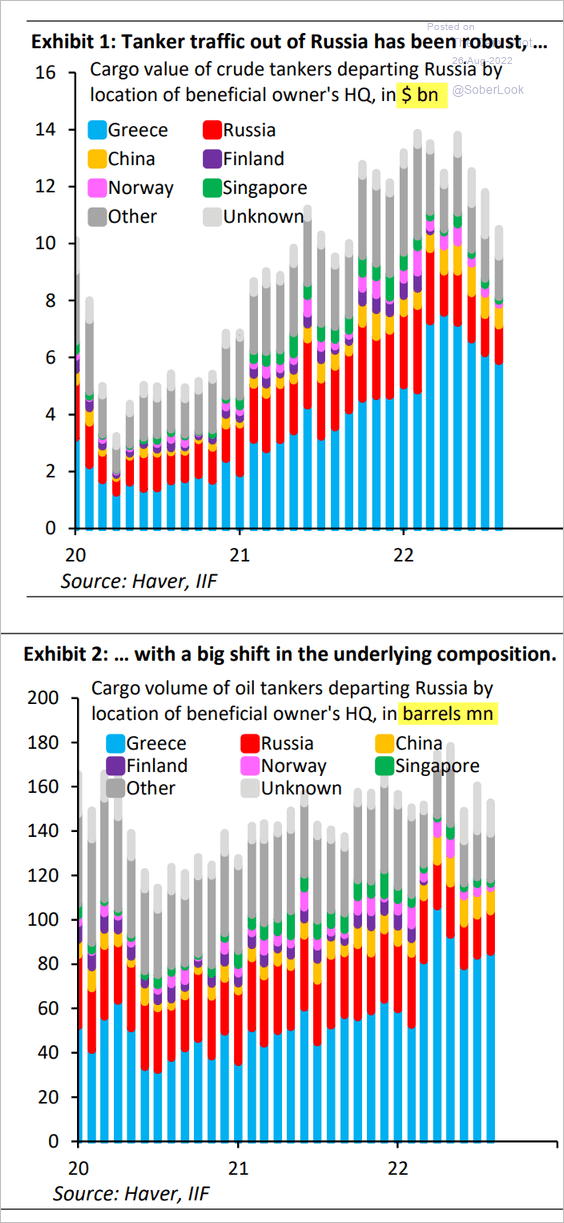 Source: IIF
• Production forecast:
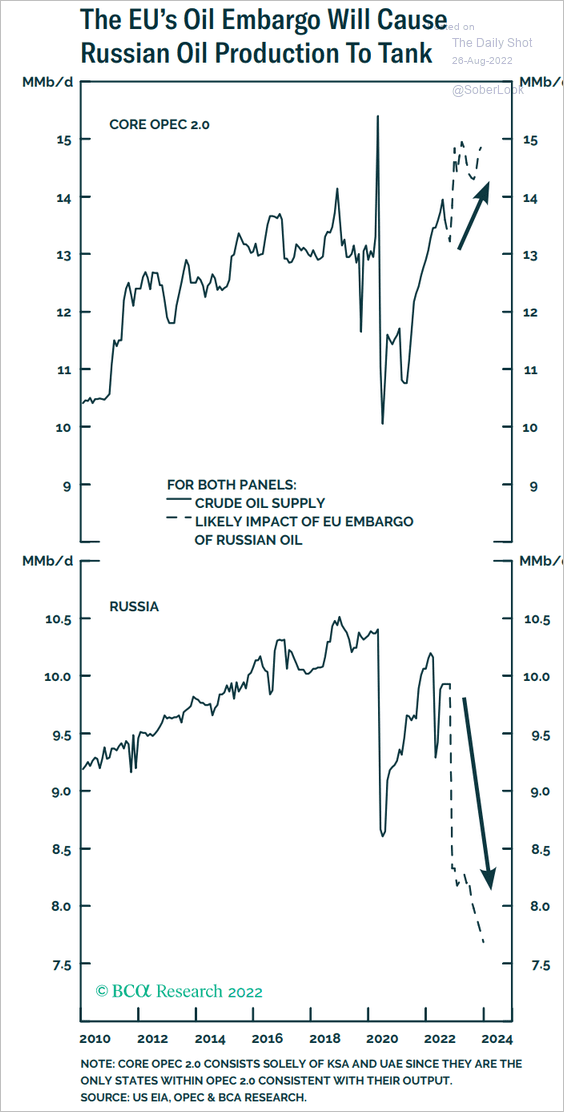 Source: BCA Research
• The Urals/Brent spread:
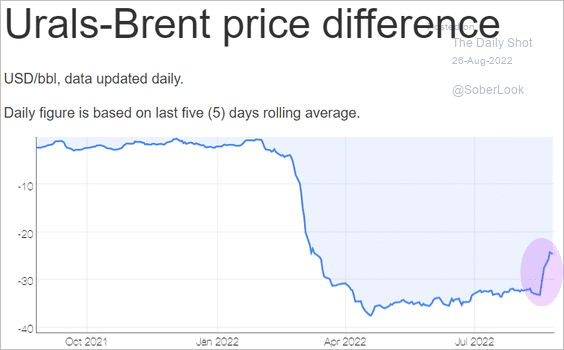 Source: Neste
——————–
4. Solar power costs have been declining as installed capacity grew.
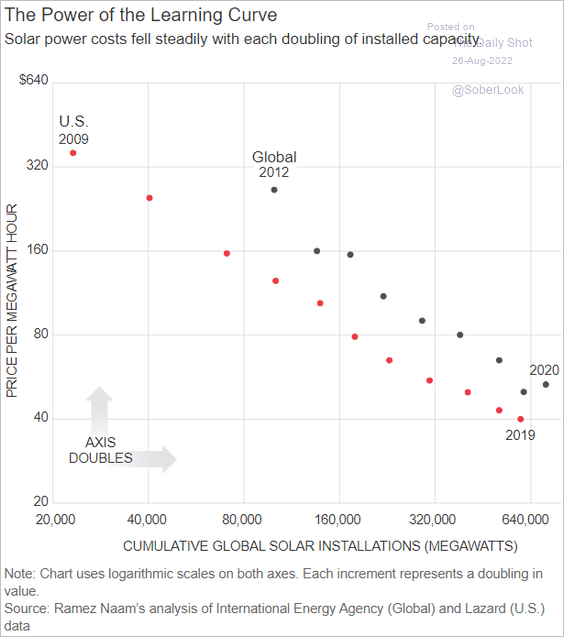 Source: @WSJ Read full article
This chart shows US utility-scale solar capacity additions.
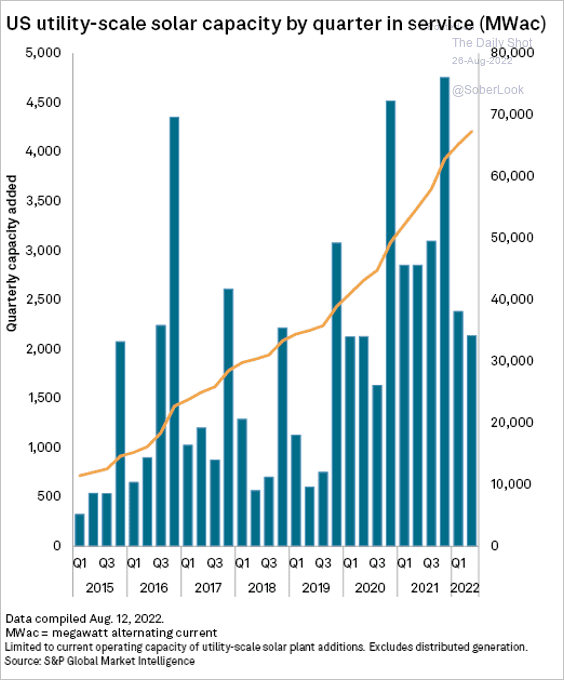 Source: S&P Global Market Intelligence
Back to Index
Equities
1. Corporate margins hit a multi-decade high last quarter.
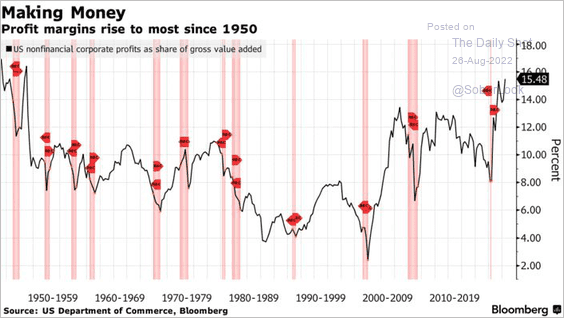 Source: Bloomberg Read full article
2. PMI indicators continue to signal deterioration in corporate profits.
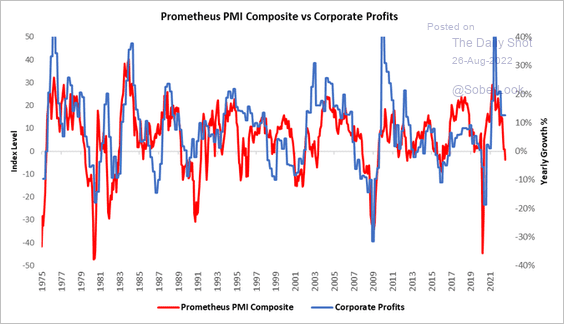 Source: @pav_chartbook, @prometheusmacro
3. Retail investors’ average portfolio is still ahead of the S&P 500 since the start of the pandemic, but the outperformance is dwindling.
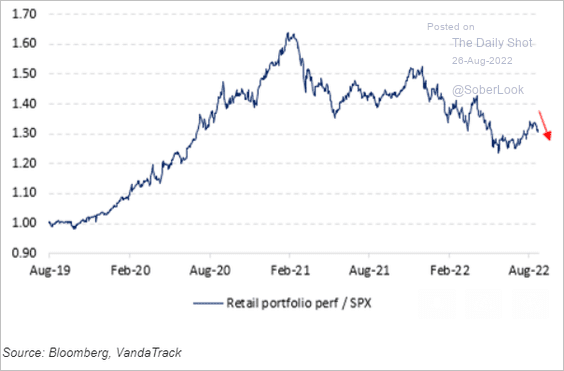 Source: Vanda Research
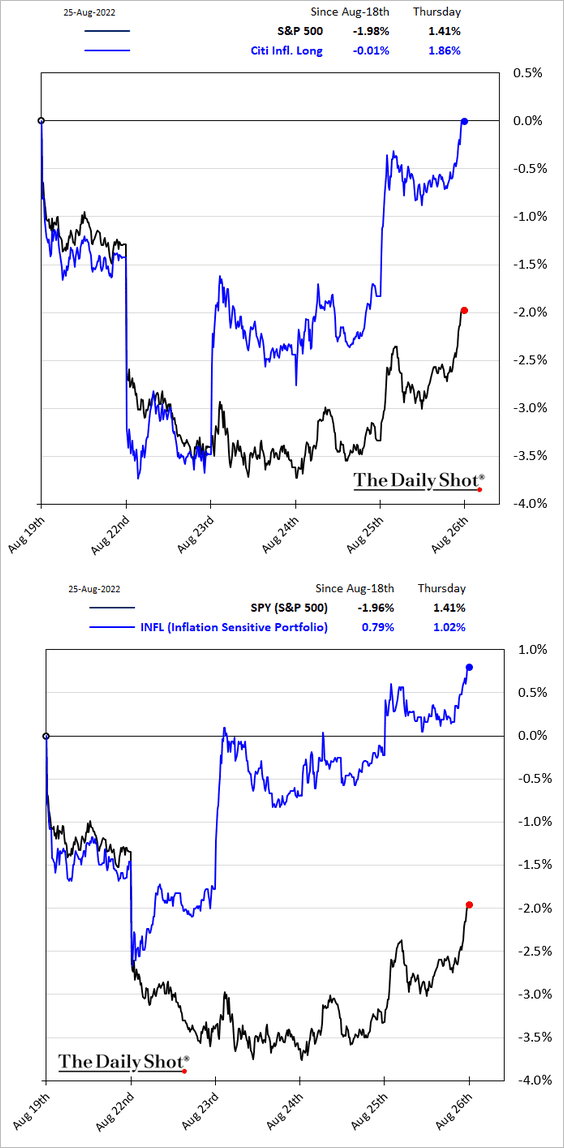
4. Companies that benefit from higher inflation have been outperforming this week.
5. Sector return dispersion is at the highest level since the dot-com era.
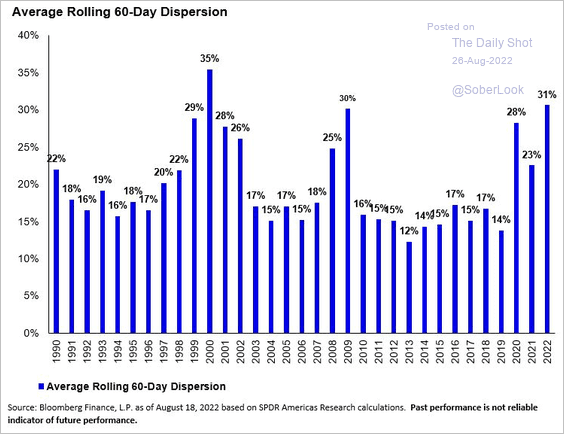 Source: SPDR Americas Research, @mattbartolini
6. This chart shows the sector composition of equity markets in advanced economies.
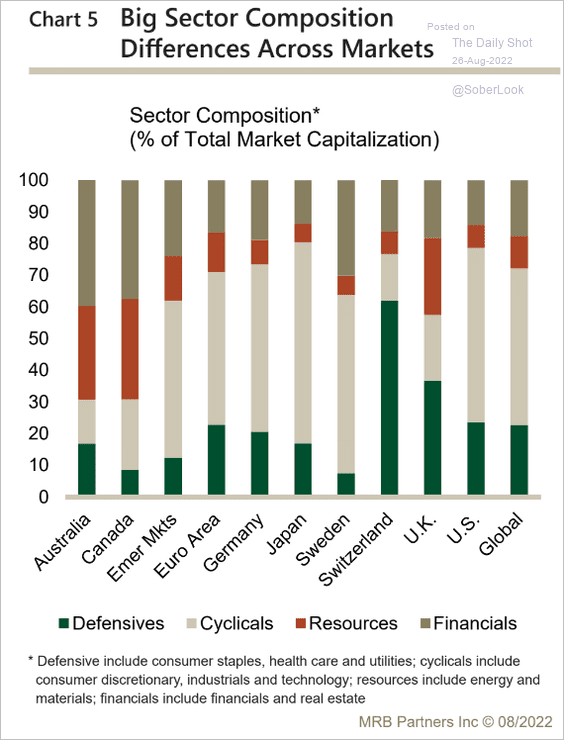 Source: MRB Partners
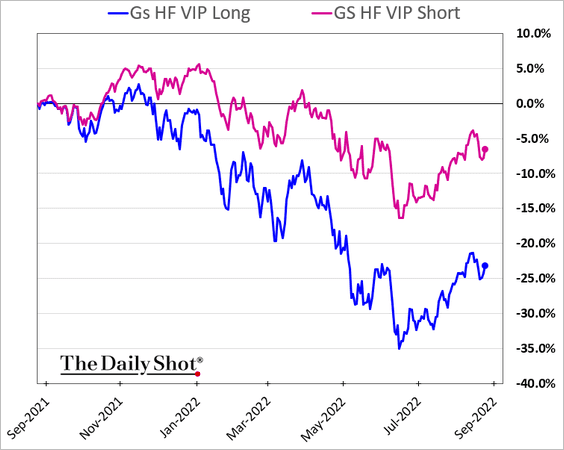
7. Hedge funds’ favorite long picks have significantly underperformed their short picks over the past 12 months.
Back to Index
Credit
1. Institutional fund managers have greatly reduced their credit exposure this year.
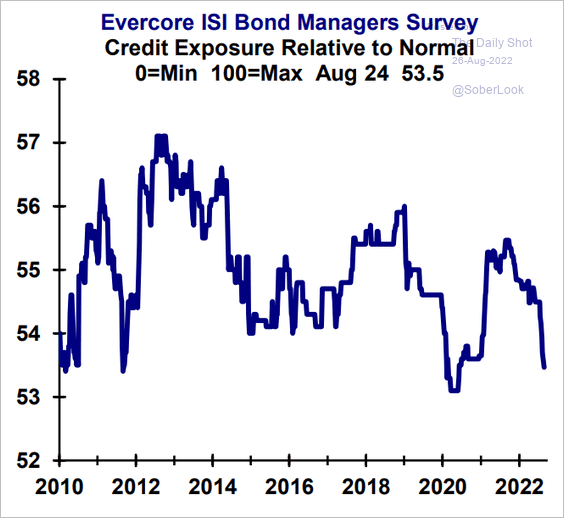 Source: Evercore ISI Research
2. Leveraged loan price dispersion has widened dramatically in recent months.
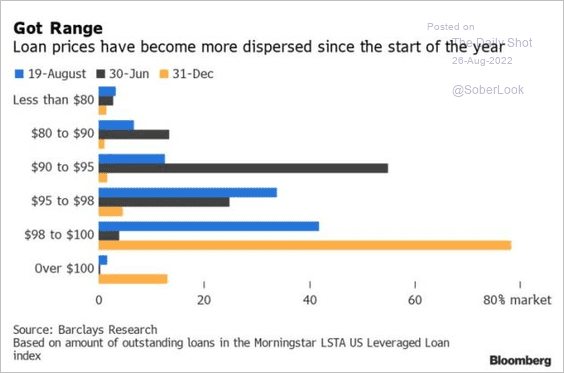 Source: Bloomberg Law Read full article
3. Student debt ABS share has been shrinking.
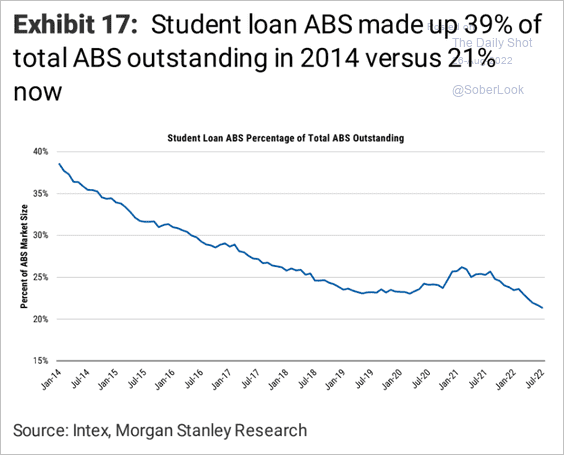 Source: Morgan Stanley Research
Back to Index
Global Developments
1. The US dollar appears to be overbought.
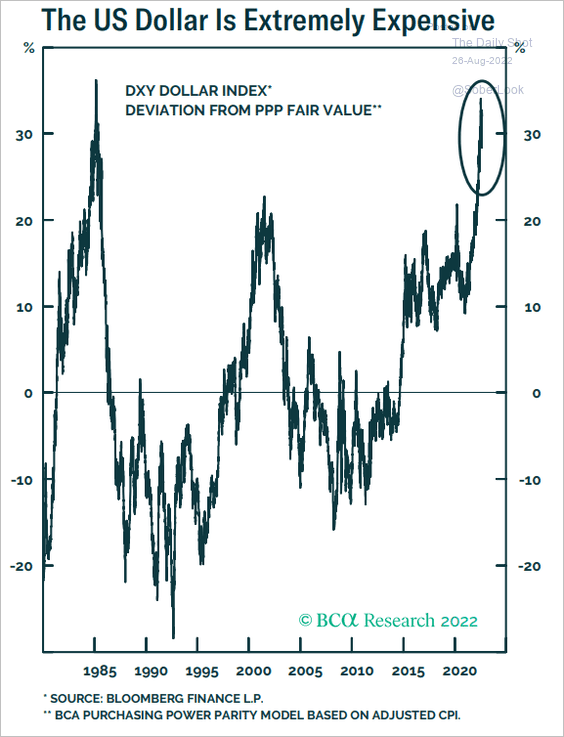 Source: BCA Research
2. Rate differentials will have a lower impact on currencies as economic growth slumps.
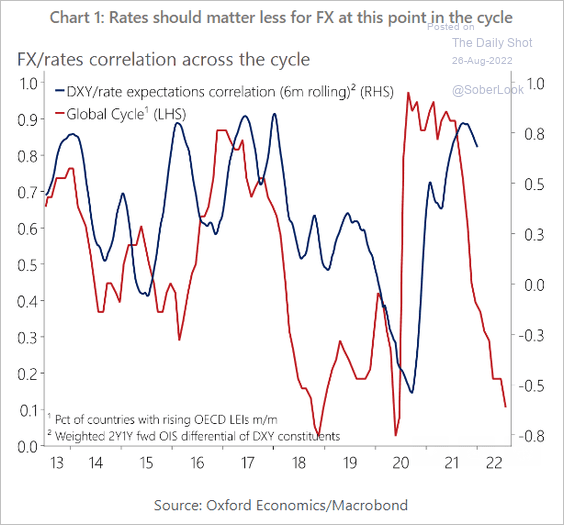 Source: Oxford Economics
3. Next, we have part-time employment in advanced economies.
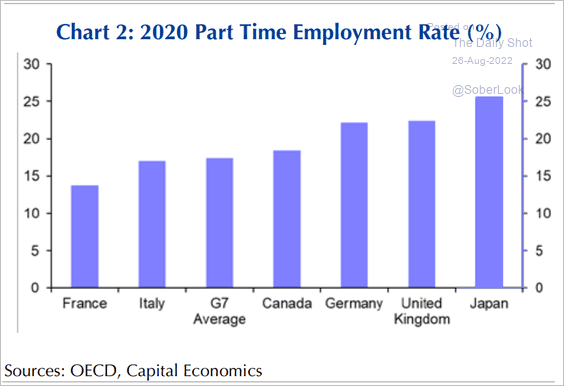 Source: Capital Economics
4. Secondhand luxury watch prices continue to trend down.
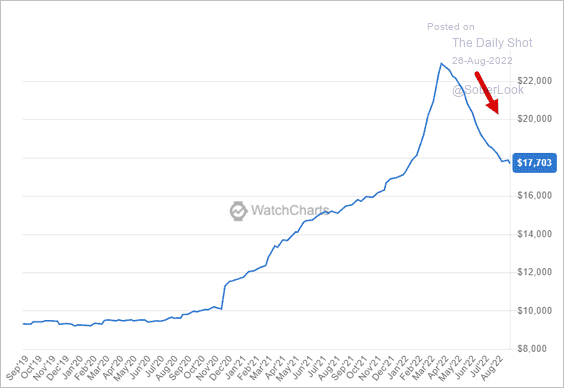 Source: WatchCharts
——————–
Food for Thought
1. Stay-at-home stocks:
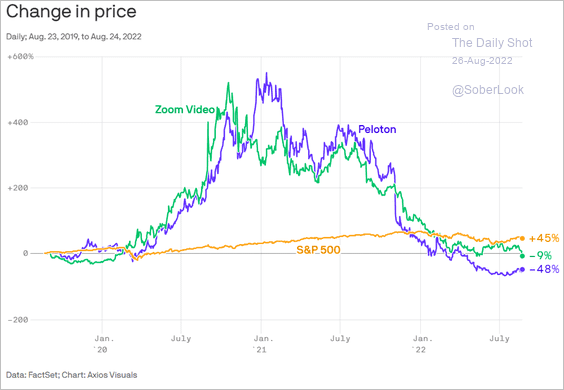 Source: @axios Read full article
2. Changes in US goods exports by destination in the first half of 2022:
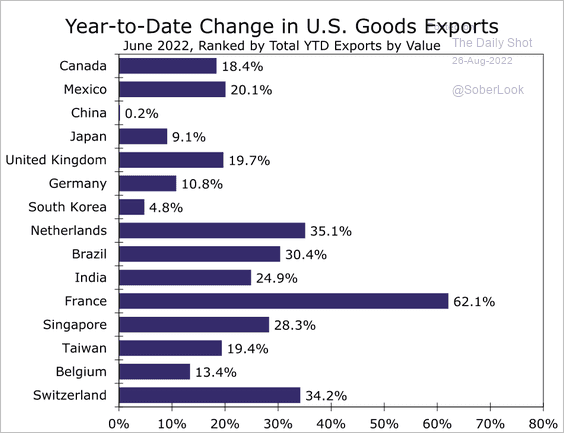 Source: Wells Fargo Securities
3. Saudi Aramco’s net profit:
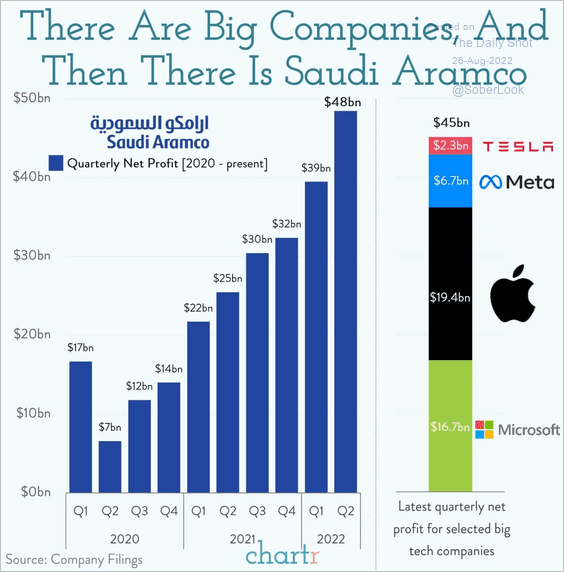 Source: @chartrdaily
4. Teen social media platform preferences:
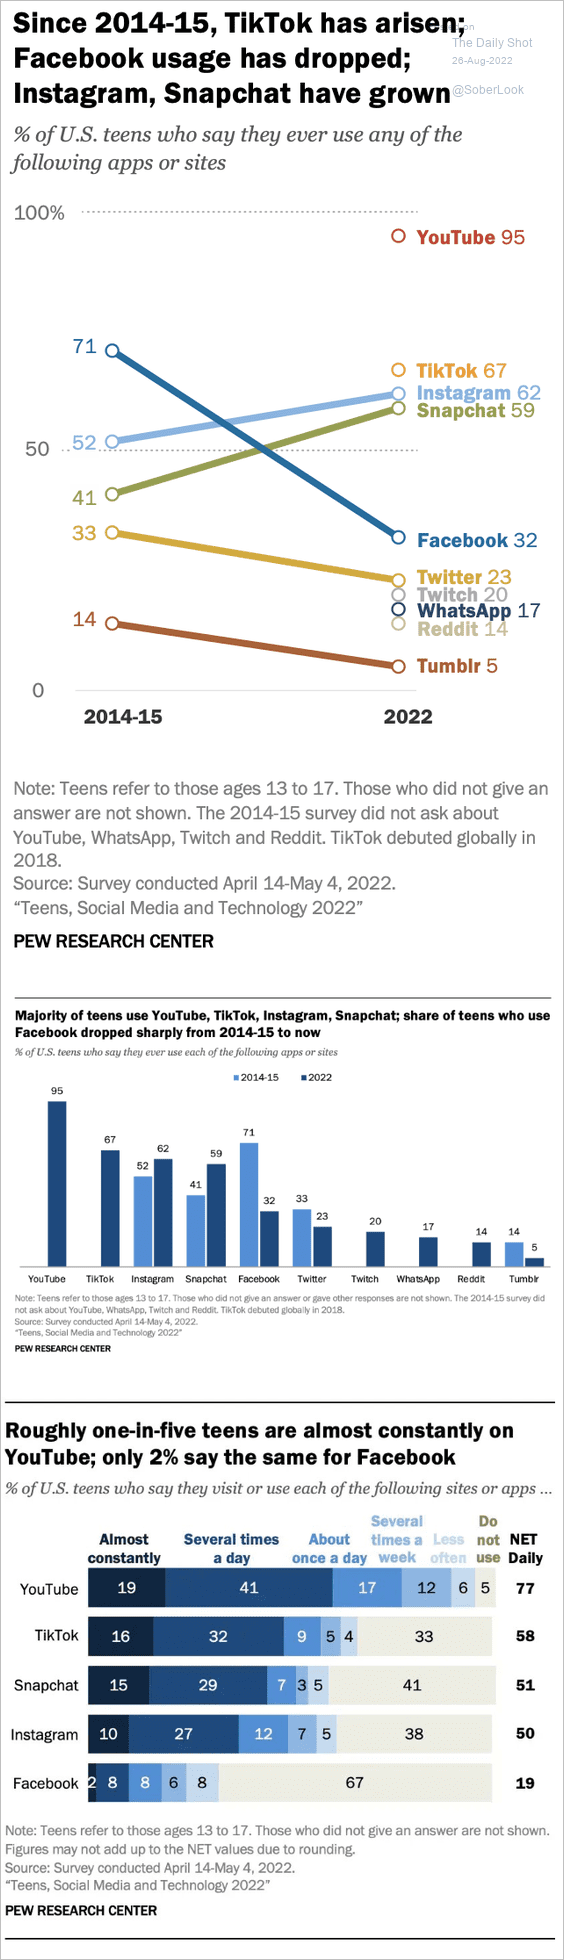 Source: Pew Research Center Read full article
5. US congressional trips to Taiwan:
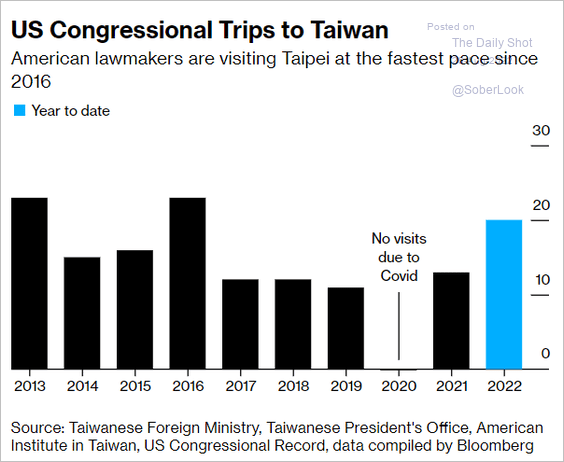 Source: Bloomberg Read full article
6. Student debt demographics:
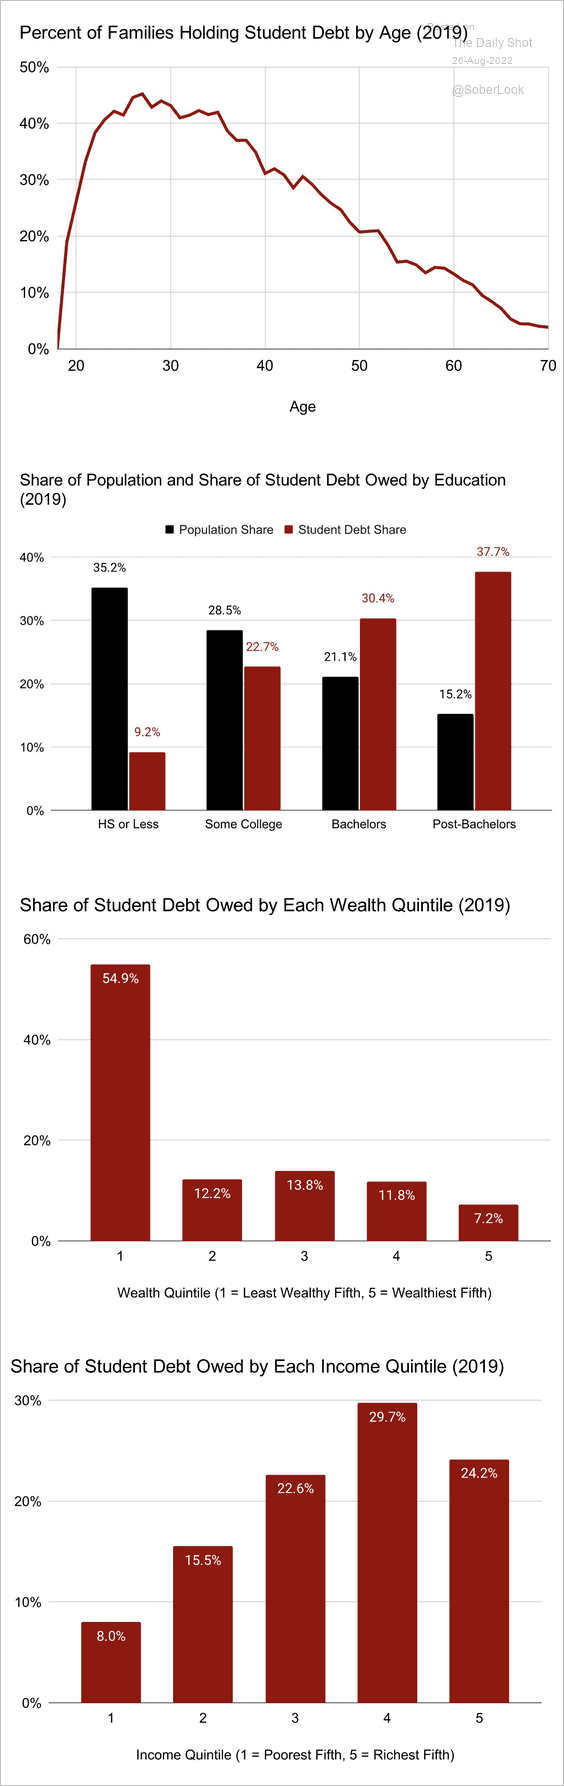 Source: @PplPolicyProj Read full article
7. Student loan forgiveness benefits share:
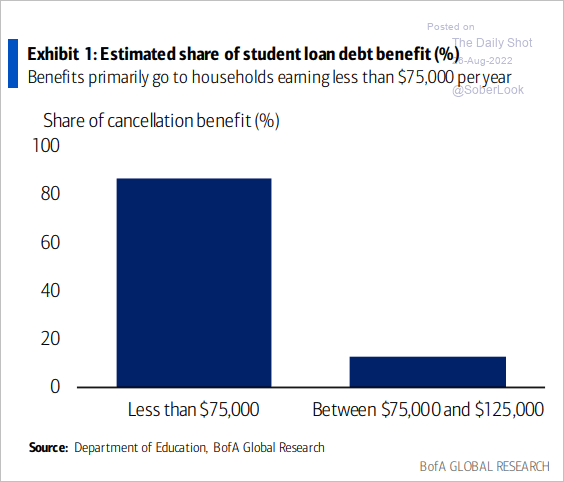 Source: BofA Global Research
8. What are you most likely to do when going on a first date?
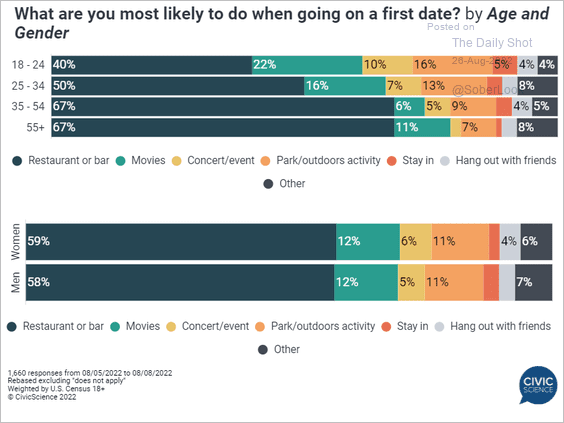 Source: @CivicScience
——————–
Have a great weekend!
Back to Index