
The Daily Shot: 30-Aug-22
• The United States
• Canada
• The United Kingdom
• The Eurozone
• Europe
• Asia – Pacific
• China
• Emerging Markets
• Cryptocurrency
• Commodities
• Energy
• Equities
• Credit
• Rates
• Global Developments
• Food for Thought
The United States
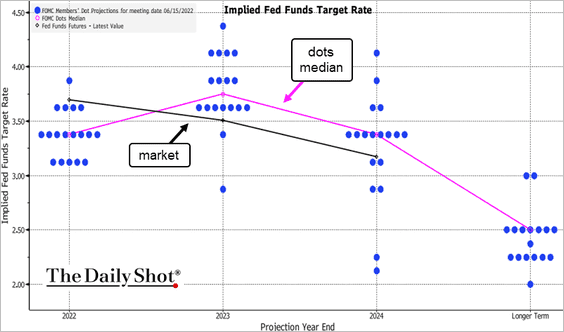
1. Powell’s Jackson Hole speech brought the market into a closer alignment with the FOMC’s dot plot.
 Source: @TheTerminal, Bloomberg Finance L.P.
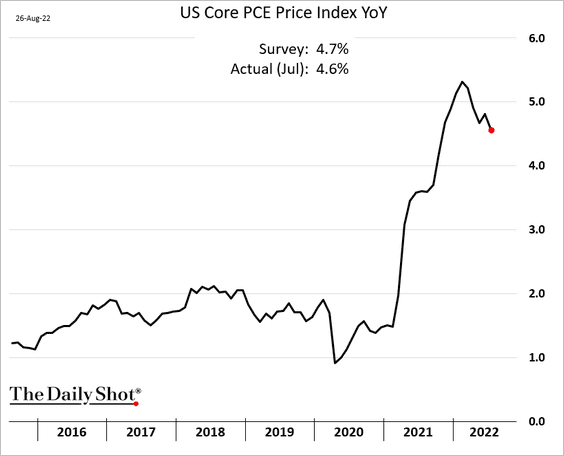
2. Next, let’s take a look at inflation.
• The PCE inflation measure is off the peak but remains much too high for the FOMC to consider a “pivot” any time soon.
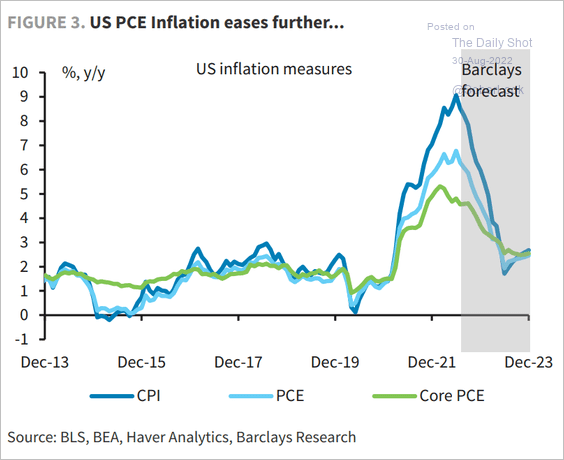
Forecasts call for moderating inflation over the next year.
– Oxford Economics:
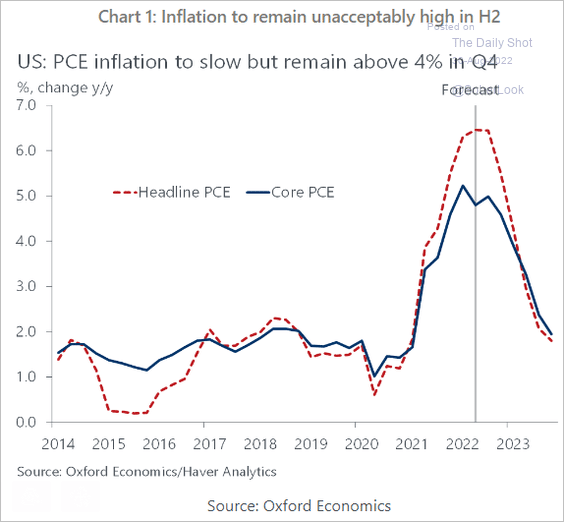 Source: Oxford Economics
– Barclays:
 Source: Barclays Research
Here are the PCE inflation components (monthly changes).
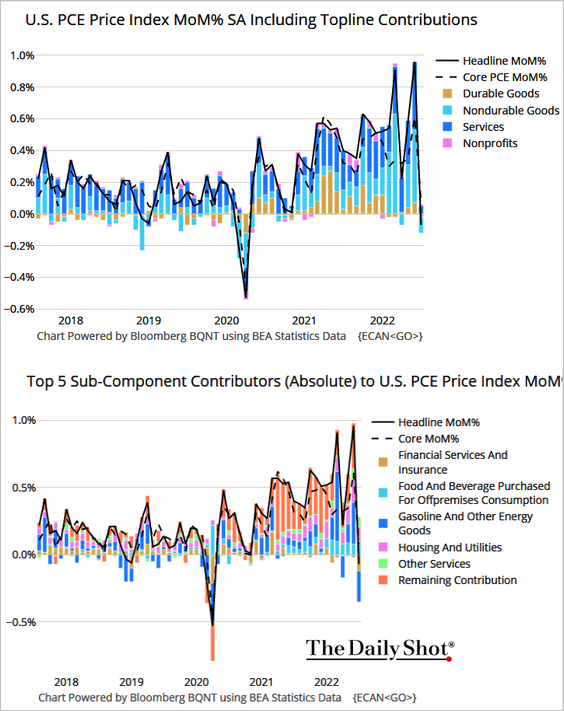 Source: @TheTerminal, Bloomberg Finance L.P.
• Market-based inflation expectations are a poor predictor of inflation.
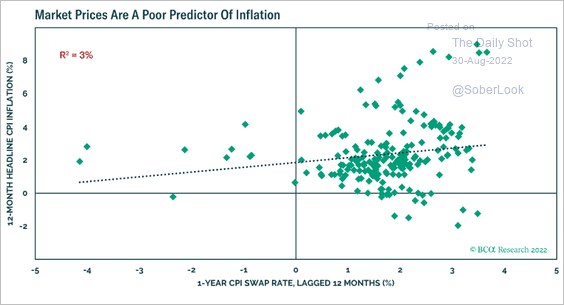 Source: BCA Research
• The US dollar strength should soften import prices.
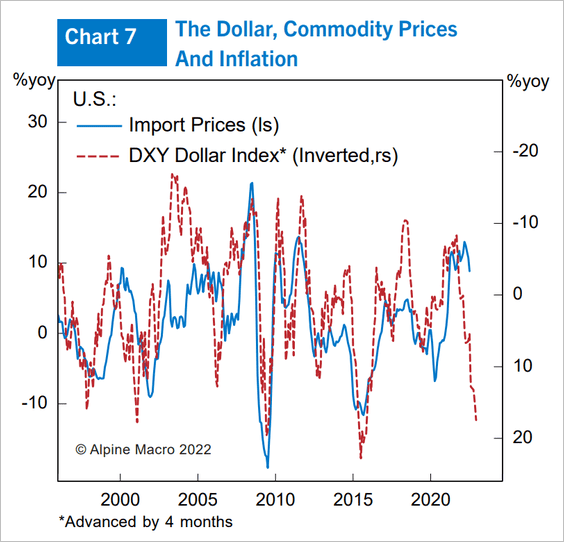 Source: Alpine Macro
• Businesses and investors expect inflation to stay above 3% next year.
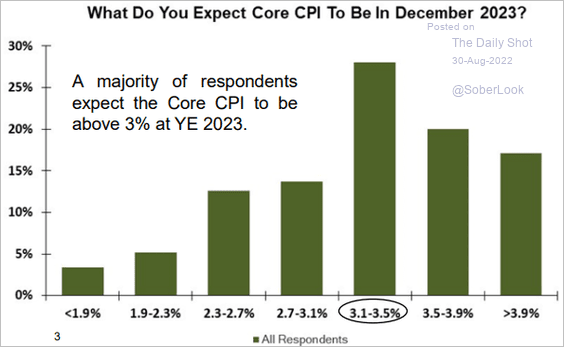 Source: Evercore ISI Research
——————–
3. Next, we have some updates on the housing market.
• Mortgage rates are nearing 6% again.
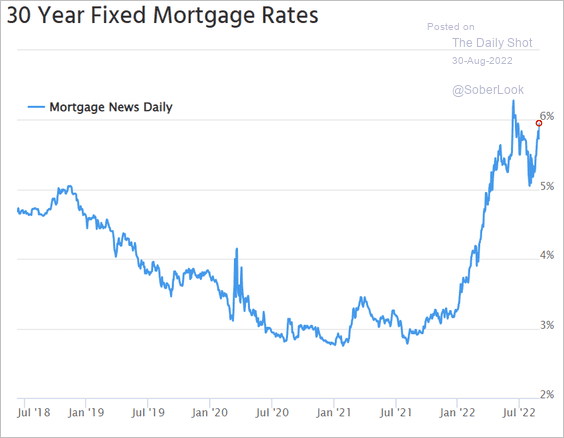 Source: Mortgage News Daily
• Housing-related household leverage has been very low.
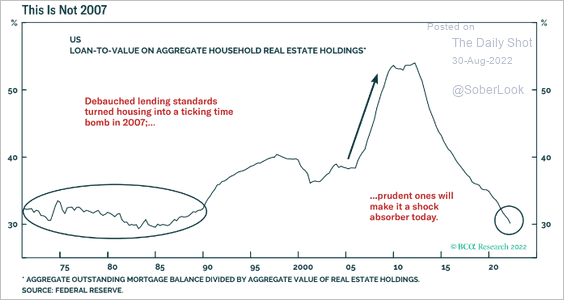 Source: BCA Research
• More sellers are switching their listings to rentals.
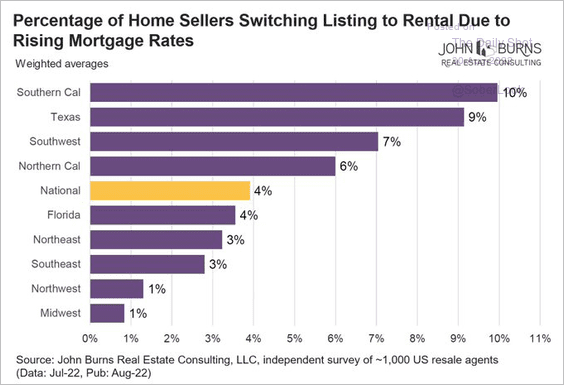 Source: @RickPalaciosJr
• Total housing inventories are still relatively low.
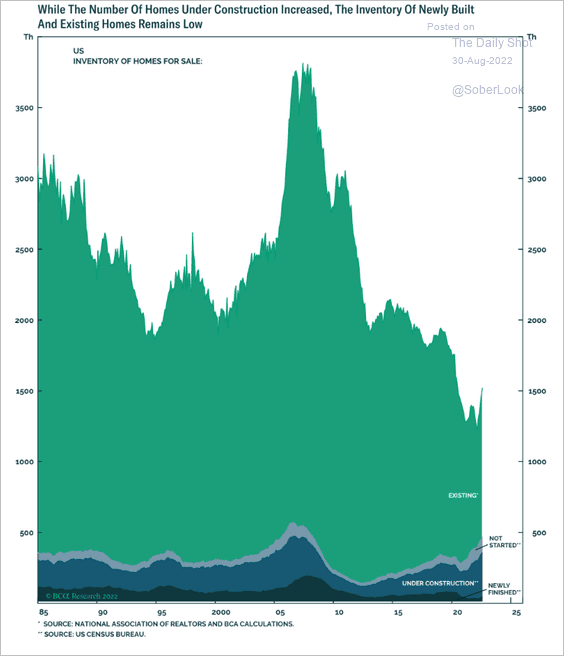 Source: BCA Research
——————–
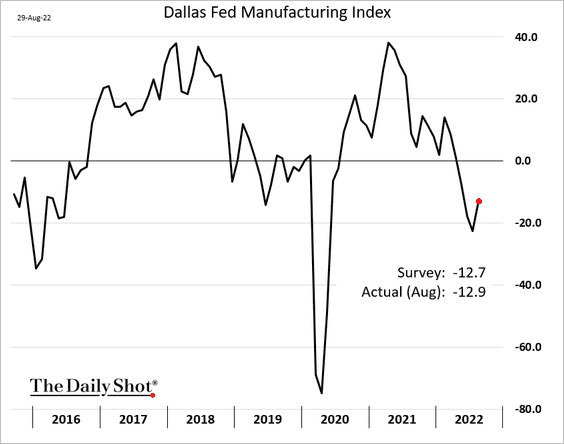
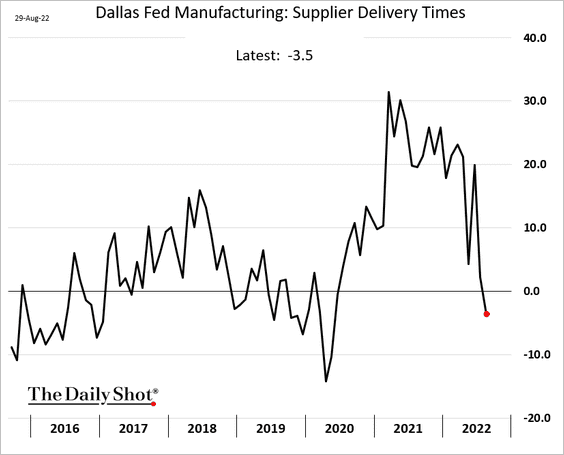
4. The Dallas Fed’s manufacturing index edged higher this month.
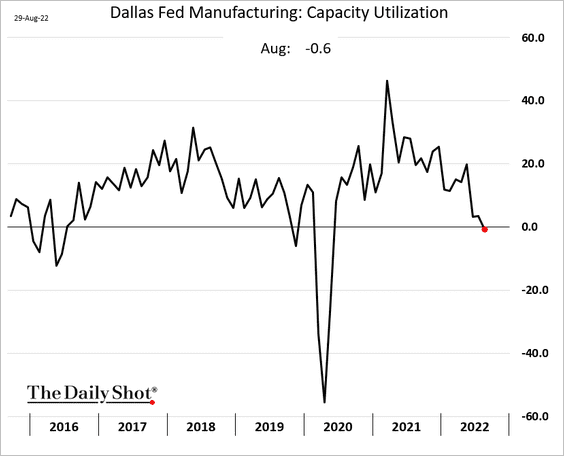
• Capacity utilization has rolled over.
• Expected production jumped.
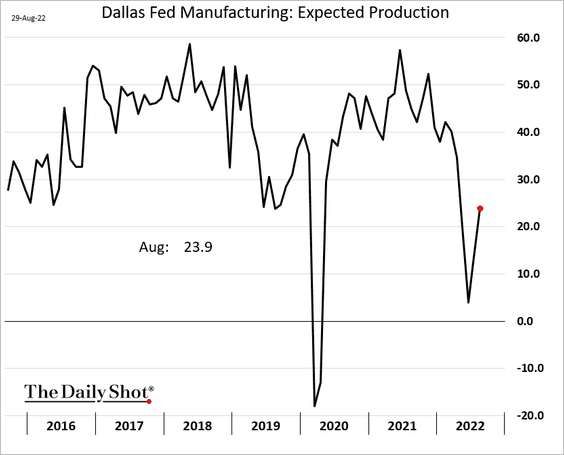
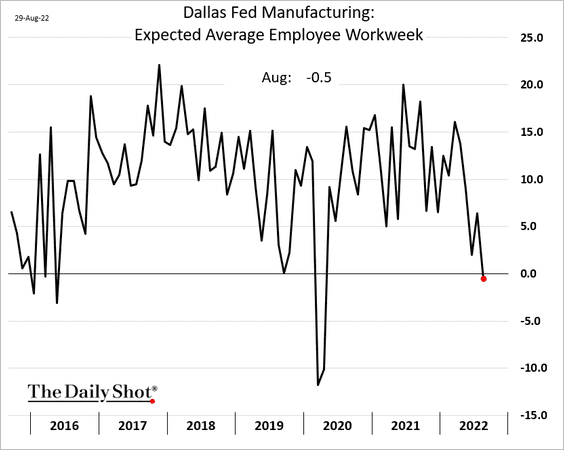
• But factories don’t expect to be very busy.
• Supply strains have eased.
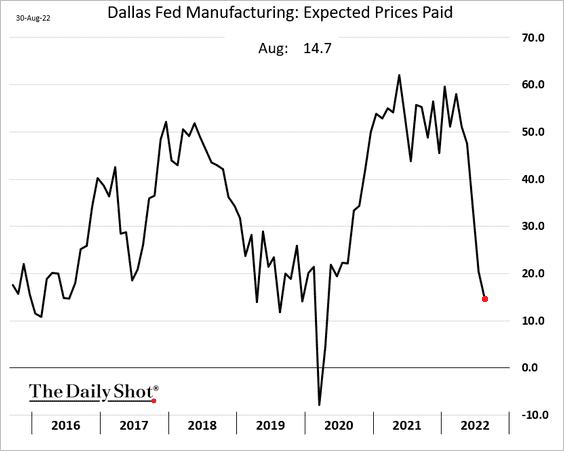
• Price pressures are moderating but remain elevated.
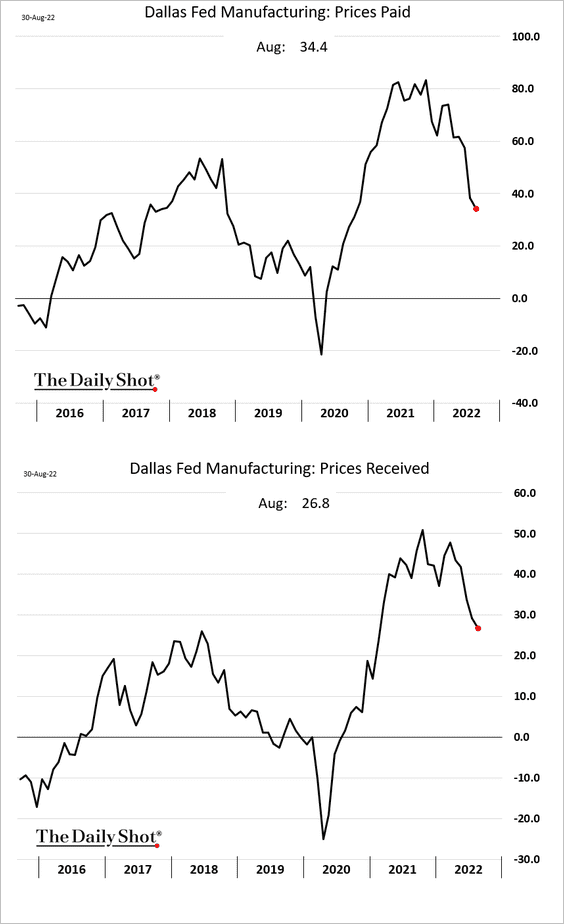
Manufacturers expect costs to ease further.
——————–
5. Overall, regional Fed manufacturing indices paint an ugly picture of factory activity at the national level.
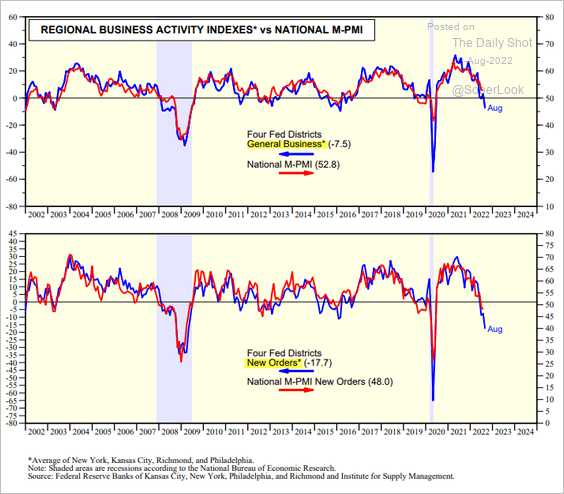 Source: Yardeni Research
6. Growth in wholesale inventories was slower than expected in July.
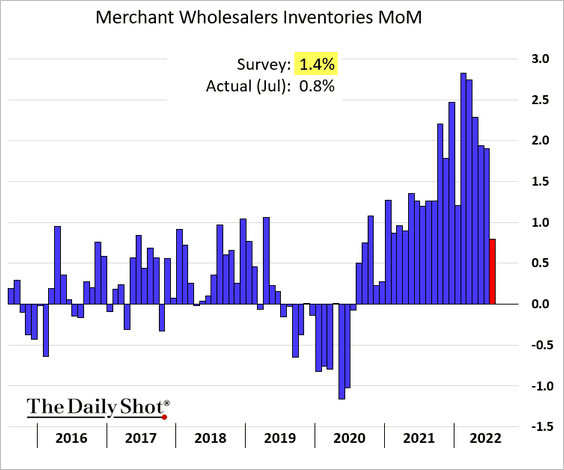
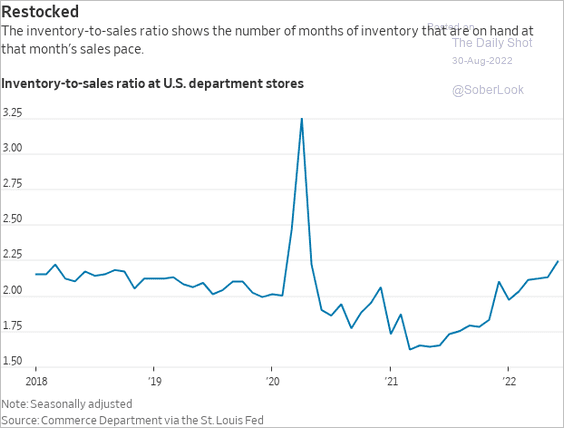
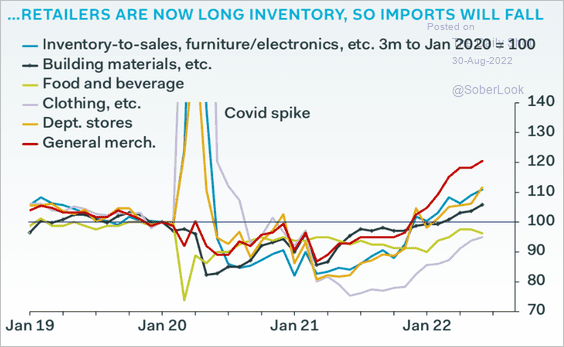
• Many retailers are facing an inventory overhang (2 charts).
 Source: @WSJ Read full article
 Source: Pantheon Macroeconomics
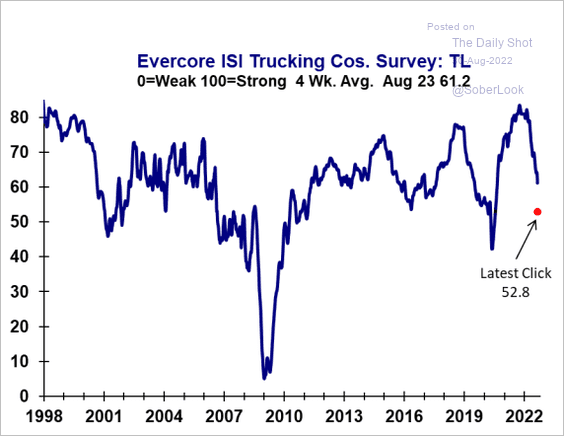
• The Evercore ISI trucking survey shows slower truckload demand.
 Source: Evercore ISI Research
——————–
7. The trade deficit shrunk more than expected in July, …
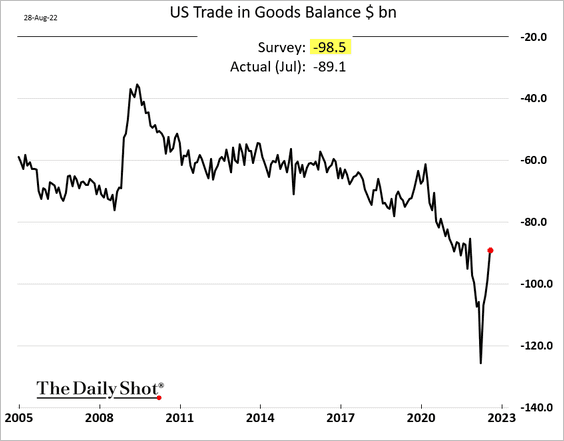
… as imports slowed.
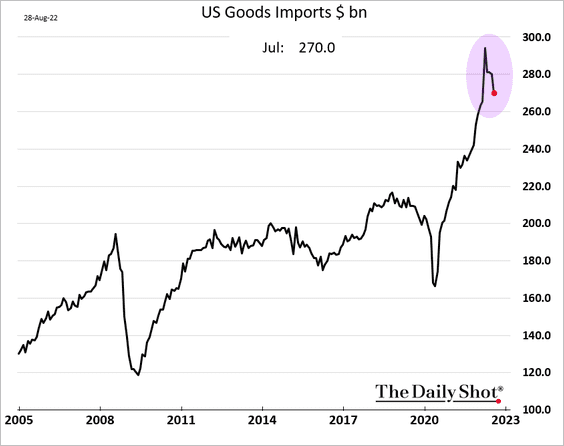
And given the falling demand (# 6 above), imports are likely to decline further.
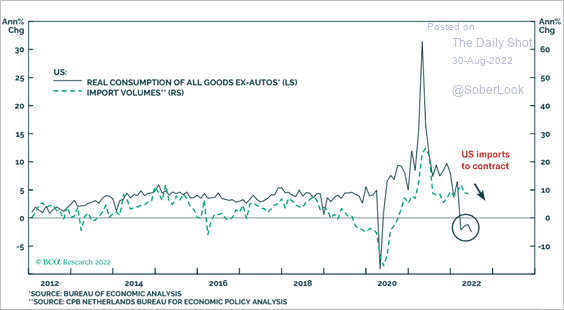 Source: BCA Research
Back to Index
Canada
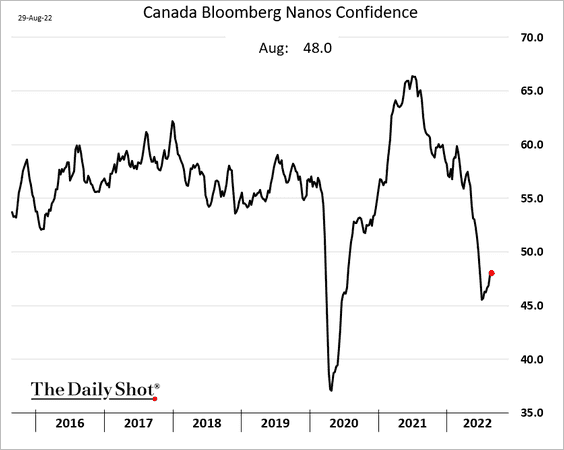
1. Consumer confidence appears to have stabilized for now.
2. Small firms expect to keep raising prices.
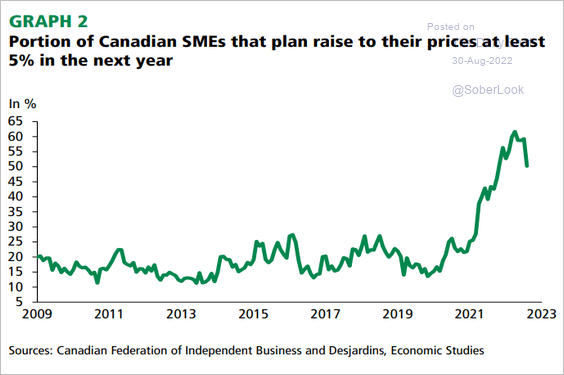 Source: Desjardins Read full article
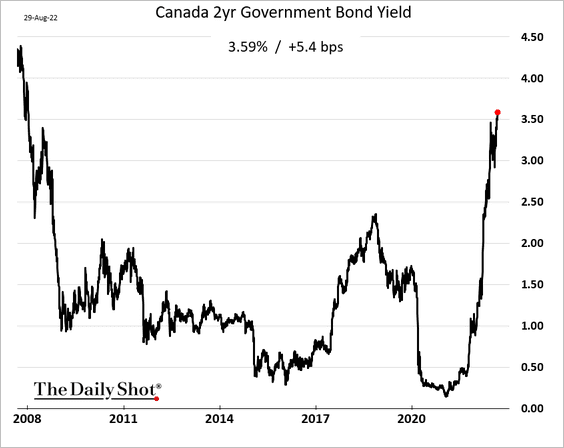
3. The 2yr bond yield hit the highest level since 2008 as the BoC rate hikes loom.
Back to Index
The United Kingdom
1. Household energy costs are hitting extreme levels.
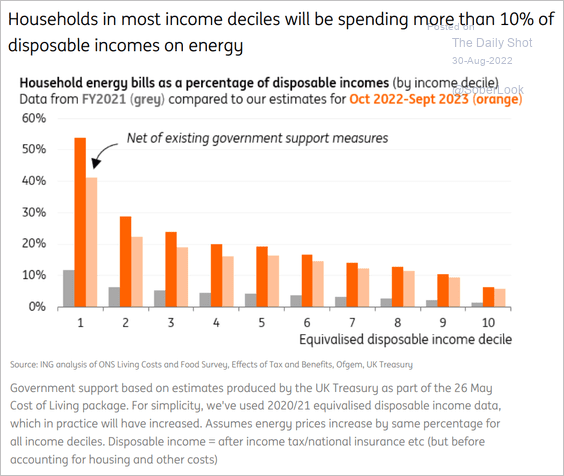 Source: ING
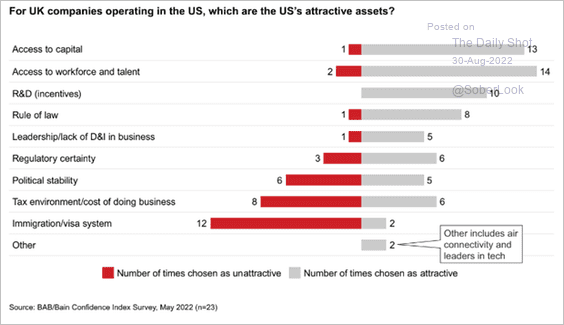
2. Immigration restrictions, political and regulatory uncertainty, and the tax environment are the biggest concerns for US investors in the UK.
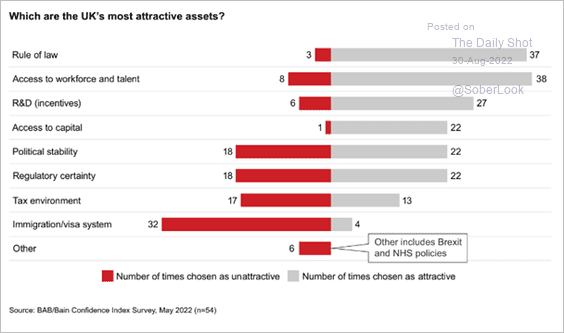 Source: Bain & Company
UK companies are attracted to talent and capital available in the US but find the immigration system challenging.
 Source: Bain & Company
The UK’s relationship with the EU and the absence of a global trade agenda in the US are critical issues for businesses operating in both countries.
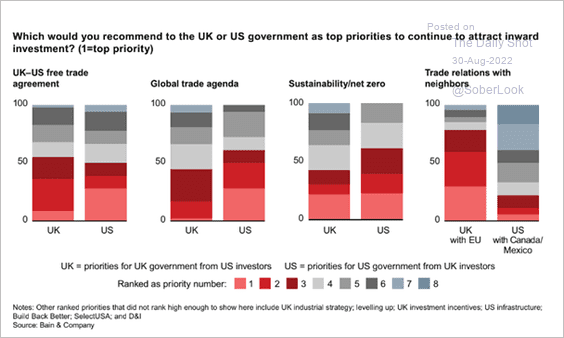 Source: Bain & Company
Back to Index
The Eurozone
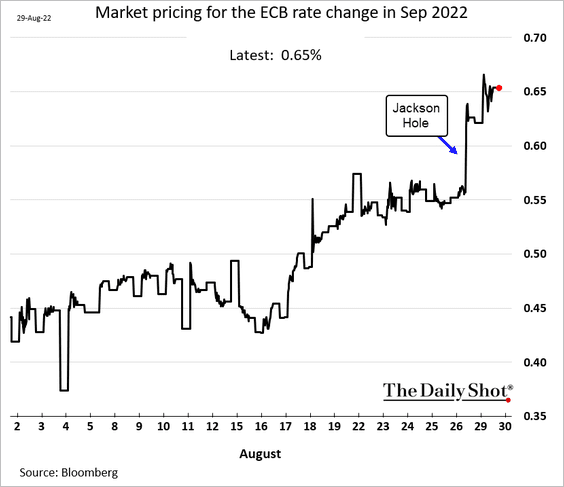
1. A 75 bps rate hike in September looks increasingly likely.
• Here is a comment from Danske Bank.
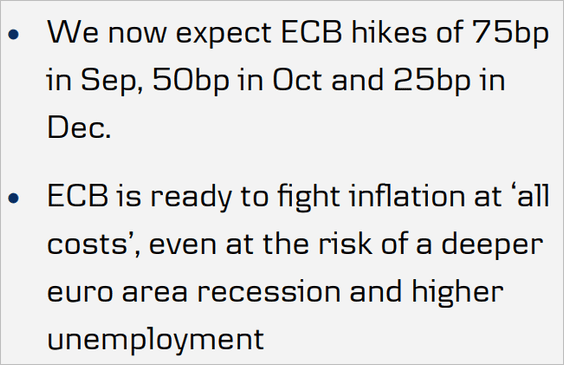 Source: Danske Bank
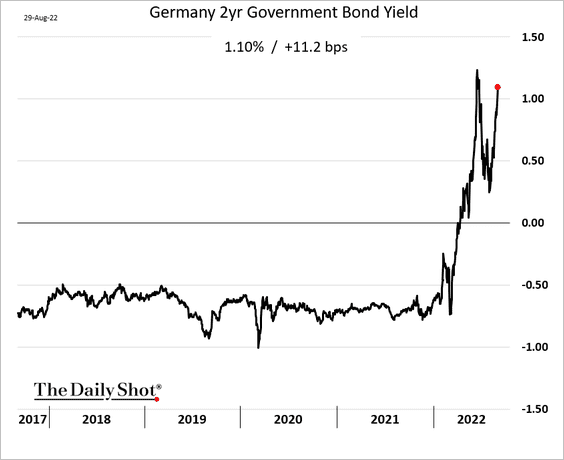
• The 2-year Bund yield is back above 1%.
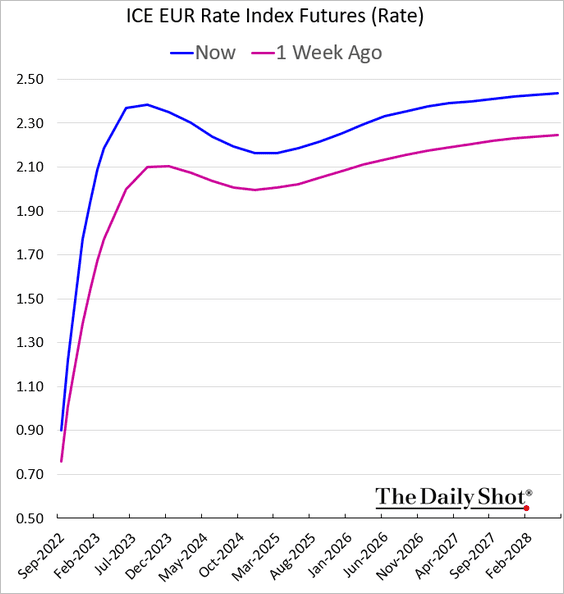
• And this chart shows the market pricing for the ECB rate trajectory.
——————–
2. Inflation is expected to climb further this month.
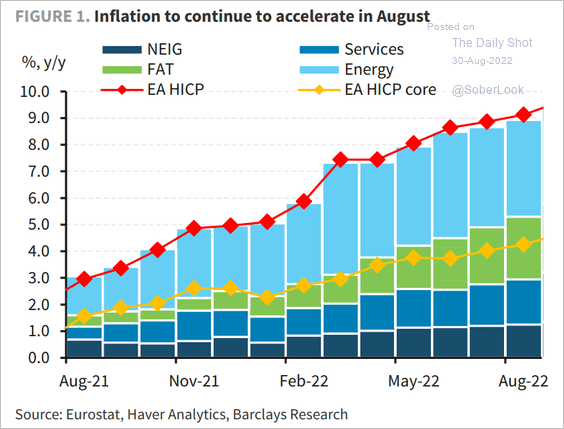 Source: Barclays Research
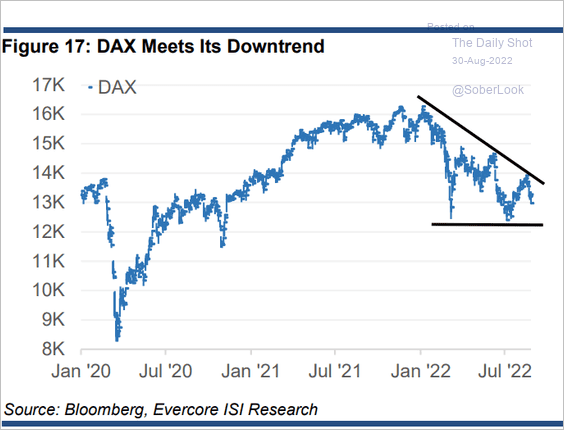
3. Germany’s DAX index is consolidating.
 Source: Evercore ISI Research
4. Pantheon Macroeconomics sees euro-area exports declining in the months ahead.
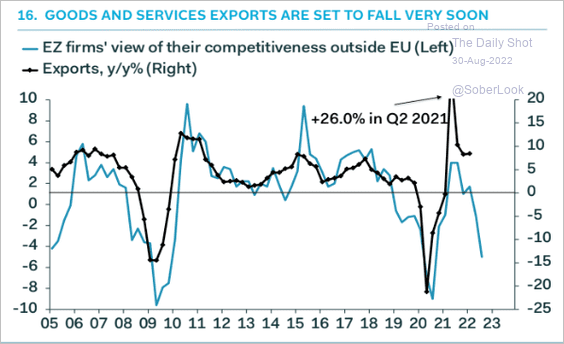 Source: Pantheon Macroeconomics
5. Inventories are climbing.
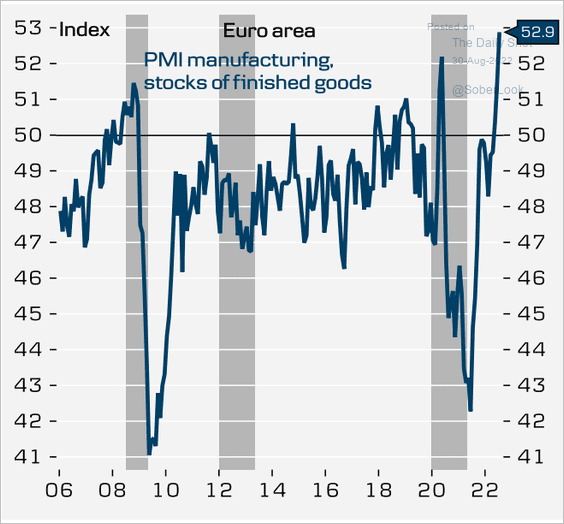 Source: Danske Bank
Back to Index
Europe
1. Sweden’s GDP was softer than expected but still quite strong.
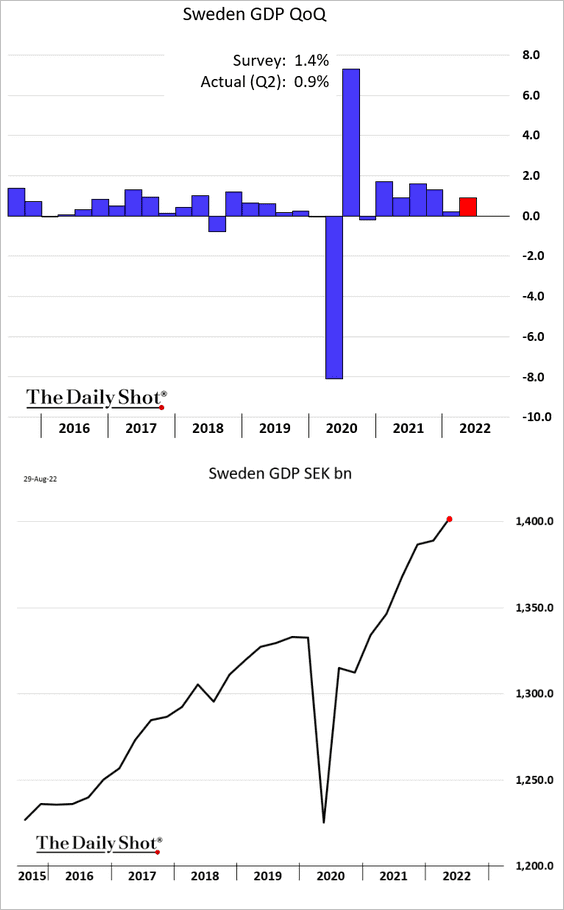
Retail sales are back on the pre-COVID trend.

——————–
2. EU natural gas inventories have normalized (chart shows % full).
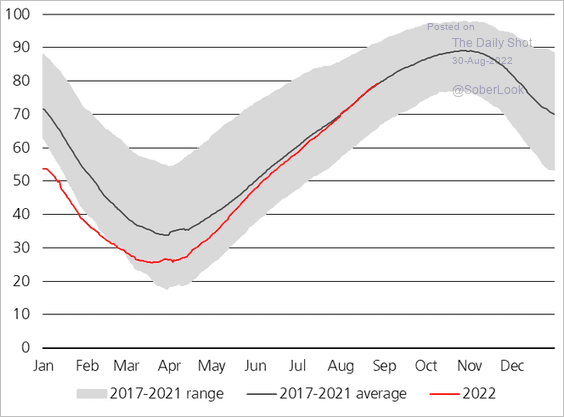 Source: @staunovo
Back to Index
Asia – Pacific
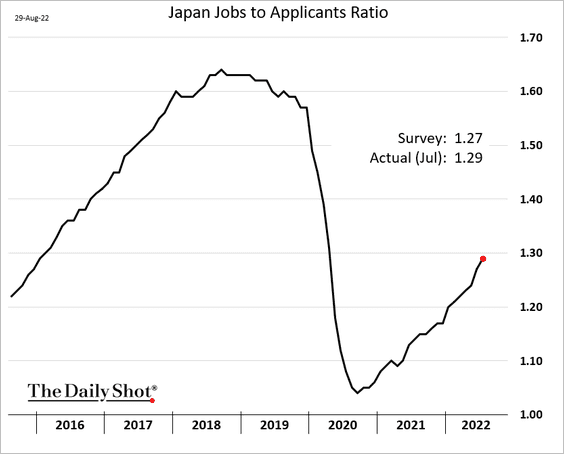
1. Japan’s jobs-to-applicants ratio continues to recover.
2. Australia’s resi building approvals deteriorated in July, but private-sector houses held relatively steady.
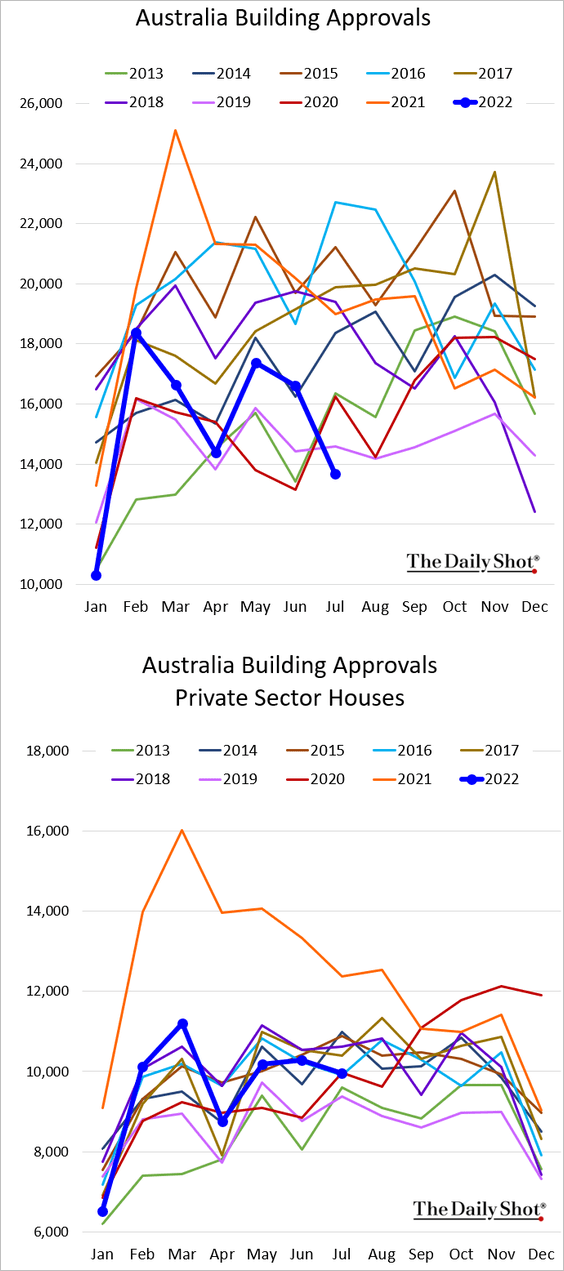
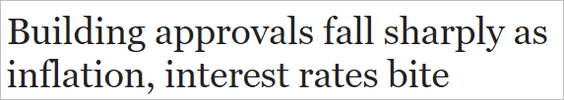 Source: Australian Property Investor Magazine Read full article
Back to Index
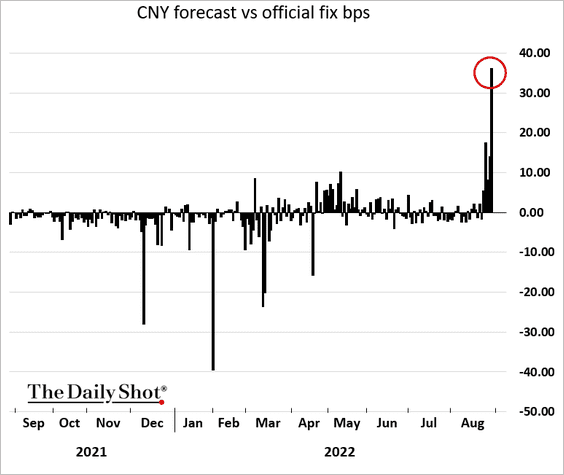
China
Beijing has had enough of renminbi depreciation, …
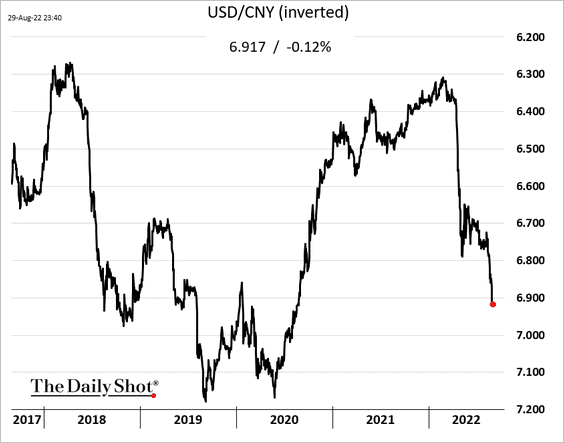
… and is now prodding the currency higher.
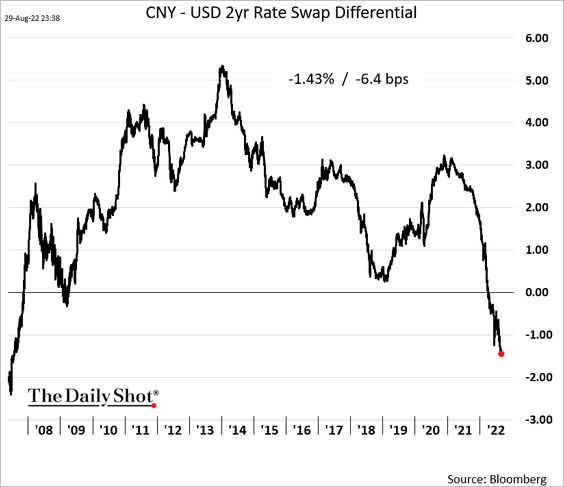
The rate differential with the US shows that the PBoC is working against the markets to keep USD/CNY stable.
Back to Index
Emerging Markets
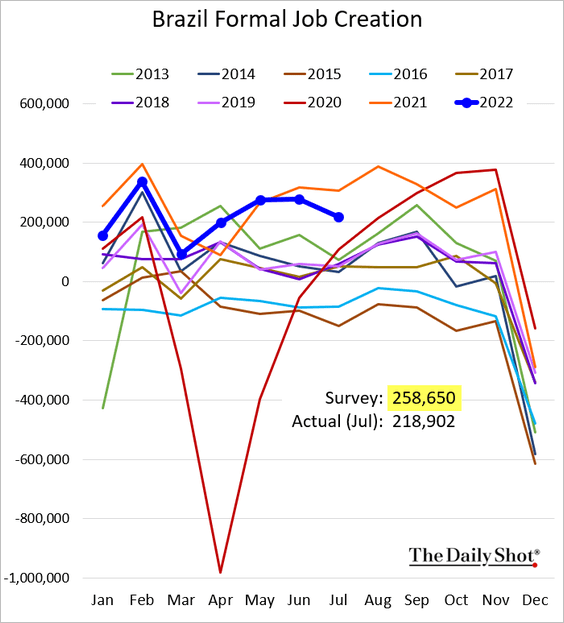
1. Let’s begin with Brazil.
• Job creation was well below forecasts in July.
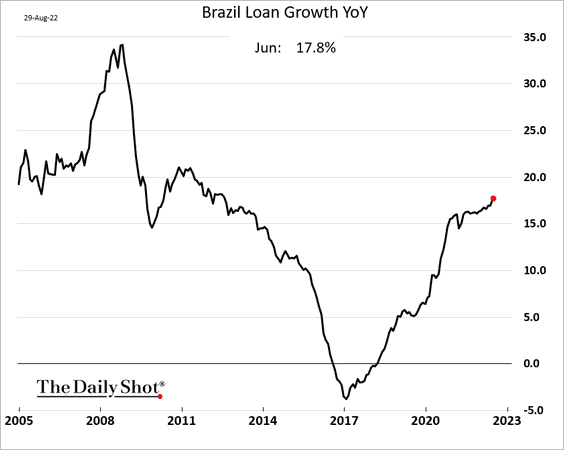
• Loan growth remains robust.
• Brazilian equities have seen volatility spikes ahead of elections in previous cycles.
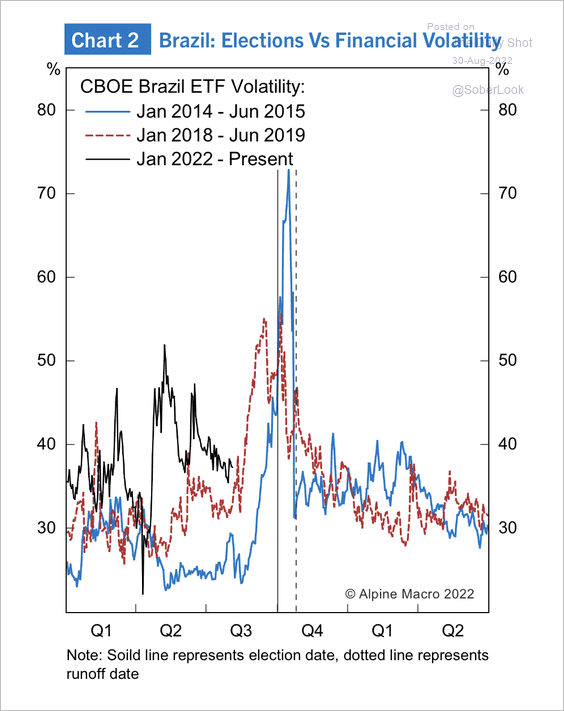 Source: Alpine Macro
• Brazil’s fiscal deficit has narrowed significantly, and the debt-to-GDP ratio is on track to ease back to pre-pandemic levels.
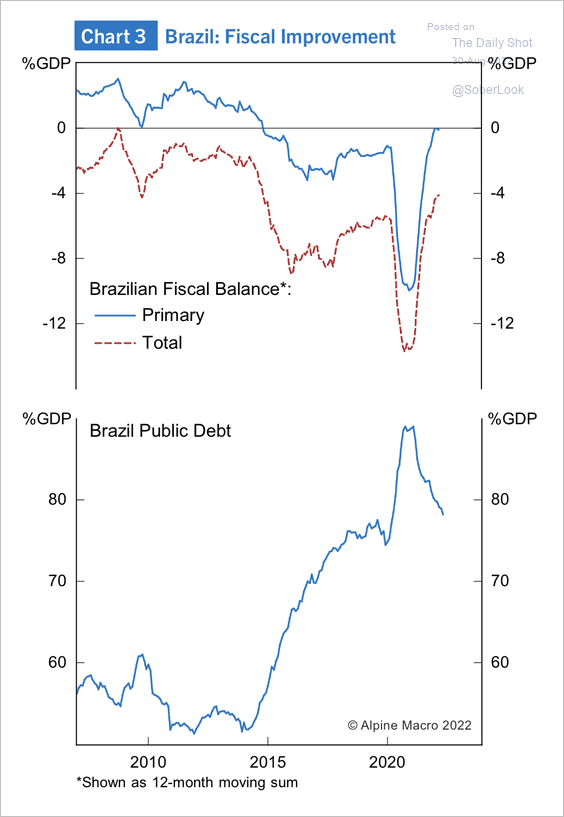 Source: Alpine Macro
• Venture deals have picked up significantly in Brazil.
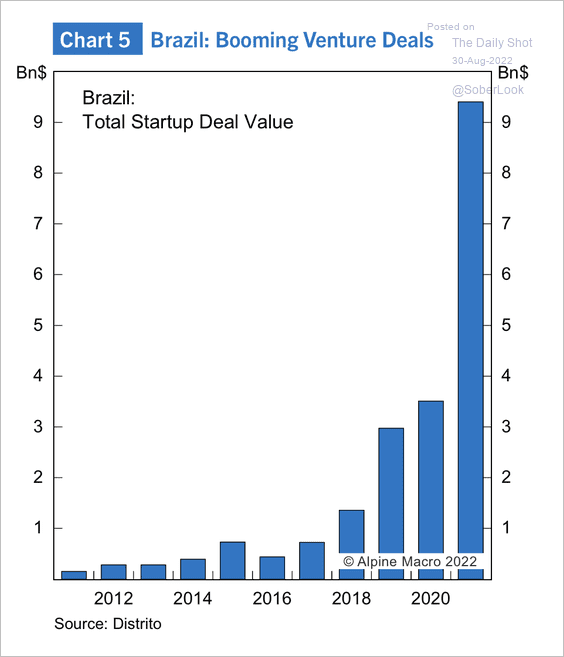 Source: Alpine Macro
——————–
2. Mexico’s widening trade deficit is driven by high energy costs.
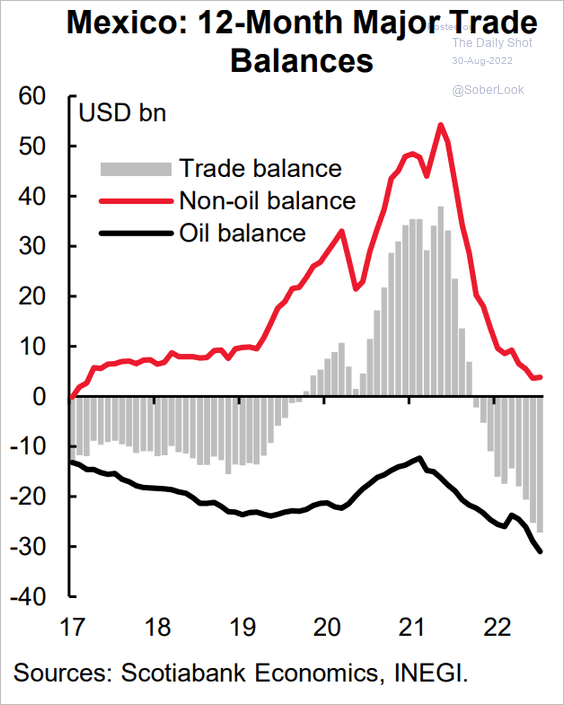 Source: Scotiabank Economics
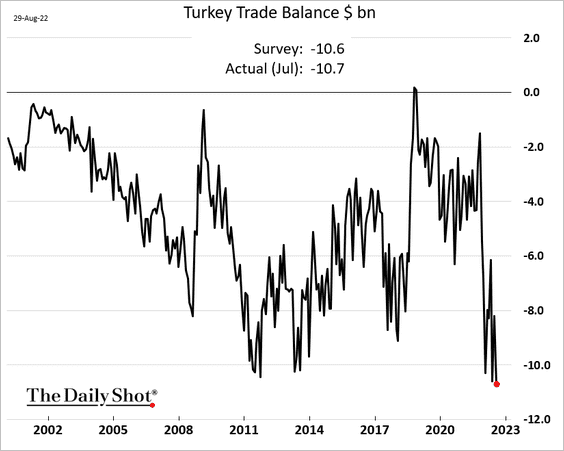
3. Turkey’s trade deficit hit another record.
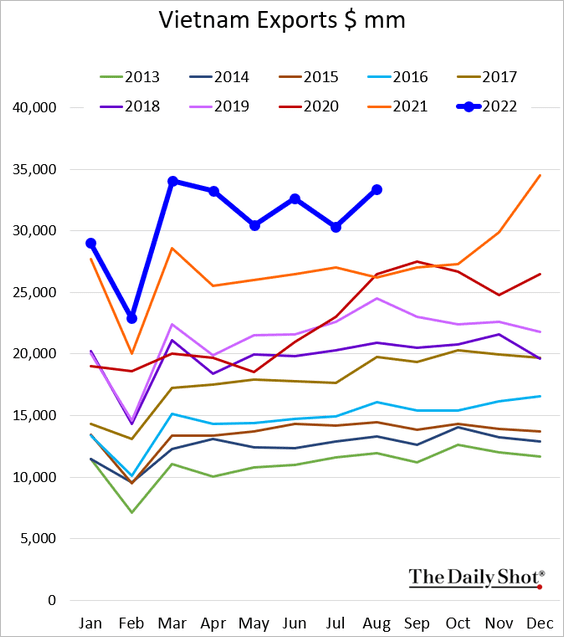
4. Vietnam’s CPI remains subdued.
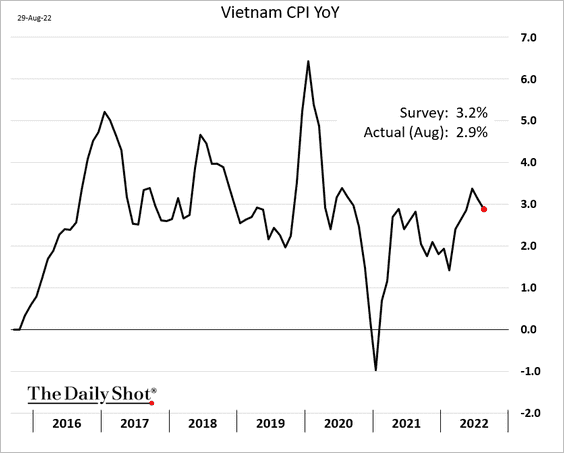
Exports are still robust.
——————–
5. EM interest rates are currently in the midst of their largest and longest drawdown in 20 years.
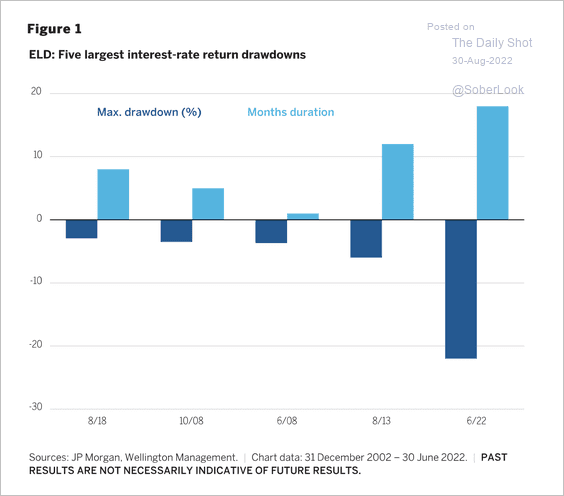 Source: Wellington Management Read full article
EM local debt performance typically improves shortly after the first Fed rate hike. Such periods also tend to favor EM currencies, according to Wellington.
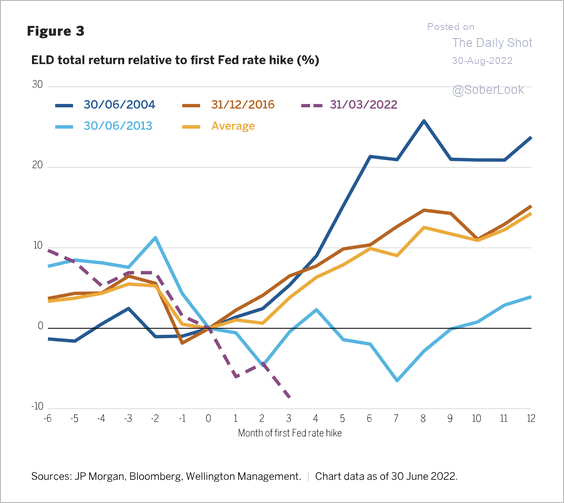 Source: Wellington Management Read full article
Back to Index
Cryptocurrency
1. Crypto funds saw minor outflows last week, driven by bitcoin-focused products (2 charts).
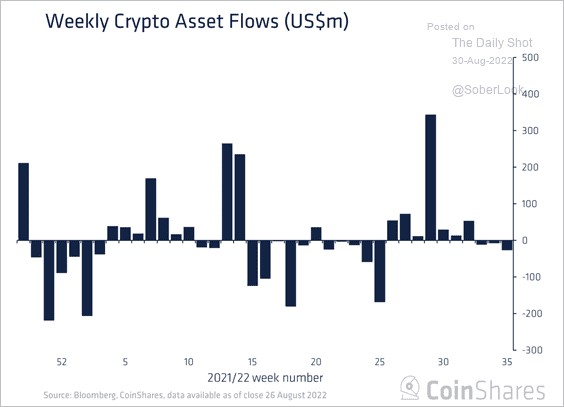 Source: CoinShares Read full article
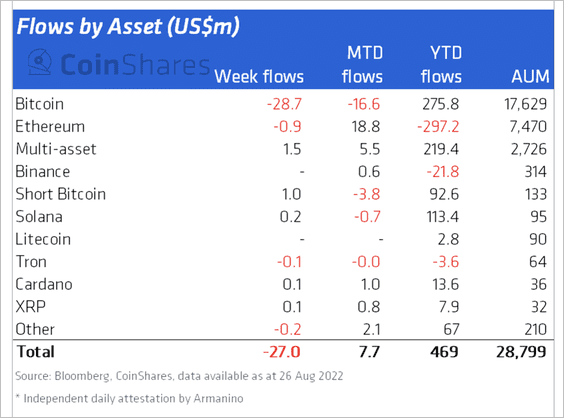 Source: CoinShares Read full article
——————–
2. The Crypto Fear & Greed Index remains in “fear” territory.
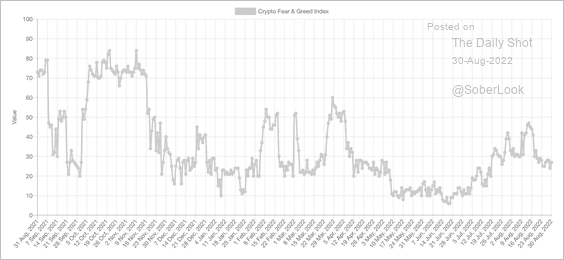 Source: Alternative.me
3. Open interest in ether’s (ETH) option market ticked higher over the past few days, albeit still below its August 14 peak.
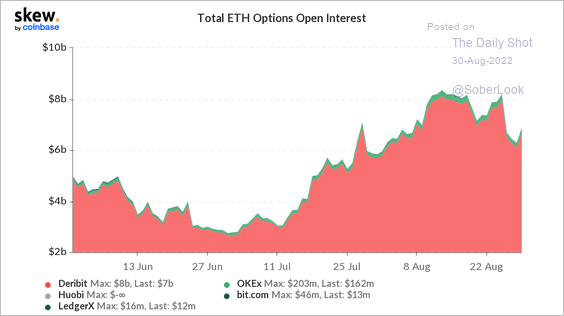 Source: Skew
ETH’s put/call ratio is trending lower.
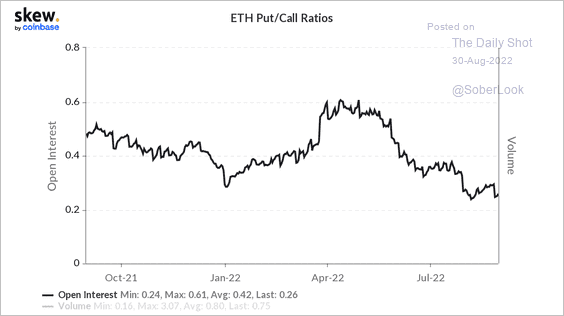 Source: Skew
——————–
4. The rolling 30-month correlation between US M2 money supply and bitcoin’s value has moved from negative to slightly positive over the past few years.
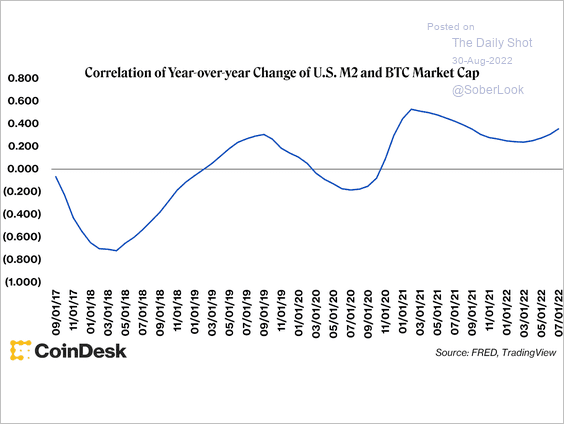 Source: CoinDesk Read full article
Back to Index
Commodities
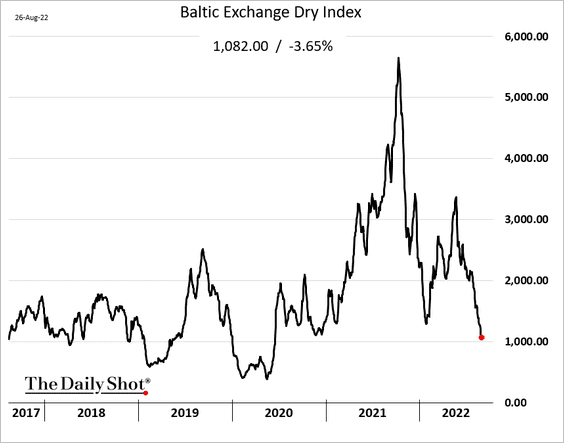
1. Iron ore futures keep moving lower, …
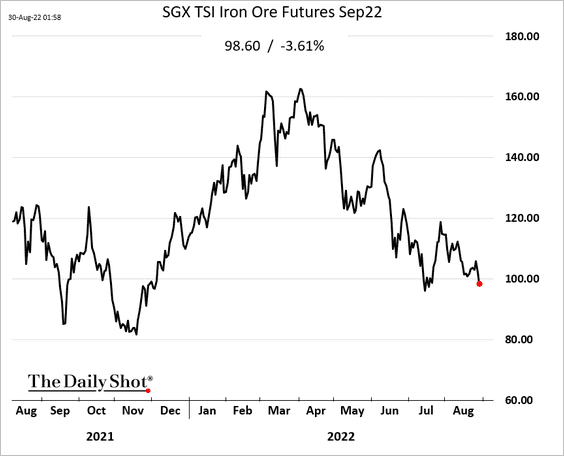
… dragging down dry bulk shipping costs.
——————–
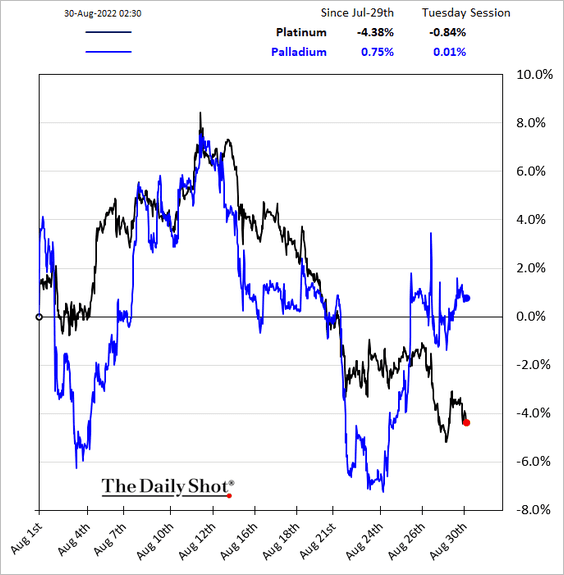
2. Platinum and palladium prices have diverged in recent days.
3. China’s power grid investment should support demand for industrial metals.
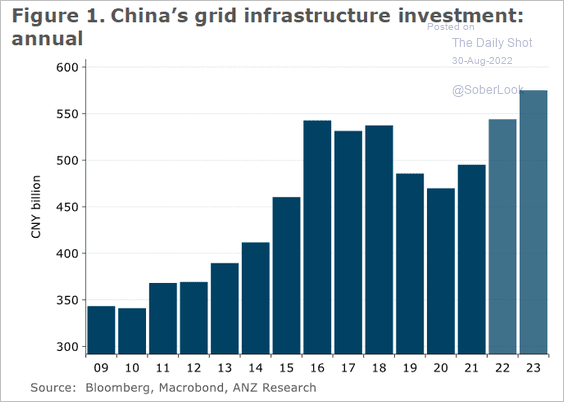 Source: @ANZ_Research
Back to Index
Energy
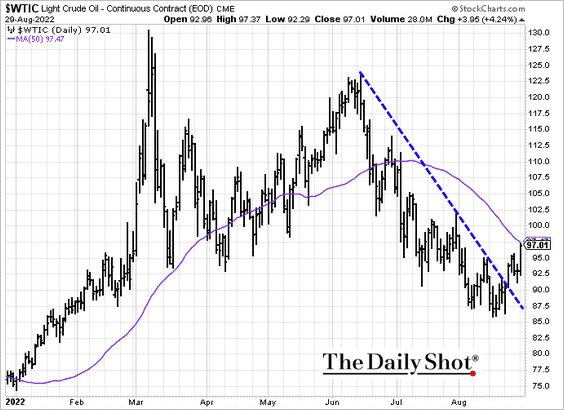
1. The rebound in WTI crude will test resistance at the 50-day moving average.
 Source: Reuters Read full article
——————–
2. This chart shows the components of US shale production.
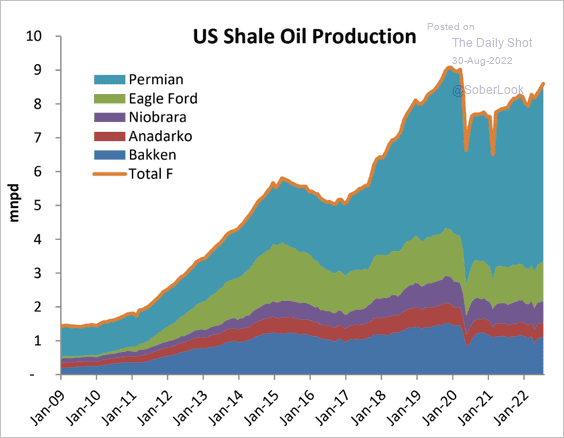 Source: Princeton Energy Advisors
Back to Index
Equities
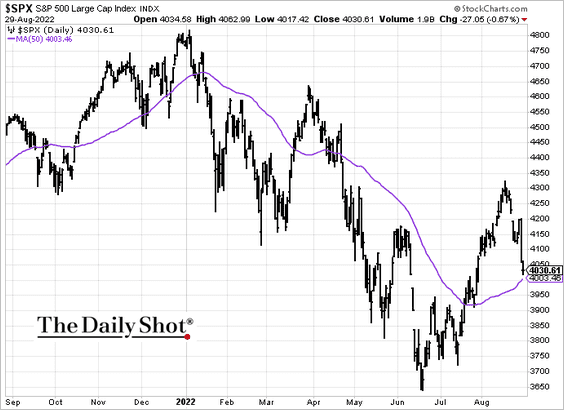
1. The S&P 500 will test support at the 50-day moving average.
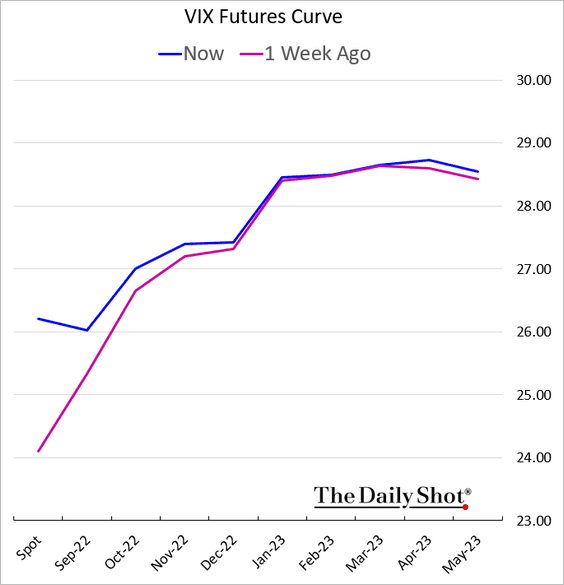
2. VIX jumped sharply after Jackson Hole, but the curve doesn’t show too much concern.
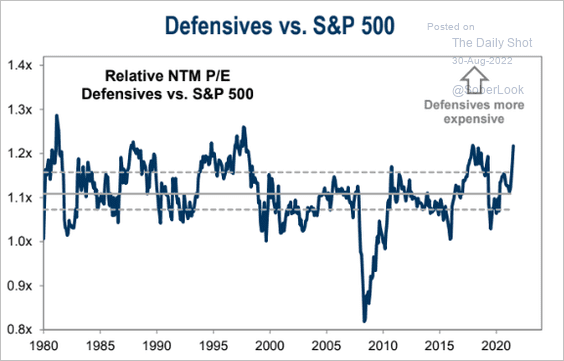
3. Defensives are expensive relative to the S&P 500.
 Source: Goldman Sachs; @MikeZaccardi
4. Earnings growth is expected to slow but remain positive on a year-over-year basis.
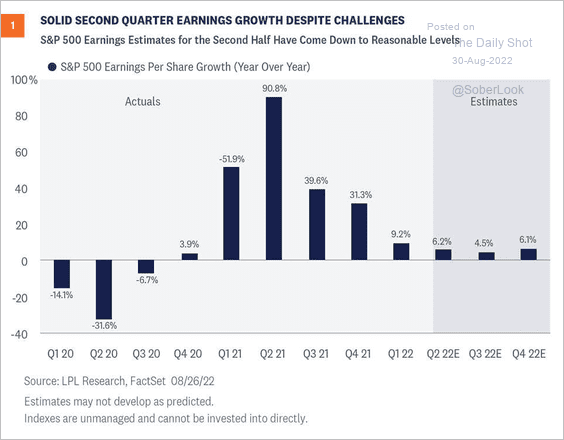 Source: LPL Research
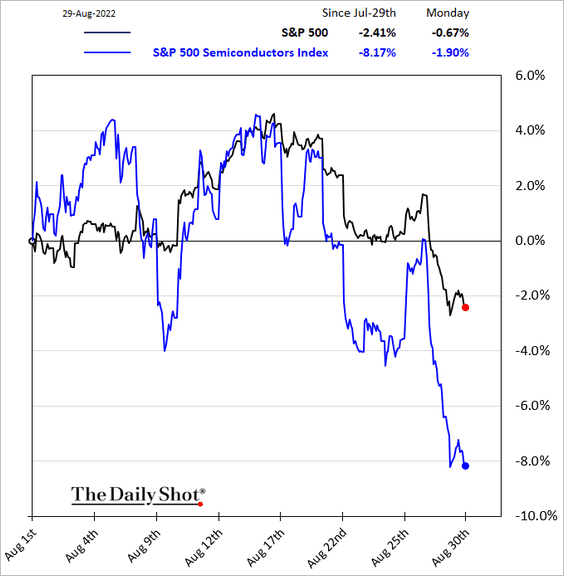
5. Semiconductor stocks are under pressure.
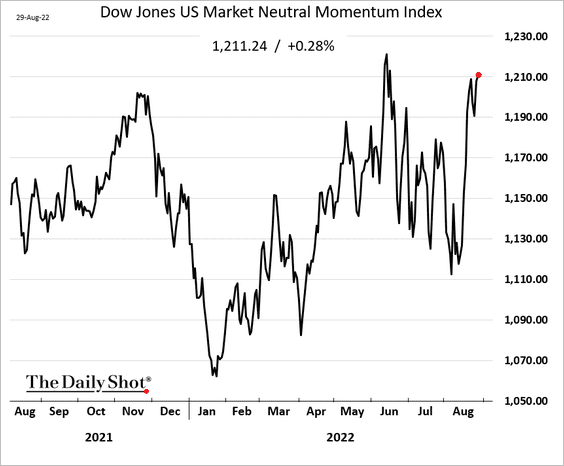
6. It’s been a good couple of weeks for the momentum factor.
7. Companies focused on domestic sales have outperformed this year as the US dollar rallied.
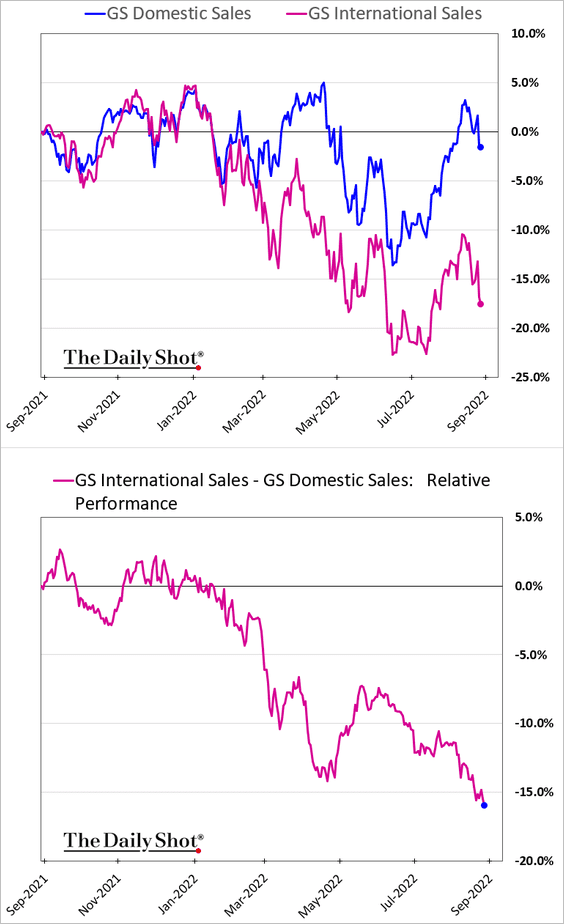
• US equity markets represent over 40% of the global equity market cap.
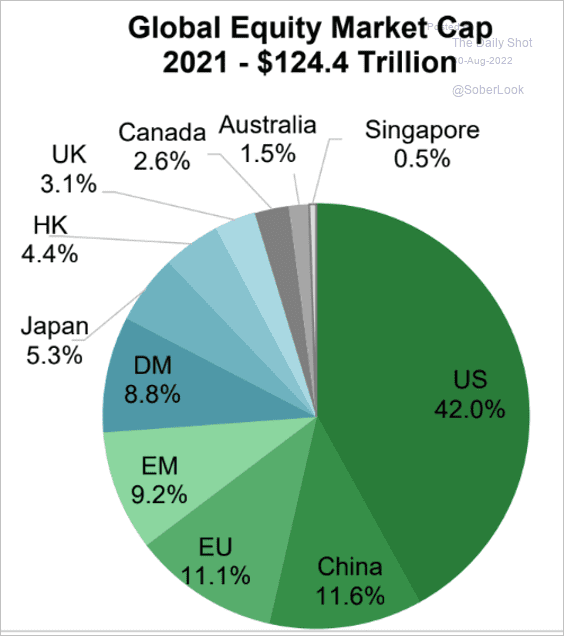 Source: SIFMA
Back to Index
Credit
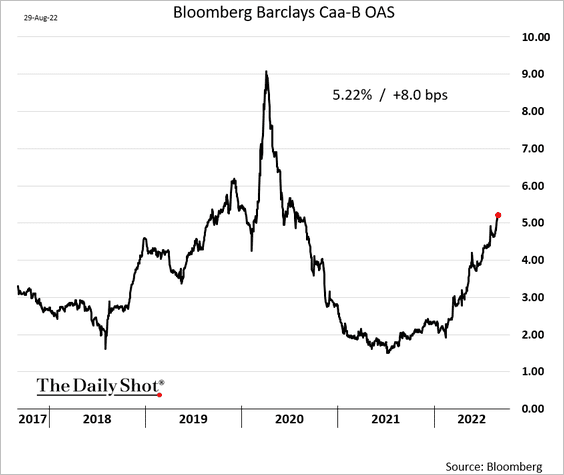
1. The CCC vs. B-rated corporate bond spread has been widening this year as risk aversion increases in credit markets.
 h/t @jackpitcher20
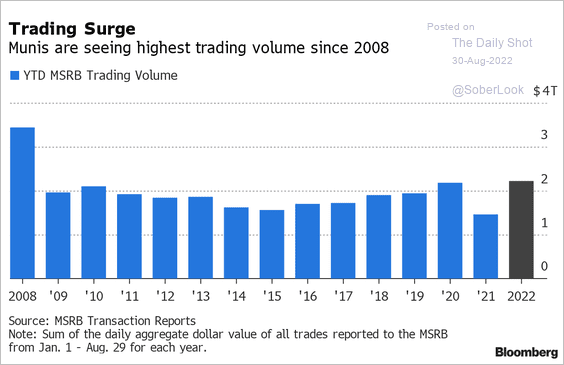
2. Muni trading volumes hit a multi-year high this year.
 Source: @danielle_moran Read full article
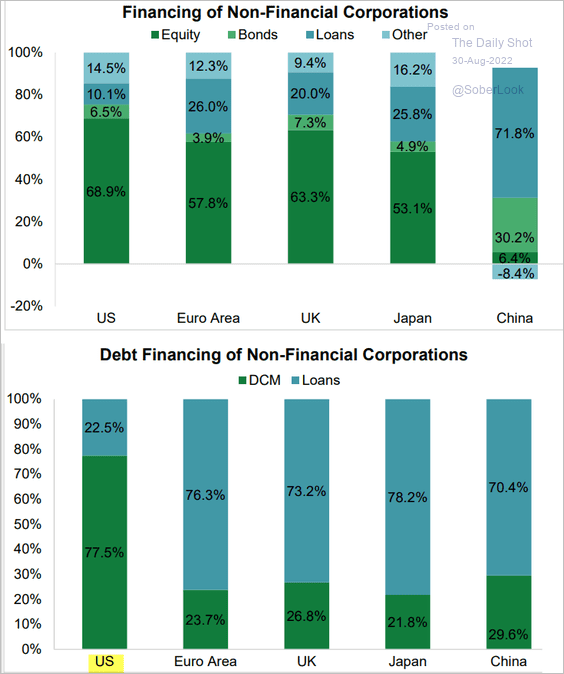
3. Capital markets fuel the US economy, providing 75.4% of equity and debt financing for non-financial corporations. Debt capital markets are more dominant in the US at 77.5% of total financing, whereas bank lending is more dominant in other regions.
 Source: SIFMA
Back to Index
Rates
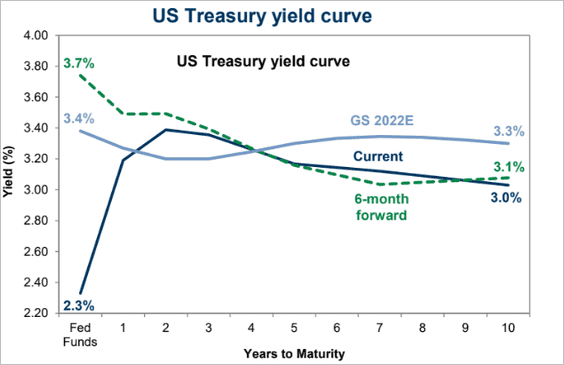
1. The Treasury curve continues to flatten/invert.
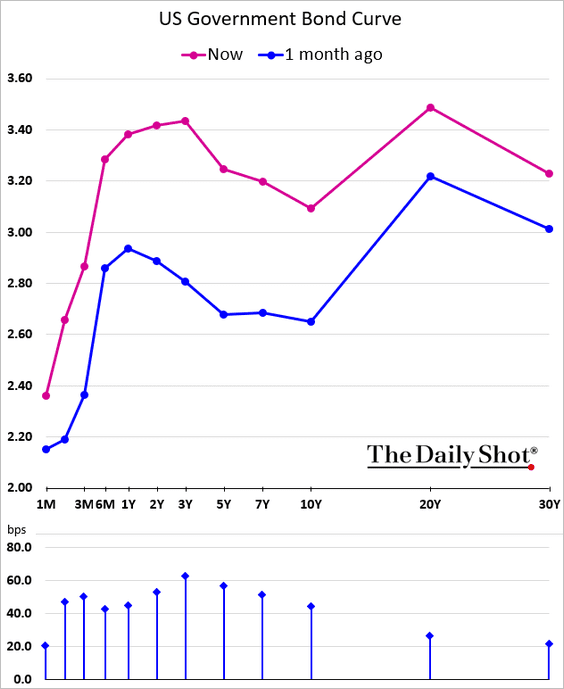
… with markets pricing in a fully inverted curve in six months.
 Source: Goldman Sachs; @MikeZaccardi
——————–
2. The 10-year Treasury yield has diverged from the S&P 500 cyclicals/defensives ratio.
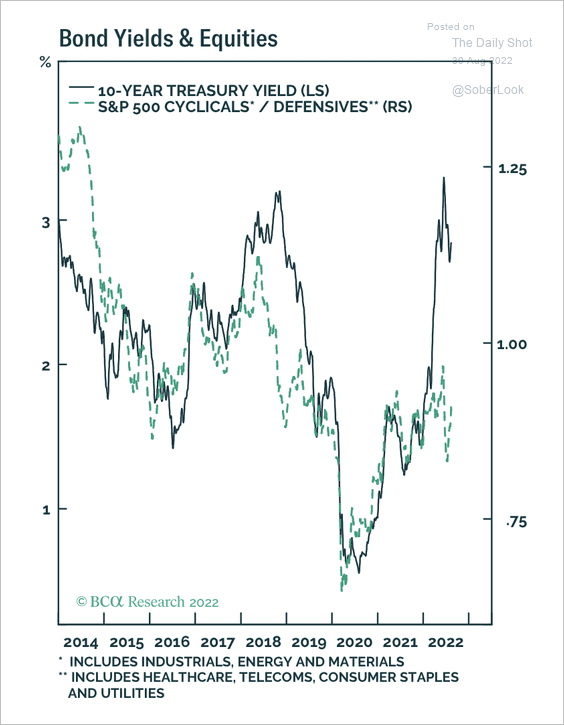 Source: BCA Research
Back to Index
Global Developments
1. Global bonds are nearing bear market territory again after Jackson Hole.
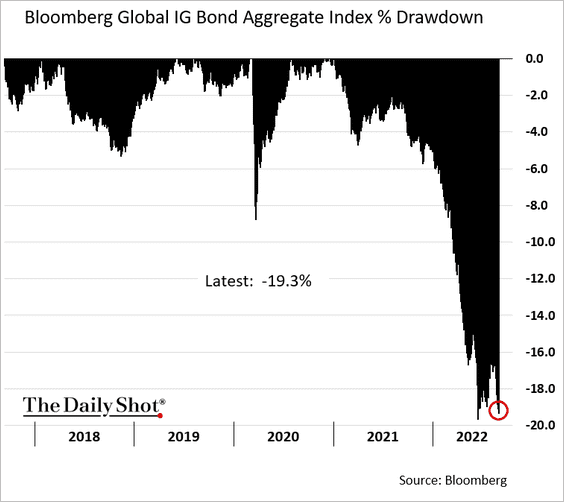 h/t @GarfieldR1966
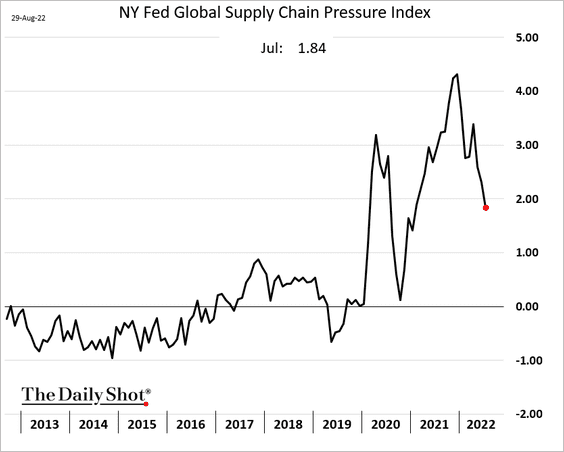
2. The NY Fed’s global supply chain stress indicator has been moving lower but remains elevated.
3. Globalization saw periods of acceleration and reversals throughout recent history.
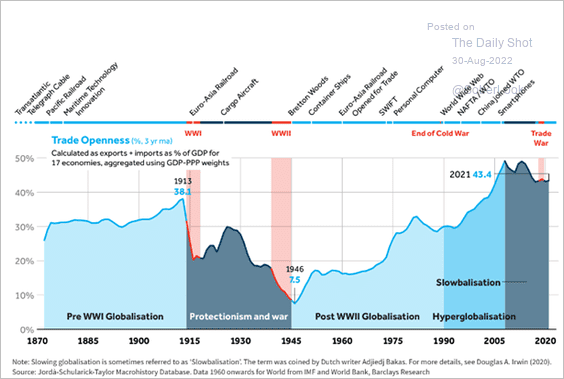 Source: Barclays Research
4. World trade volumes ticked higher in May and are on track to return to their pre-pandemic trend.
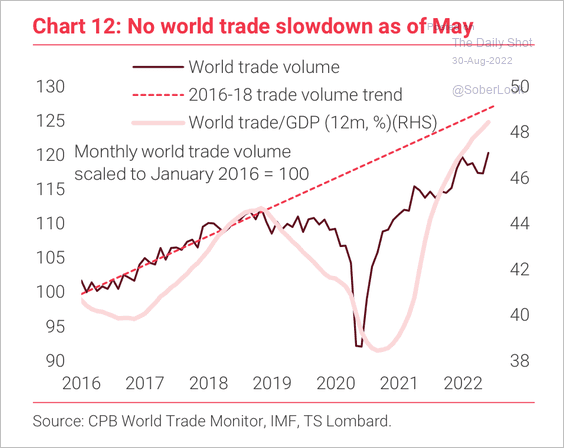 Source: TS Lombard
5. This chart shows labor productivity in select economies.
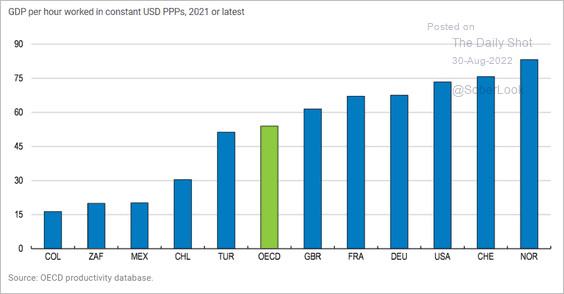 Source: OECD Read full article
——————–
Food for Thought
1. Bull and bear markets since 1933:
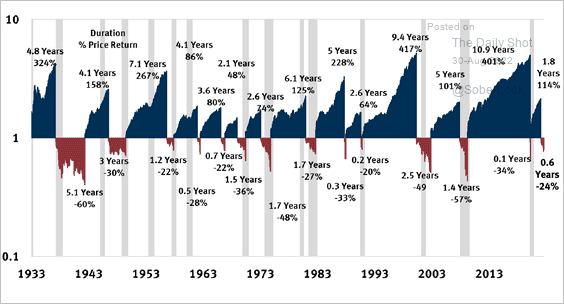 Source: @Mayhem4Markets
2. US household spending on tools and equipment:
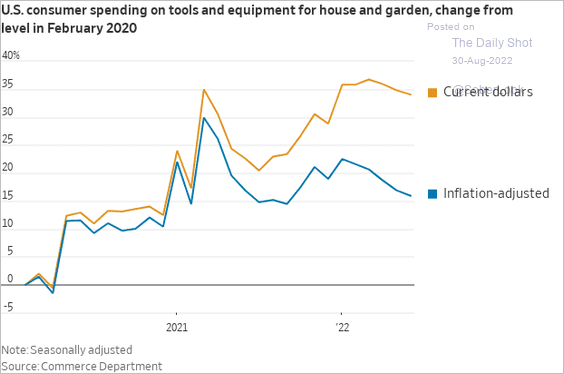 Source: @WSJ Read full article
3. Tailgate food price changes:
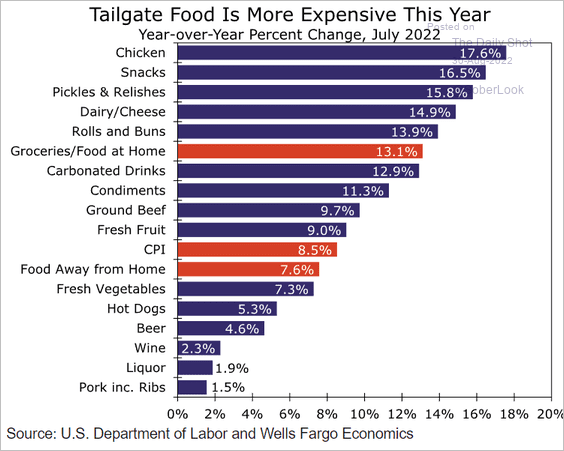 Source: Wells Fargo Securities
4. Global goods exports:
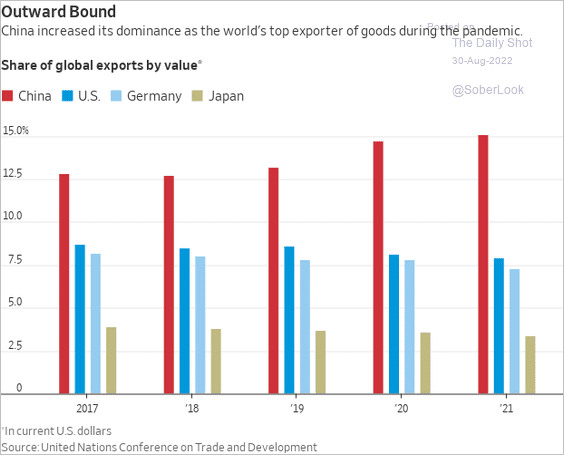 Source: @WSJ Read full article
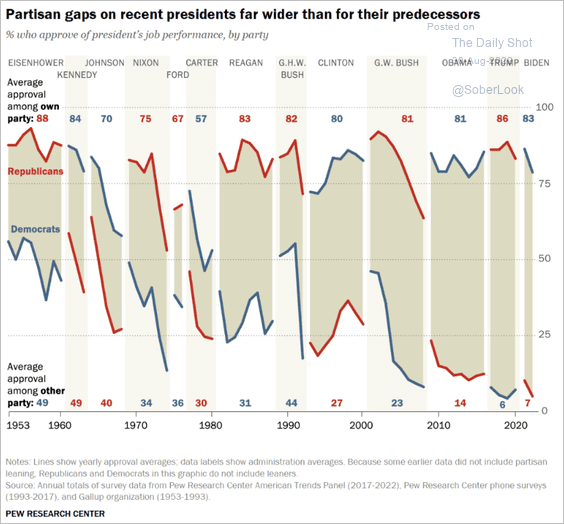
5. A growing partisan divide in the US (2 charts):
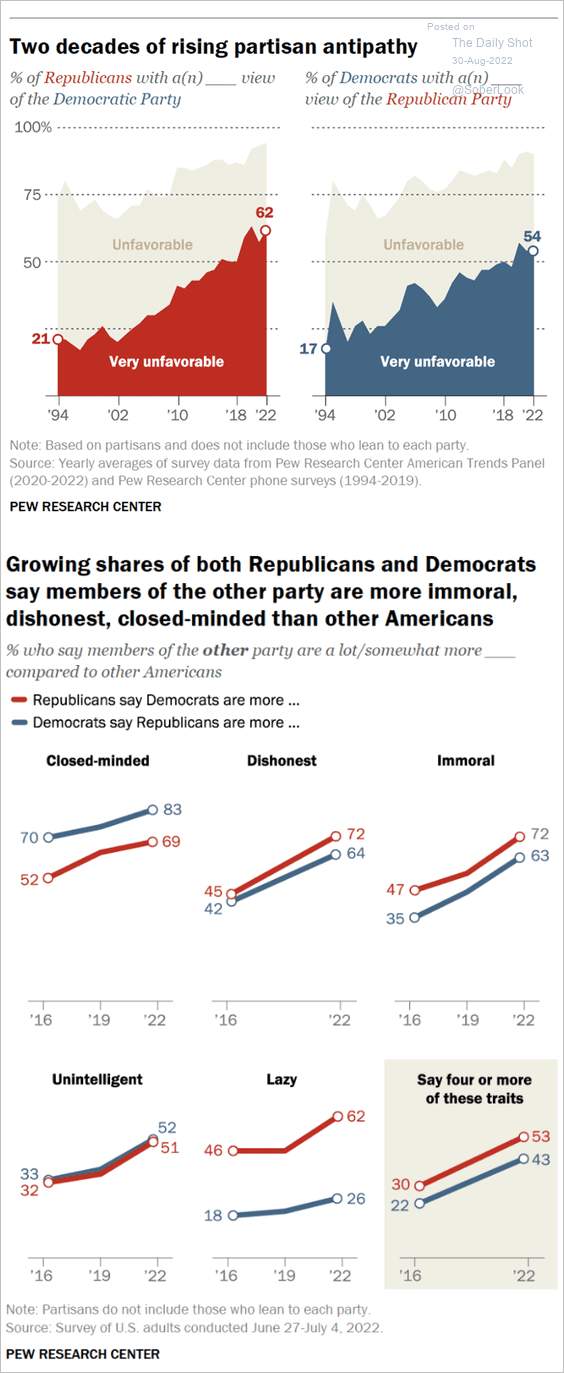 Source: Pew Research Center Read full article
 Source: Pew Research Center Read full article
——————–
6. Benefits workers want from employers:
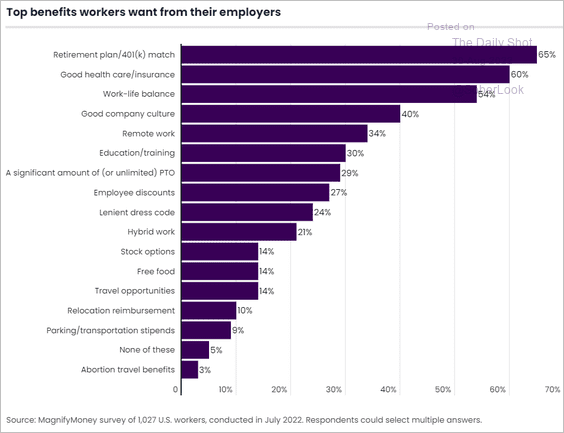 Source: MagnifyMoney Read full article
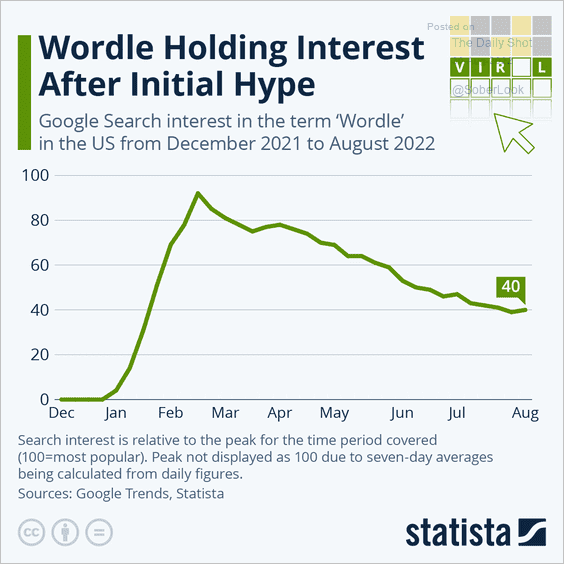
7. Search interest for Wordle:
——————–
Back to Index