
The Daily Shot: 01-Sep-22
• The United States
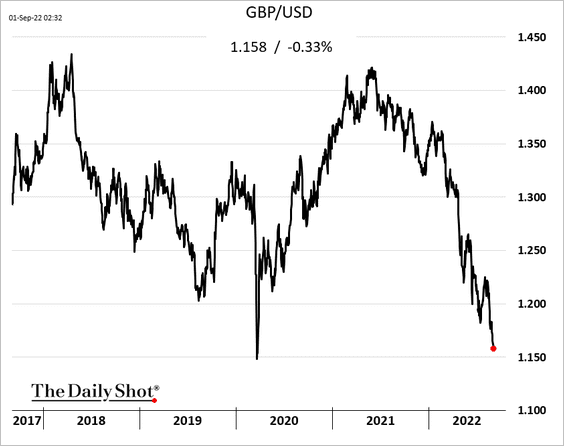
• The United Kingdom
• The Eurozone
• Europe
• Japan
• Asia – Pacific
• China
• Emerging Markets
• Commodities
• Energy
• Equities
• Credit
• Rates
• Global Developments
• Food for Thought
As a reminder, the next Daily Shot will be published on Tuesday, September 6th.
The United States
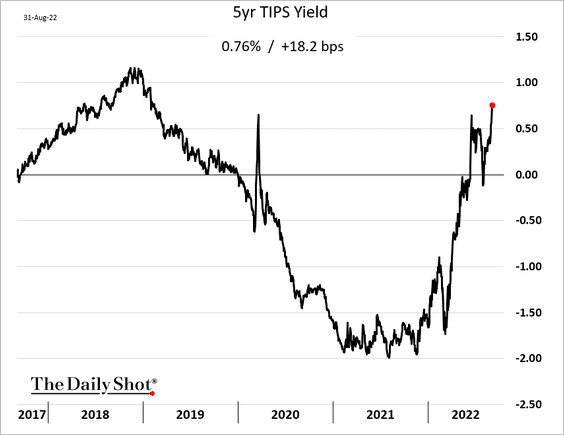
1. US real yields continue to climb, pressuring stocks.
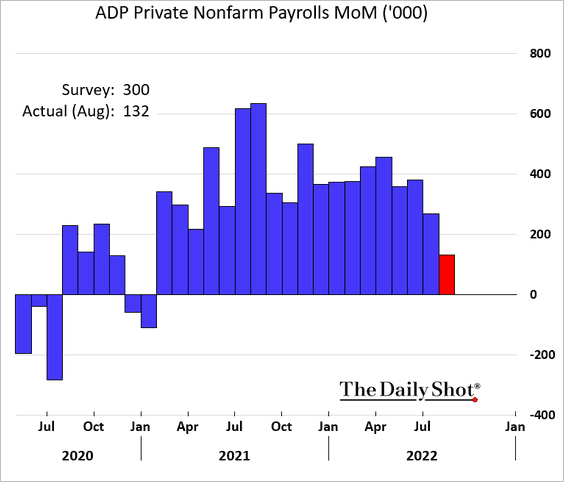
2. The ADP report is back after a methodology revamp. It’s not clear if the correlation with the official payrolls report will be any better.
• ADP’s wage growth indicators are well above the official measures.
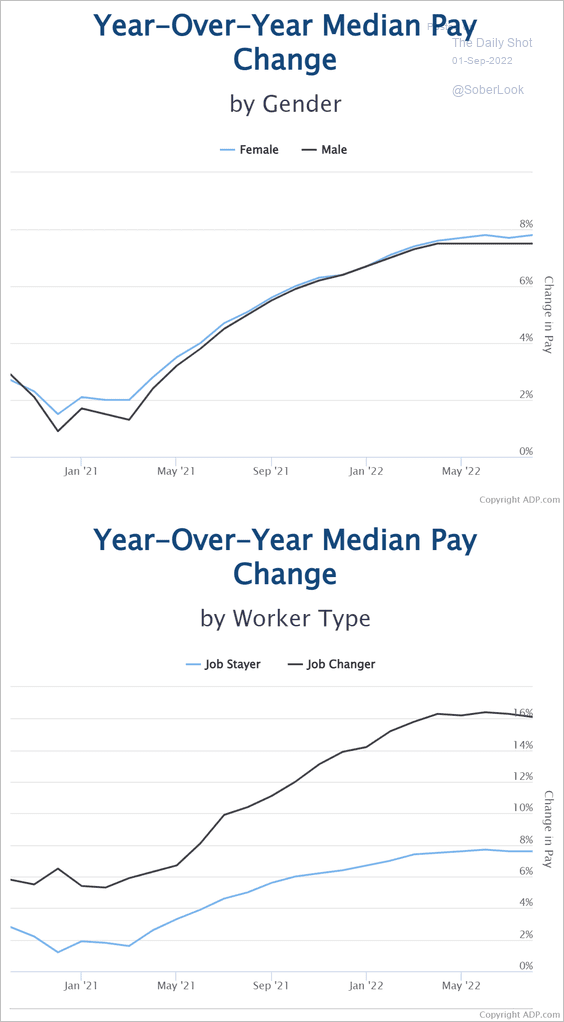 Source: ADP Research Institute
Here is wage growth by state and by company size.
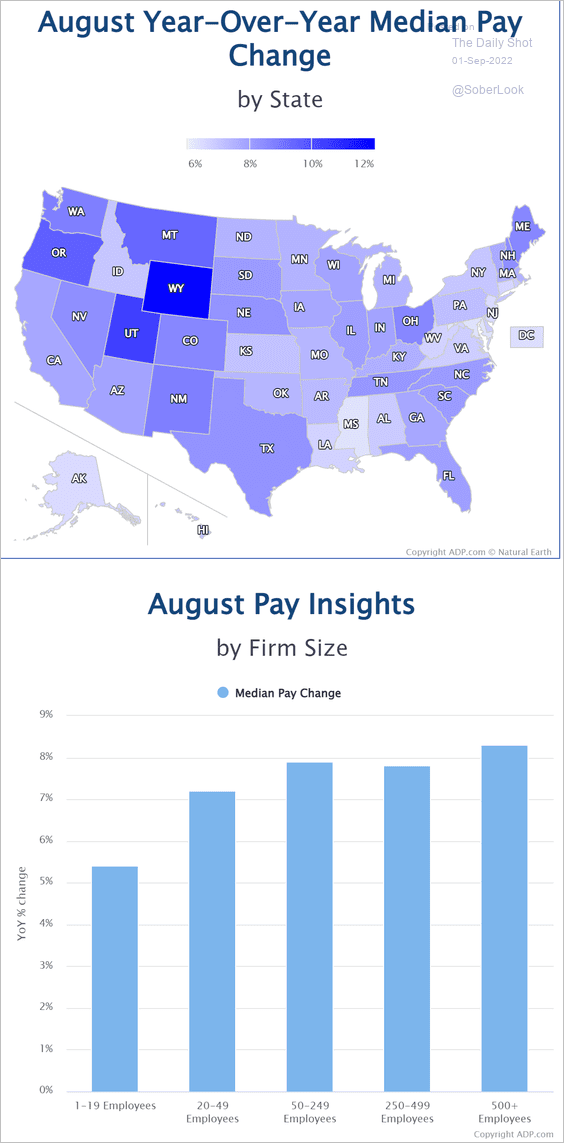 Source: ADP Research Institute
——————–
3. Chicago-area manufacturing continued to expand in August (PMI > 50).
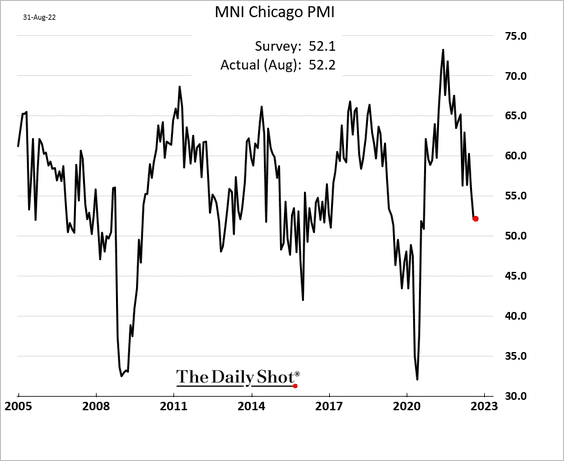
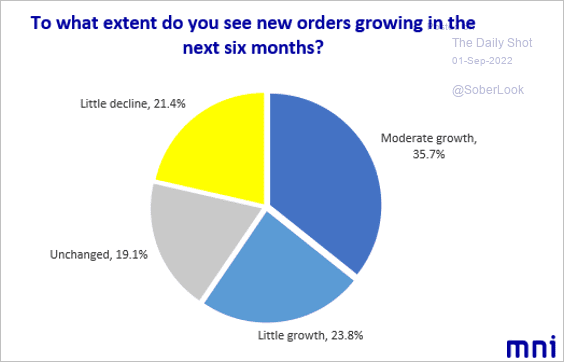
The region’s manufacturers are not too worried about slowing orders.
 Source: @MNIIndicators
——————–
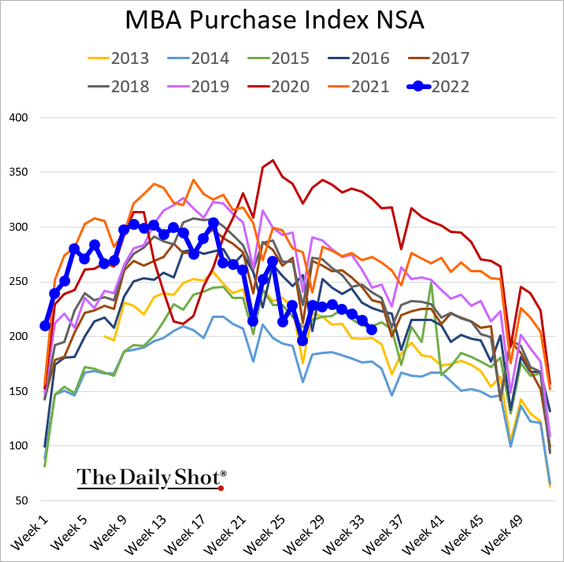
4. Next, we have some updates on the housing market.
• Mortgage applications softened further last week.
• Home price appreciation slowed more than expected in June.
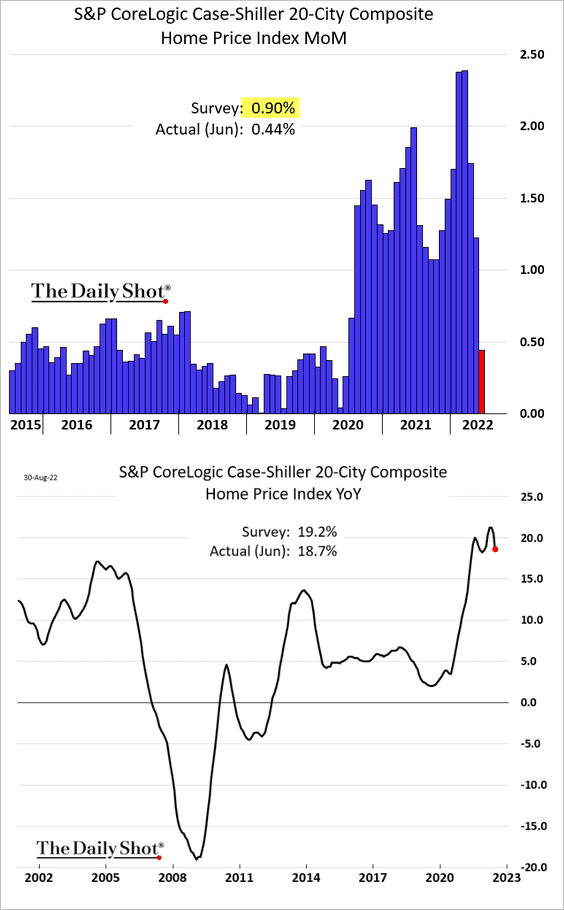
Home prices declined when adjusted for inflation.
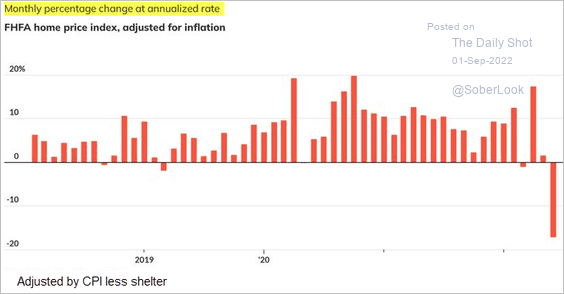 Source: @MKTWeconomics Read full article
• Economists expect home price appreciation to slow sharply next year (2 charts).
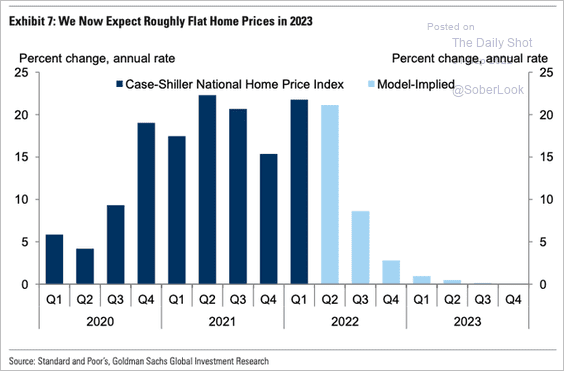 Source: Goldman Sachs; @SamRo
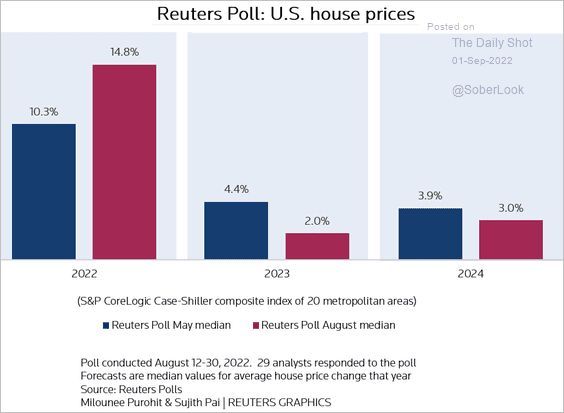 Source: Reuters Read full article
• So far, tight housing inventories have been supporting home price appreciation.
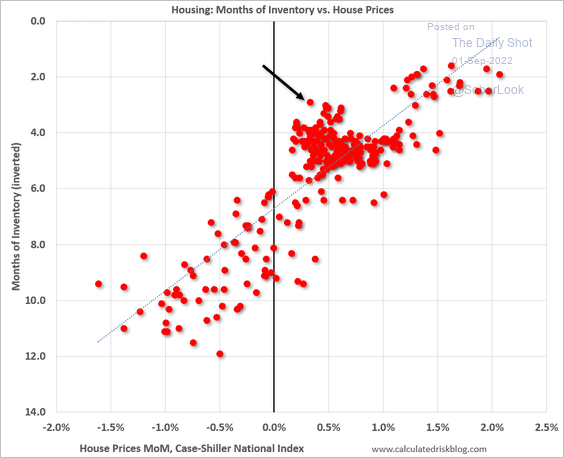 Source: Calculated Risk
• This map shows the odds of home prices dropping over the next year.
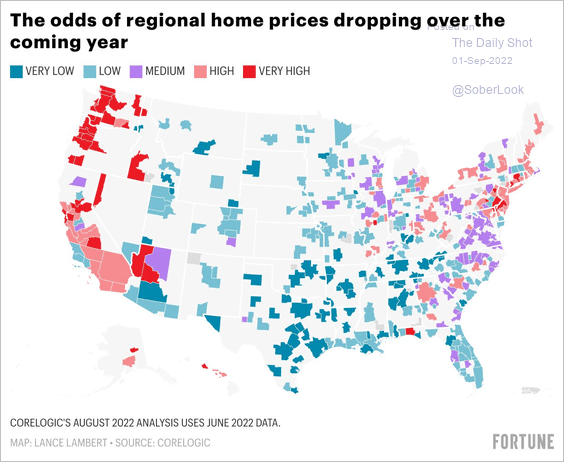 Source: @NewsLambert
• Home sales are expected to slow further.
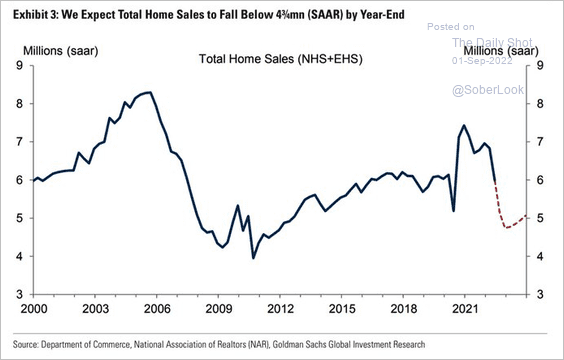 Source: Goldman Sachs; @WallStJesus
• Second home sales continue to slide.
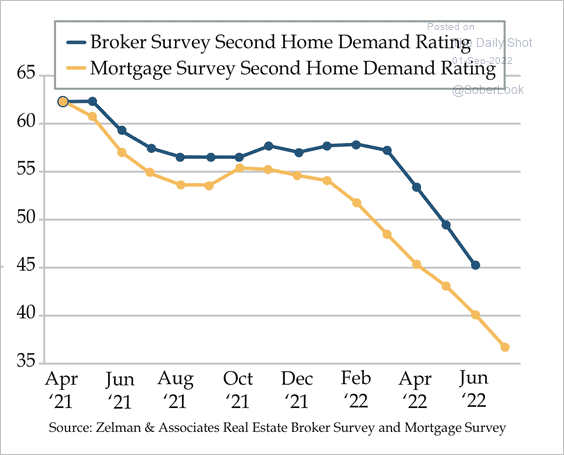 Source: Quill Intelligence
• Google searches for “sell my house” have surged.
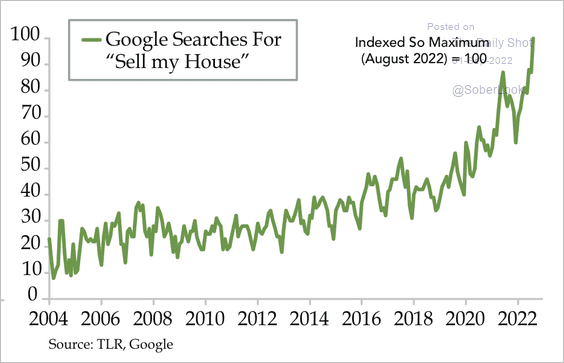 Source: Quill Intelligence
• Home construction has been lagging population growth and household formation.
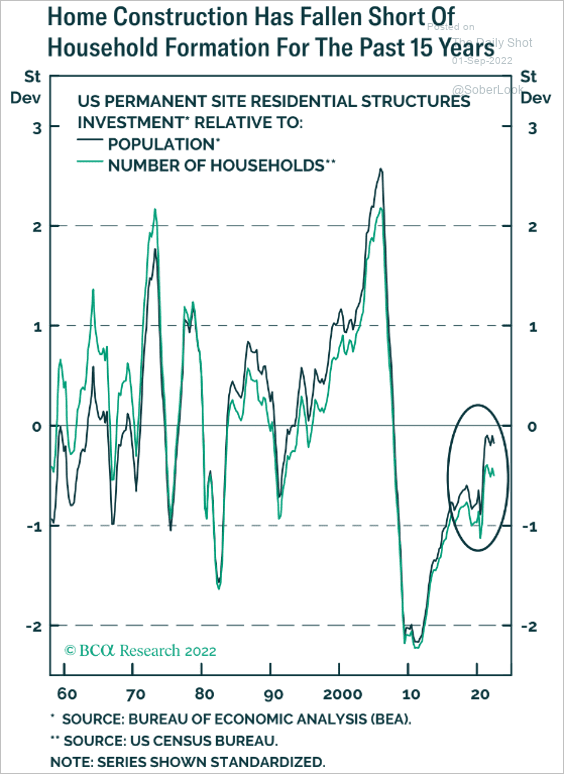 Source: BCA Research
• Rent increases have been slower than last year but remain above pre-COVID levels.
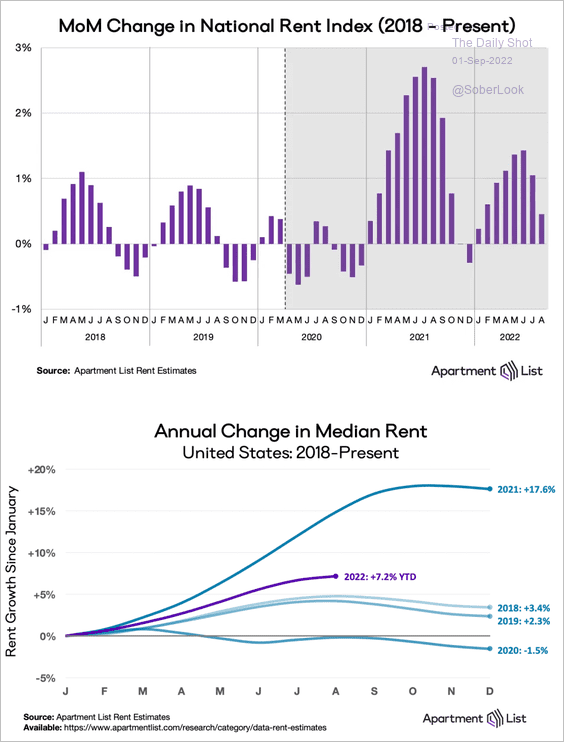 Source: @apartmentlist Read full article
——————–
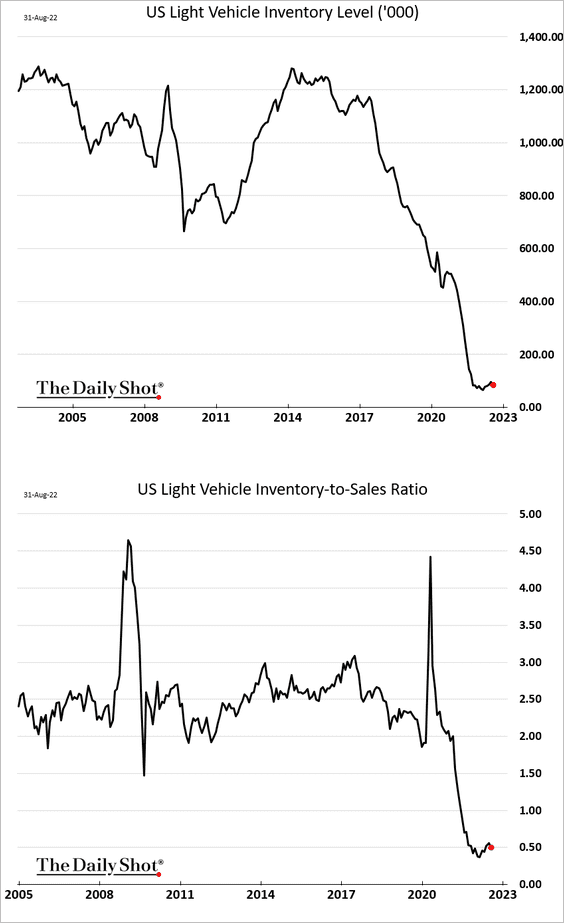
5. Vehicle inventories remain exceptionally low.
6. The labor market has been remarkably strong. This spider chart has been updated with the latest job openings data.
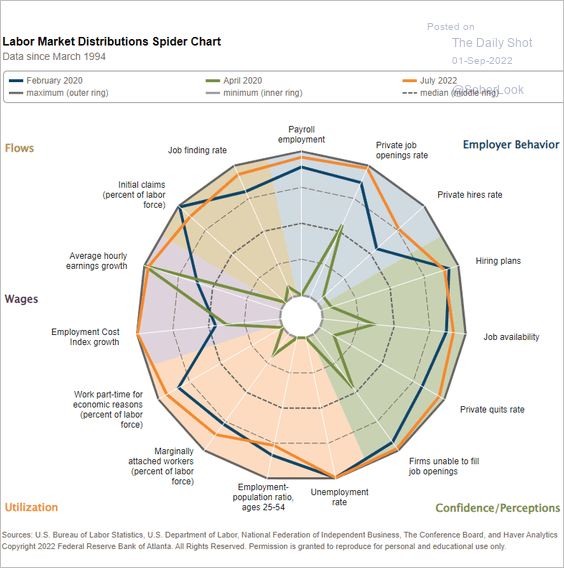 Source: Federal Reserve Bank of Atlanta
Back to Index
The United Kingdom
1. The pound is nearing the 2020 lows vs. USD.
2. This chart shows excess savings by income group.
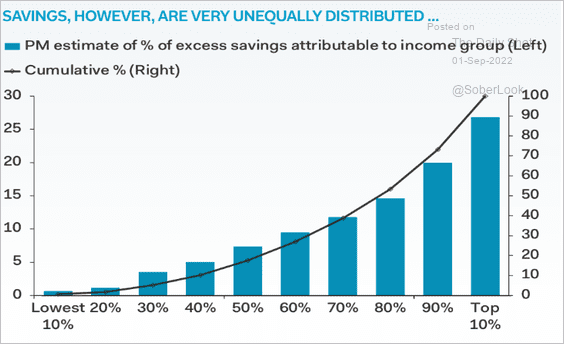 Source: Pantheon Macroeconomics
Back to Index
The Eurozone
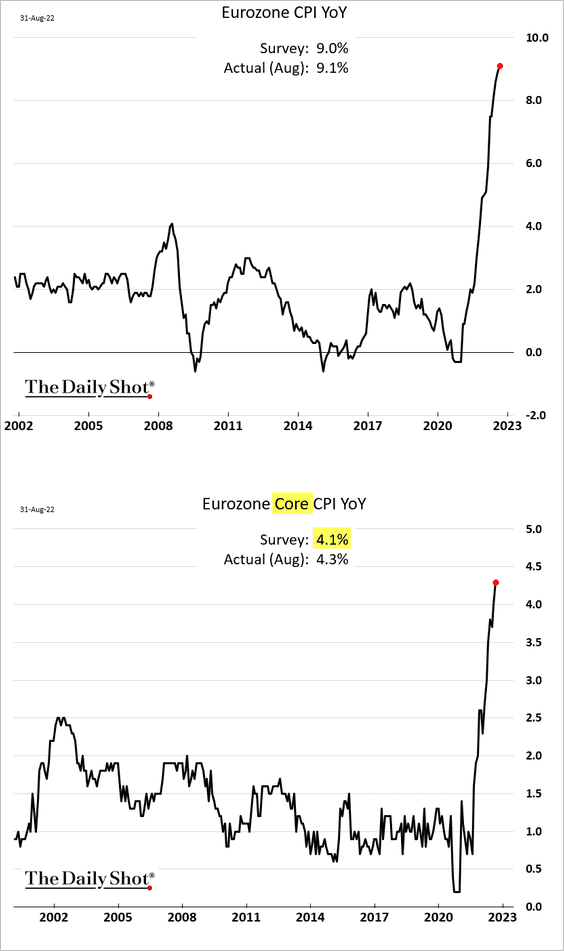
1. The French CPI came off the highs.
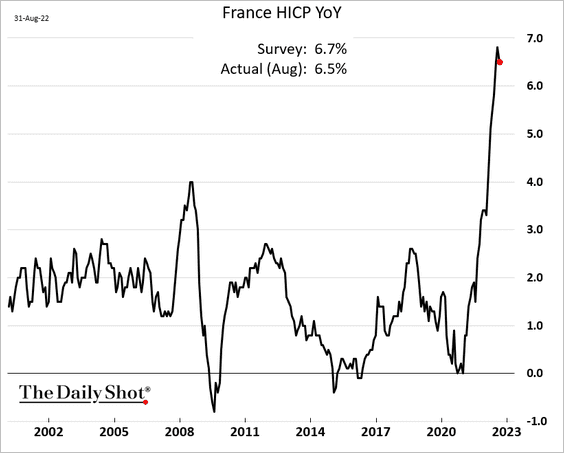
But Italian inflation continues to surge.
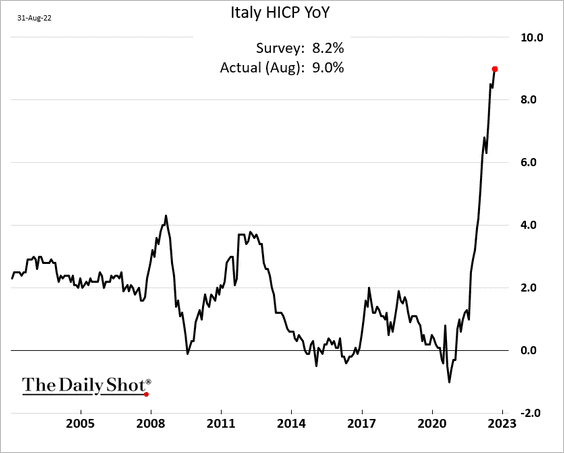
At the Eurozone level, the CPI surprised to the upside again, hitting a new high. Core inflation is also surging (2nd panel).
This scatterplot shows energy dependence vs. the recent changes in the CPI.
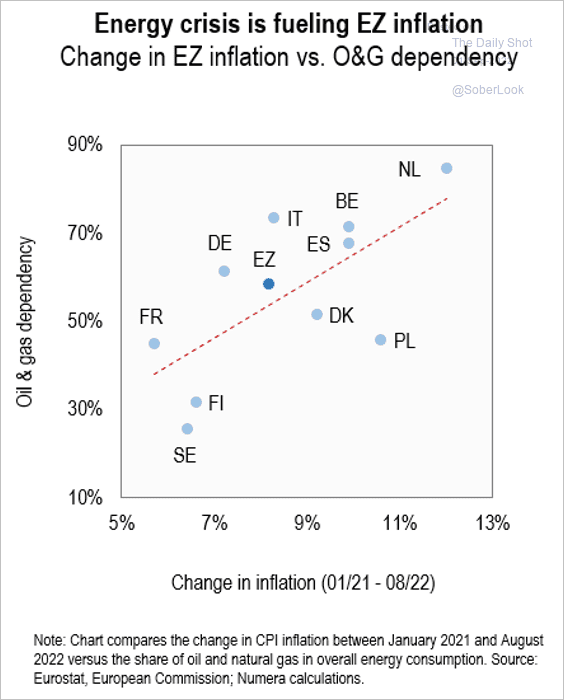 Source: Numera Analytics
——————–
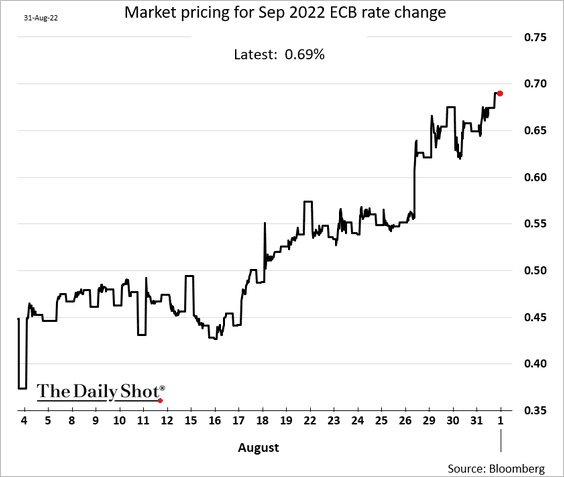
2. A 75 bps rate hike this month is increasingly likely.
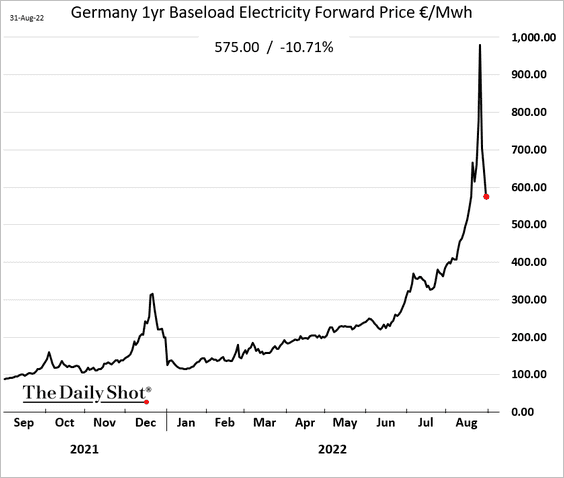
3. Power prices are down massively from the peak.
4. Germany’s unemployment rate edged higher as Ukrainian refugees look for work.
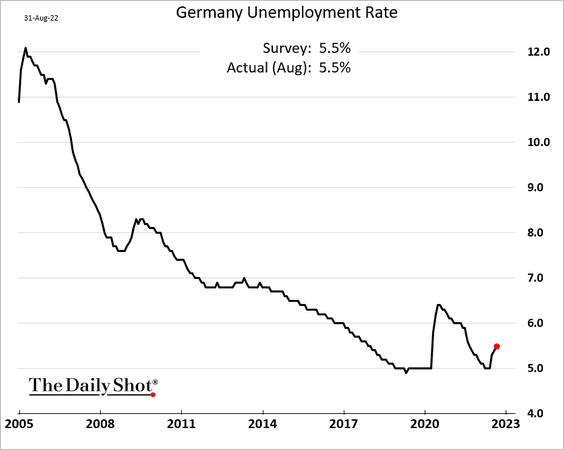
 Source: Bloomberg Read full article
——————–
5. French consumer spending on goods continues to deteriorate.
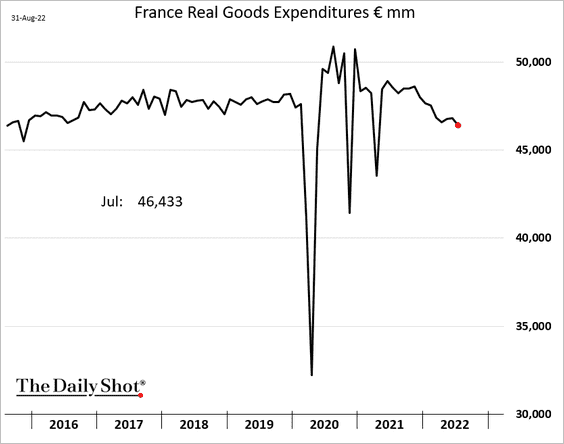
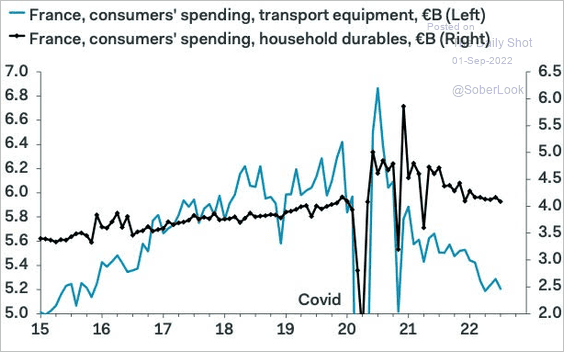 Source: Pantheon Macroeconomics
——————–
6. Spanish household sentiment has been falling faster than at the Eurozone level.
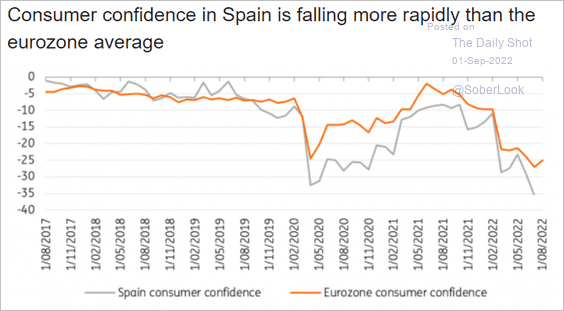 Source: ING
Back to Index
Europe
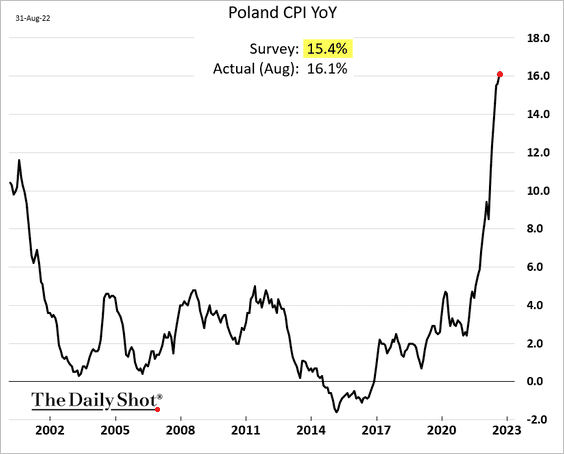
1. Poland’s inflation surprised to the upside again.
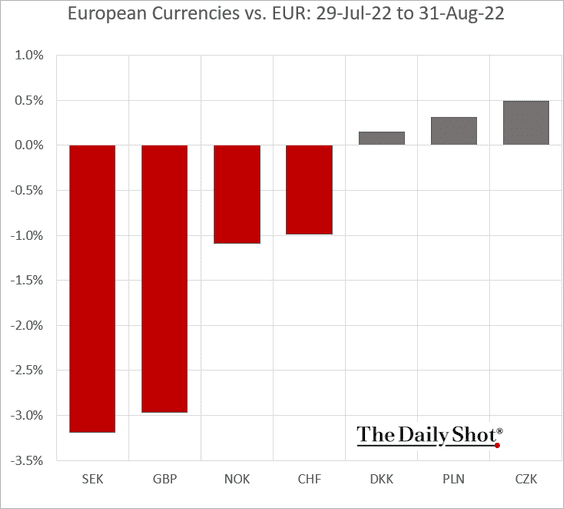
2. Central European currencies outperformed in August.
3. Equity implied vol and credit spreads have diverged.
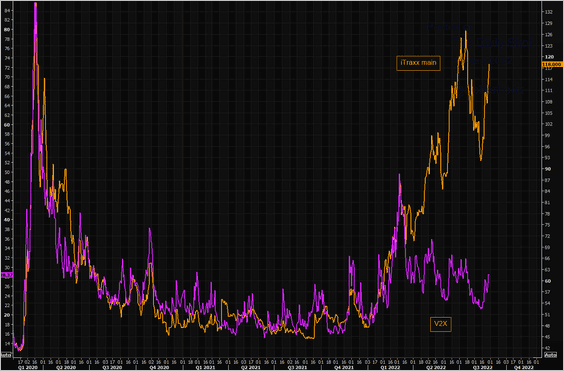 Source: @themarketear
4. Are European corporate earnings estimates too optimistic, given the energy crisis?
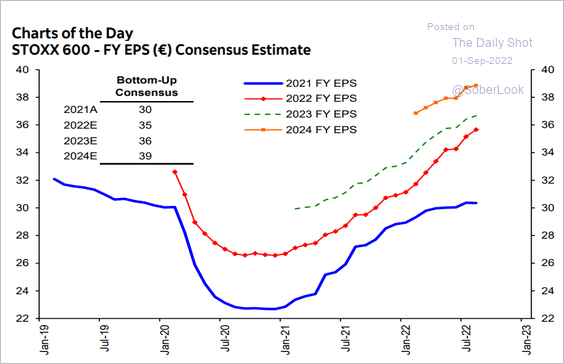 Source: Hugo Ste-Marie, Portfolio & Quantitative Strategy Global Equity Research, Scotia Capital
Back to Index
Japan
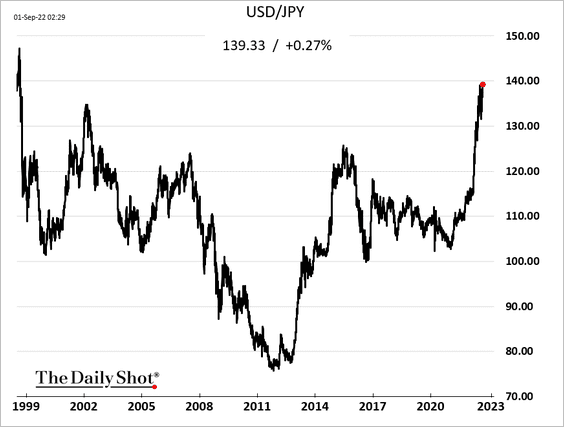
1. Dollar-yen is nearing 140 for the first time since 1999 (the yen continues to weaken).
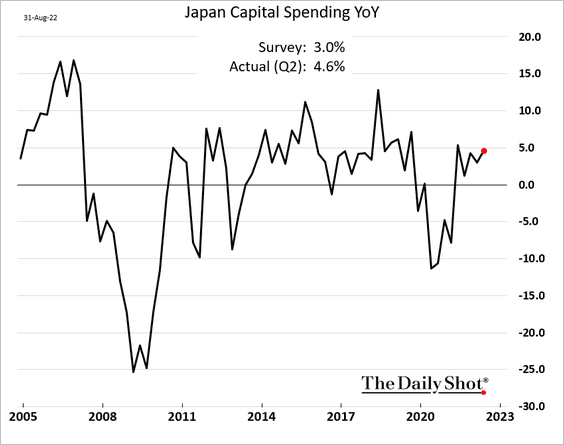
2. Business investment has been rebounding.
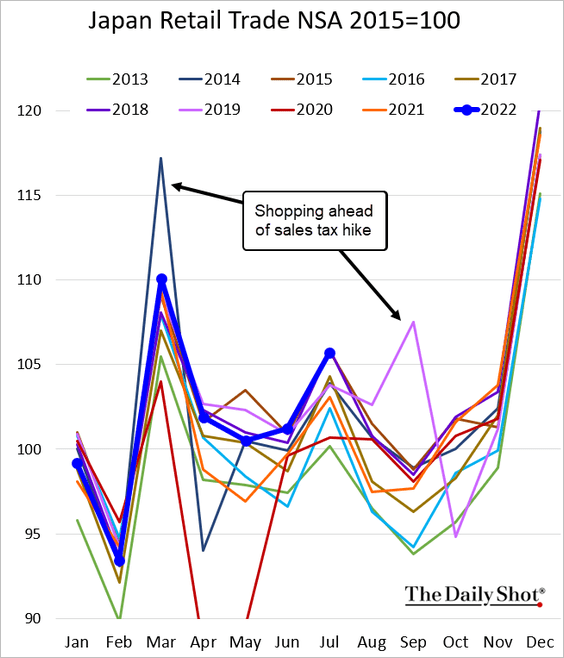
3. Retail sales have been strong for this time of the year.
Back to Index
Asia – Pacific
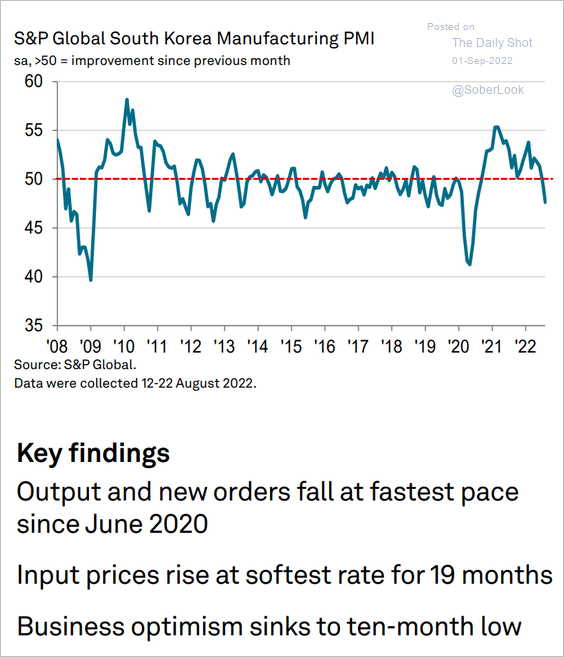
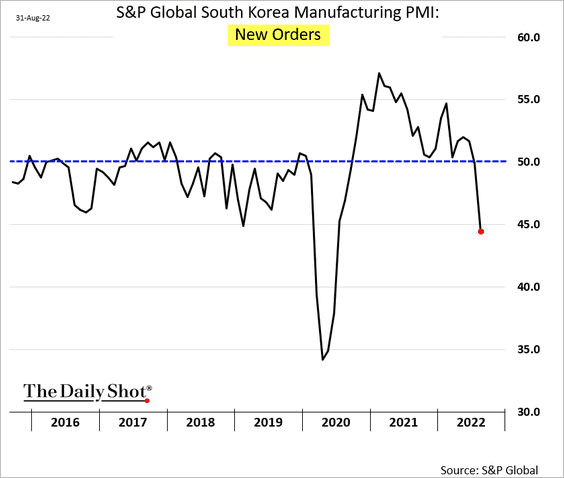
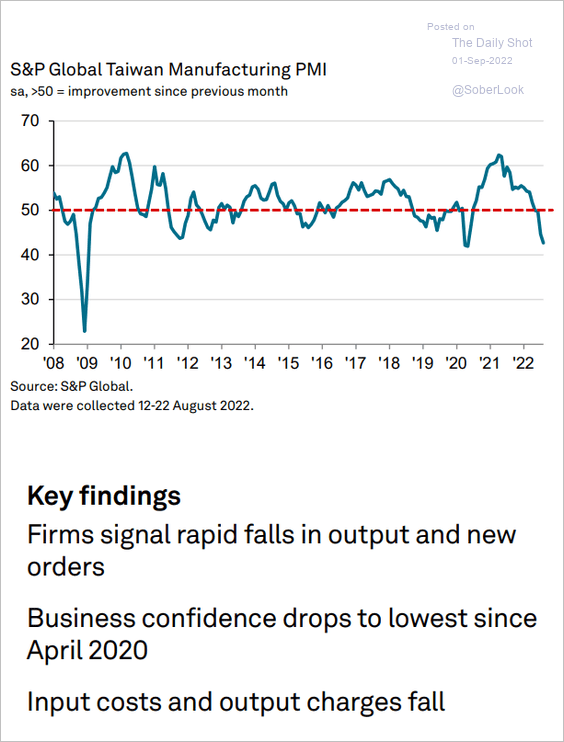
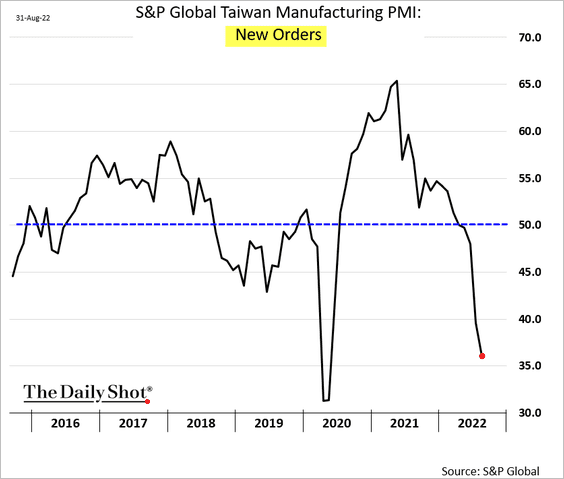
1. Houston, we have a problem. Weakening demand in China sent South Korea’s and Taiwan’s factory activity tumbling.
• South Korea PMI:
 Source: Reuters Read full article
 Source: @WSJ Read full article
• Taiwan PMI:
 Source: S&P Global PMI
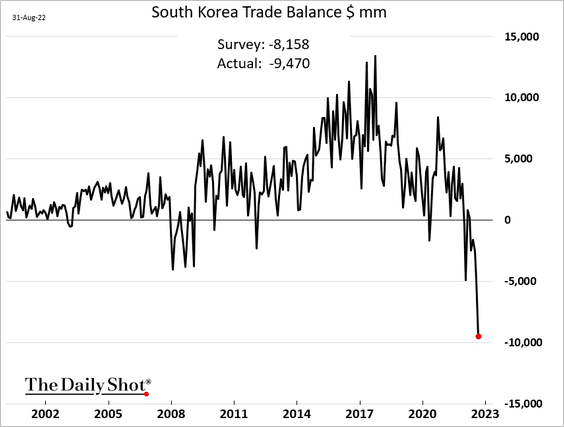
2. South Korea’s trade deficit has blown out.
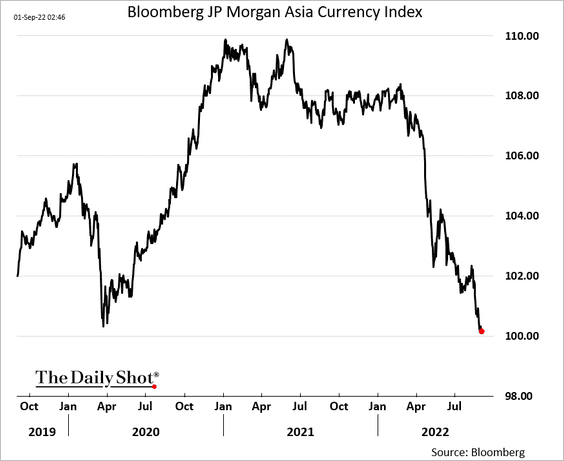
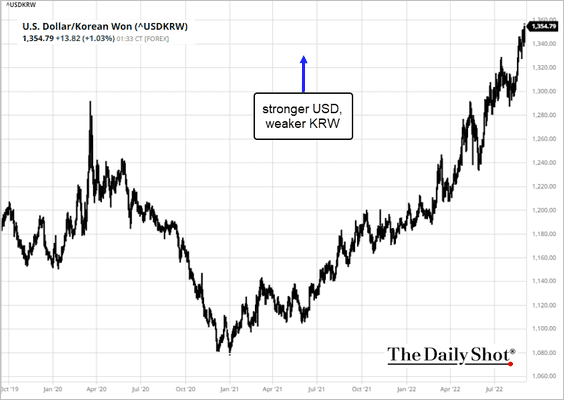
3. Asian currencies are under pressure.
This chart shows the US dollar gaining against the won.
 Source: barchart.com
——————–
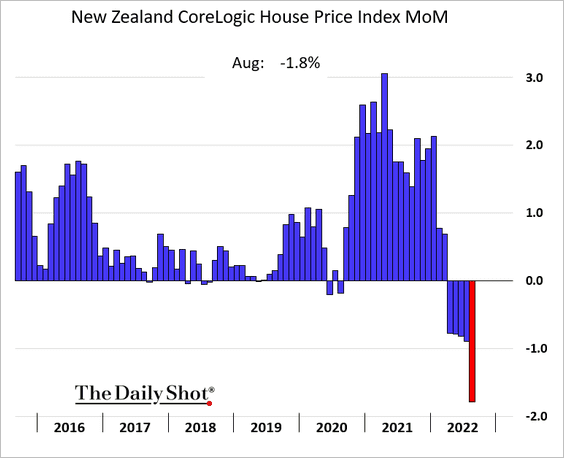
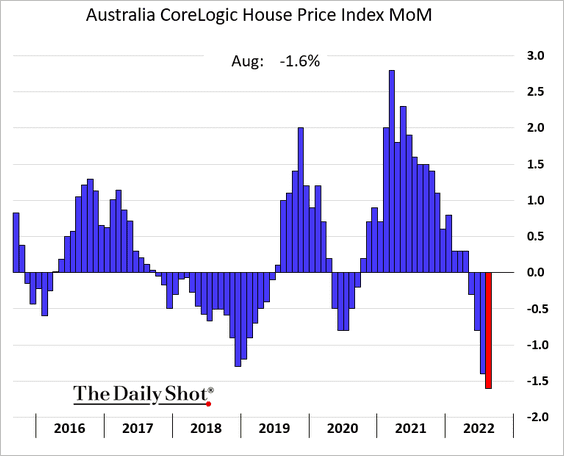
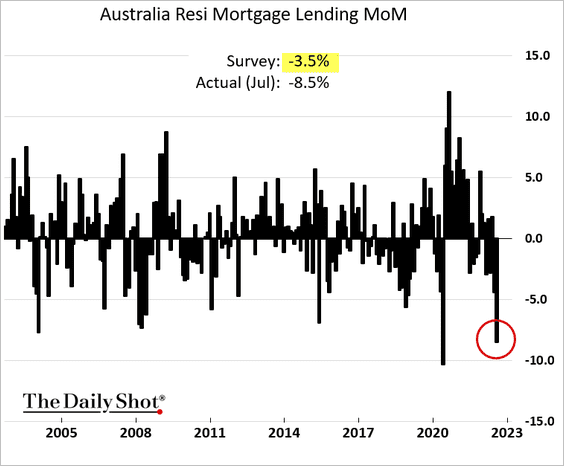
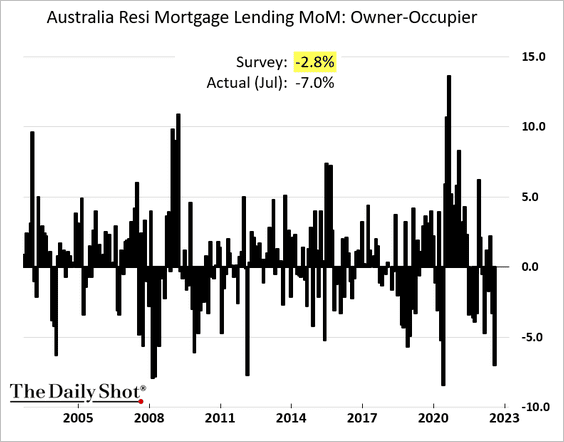
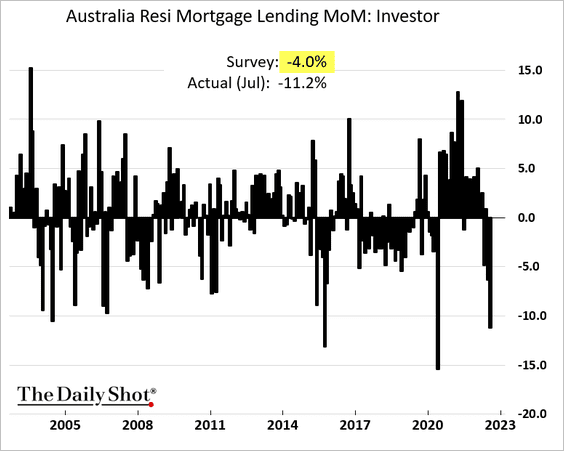
4. Home prices are falling rapidly in New Zealand and Australia.
Residential housing credit in Australia plummeted in July.
Back to Index
China
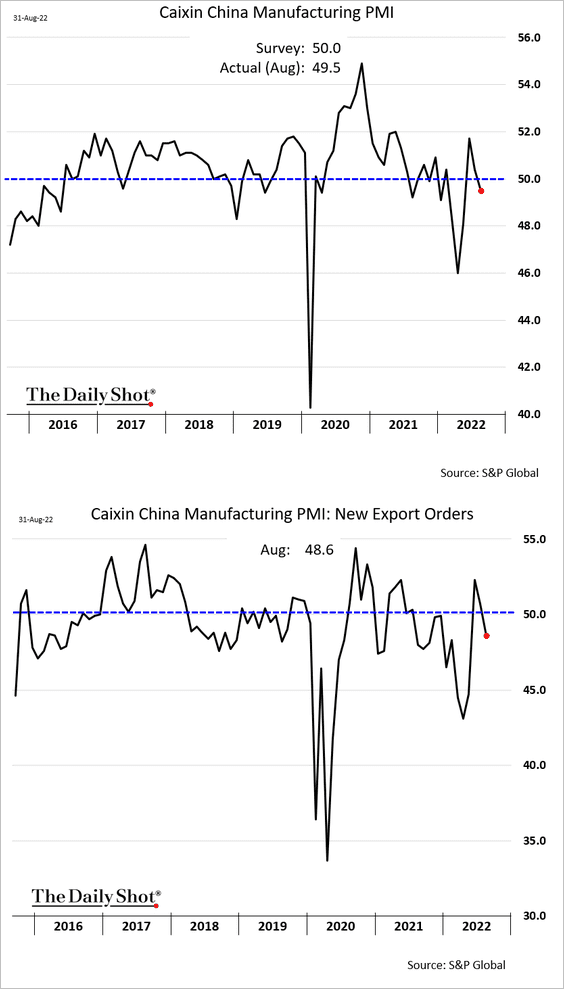
1. The S&P Global China Manufacturing PMI is back in contraction territory (below expectations).
2. More lockdowns are coming.
 Source: @bpolitics Read full article
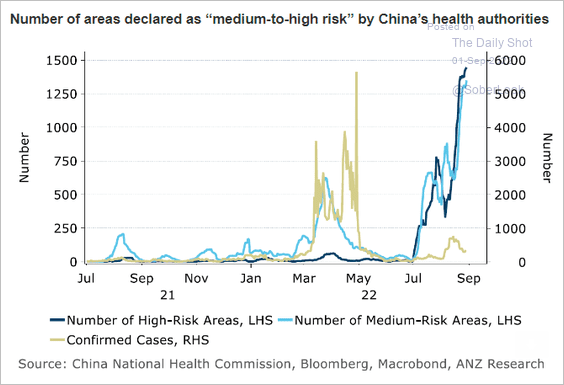 Source: @ANZ_Research
——————–
3. Portfolio outflows have been massive this year.
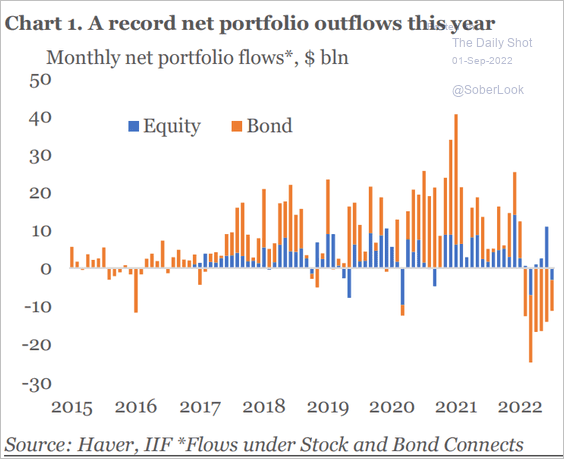 Source: IIF
The yield differential with the US exacerbated outflows.
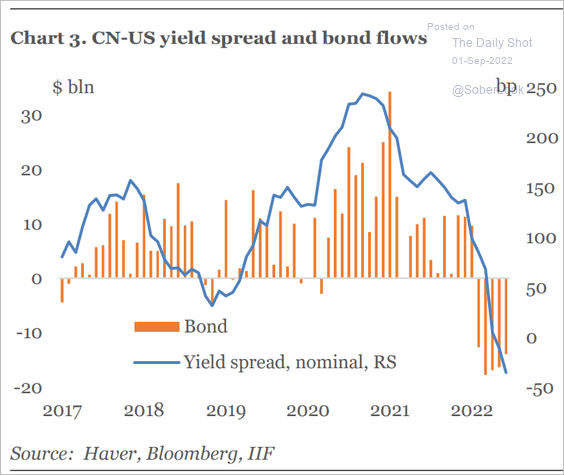 Source: IIF
——————–
4. The drought situation has been severe.
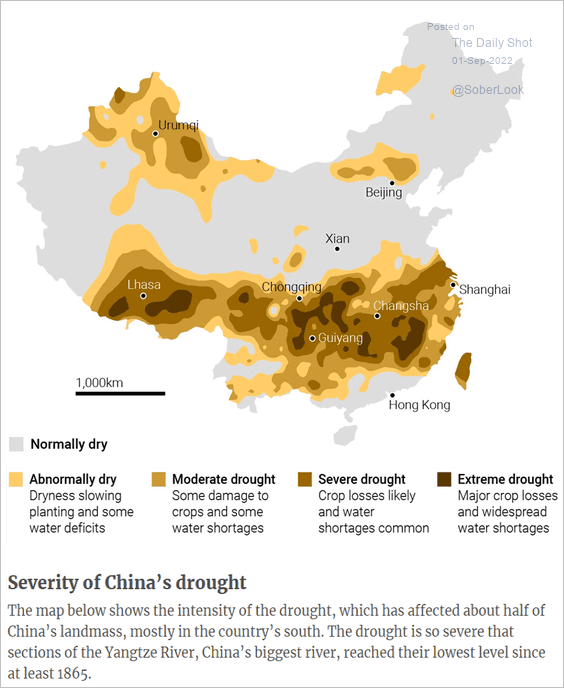 Source: South China Morning Post Read full article
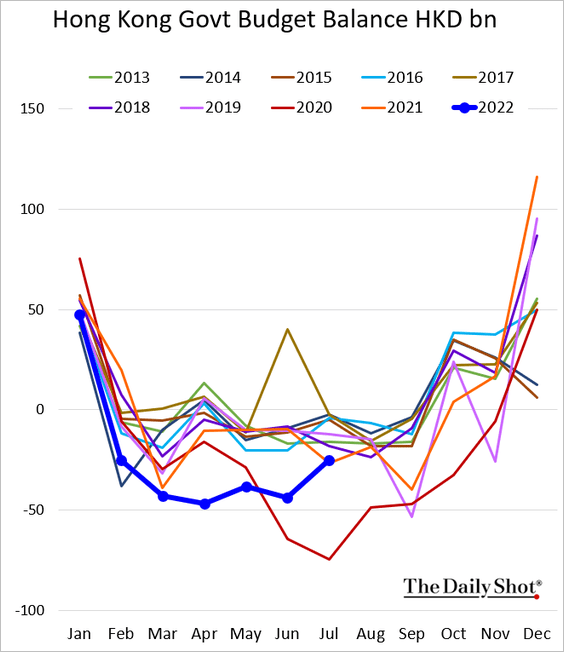
5. Hong Kong’s retail sales remain soft.
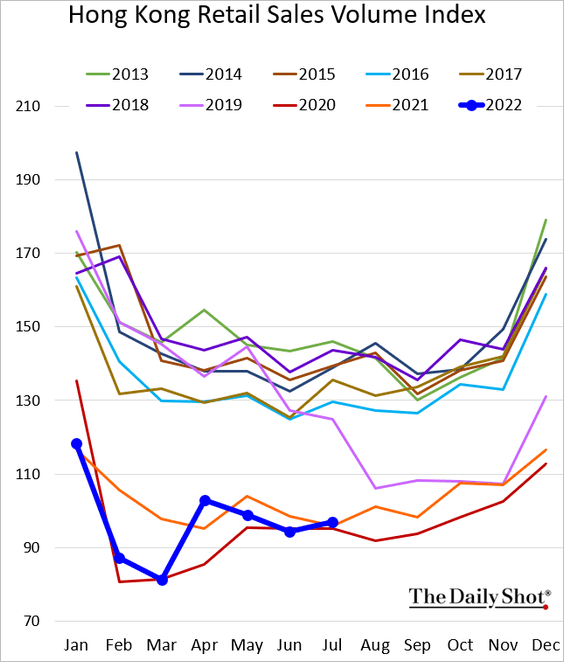
The budget situation is improving.
Back to Index
Emerging Markets
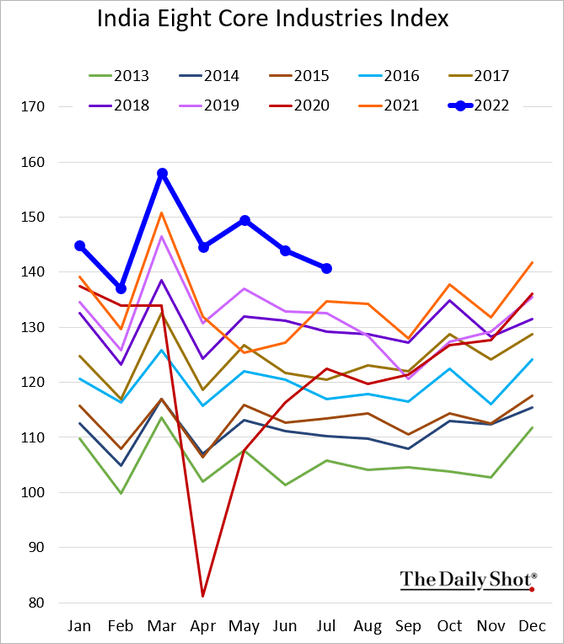
1. India’s GDP rebounded last quarter.
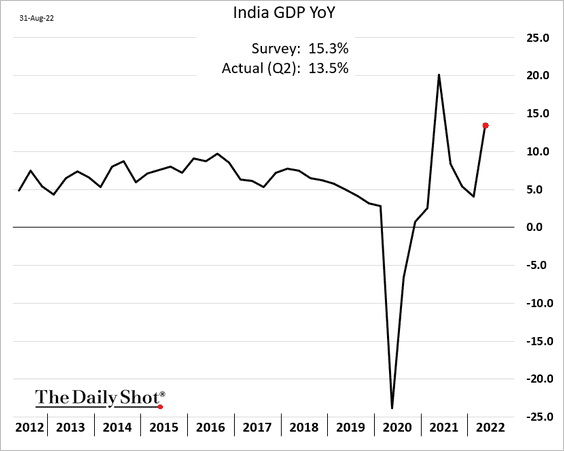
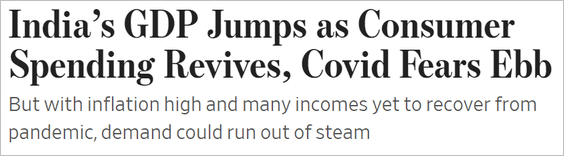 Source: @WSJ Read full article
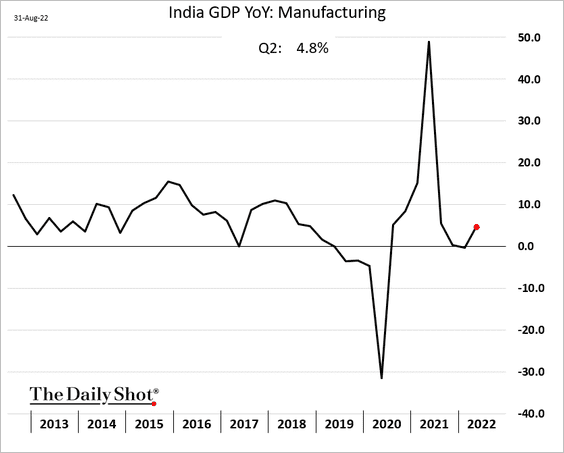
Industrial activity remains robust.
——————–
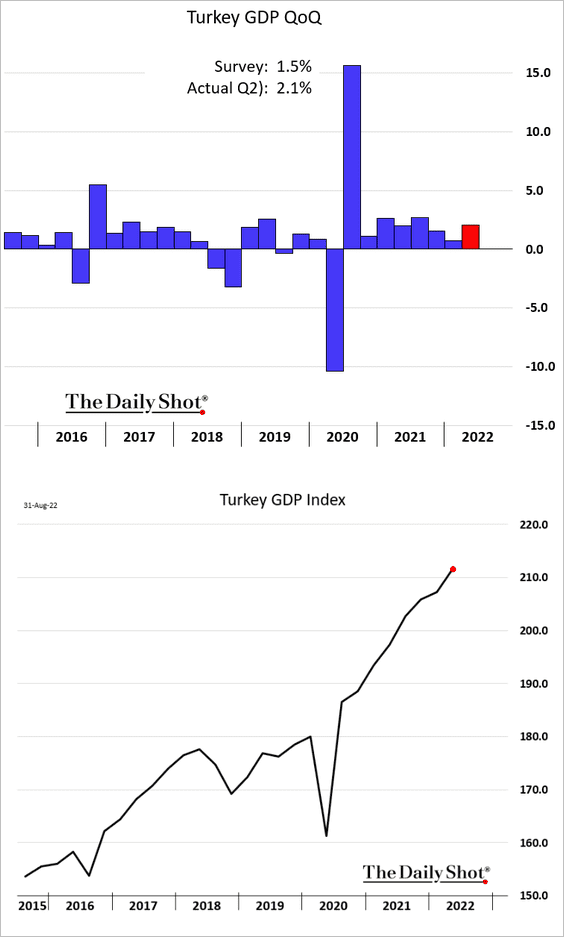
2. Turkey’s GDP surprised to the upside again.
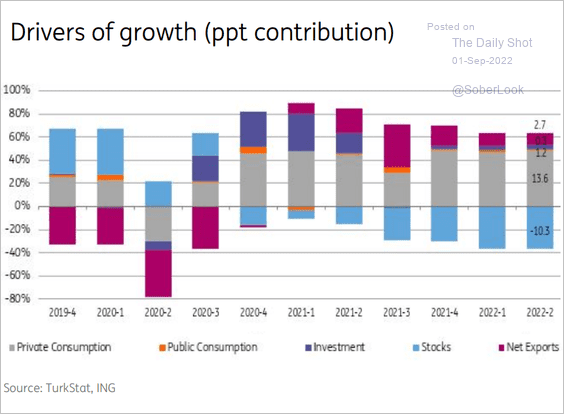 Source: ING
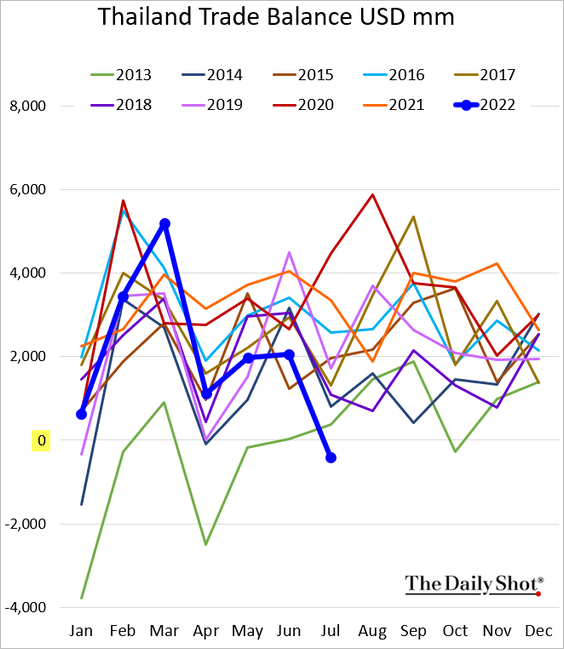
3. Thailand’s trade balance is deteriorating.
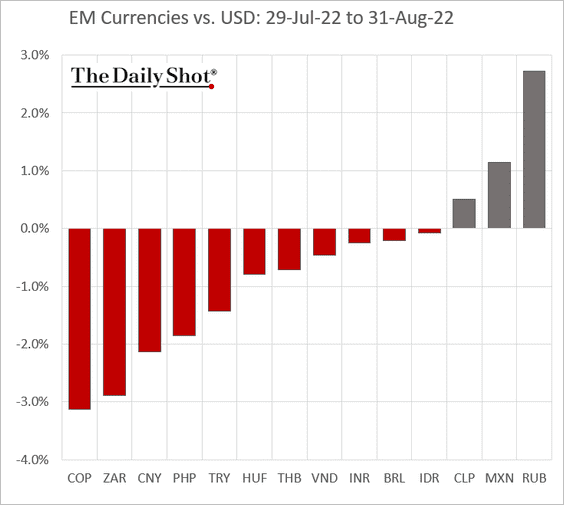
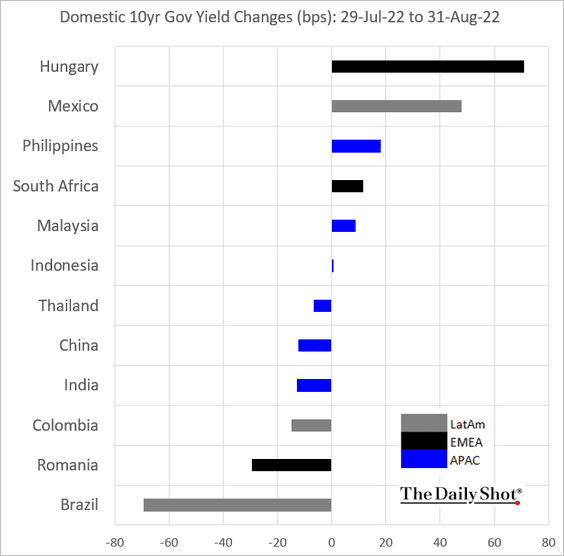
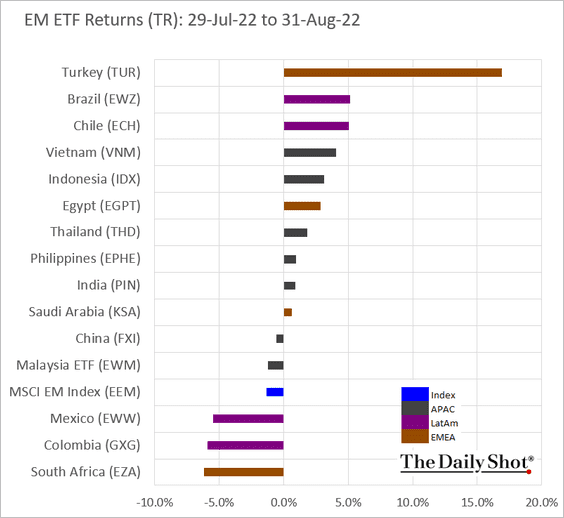
4. Next, we have some performance data for August.
• Currencies:
• Bond yields:
• Equity ETFs:
Back to Index
Commodities
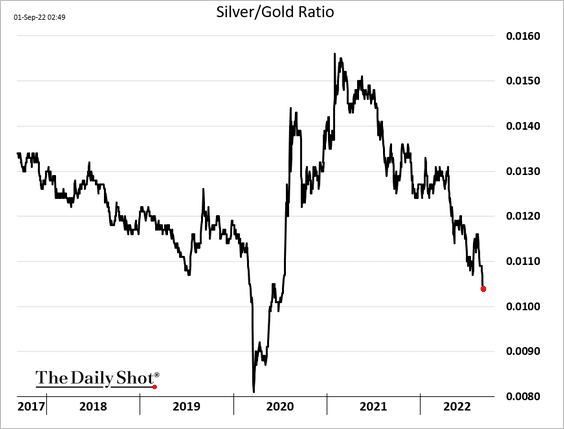
1. The silver-to-gold ratio is now below pre-COVID levels.
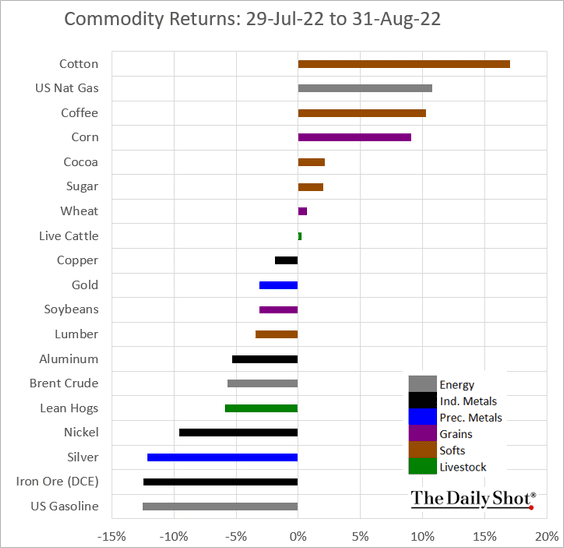
2. Here is the August performance across key commodity markets.
Back to Index
Energy
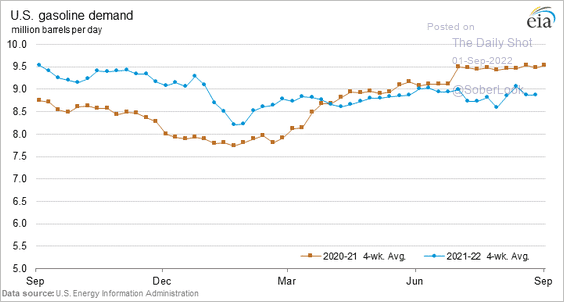
1. US gasoline futures are tumbling, …
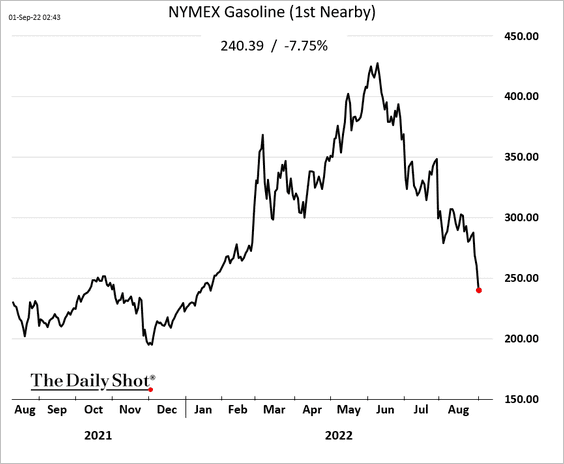
… amid softer demand.
——————–
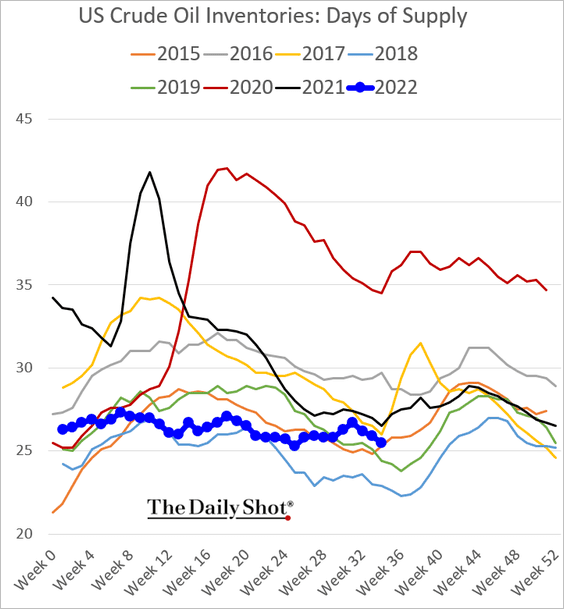
2. US oil inventories (measured in days of supply) have been tightening.
3. Iran could substantially boost global oil supplies (2 charts).
• Longview Economics:
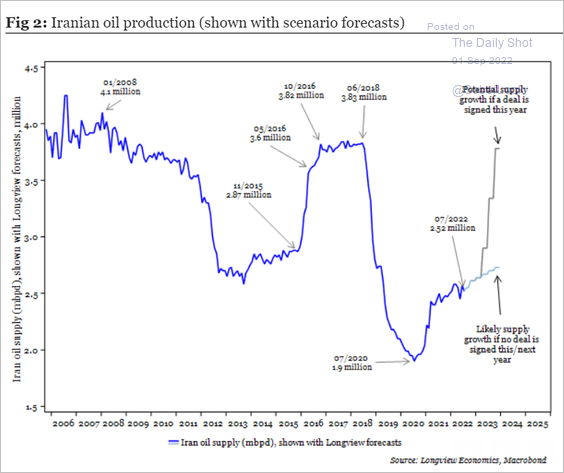 Source: Longview Economics
• Capital Economics:
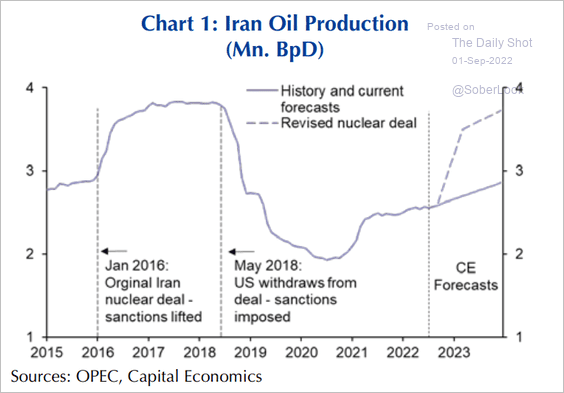 Source: Capital Economics
Here is a potential impact.
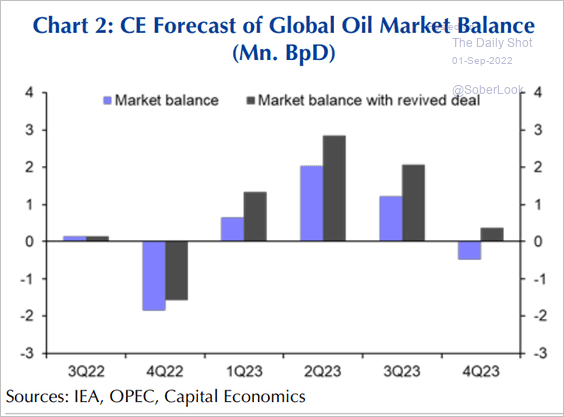 Source: Capital Economics
——————–
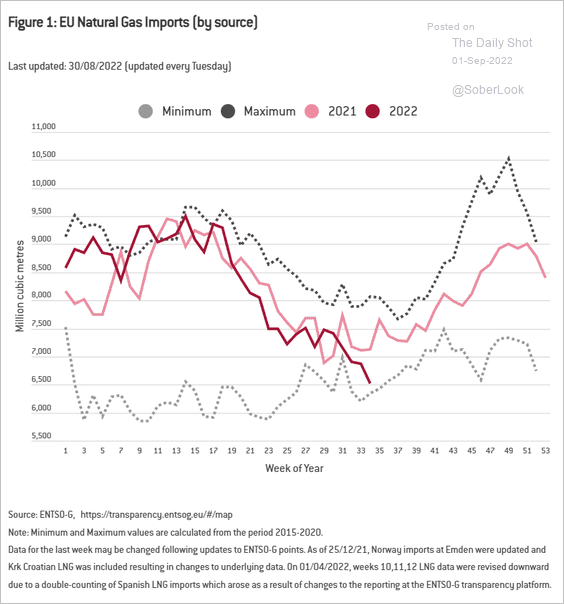
4. The EU has been cutting natural gas imports.
 Source: BRUEGEL
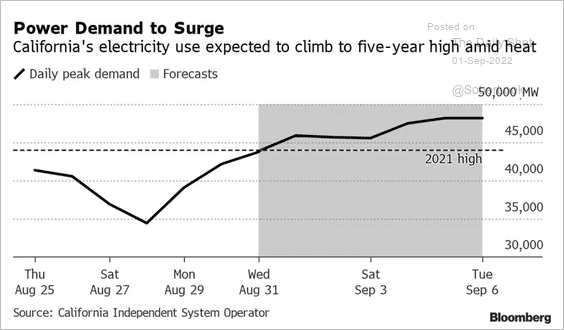
5. The heat wave is putting pressure on California’s power grid.
 Source: Yahoo Finance Read full article
Back to Index
Equities
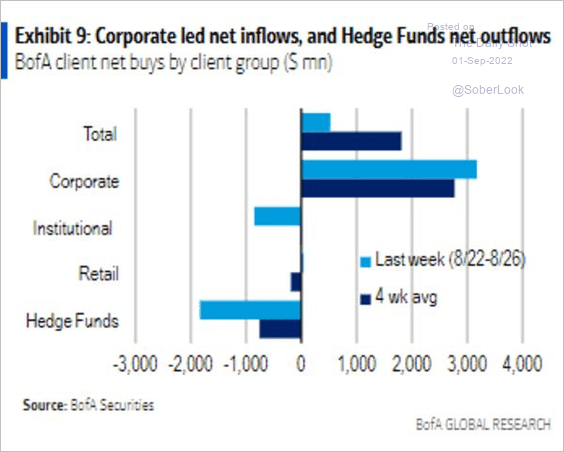
1. BofA’s corporate clients used the stock rout to buy back shares.
 Source: BofA Global Research; Bloomberg Read full article
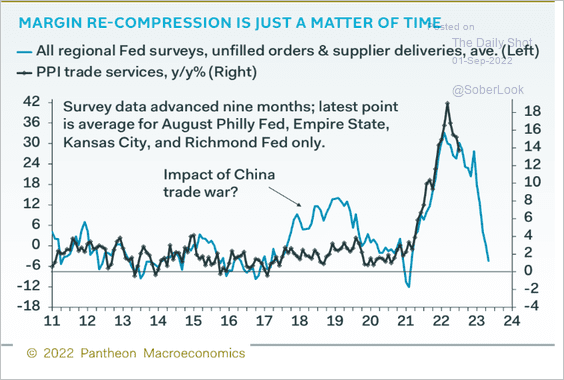
2. Profit margins are under pressure (2 charts). Note that the PPI trade services index measures business markups.
• Pantheon Macroeconomics:
 Source: Pantheon Macroeconomics
• BCA Research:
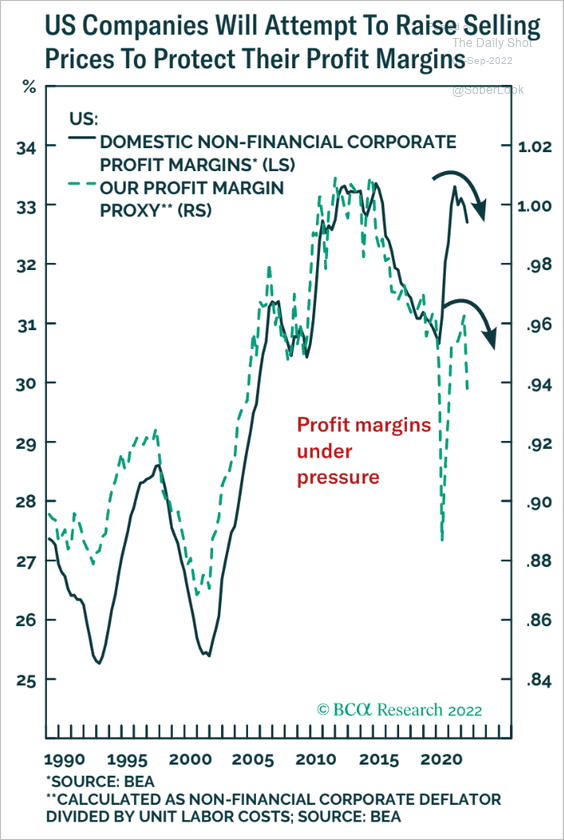 Source: BCA Research
——————–
3. Implied volatility (VIX) has decoupled from the stock market selloff.
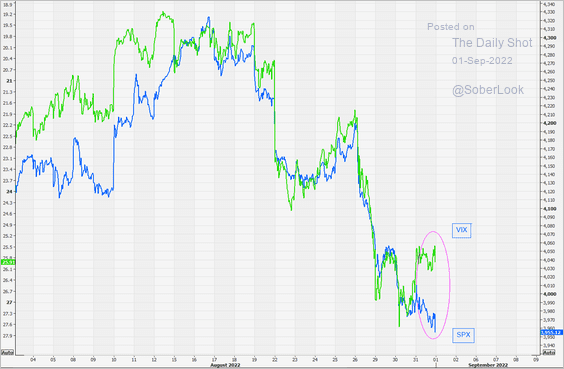 Source: @themarketear
4. How long has it been since a $25+ billion IPO?
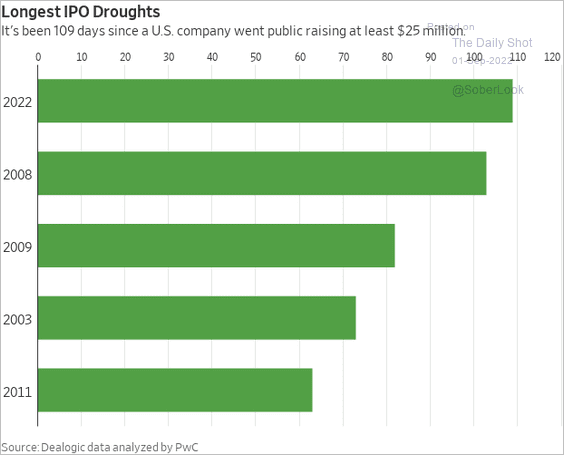 Source: @WSJ Read full article
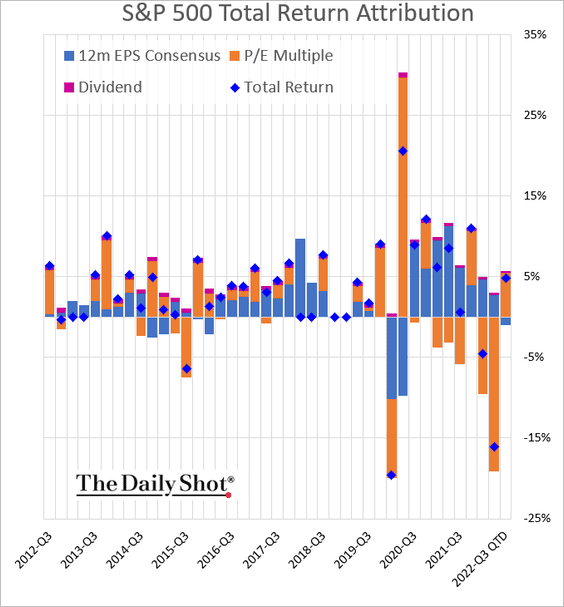
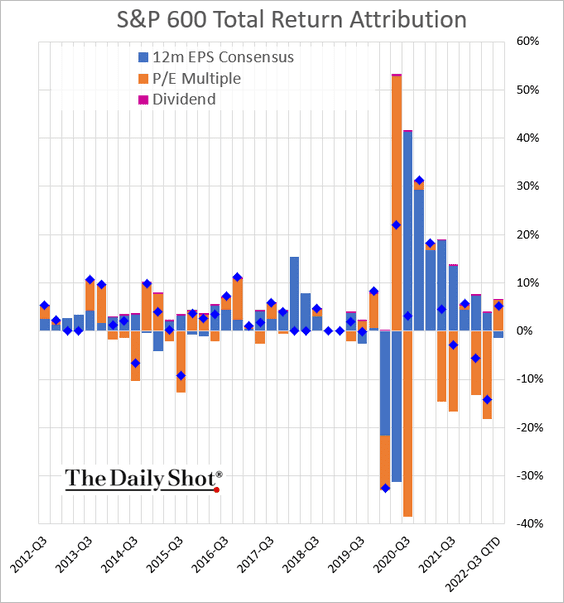
5. Next, we have some quarter-to-date performance attribution data.
• S&P 500:
• S&P 600 (small caps):
——————–
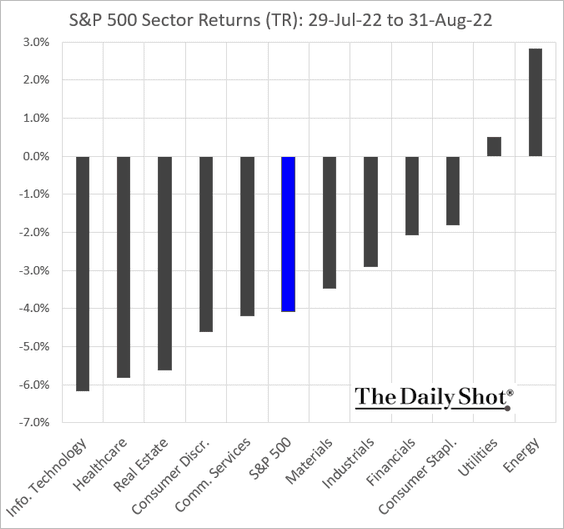
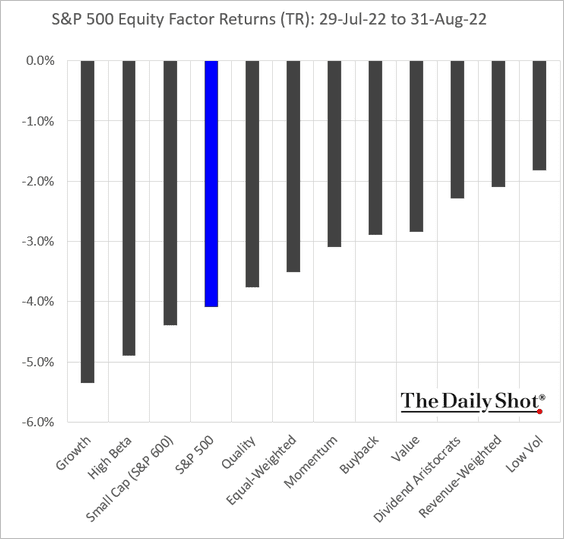
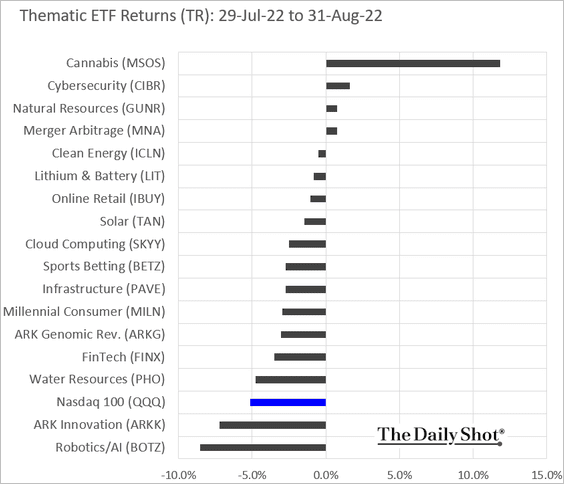
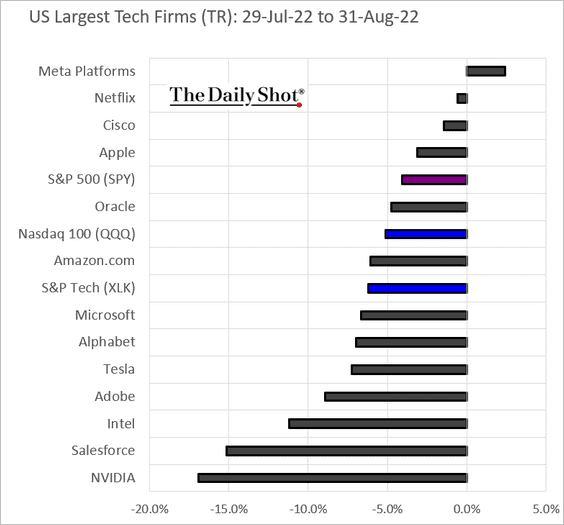
7. Finally, let’s take a look at performance data for August.
• Sectors:
• Equity factors:
• Thematic ETFs:
• Largest US tech firms:
Back to Index
Credit
1. So far, the surge in interest rates in advanced economies has not made much of an impact on private sector finances.
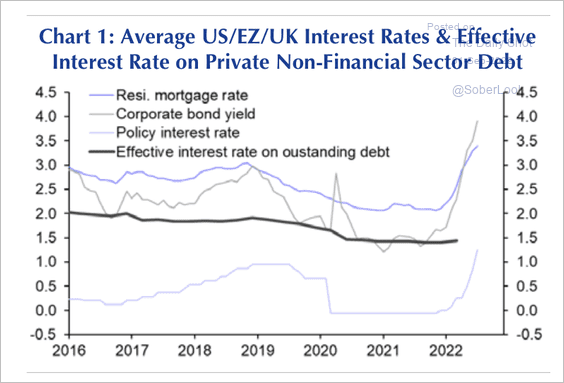 Source: Capital Economics
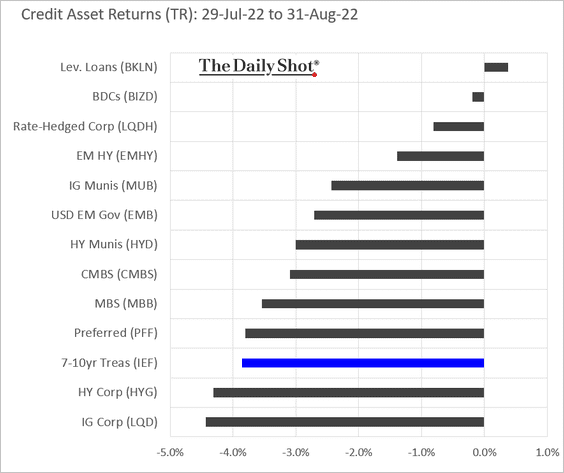
2. This chart shows credit performance in August (only leveraged loans were up on the month).
Back to Index
Rates
1. Treasuries are not attractive when hedged into EUR, GBP, or JPY.
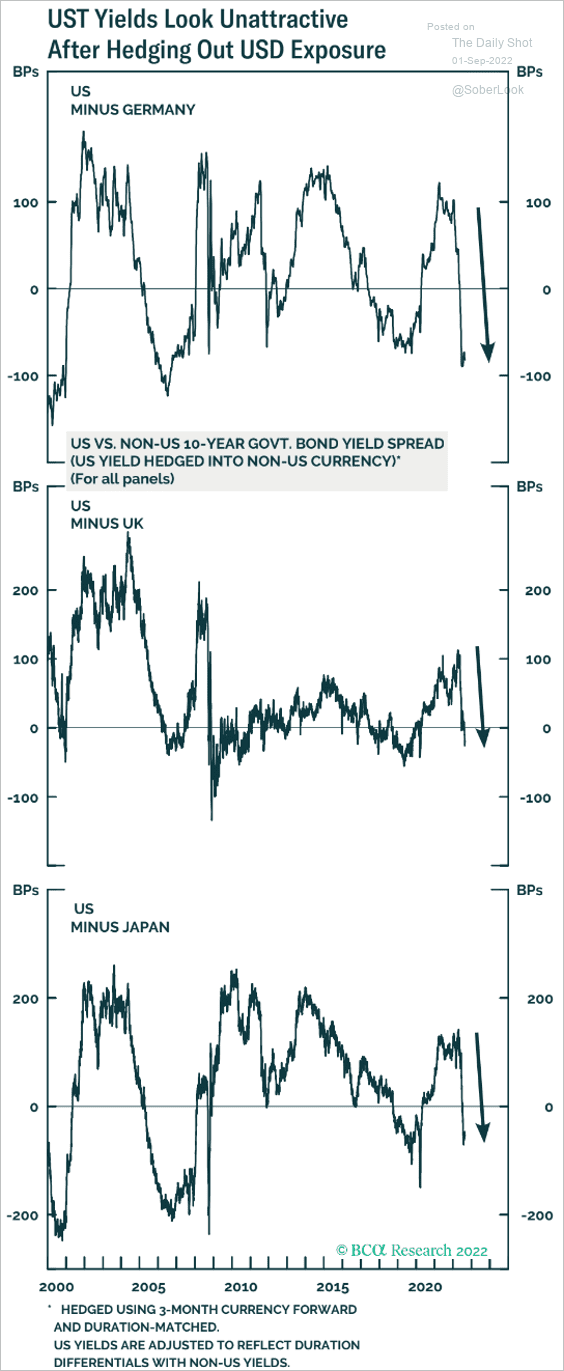 Source: BCA Research
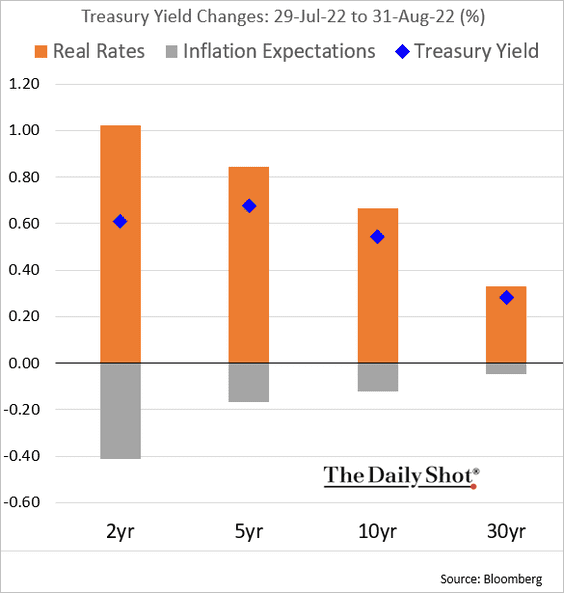
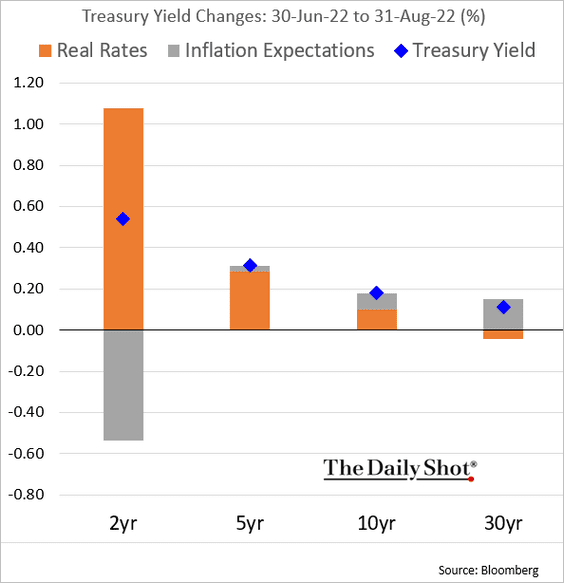
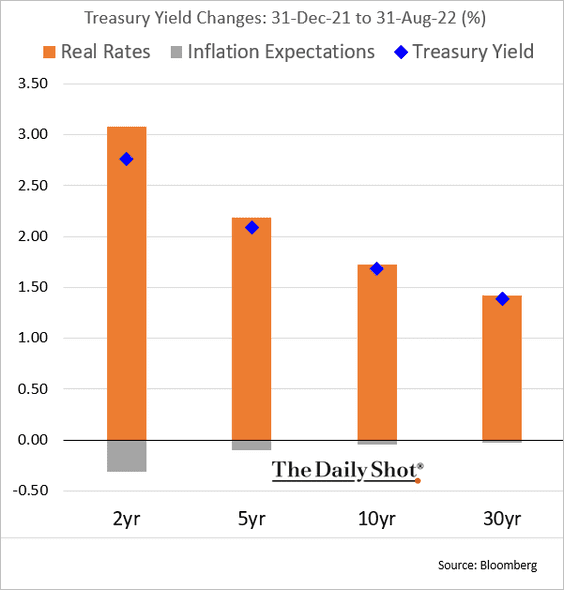
2. Next, we have some Treasury yield attribution data.
• August:
• Quarter-to-date:
• Year-to-date:
Back to Index
Global Developments
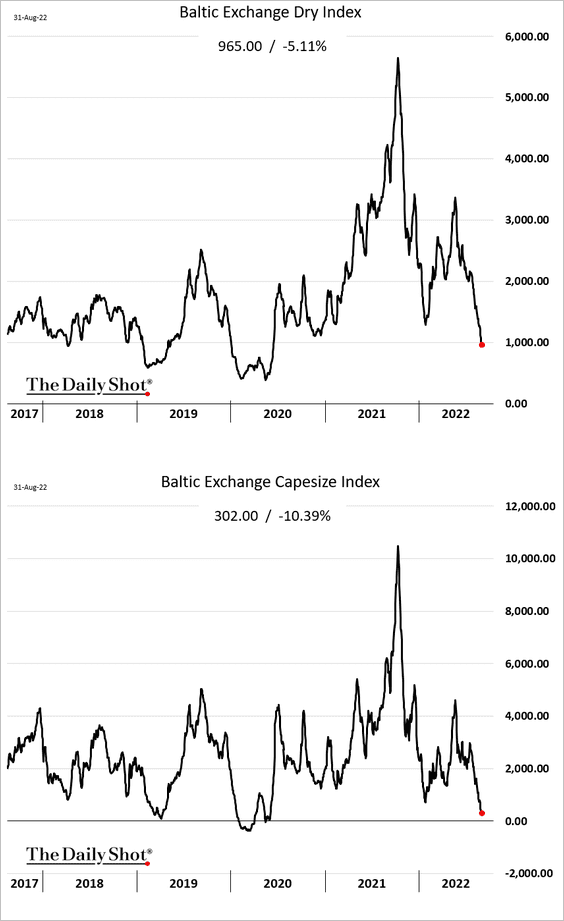
1. Dry bulk shipping costs are crashing as China’s demand weakens.
2. Which currencies are undervalued?
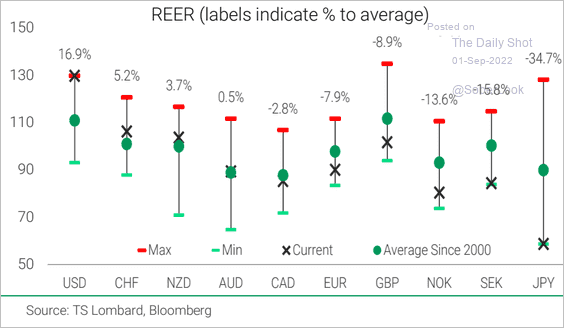 Source: TS Lombard
3. This chart shows the progression of GDP growth, inflation, and debt by decade.
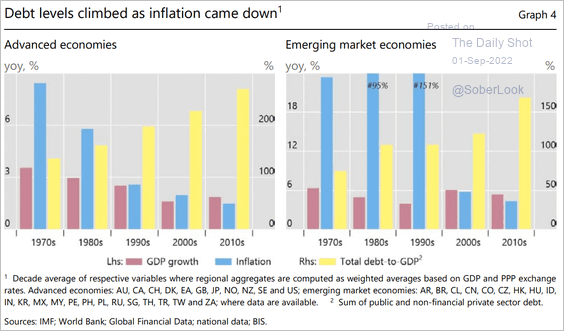 Source: BIS Read full article
4. Major asset classes were down in August.
 Source: @luwangnyc, @denitsa_tsekova, @markets Read full article
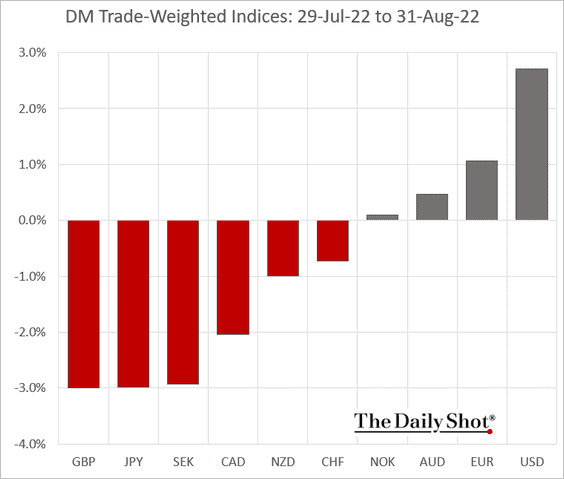
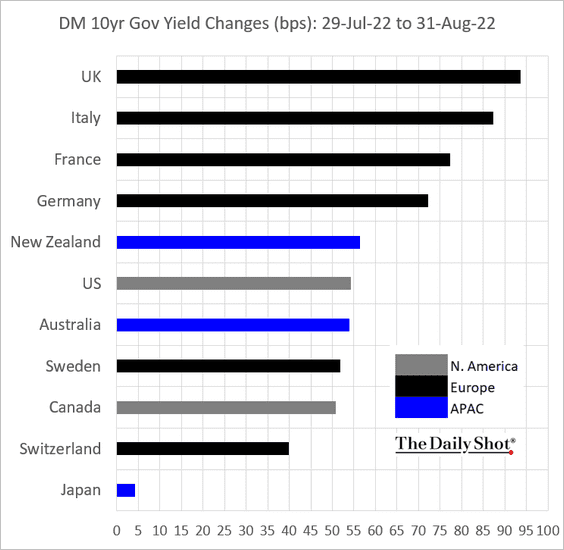
5. Next, we have some DM performance data for August.
• Trade-weighted currency indices:
• Bond yields:
——————–
Food for Thought
1. Contributions to the cost of building a home in the US:
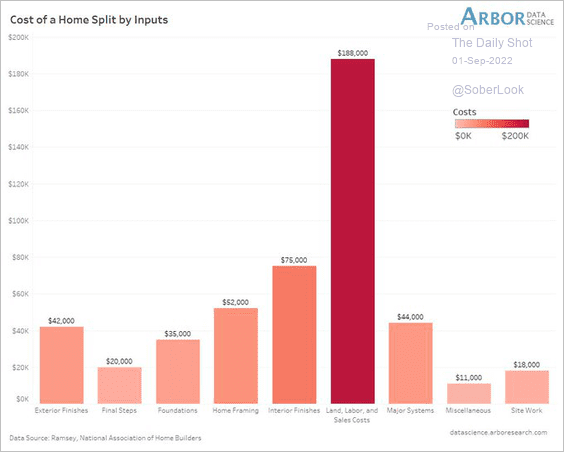 Source: @LizAnnSonders, @NAHBhome, @DataArbor
2. Food takeout and online grocery ordering:
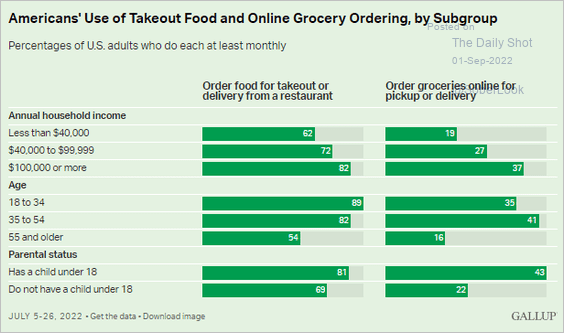 Source: Gallup Read full article
3. Pakistan’s monsoon season rainfall:
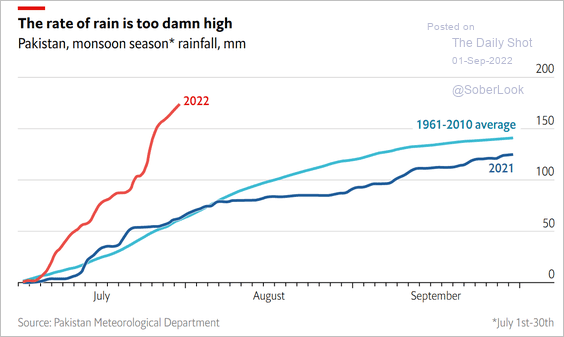 Source: The Economist Read full article
4. Mexico’s top exports to the US:
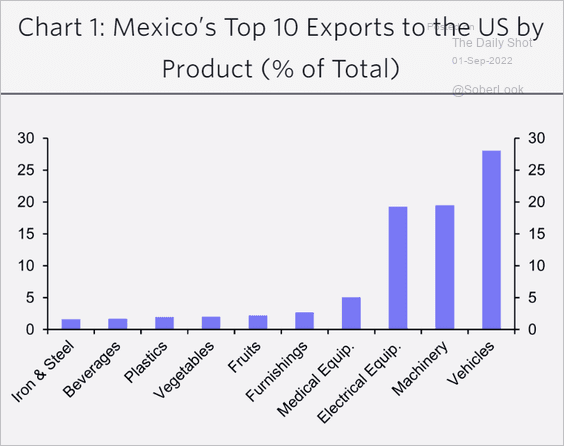 Source: Capital Economics
5. Views on COVID vaccine requirements for students:
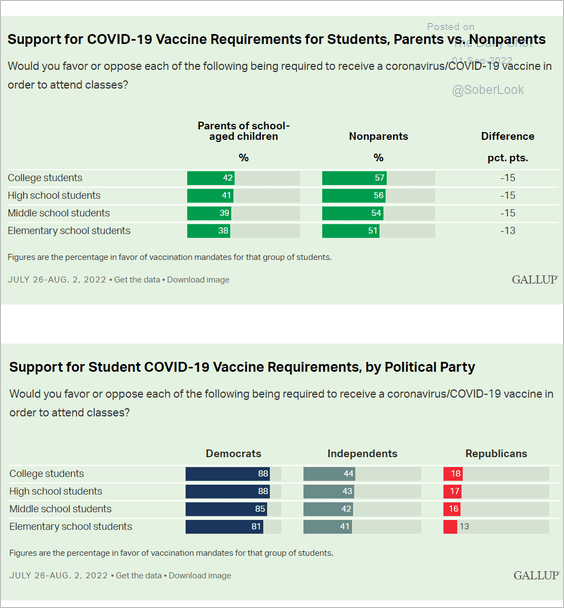 Source: Gallup Read full article
6. The independent voter is increasingly moderate.
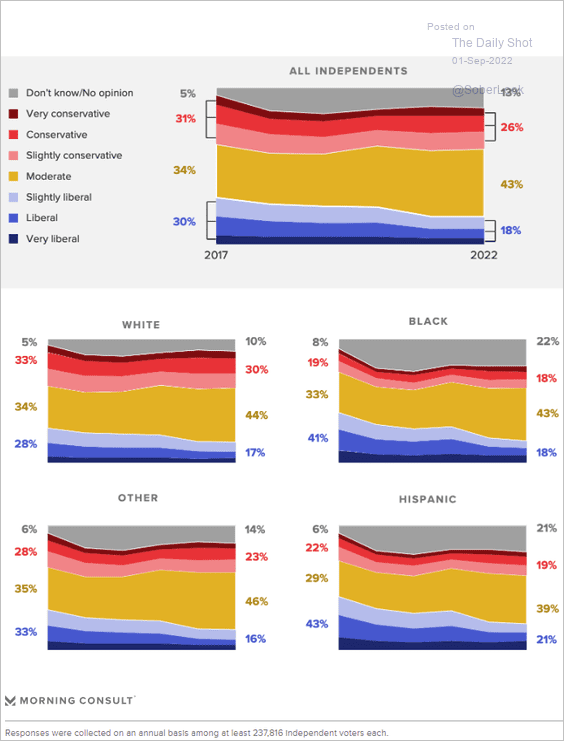 Source: Morning Consult Read full article
7. Online search volume for “pumpkin spice”:
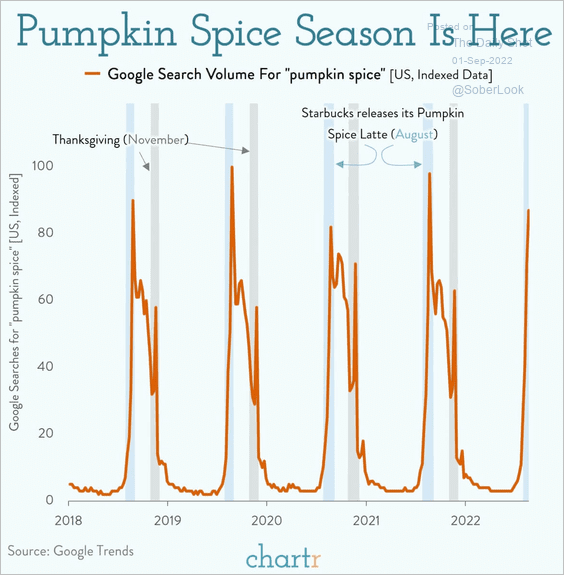 Source: @chartrdaily
——————–
As a reminder, the next Daily Shot will be published on Tuesday, September 6th.
Have a great weekend!
Back to Index