
The Daily Shot: 19-Sep-22
• The United States
• Canada
• The United Kingdom
• Europe
• Asia – Pacific
• China
• Emerging Markets
• Cryptocurrency
• Commodities
• Energy
• Equities
• Credit
• Rates
• Globval Developemnts
• Food for Thought
The United States
1. The U. Michigan consumer sentiment index edged higher this month as gasoline prices declined.
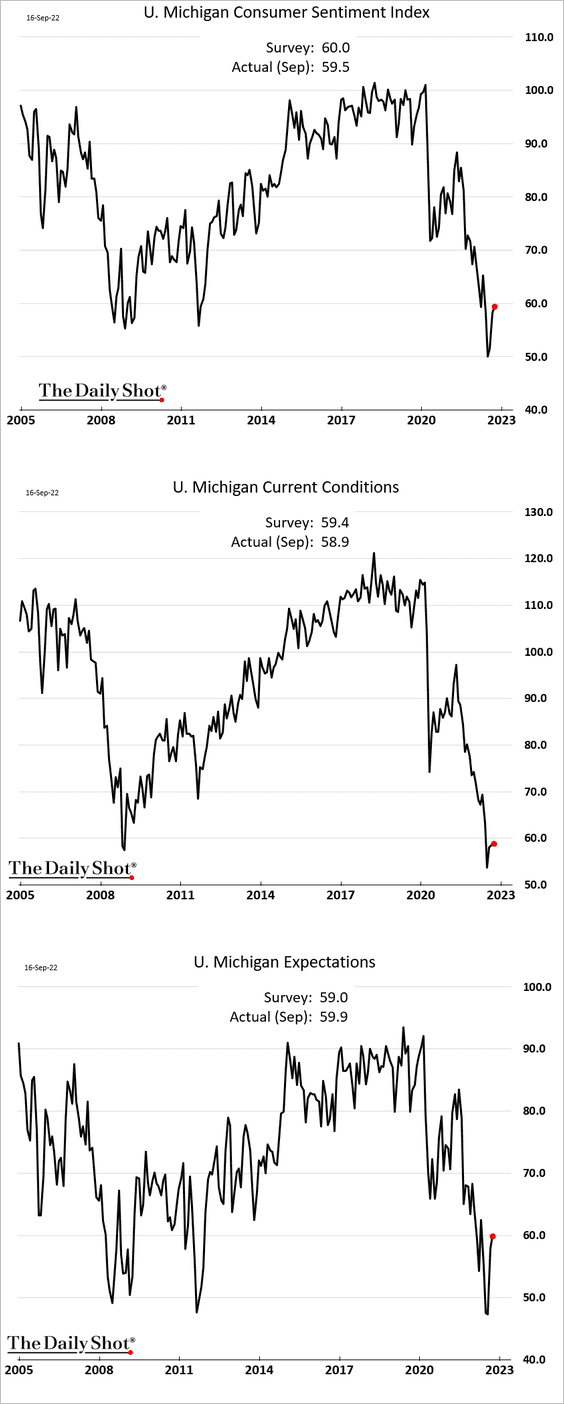
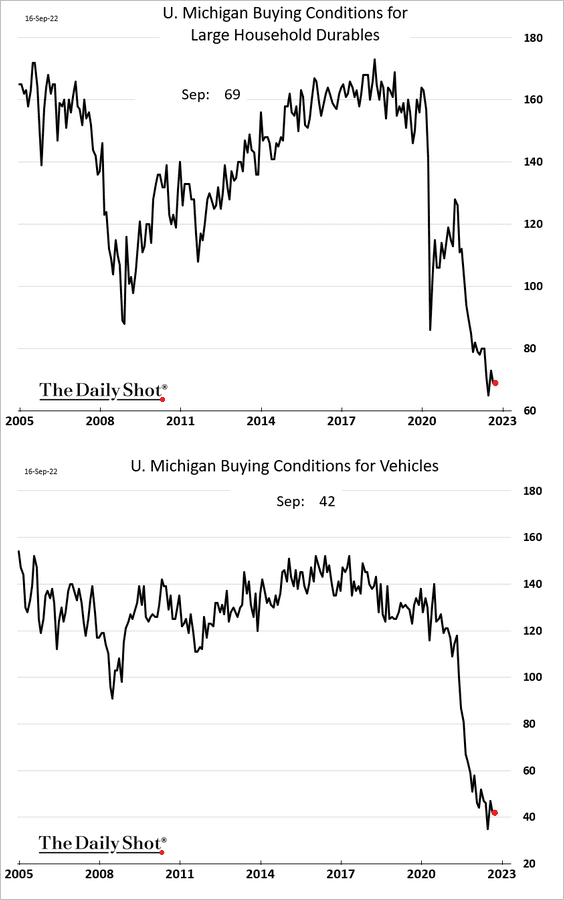
Buying conditions remain depressed.
——————–
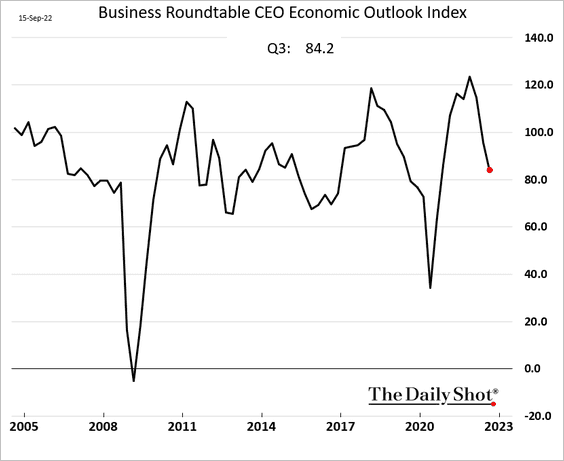
2. The Business Roundtable CEO sentiment survey is down this quarter.
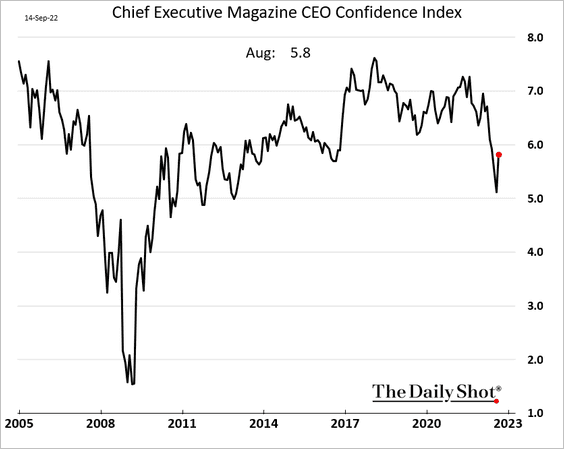
But the CEO Magazine confidence index showed an improvement last month.
——————–
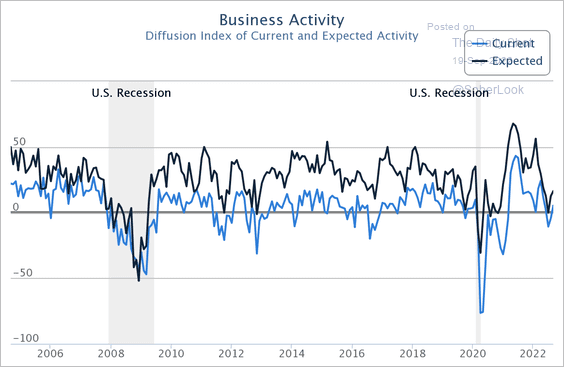
3. The NY Fed’s regional manufacturing index rebounded in September.
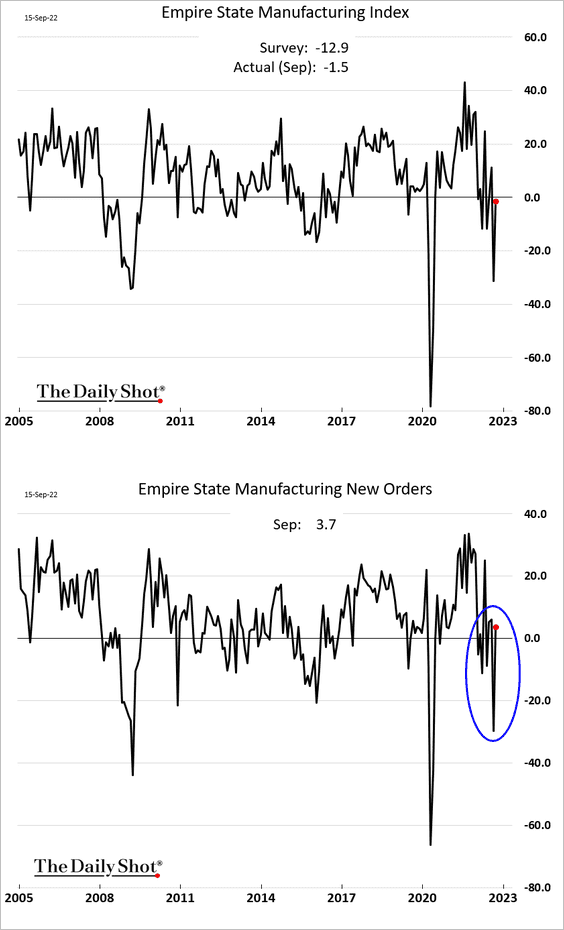
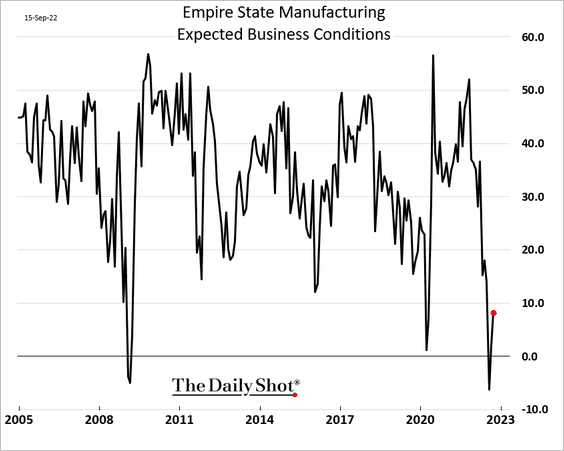
Expected business conditions are off the lows.
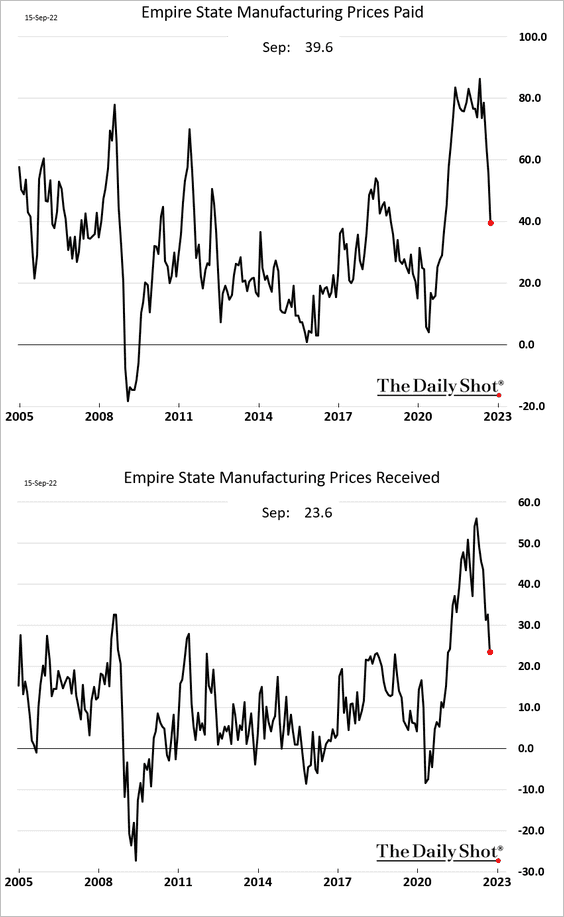
Price pressures are easing.
• The NY Fed’s service-sector index also showed a modest improvement.
 Source: Federal Reserve Bank of New York
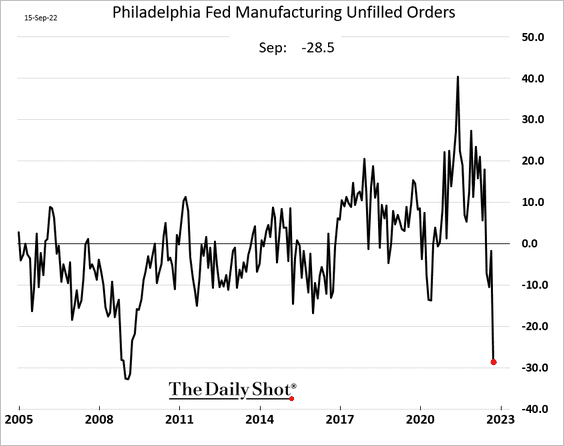
• On the other hand, the Philly Fed’s factory index declined.
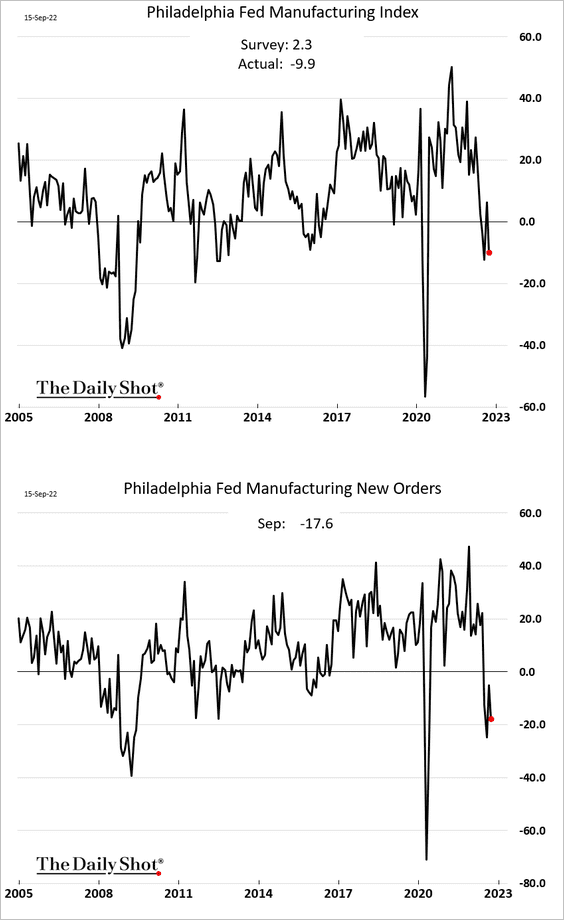
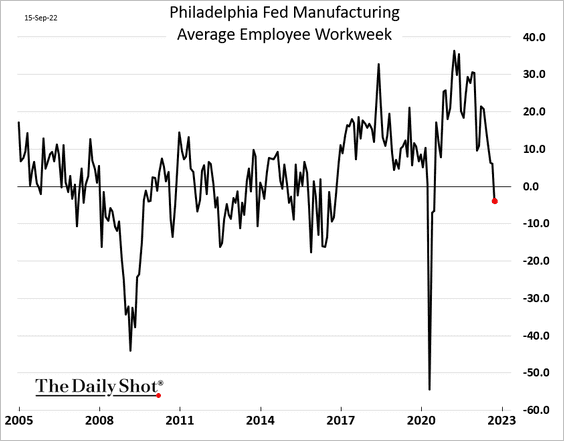
The average employee workweek indicator tumbled.
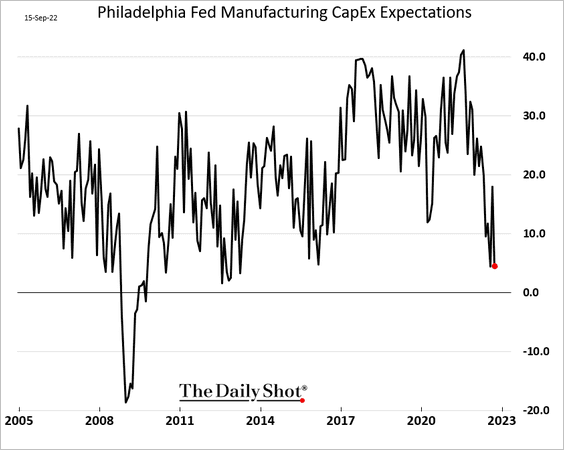
CapEx expectations are softer as well.
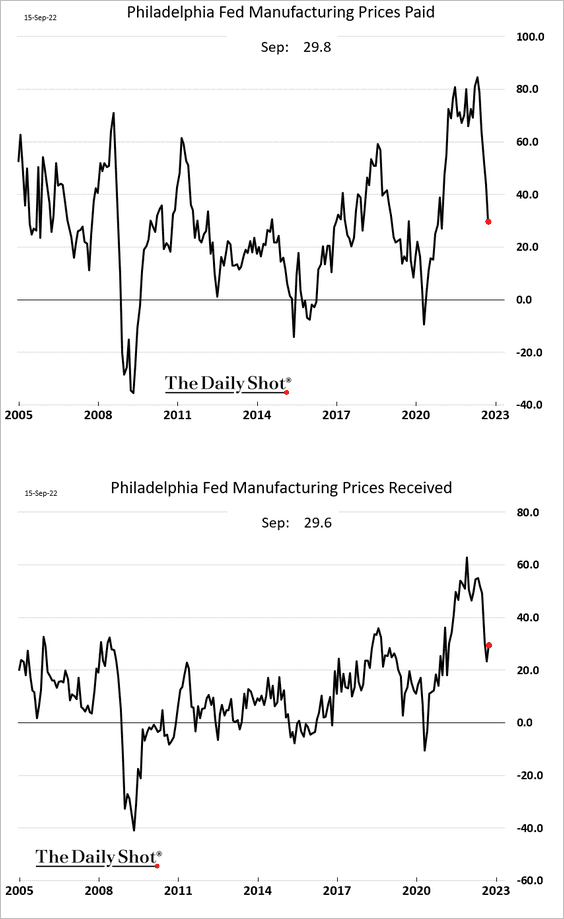
Supply pressures continue to ease.
– Prices:
– Unfilled orders:
– Delivery times:
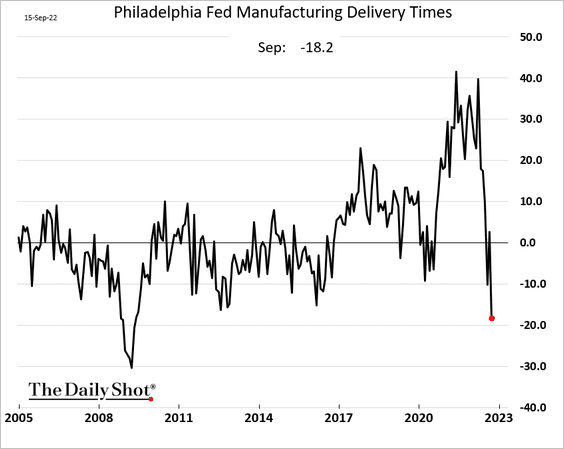
The Philly Fed’s index points to softer factory activity at the national level (2 charts).
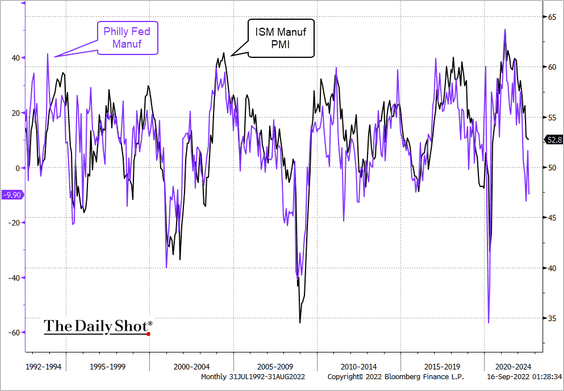 Source: @TheTerminal, Bloomberg Finance L.P.
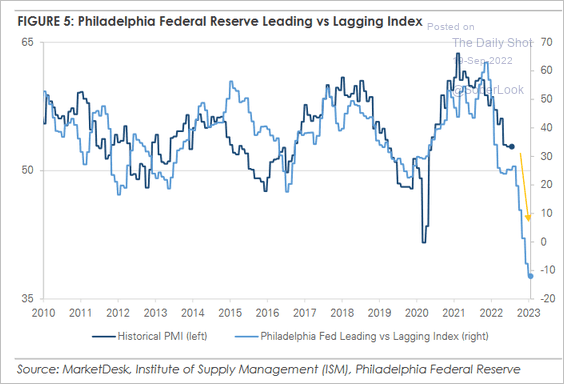 Source: MarketDesk Research
——————–
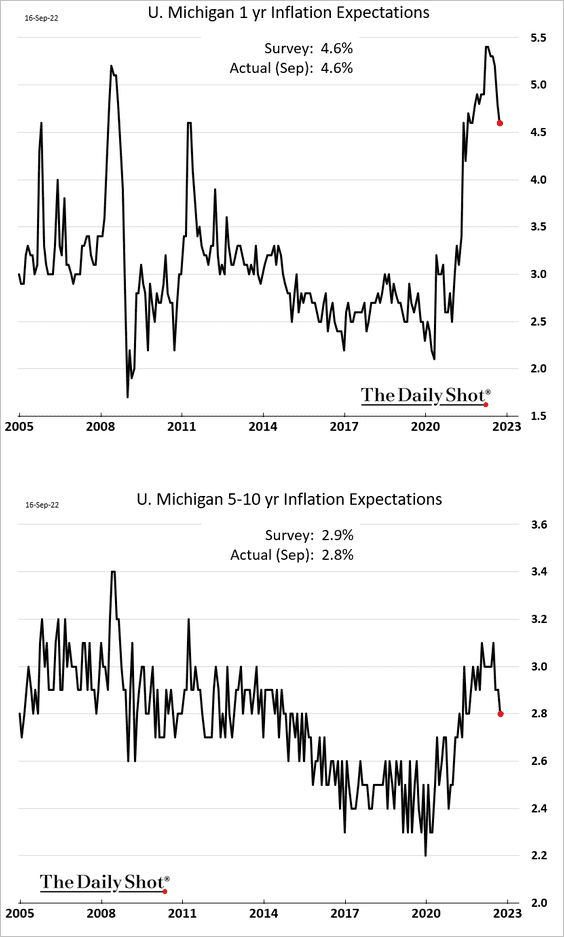
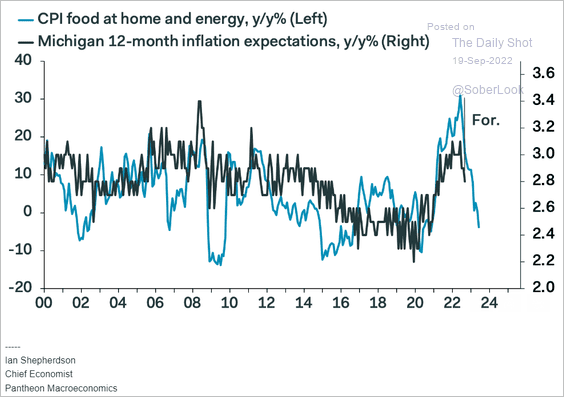
4. Next, we have some updates on inflation.
• The U. Michigan consumer inflation expectations continue to moderate.
 Source: Pantheon Macroeconomics
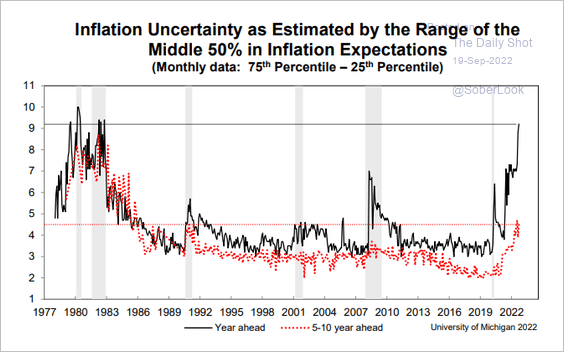
But inflation uncertainty keeps rising.
 Source: @GregDaco
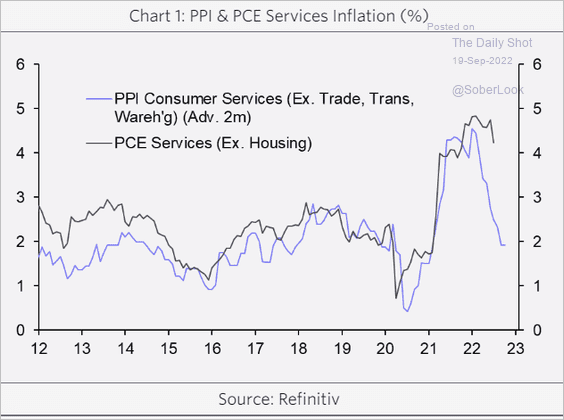
• Companies are still able to pass through higher costs (and some padding).
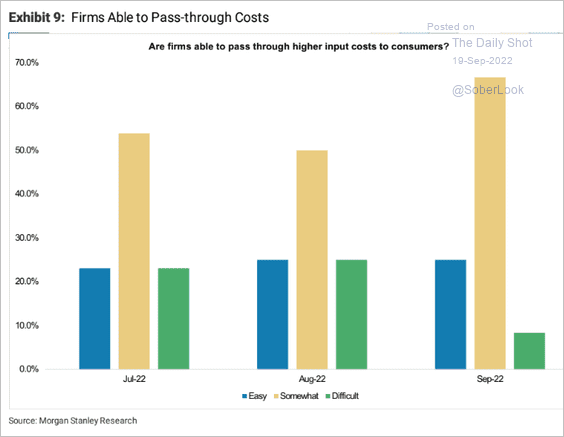 Source: Morgan Stanley Research
• Inflation on new cars should moderate as inventories and financing costs climb.
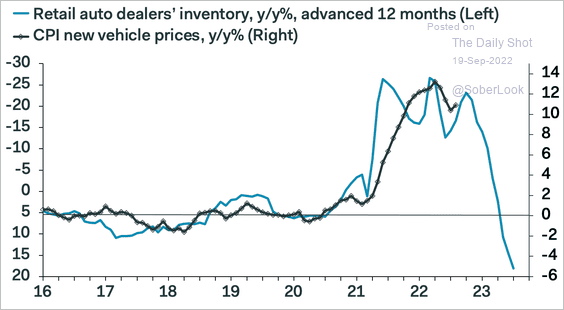 Source: Pantheon Macroeconomics
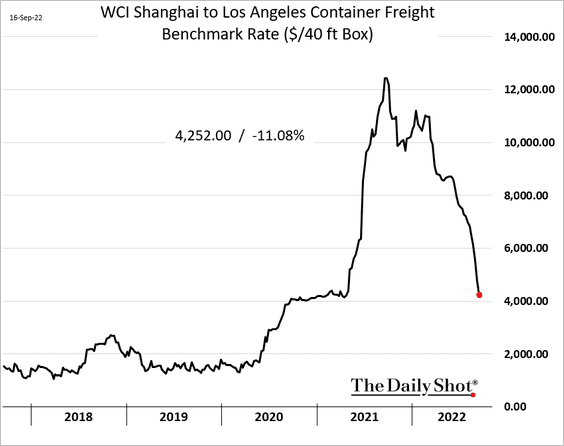
• Ocean freight shipping costs have been easing.
• Supply-constrained goods inflation continues to move lower.
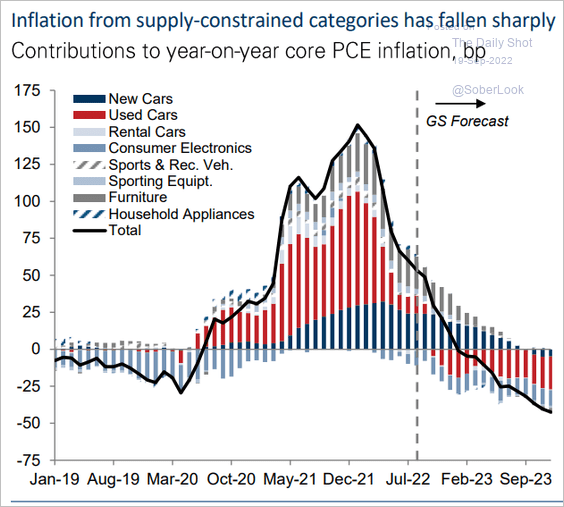 Source: Goldman Sachs
• Weaker demand should help ease inflationary pressures.
 Source: Capital Economics
——————–
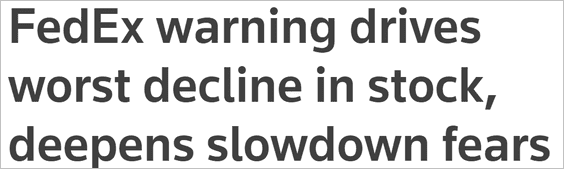
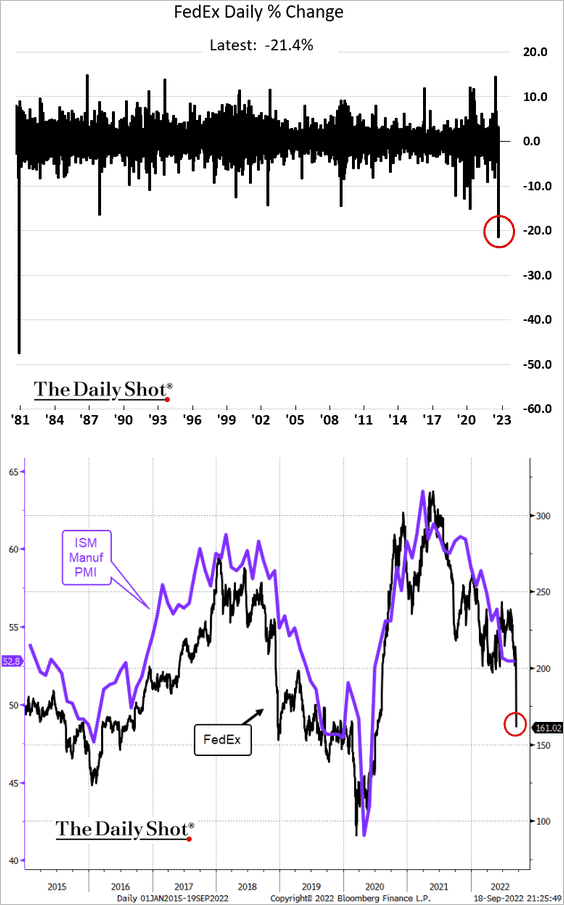
5. FedEx shares plummetted 21% on Friday. What does that tell us about the economy?
 Source: Reuters Read full article
 Source: @TheTerminal, Bloomberg Finance L.P.
——————–
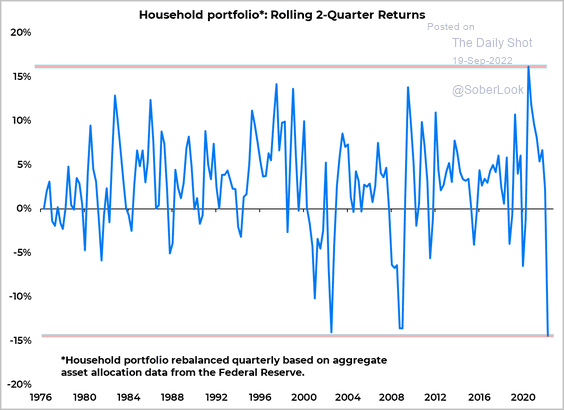
6. Household portfolios are down sharply this year.
 Source: All Star Charts
Back to Index
Canada
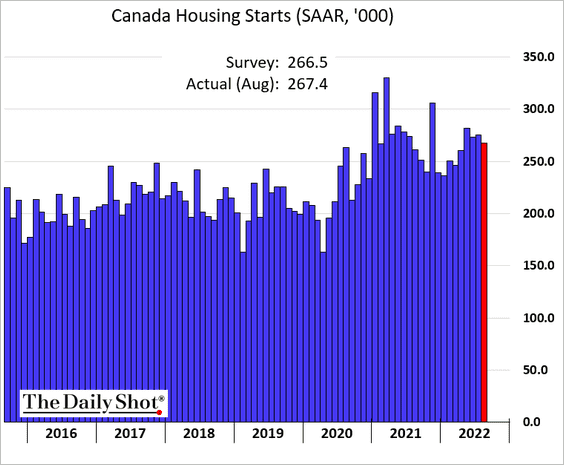
1. Housing starts remain well above pre-COVID levels.
2. Oxford Economics sees a 30% decline in home prices from the peak.
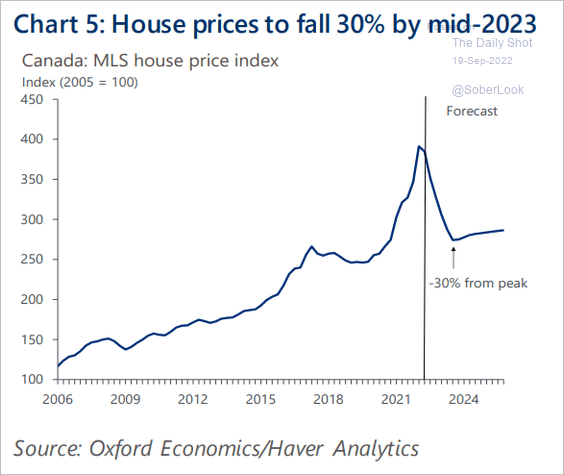 Source: Oxford Economics
3. Corporate interest-coverage ratios are approaching all-time highs. However, the resource sector has not yet experienced the burden of higher interest rates because of high commodity prices, according to PGM Global.
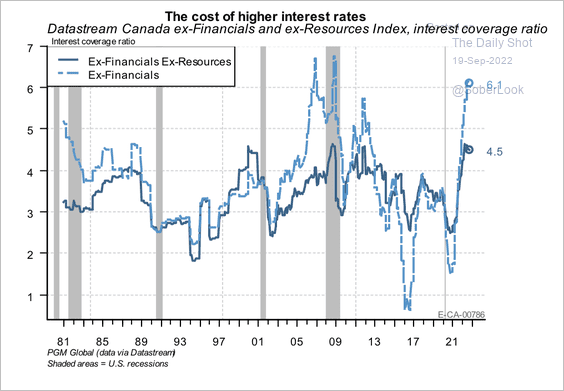 Source: PGM Global
Canada’s corporate leverage is higher than in most other developed markets.
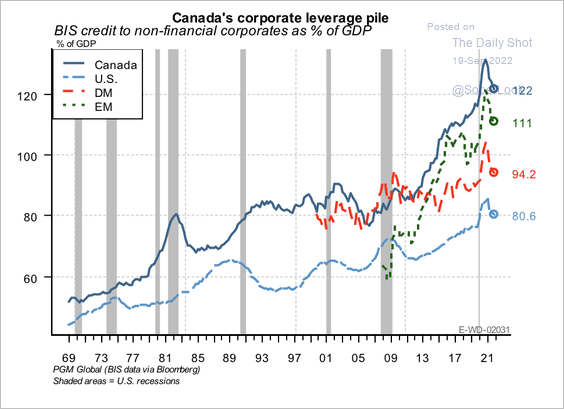 Source: PGM Global
Back to Index
The United Kingdom
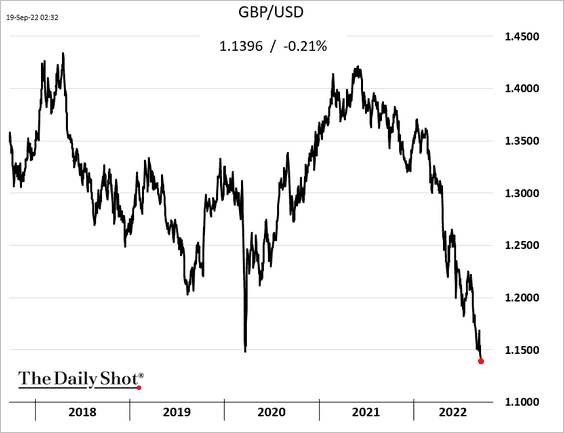
1. The pound continues to drift lower.
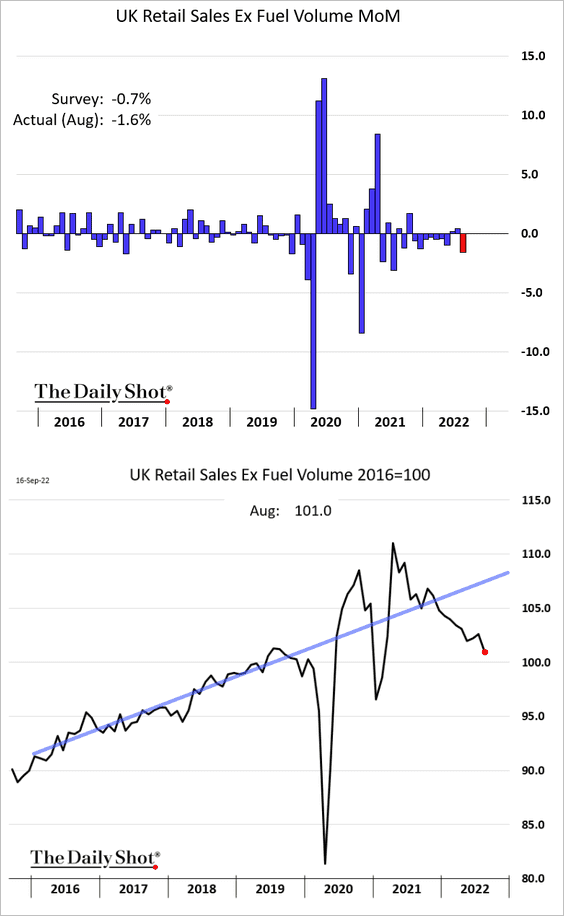
2. August retail sales surprised to the downside.
3. UK natural gas storage is very low compared to the EU.
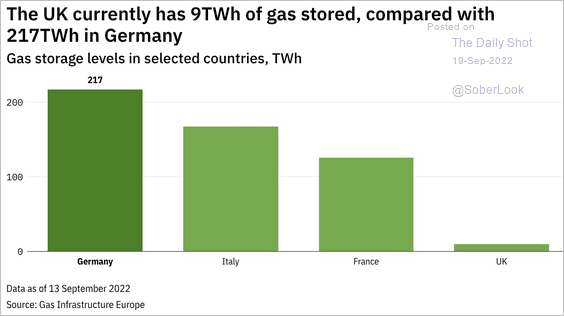 Source: @janrosenow Read full article
Back to Index
Europe
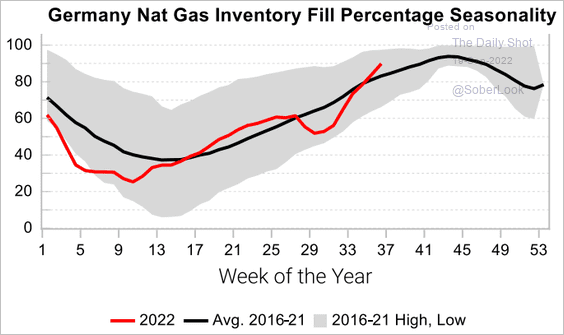
1. Germany’s natural gas inventories continue to climb.
 Source: Variant Perception
Germany took control of PCK Schwedt, a major Russian-owned oil refinery.
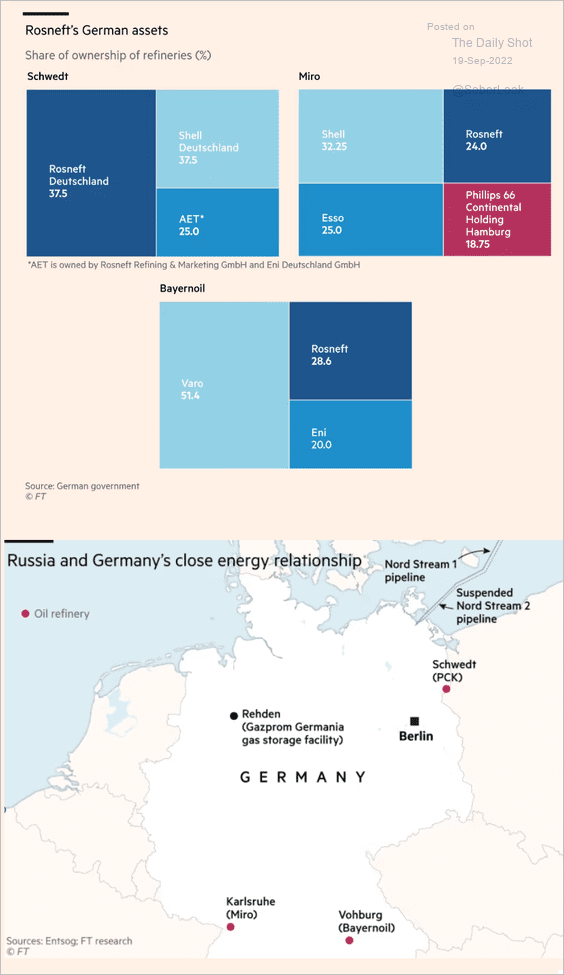 Source: @financialtimes Read full article Further reading
——————–
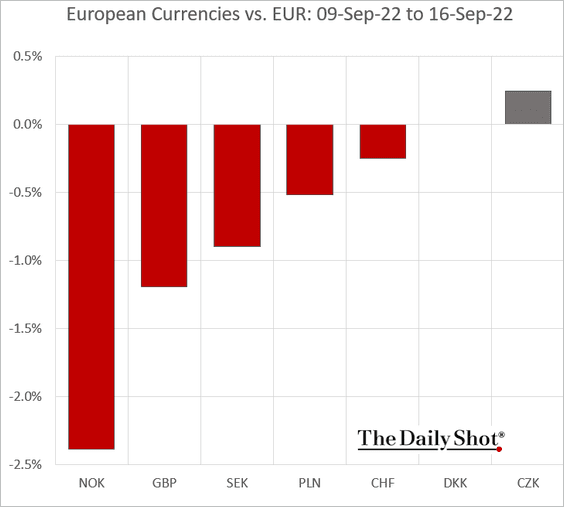
2. The Norwegian krone underperformed last week.
3. Sweden’s inflation continues to exceed Riksbank’s forecasts.
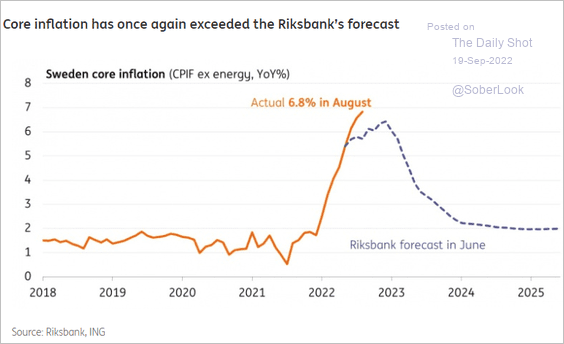 Source: ING
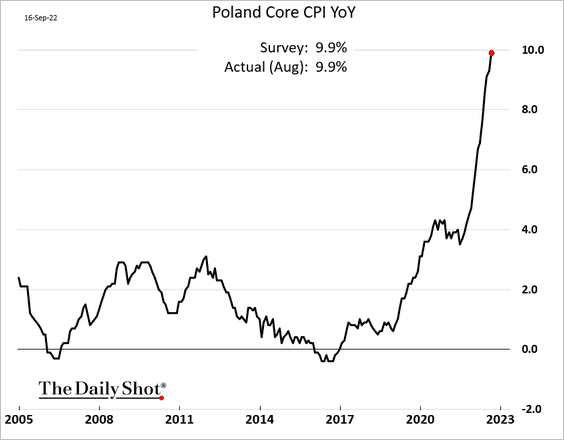
4. Poland’s core CPI is nearing 10%.
5. This chart shows EU commercial flights vs. pre-COVID levels.
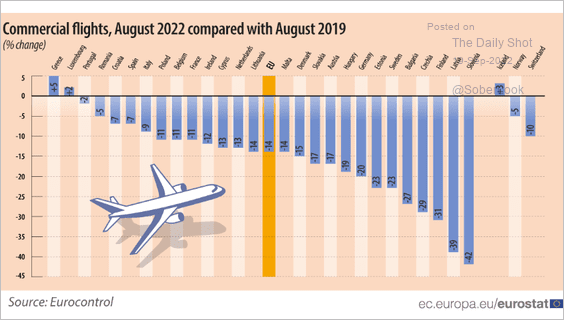 Source: Eurostat Read full article
Back to Index
Asia – Pacific
1. The yen’s weakness is boosting Japan’s energy import costs but is not helping much with exports.
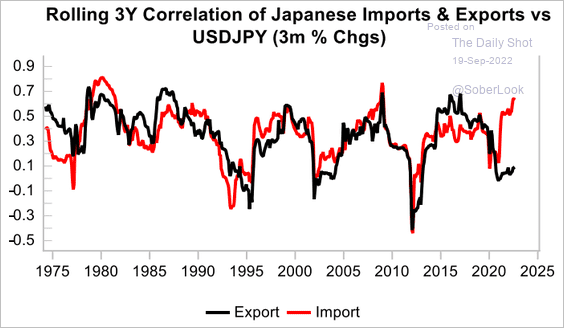 Source: Variant Perception
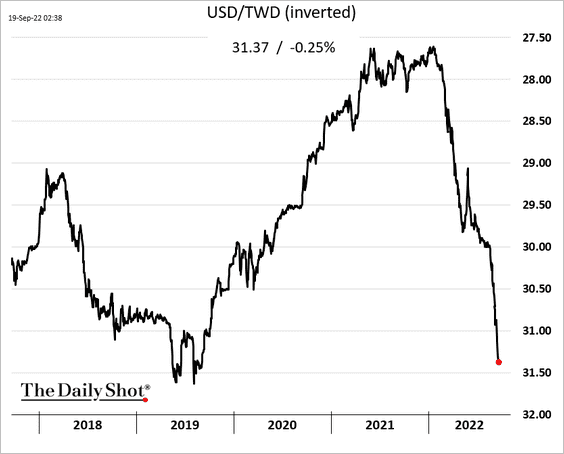
2. The Taiwan dollar continues to weaken vs. USD.
Back to Index
China
1. The PBoC is still attempting to strengthen the renminbi.
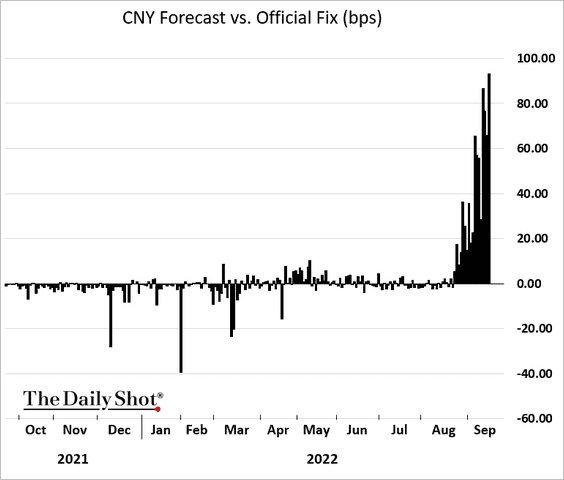
For now, the renminbi’s decline has been mostly against the dollar.
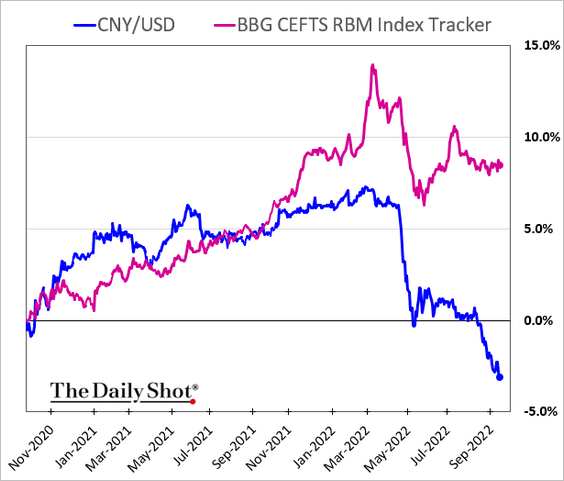 Source: Bloomberg
——————–
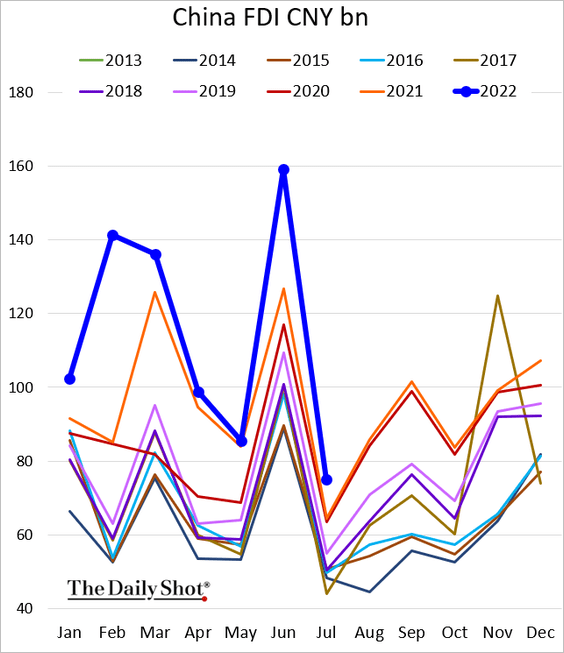
2. Foreign direct investment remains robust (a multi-year high for this time of the year).
3. China’s oil demand has fallen below its long-term trend.
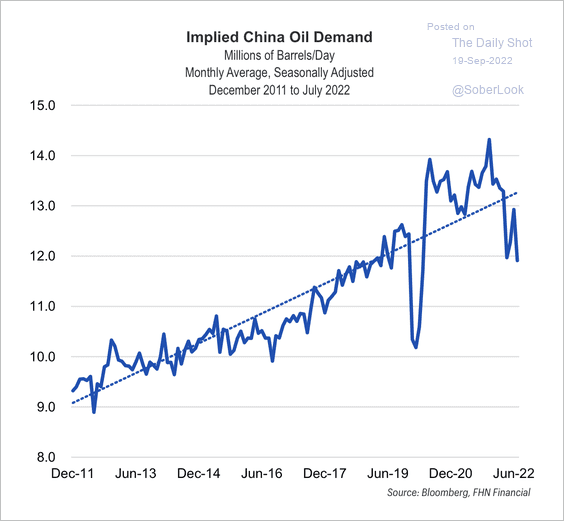 Source: FHN Financial
4. The output of building materials is still trending down.
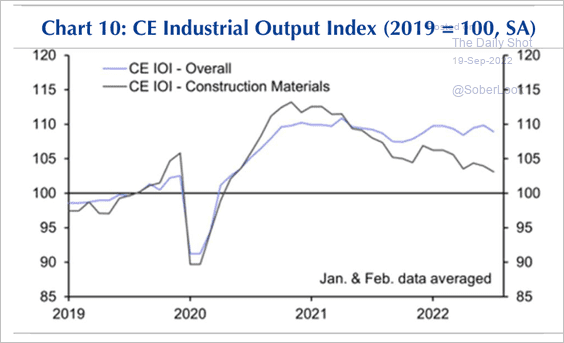 Source: Capital Economics
5. COVID remains a headwind for economic growth.
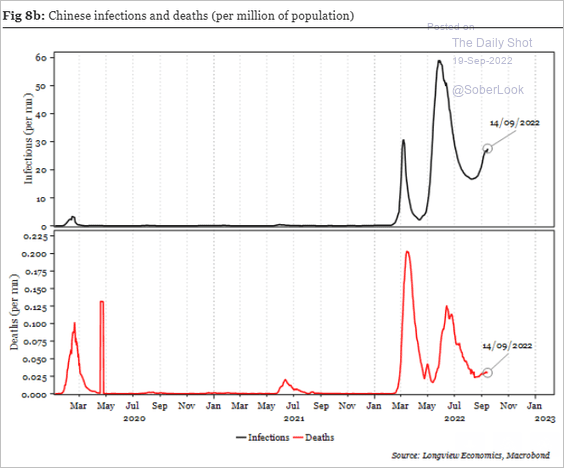 Source: Longview Economics
Back to Index
Emerging Markets
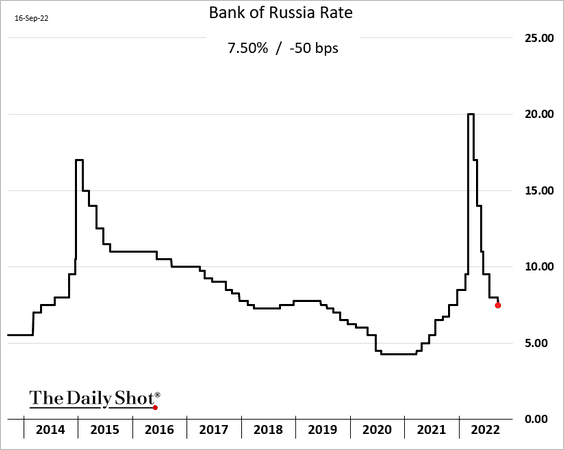
1. Russia’s central bank cut rates again.
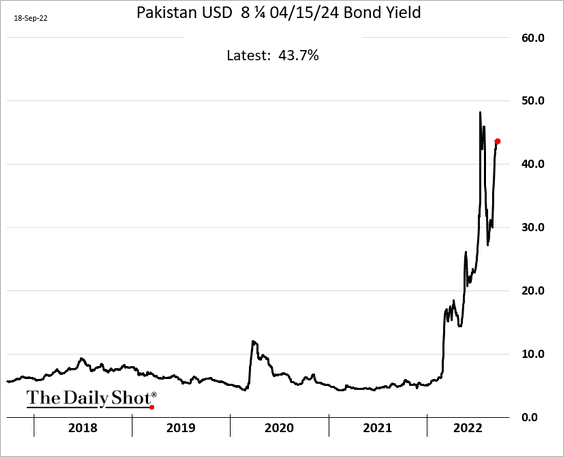
2. Pakistan will “absolutely not” default on its debt.
 Source: Reuters Read full article
 Source: Bloomberg
——————–
3. This chart shows EM sovereign spreads vs. ratings.
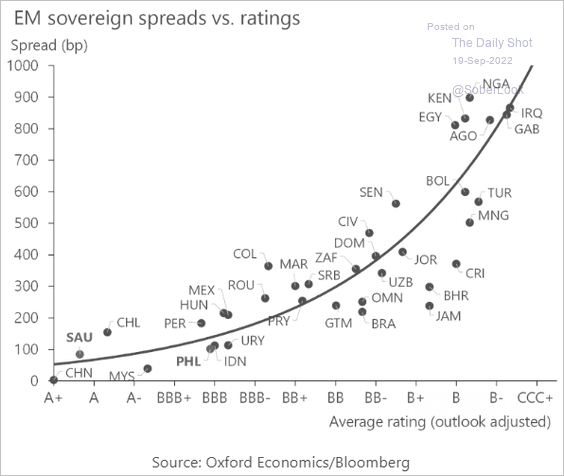 Source: Oxford Economics
And here are the debt-to-GDP ratios.
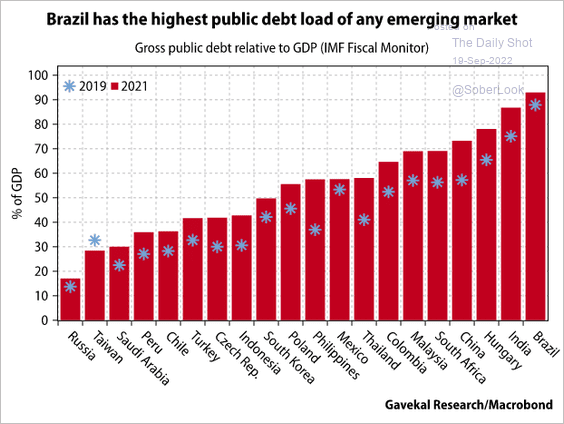 Source: Gavekal Research
——————–
4. EM stocks remain under pressure.
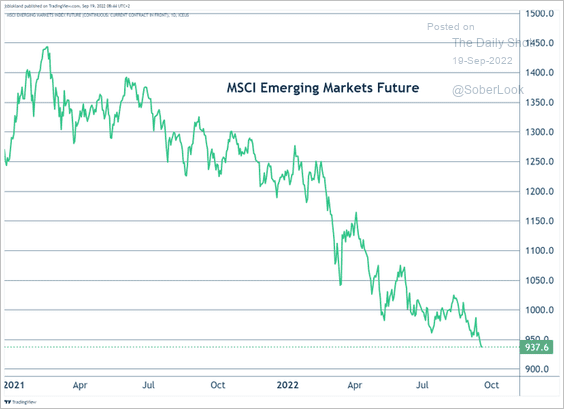 Source: @true_insights_
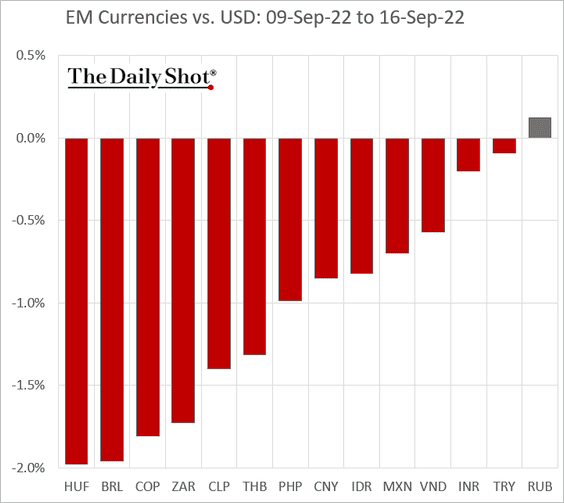
5. Next, we have some performance data from last week.
• Currencies:
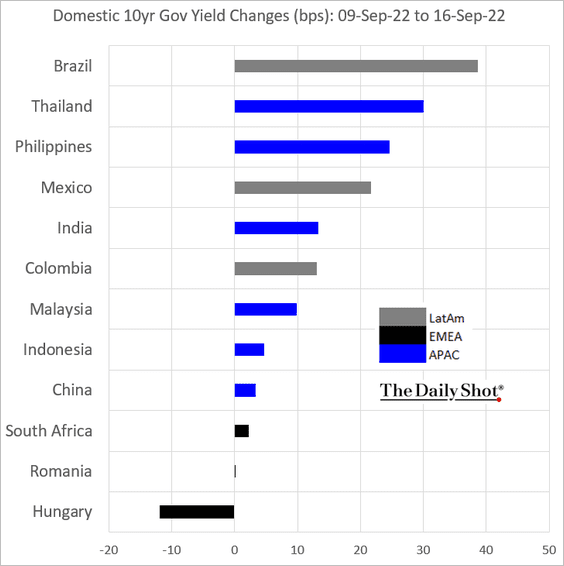
• Bond yields:
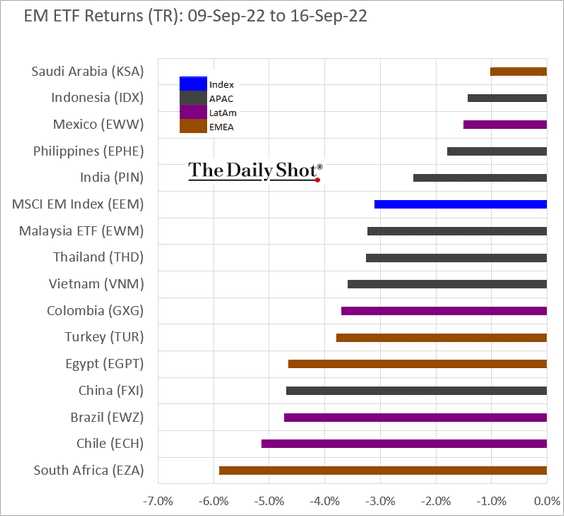
• Equity ETFs:
Back to Index
Cryptocurrency
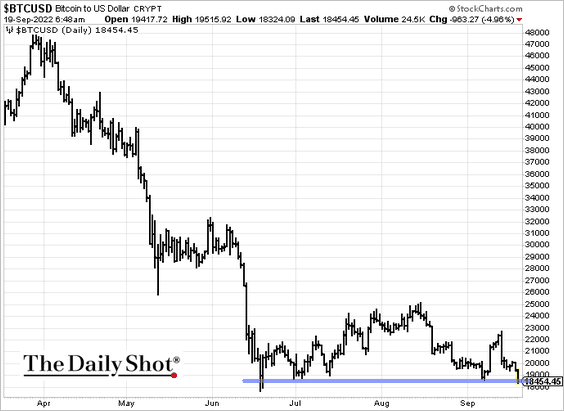
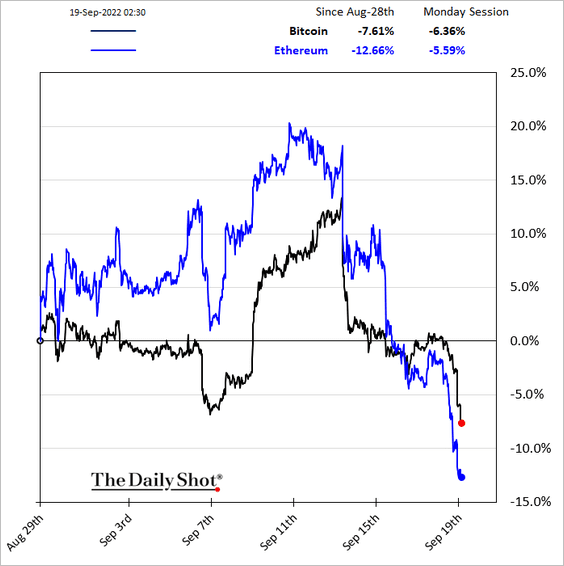
1. Bitcoin is back below $19k as cryptos drop with stocks.
——————–
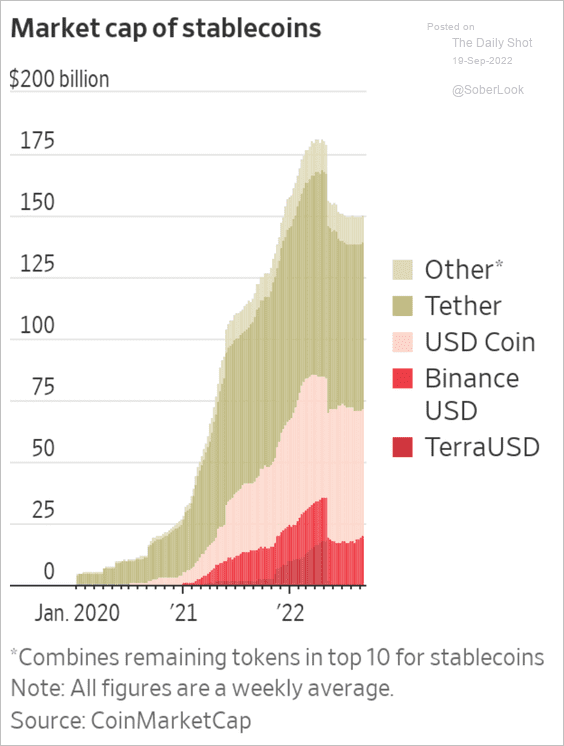
2. Here is the market cap of major stablecoins.
 Source: @WSJ Read full article
Back to Index
Commodities
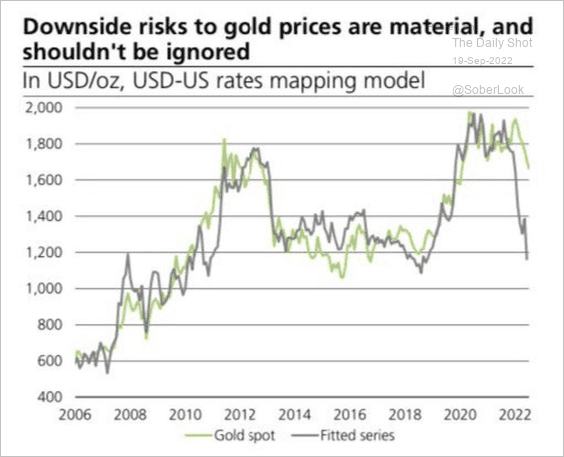
1. The US dollar rally and surging real yields point to downside risks for gold.
 Source: UBS; @MichaelAArouet
2. Will Putin shut off Ukrainian grain exports?
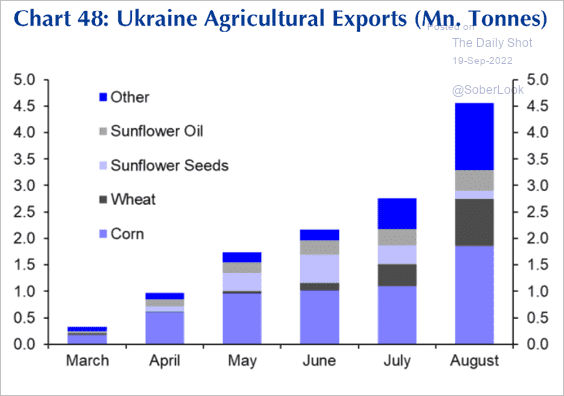 Source: Capital Economics
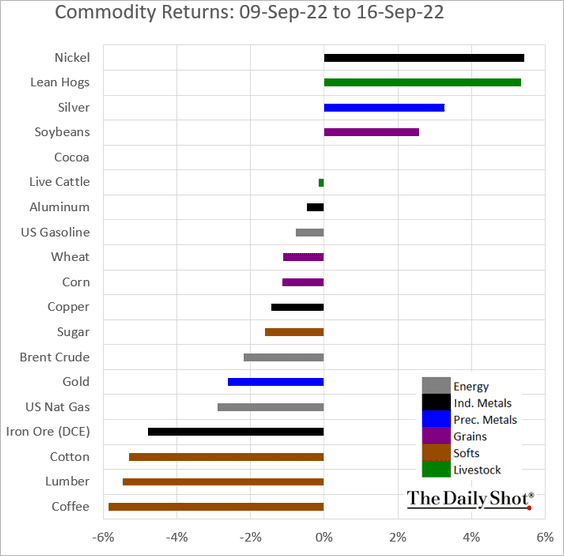
3. Here is last week’s performance across key commodity markets.
Back to Index
Energy
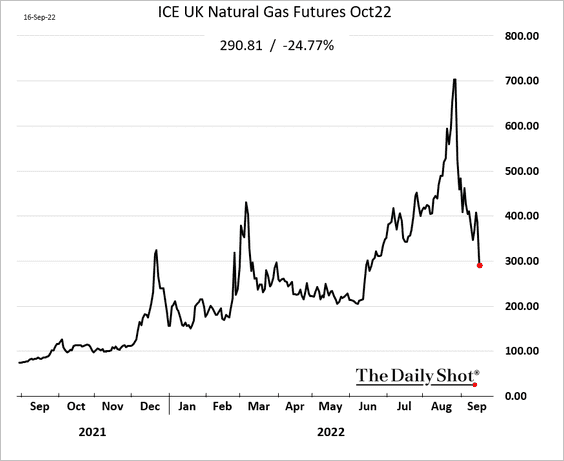
1. European natural gas futures continue to fall.
2. Here is a forecast for Russian natural gas sales from Barclays.
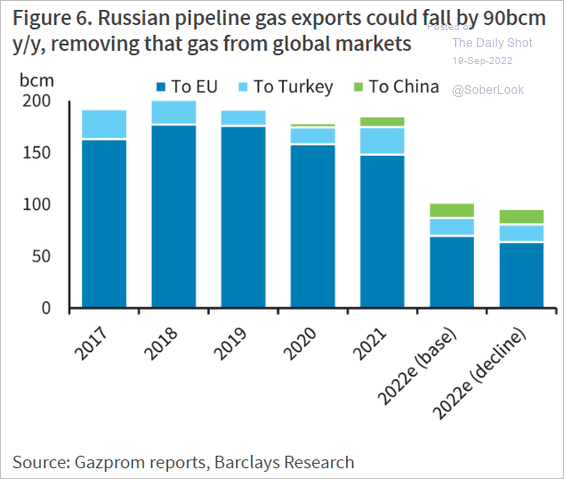 Source: Barclays Research
3. Goldman sees crude oil prices surging to $130/bbl next year.
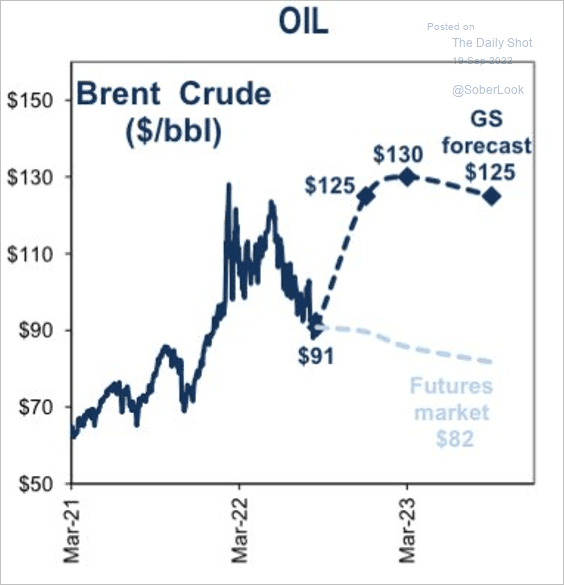 Source: Goldman Sachs; @WallStJesus
4. European oil demand will slow with industrial output.
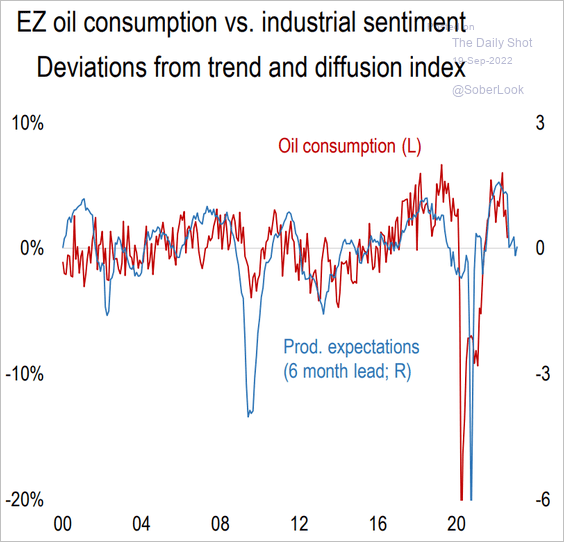 Source: Numera Analytics
5. This chart shows US renewables electricity generation.
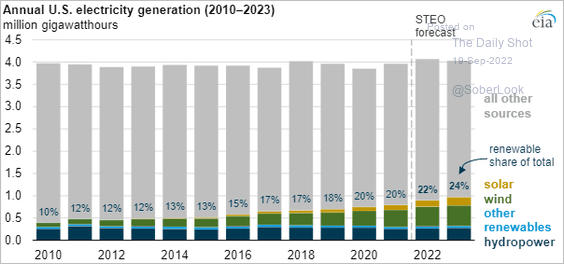 Source: @EIAgov Read full article
Back to Index
Equities
1. Let’s start with Deutsche Bank’s total positioning indicator.
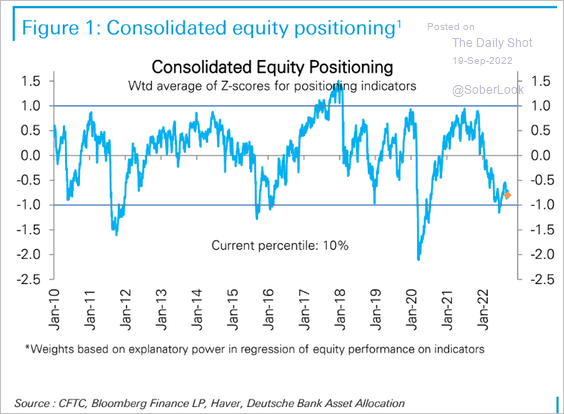 Source: Deutsche Bank Research
And here is the aggregate futures positioning.
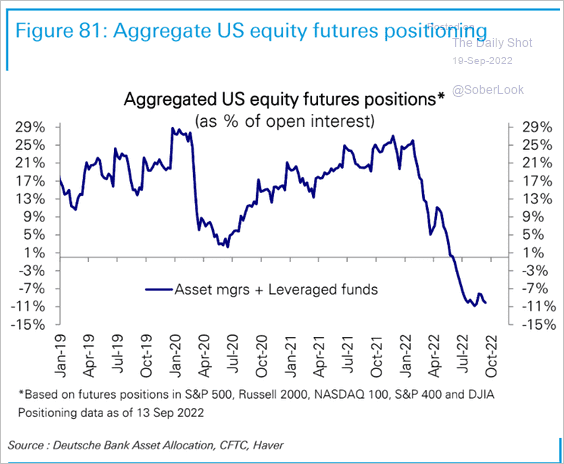 Source: Deutsche Bank Research
——————–
2. A more severe market decline would not be unusual in a recession scenario.
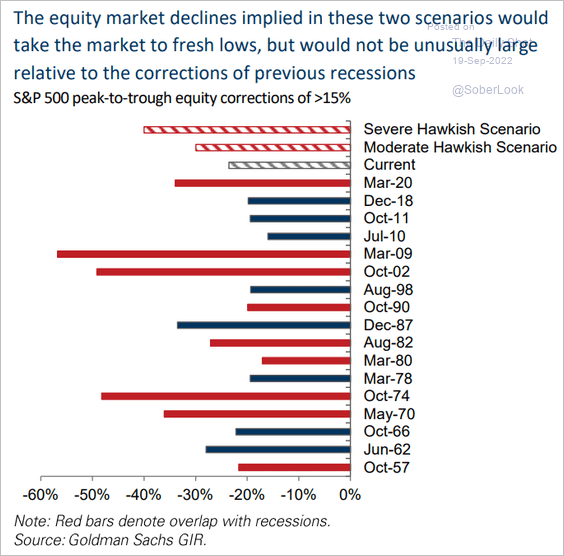 Source: Goldman Sachs
3. Here is a look at bear-market rallies.
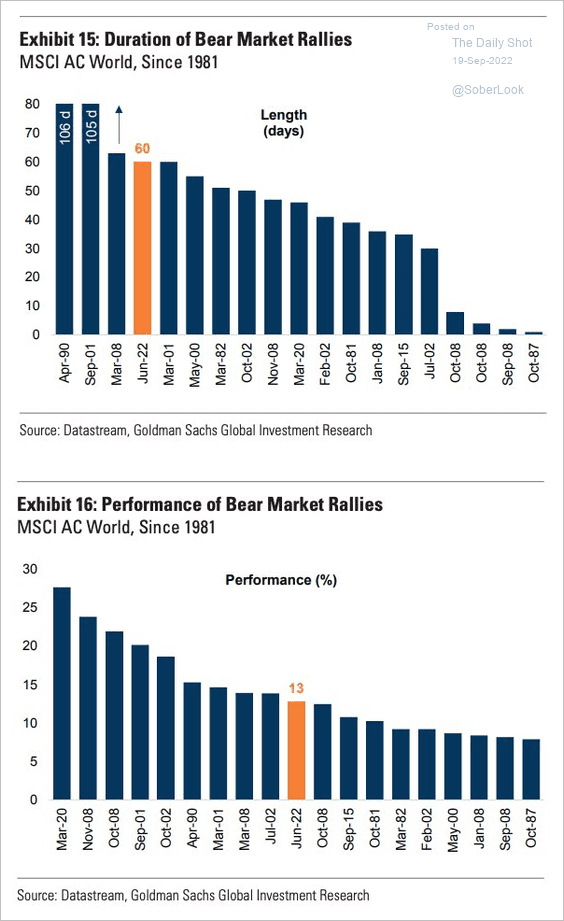 Source: Goldman Sachs; @QCompounding
4. Goldman sees a market rebound by the end of the year.
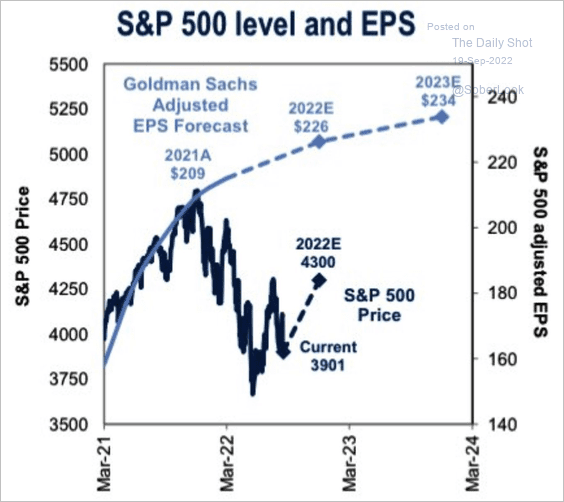 Source: Goldman Sachs; @MichaelAArouet
5. The Invesco S&P 500 High Beta ETF(SPHB) is holding support from its June low relative to the Low Volatility ETF (SPLV).
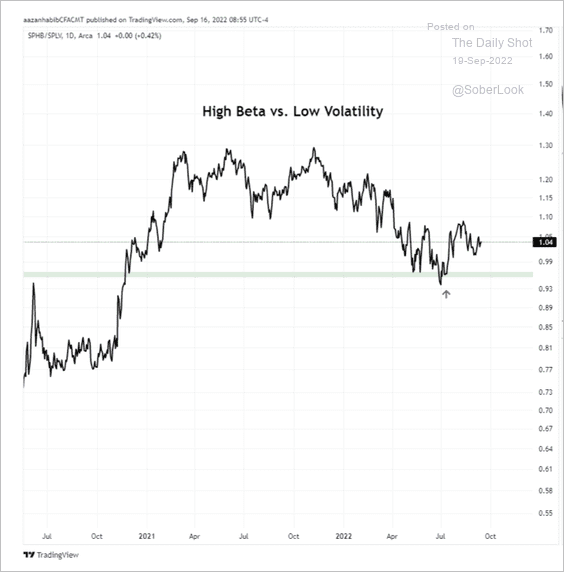 Source: Aazan Habib, Paradigm Capital
6. The market is pricing in further declines in earnings growth.
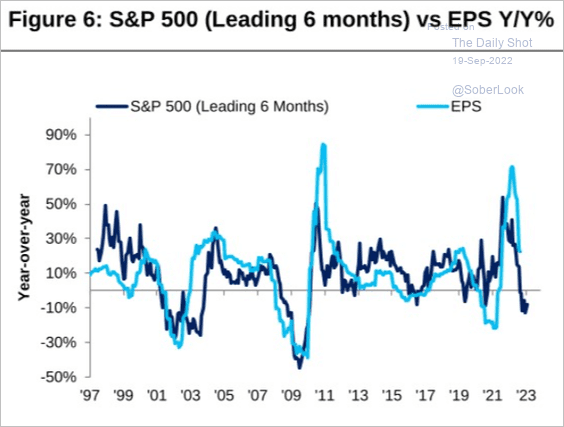 Source: Citi Private Bank
7. Here are the buy/sell ratings by sector.
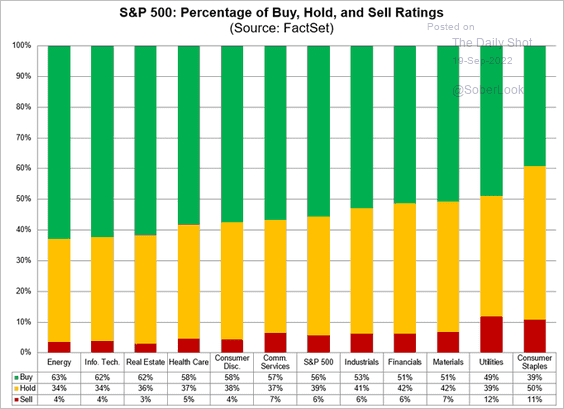 Source: @FactSet Read full article
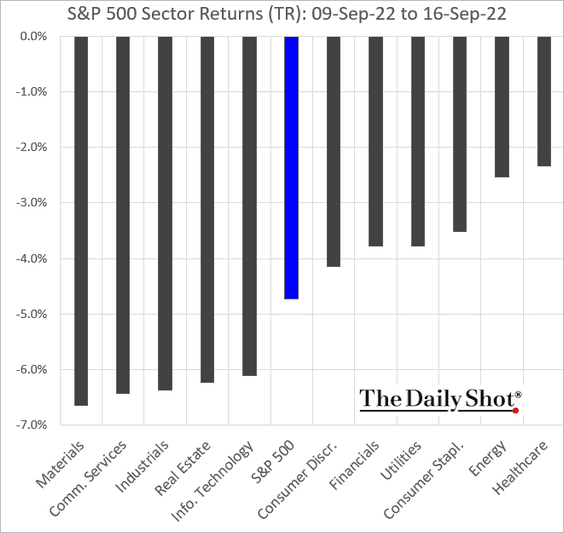
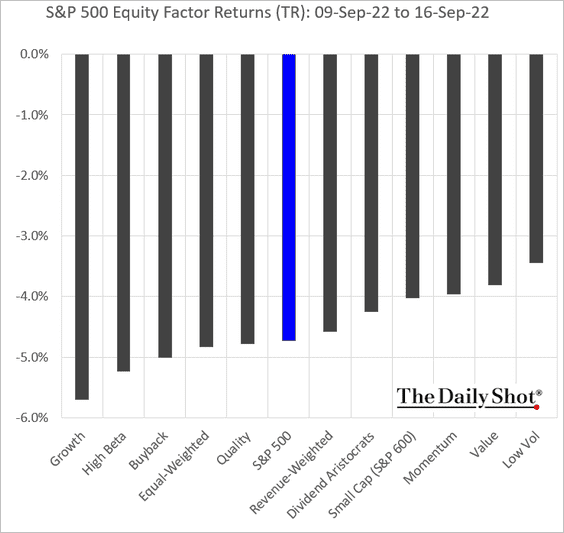
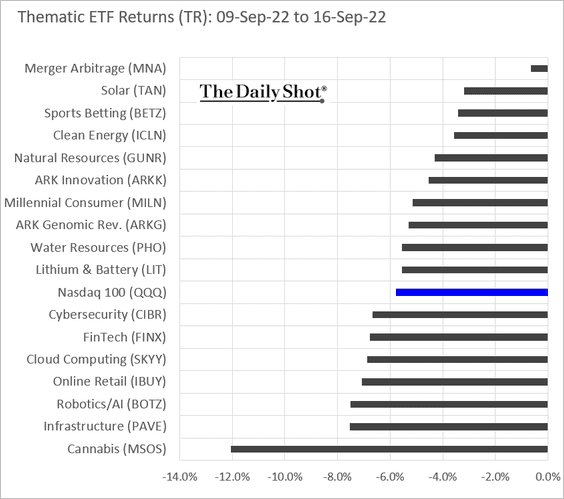
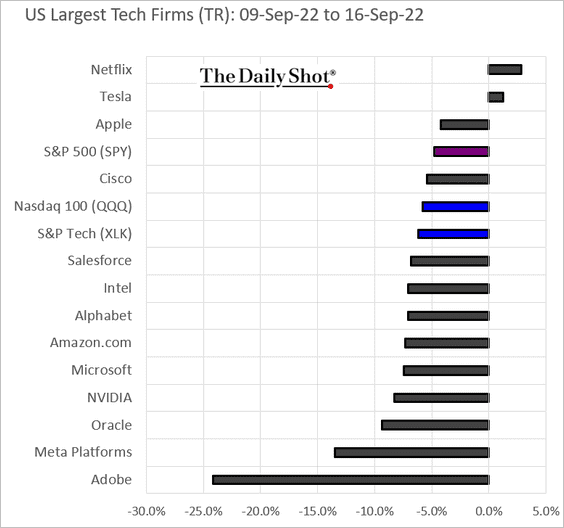
8. Next, we have last week’s performance data.
• Sectors:
• Equity factors:
• Thematic ETFs:
• Largest US tech firms:
——————–
9. Tighter liquidity will be a headwind for speculative assets.
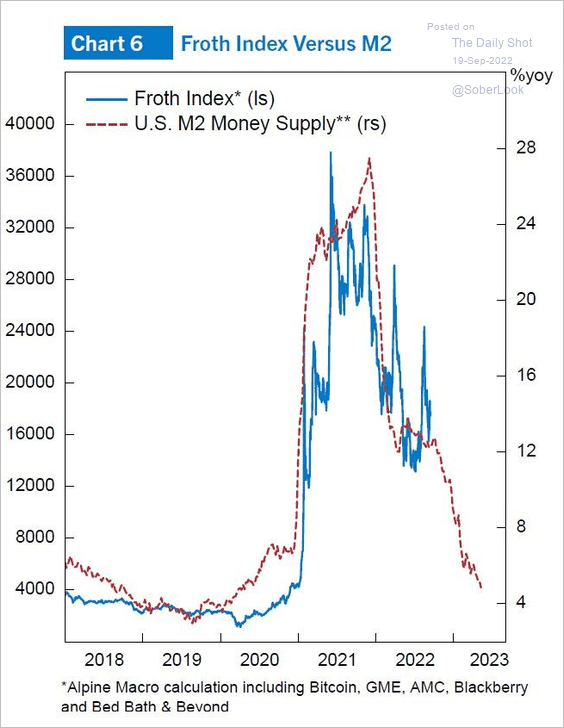 Source: Alpine Macro
10. What returns are needed to get back to peak levels on the S&P 500?
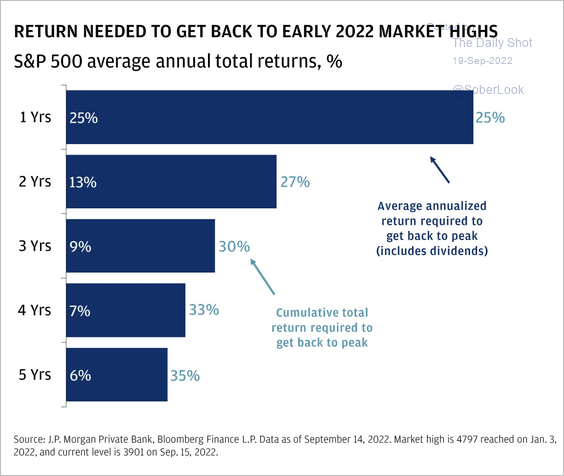 Source: J.P. Morgan Asset Management
Back to Index
Credit
1. US investment-grade debt has been outperforming Treasuries, …
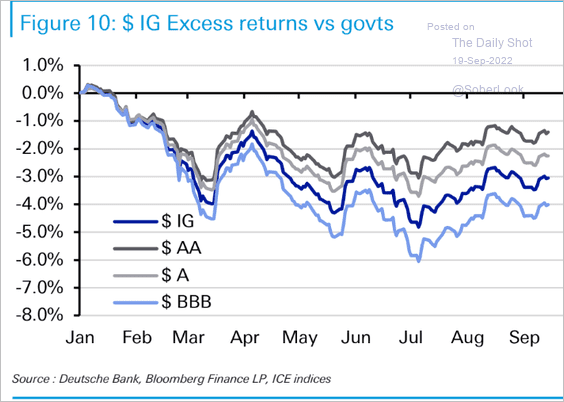 Source: Deutsche Bank Research
… amid fund inflows.
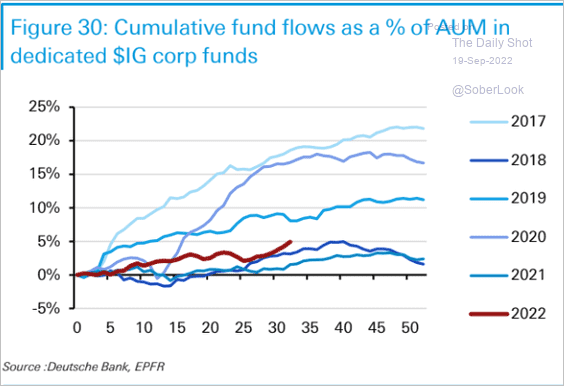 Source: Deutsche Bank Research
——————–
2. MBS spreads have been widening.
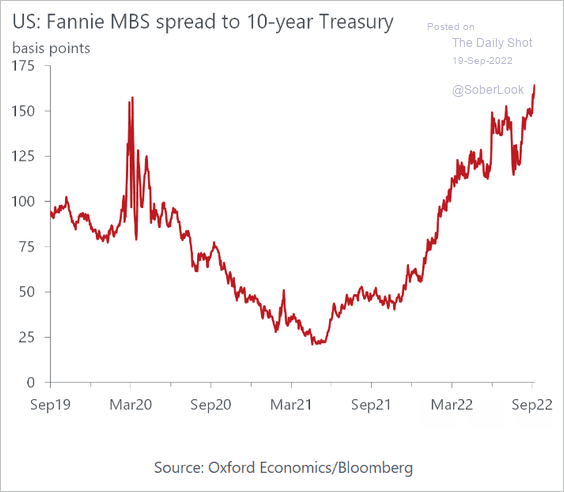 Source: Oxford Economics
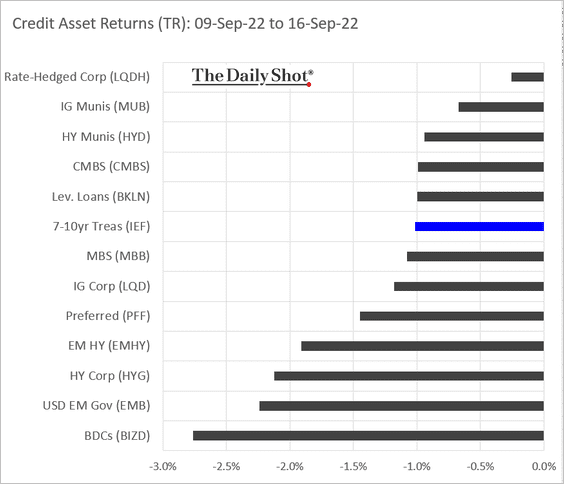
3. Here is last week’s performance by asset class.
Back to Index
Rates
1. Speculative accounts have been boosting their bets against Treasuries.

Are Treasuries oversold?
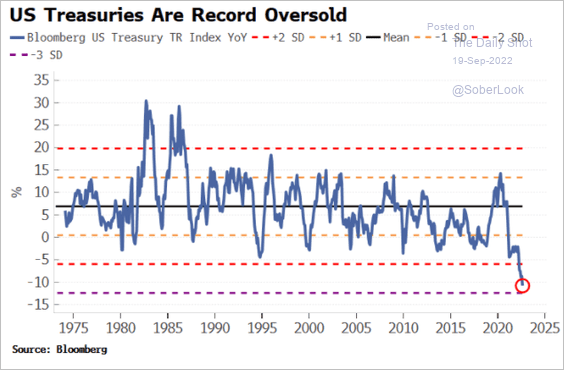 Source: Simon White, Bloomberg Markets Live Blog
——————–
2. Liquidity is drying up, but conditions are not severe compared with 2020.
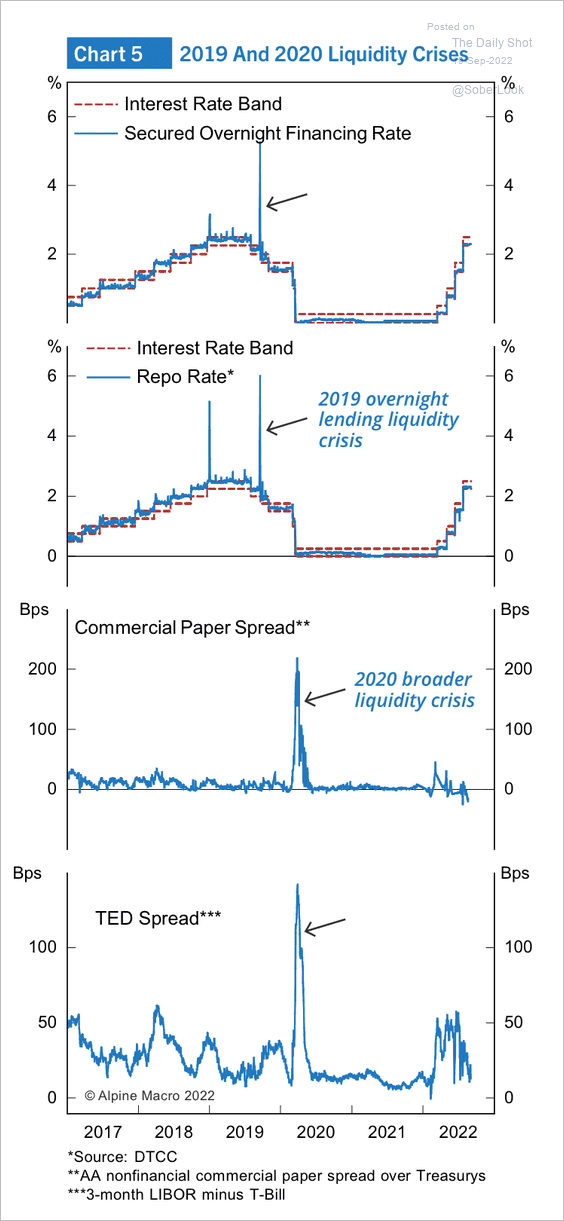 Source: Alpine Macro
3. The Treasury curve continues to move deeper into inversion territory. Here is the 30yr – 5yr spread.
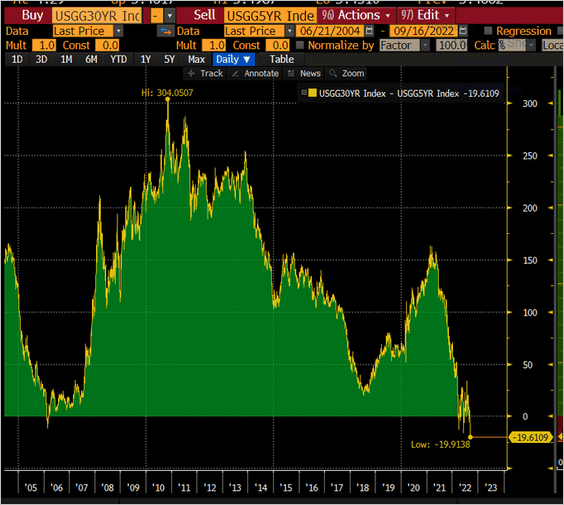 Source: @lisaabramowicz1
4. The 10-year TIPS yield (real rates) is above 1%.
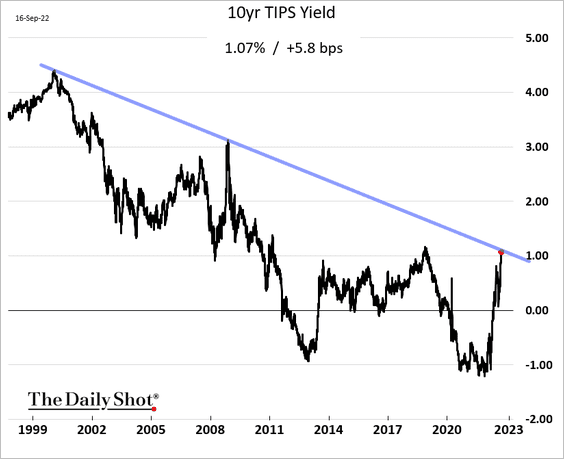 h/t Evercore ISI Research
5. Who are the holders of Treasury securities?
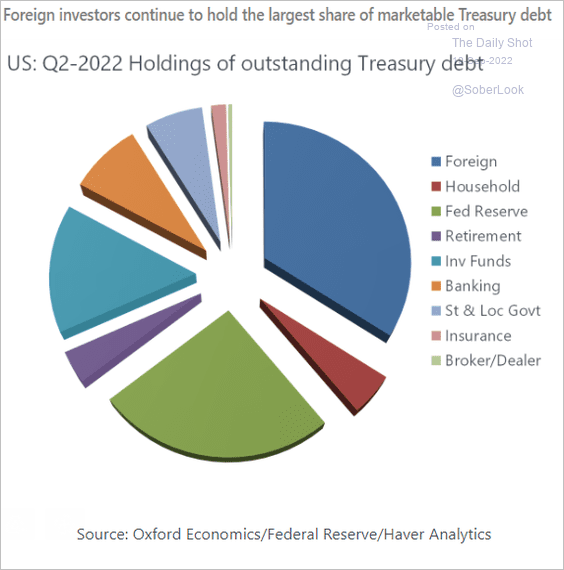 Source: Oxford Economics
6. The market-implied terminal rate (maximum rate in the current Fed hiking cycle) continues to climb.
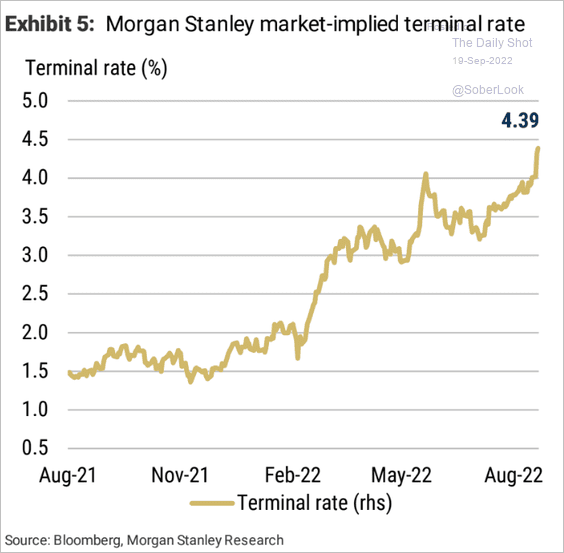 Source: Morgan Stanley Research
Back to Index
Globval Developemnts
1. There has been a strong negative correlation between the dollar and a 60% equity/40% bond portfolio this year. The greenback has been a safe-haven asset.
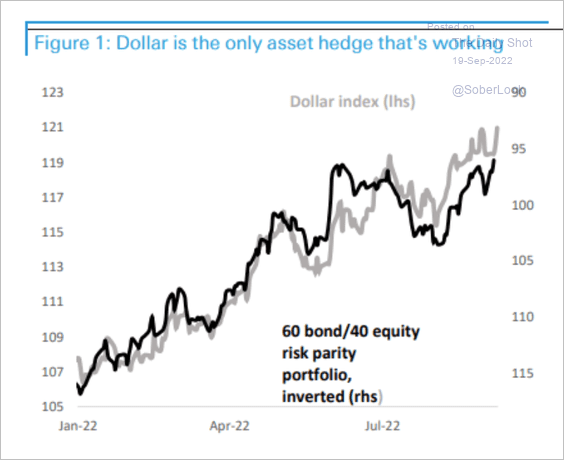 Source: Deutsche Bank Research
The US dollar is increasingly overvalued.
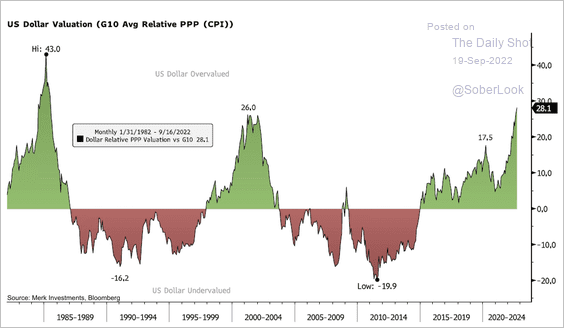 Source: @nicholastreece
——————–
2. Frankfurt’s airfreight volume points to falling corporate margins.
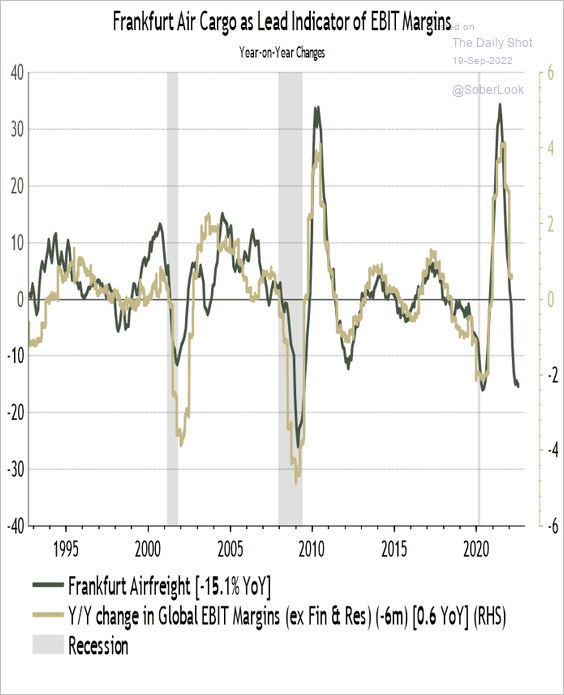 Source: @IanRHarnett
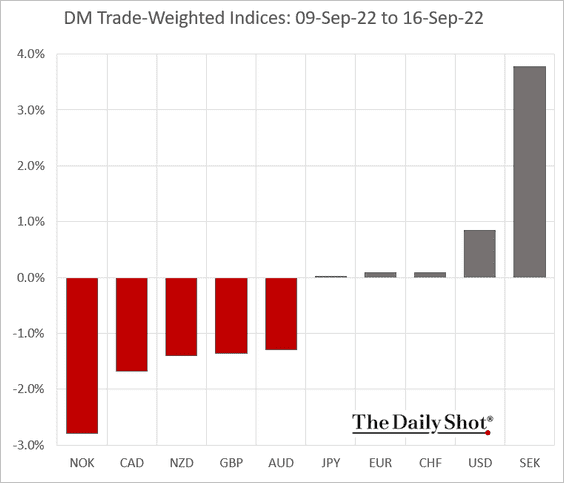
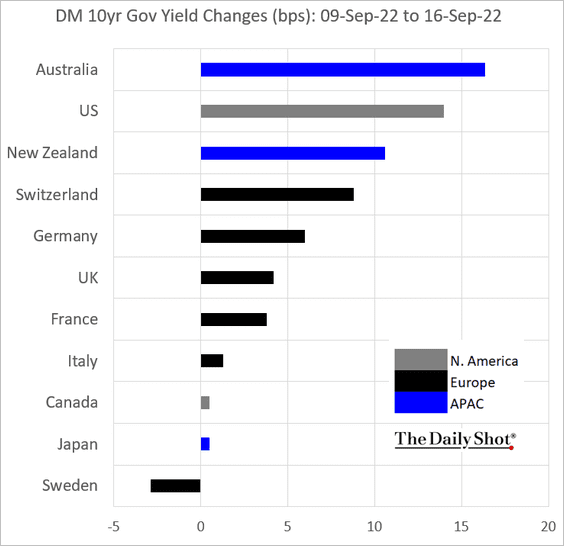
3. Next, we have some performance data from last week.
• Trade-weighted currency indices:
• DM sovereign yields:
——————–
Food for Thought
1. Remote work job applications and postings:
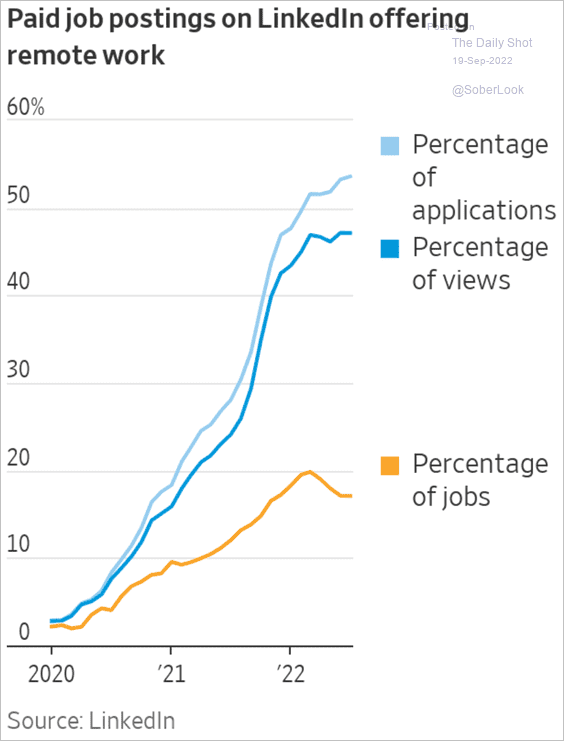 Source: @WSJ Read full article
2. Employee engagement:
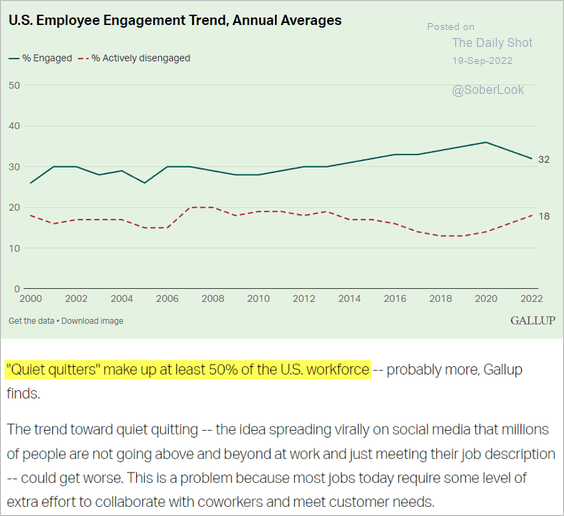 Source: Gallup Read full article
3. Declines in air pollution since 1990:
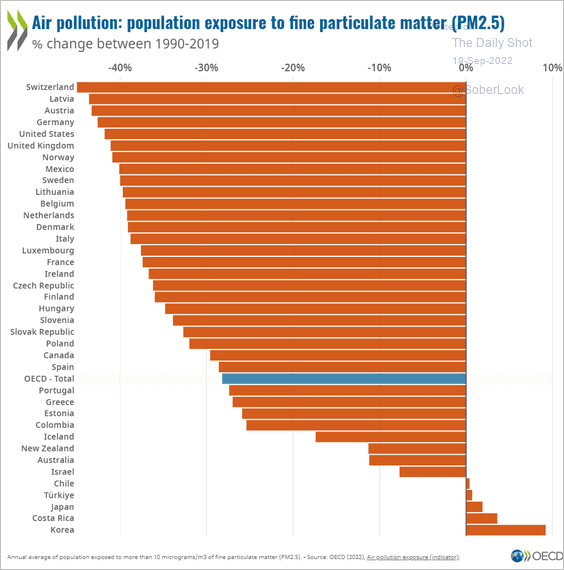 Source: @OECD Read full article
4. Life expectancy at birth:
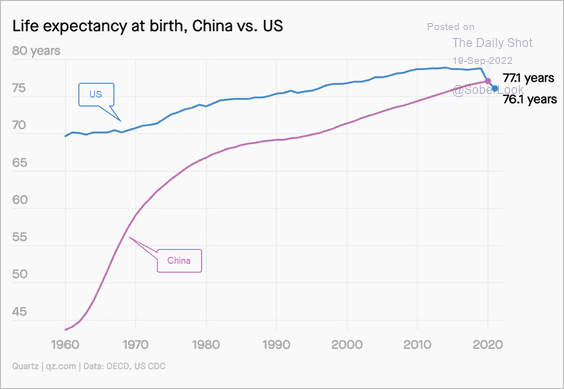 Source: @ianbremmer
5. iPhone pricing:
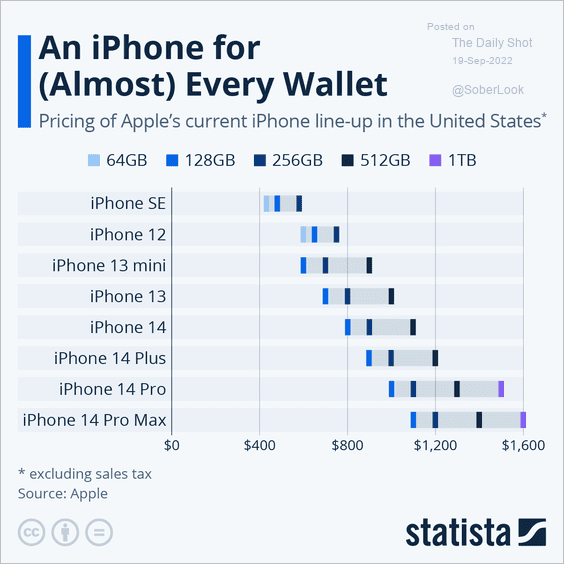 Source: Statista
6. Volkswagen’s portfolio:
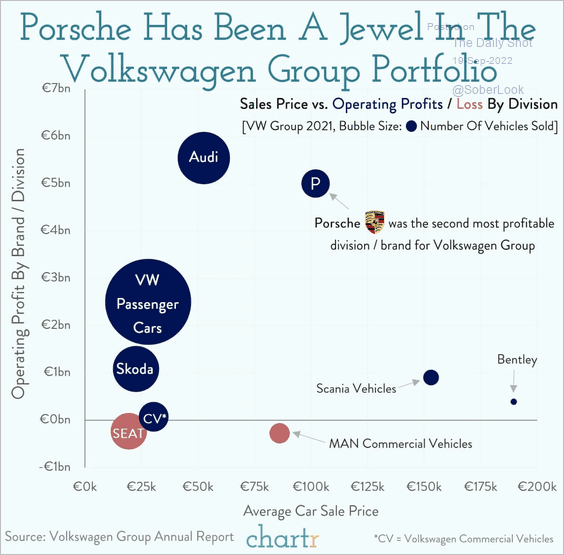 Source: @chartrdaily
7. The US tennis boom:
 Source: Statista
——————–
Back to Index