
The Daily Shot: 20-Sep-22
• The United States
• Canada
• The Eurozone
• Japan
• China
• Emerging Markets
• Cryptocurrency
• Commodities
• Energy
• Equities
• Credit
• Global Developments
• Food for Thought
The United States
1. Let’s begin with the housing market.
• Homebuilder sentiment continues to deteriorate as demand weakens.
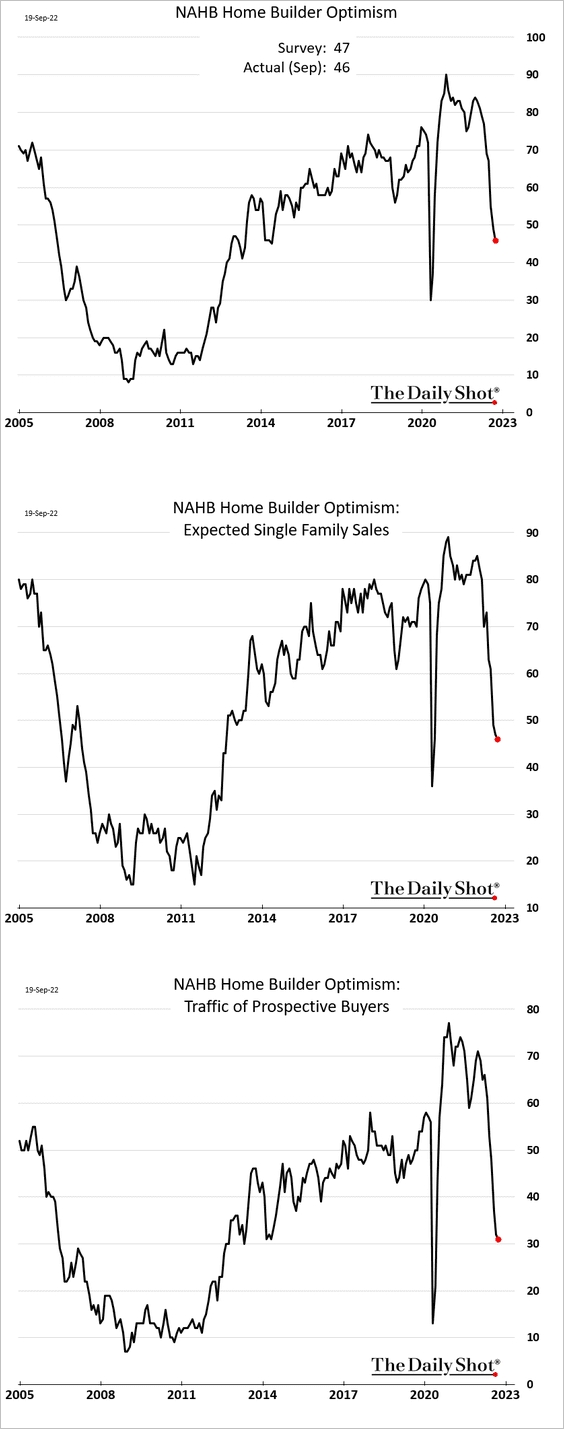
This trend doesn’t bode well for residential construction.
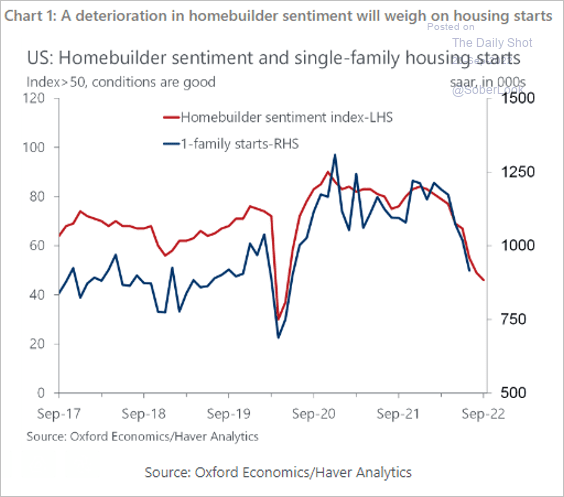 Source: Oxford Economics
• Mortgage rates keep climbing with Treasury yields (2 charts) …
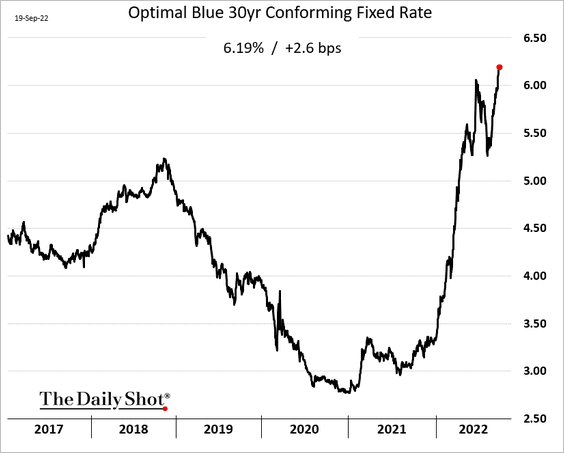
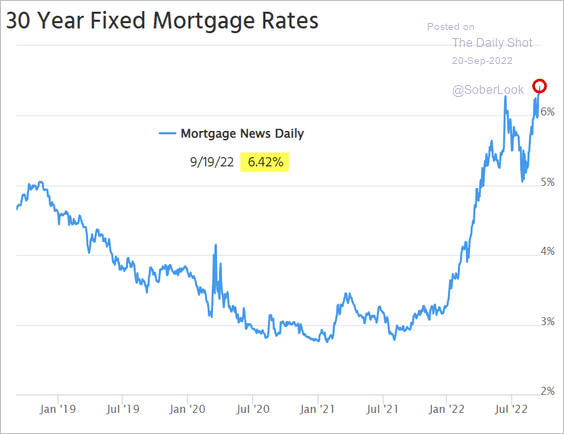 Source: Mortgage News Daily
… putting pressure on home prices.
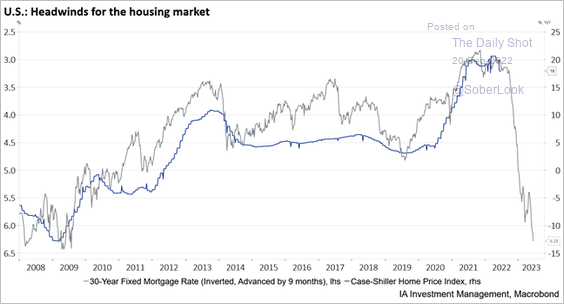 Source: Industrial Alliance Investment Management
• Home prices are declining on a month-over-month basis for the first time in a decade.
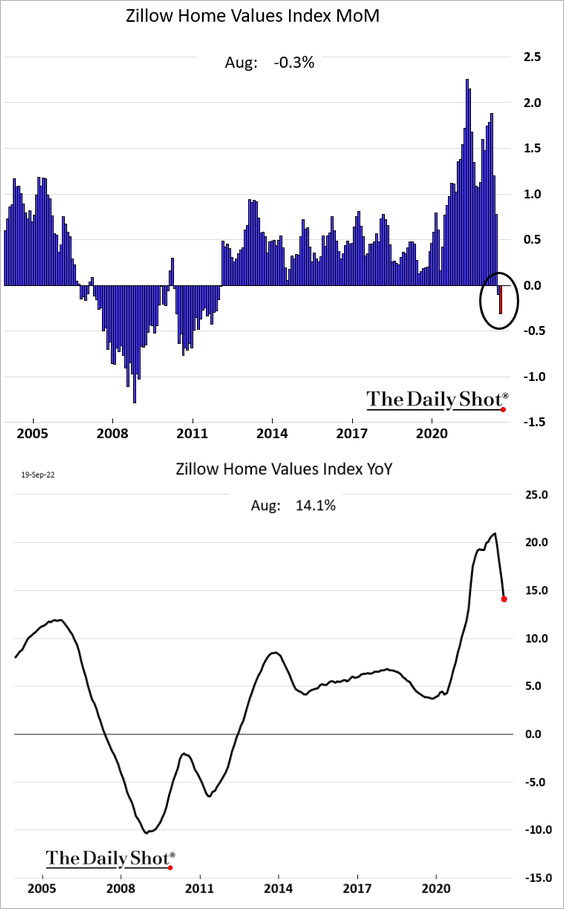
Will we see home price appreciation dip into negative territory year-over-year?
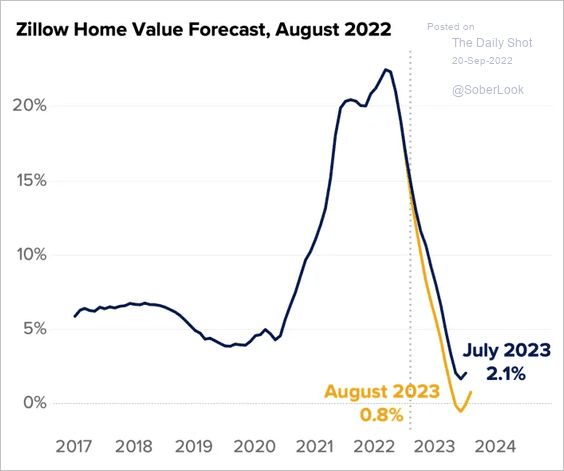 Source: Zillow
• Sellers are cutting prices.
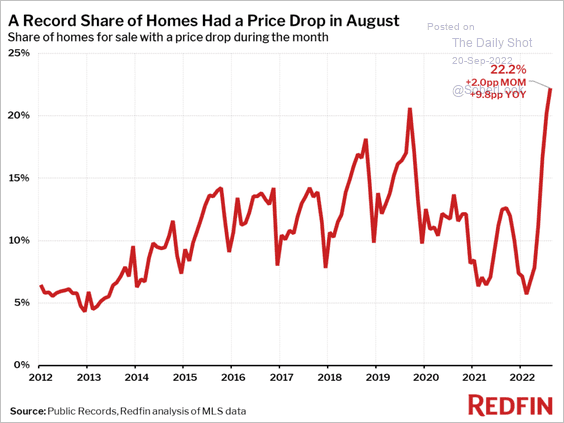 Source: Redfin
• Home-flipping is not profitable in this environment.
 Source: Bloomberg Read full article
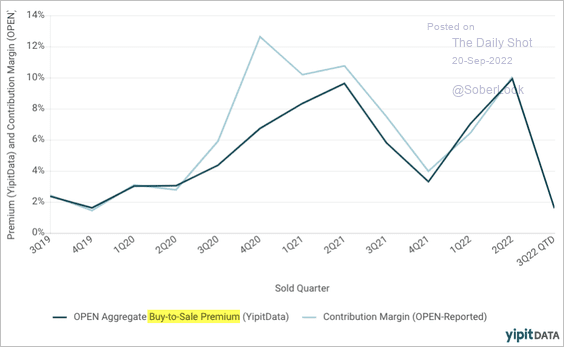 Source: YipitData
• New listings are declining, …
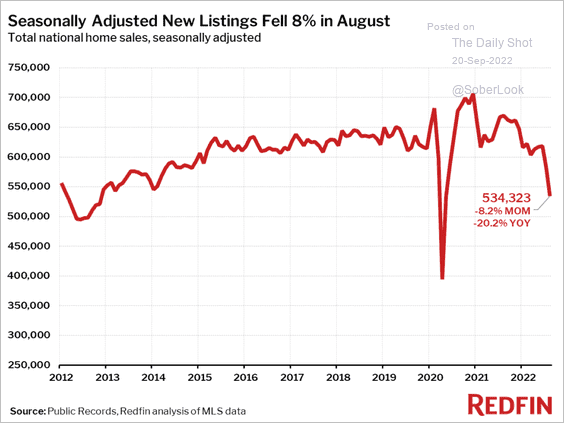 Source: Redfin
… but inventories of unsold homes are grinding higher (measured in months of supply).
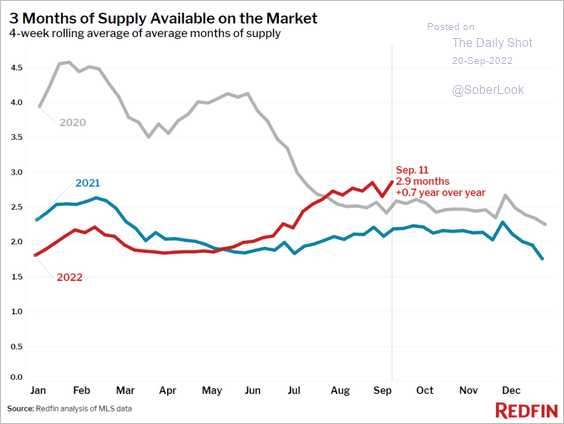 Source: Redfin
——————–
2. Next, we have some updates on economic growth.
• The economy is now expanding below potential, according to Goldman.
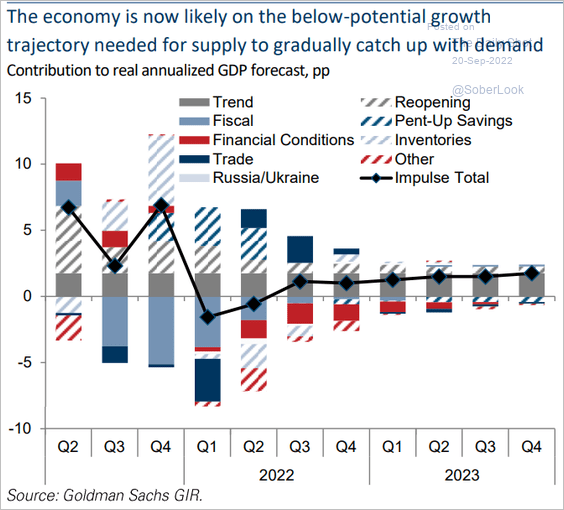 Source: Goldman Sachs
• The percentage of investors expecting a recession keeps climbing, according to a survey from BofA.
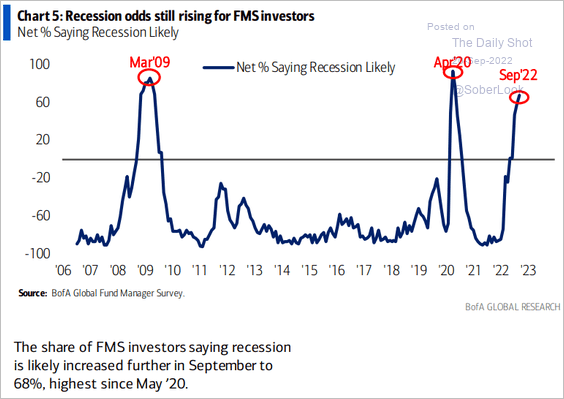 Source: BofA Global Research
• Here is a survey from Evercore ISI on the 2023 GDP growth.
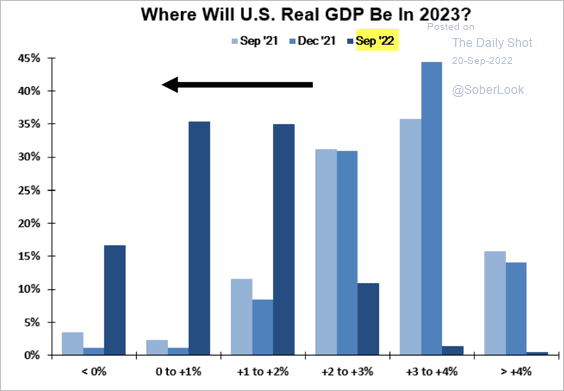 Source: Evercore ISI Research
3. The Morgan Stanley Business Conditions Index shows slower CapEx and hiring plans.
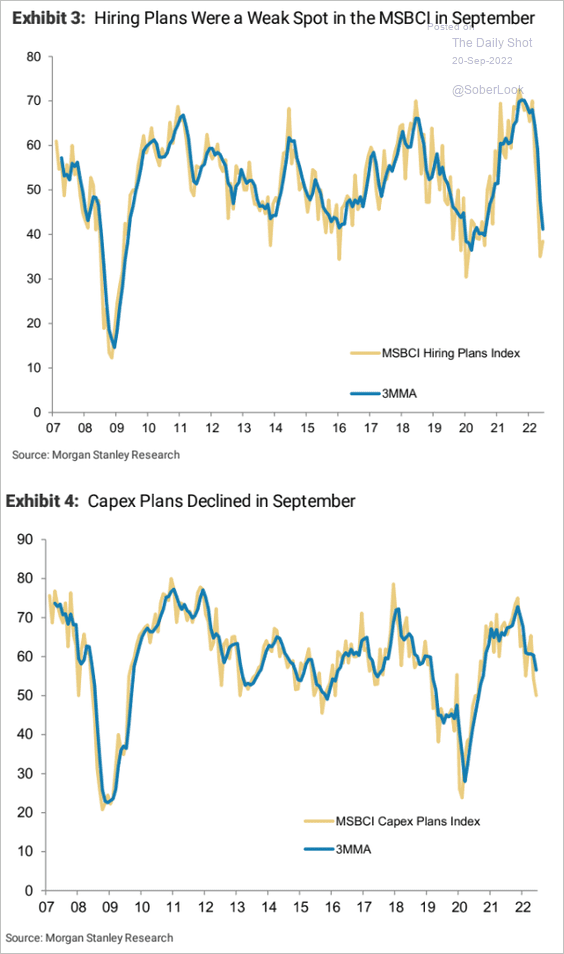 Source: Morgan Stanley Research
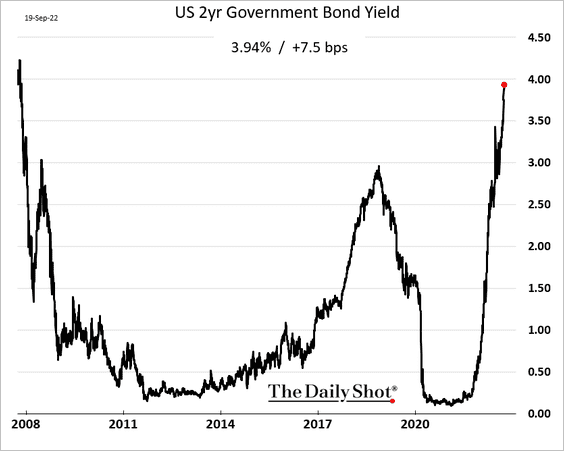
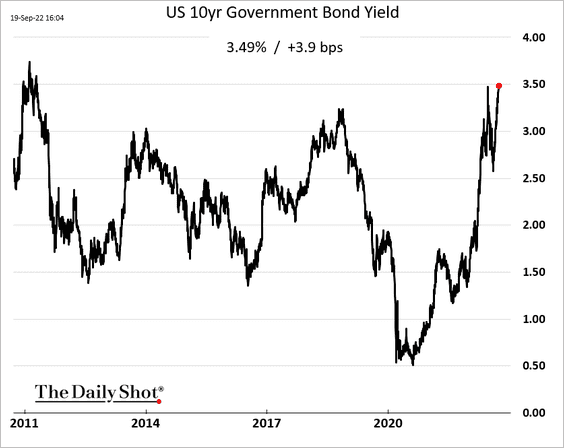
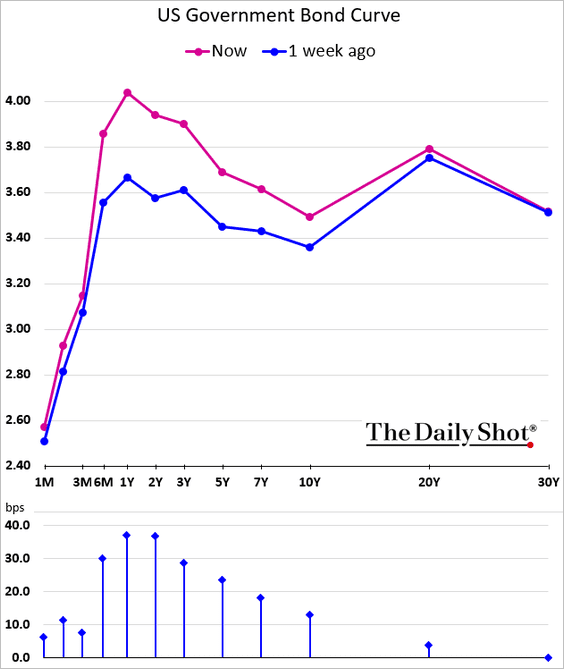
4. Treasury yields continue to surge.
• 2yr:
• 10yr:
 Source: @WSJ Read full article
The curve is becoming more inverted.
——————–
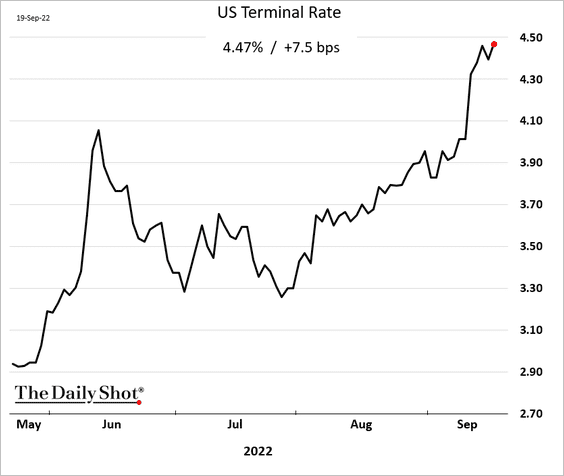
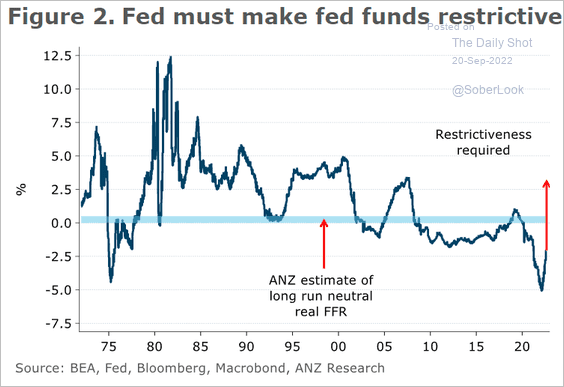
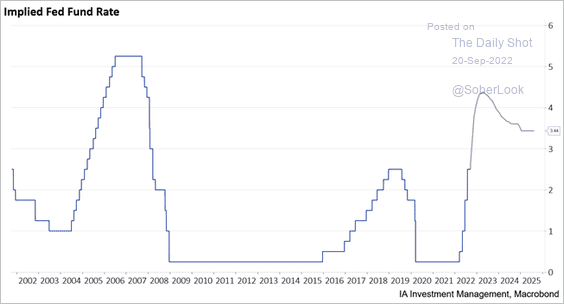
5. The market has repriced the fed funds rate trajectory by almost 50 bps in recent days.
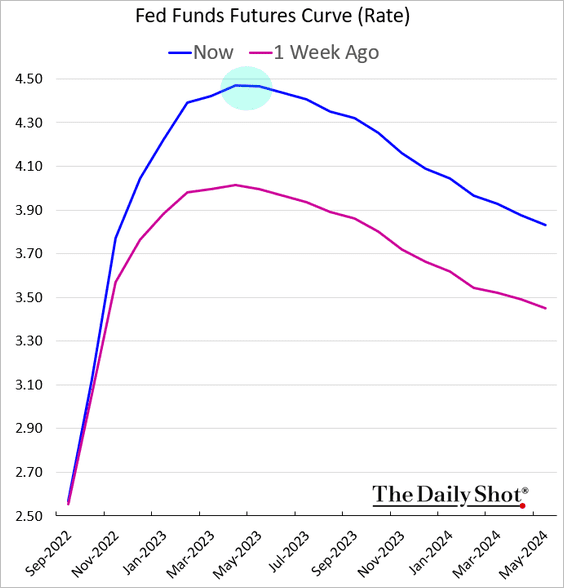
• The terminal rate (the peak in the chart above) is nearing 4.5%.
ANZ, Deutsche Bank, and several other research groups see the terminal rate closer to 5%, which is needed to kick rates into restrictive territory.
 Source: @ANZ_Research
• Here is how the current market projection compares to previous rate hikes.
 Source: Industrial Alliance Investment Management
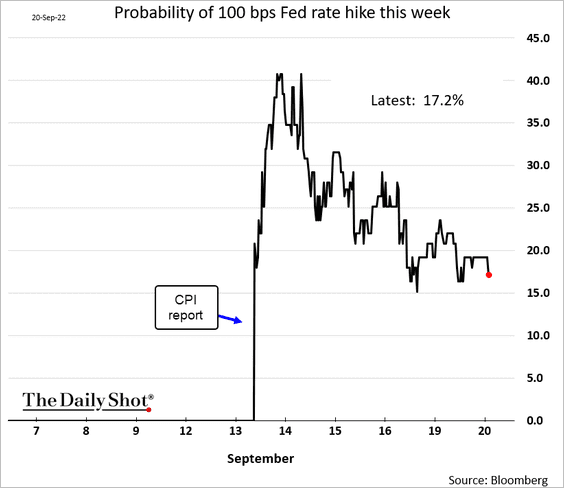
• What should we expect from the Fed this week and for the rest of the year?
– A 100 bps rate hike this week is not likely. While inflation has been sticky, inflation expectations have been moving lower.
– Below are some scenarios from ING.
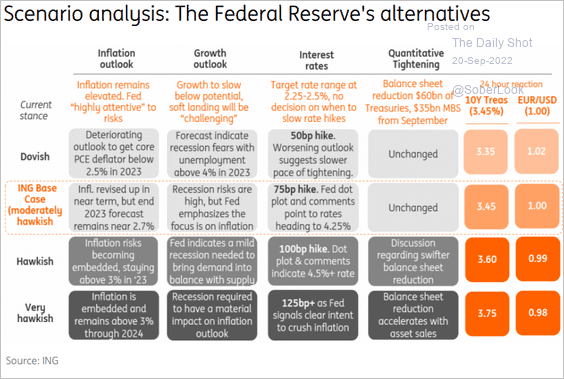 Source: ING
– Goldman expects 75 bps this week, followed by two 50 bps hikes.
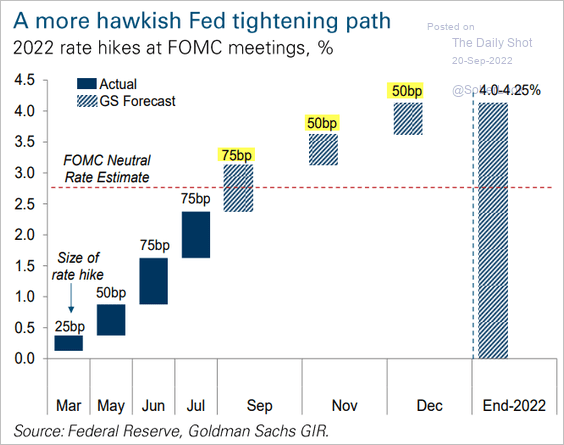 Source: Goldman Sachs
Here is the market expectation.
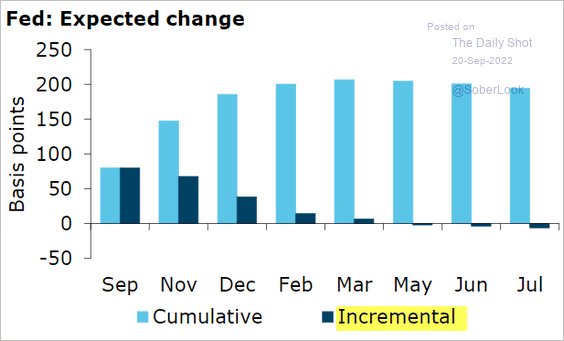 Source: @ANZ_Research
Back to Index
Canada
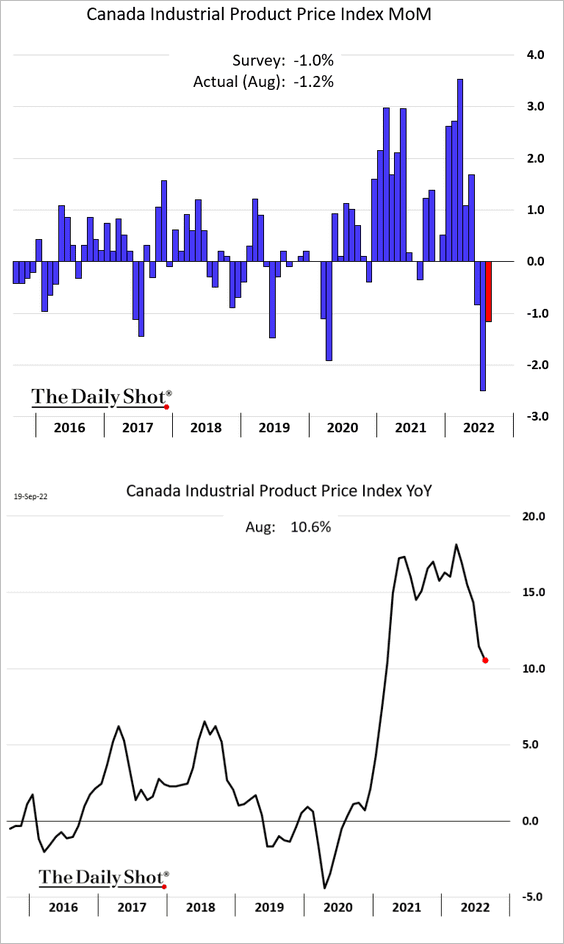
1. Industrial output prices have been declining.
2. Strong wage growth has pressured the BoC to aggressively hike rates.
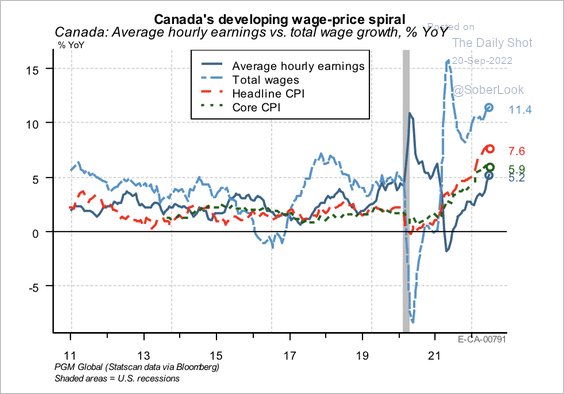 Source: PGM Global
The last BoC rate hike is coming in October, according to Oxford Economics. But mortgage rates will stay elevated.
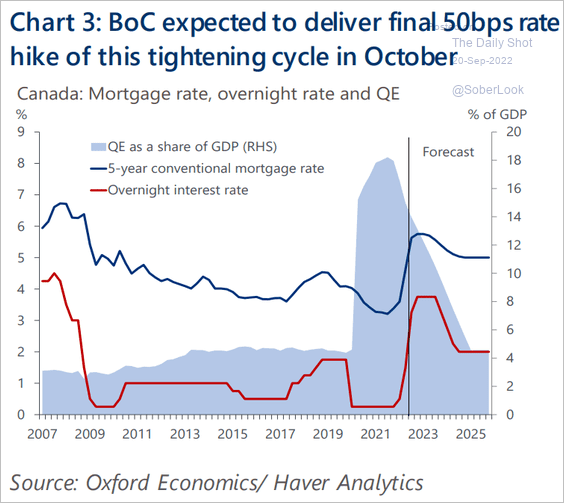 Source: Oxford Economics
——————–
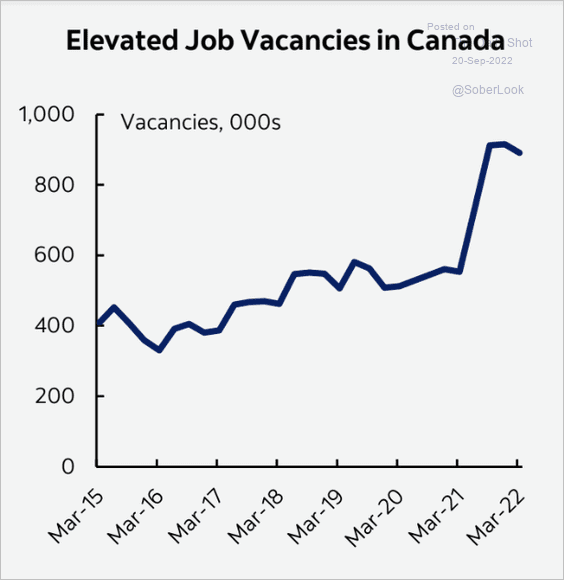
3. More than a million jobs remain vacant in Canada due to labor shortages, doubling the pre-pandemic level.
 Source: Scotiabank Economics
Here is the jobs-workers gap.
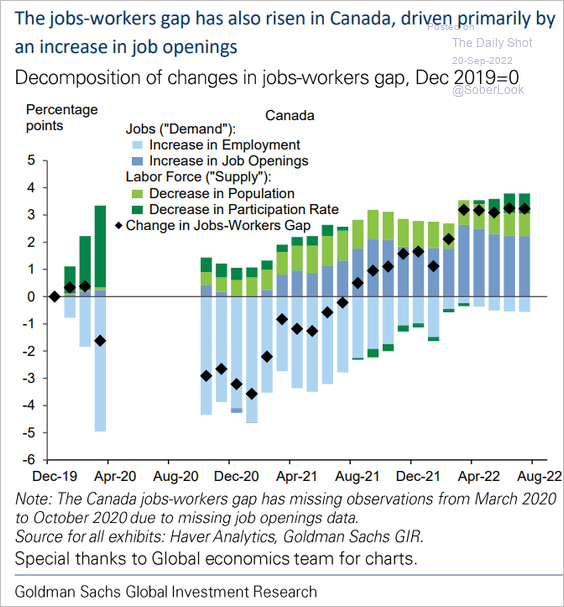 Source: Goldman Sachs
——————–
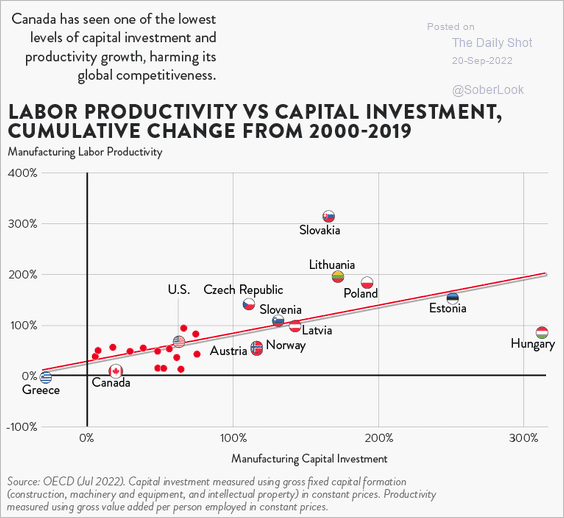
4. Canada’s capital investment and labor productivity growth are low relative to other industrialized nations.
 Source: Visual Capitalist Read full article
Back to Index
The Eurozone
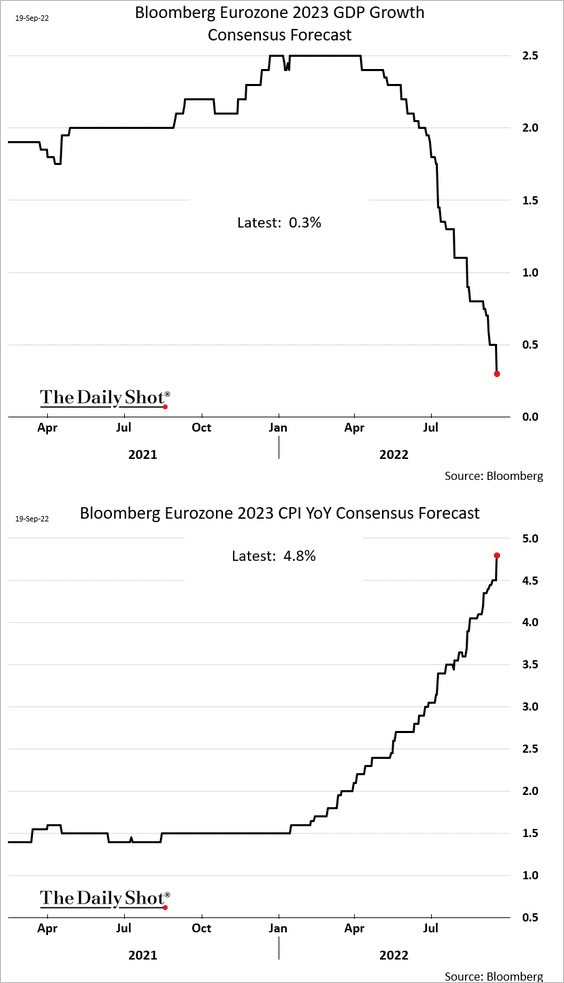
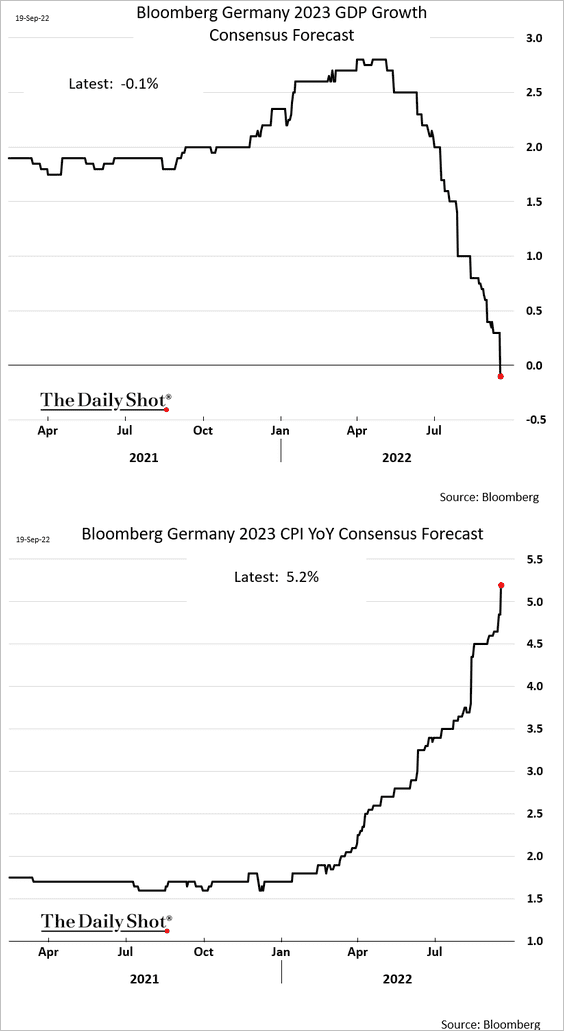
1. Economists increasingly see stagflation in the Eurozone. Below is the evolution of median forecasts.
• The euro area:
• Germany:
• Here is a survey from Evercore ISI.
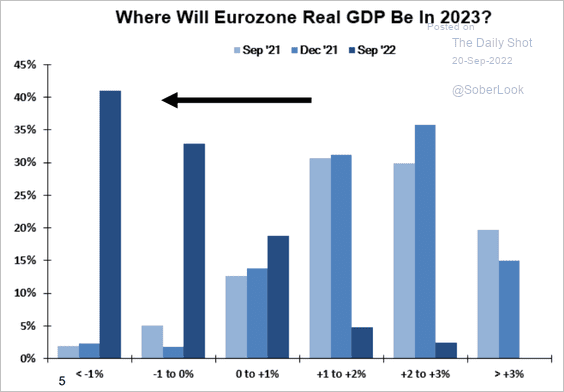 Source: Evercore ISI Research
• Services PMI is declining at a pace consistent with past recessions.
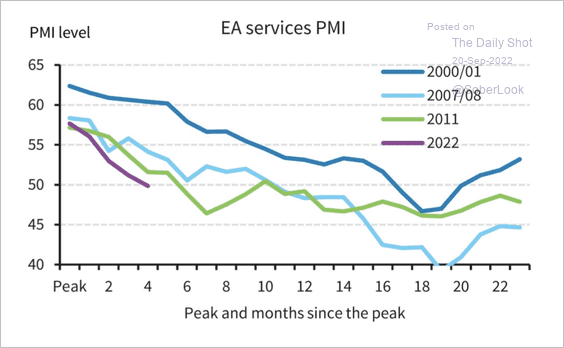 Source: Barclays Research
——————–
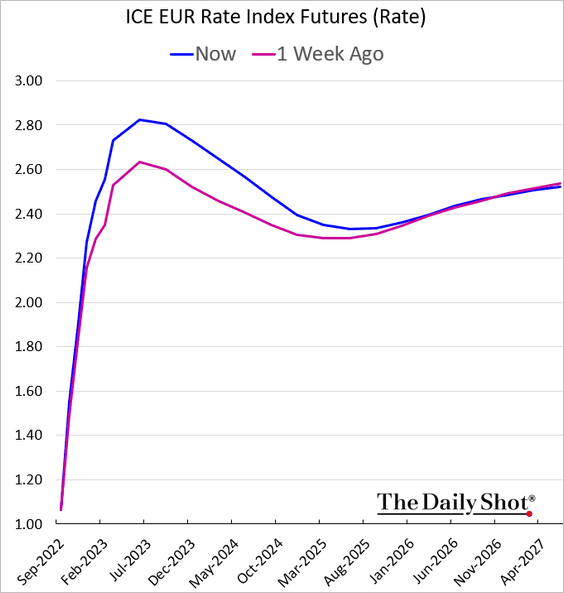
2. Germany’s 2-year yield continues to climb, …
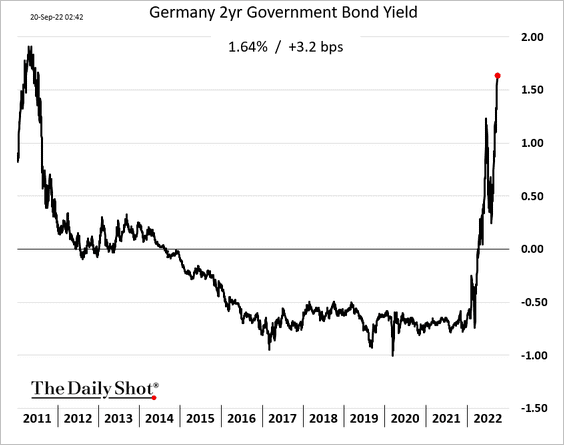
… as the market reprices ECB rate hike expectations.
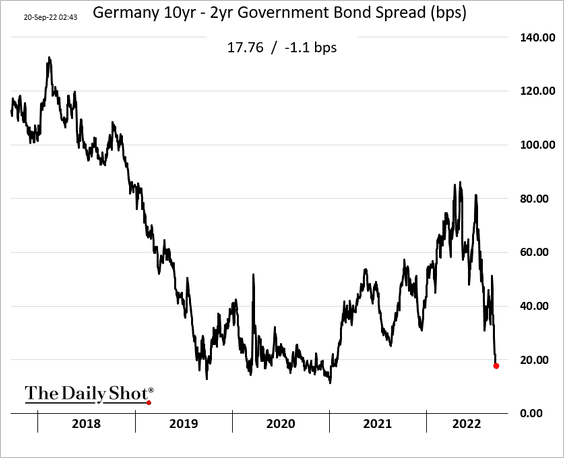
The Bund curve keeps getting flatter.
——————–
3. What are the drivers of the euro’s weakness this year?
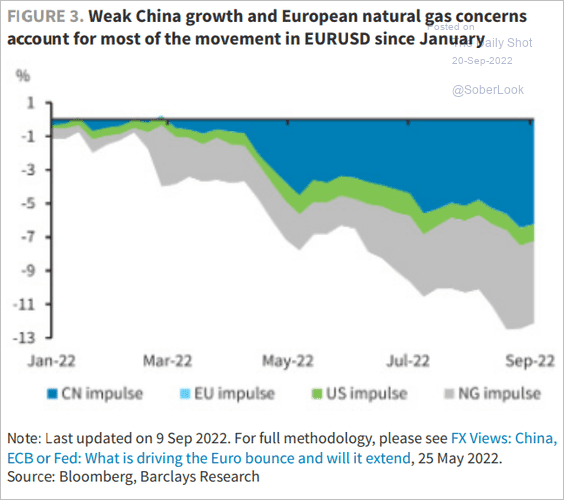 Source: Barclays Research
4. Inflation for “non-pandemic” items is now above the ECB’s target.
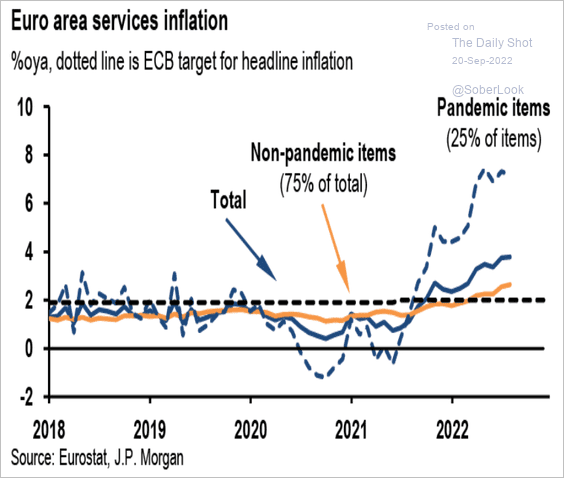 Source: JP Morgan Research; III Capital Management
5. Euro-area investment funds’ redemptions have been outpacing share issuance.
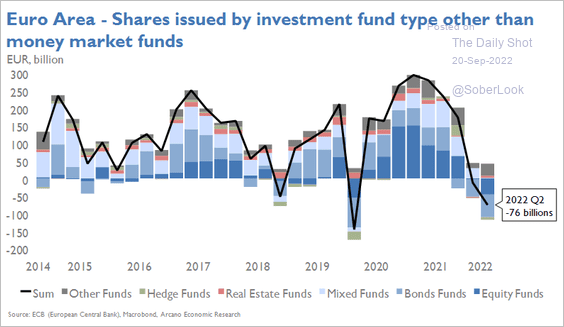 Source: Arcano Economics
Back to Index
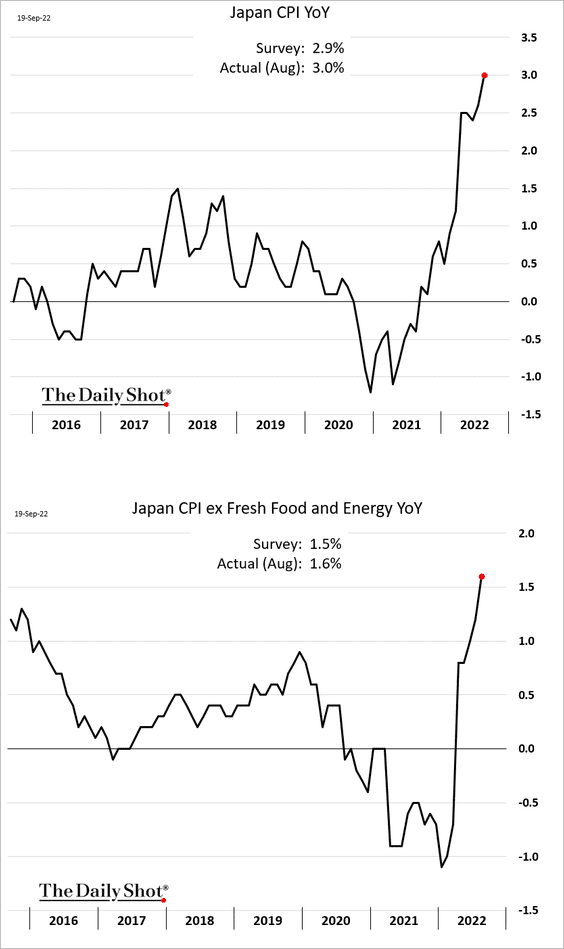
Japan
1. The headline inflation hit 3%.
2. According to the WSJ, “Japan is set to join Southeast Asia and Australia in lifting most entry restrictions for international visitors.”
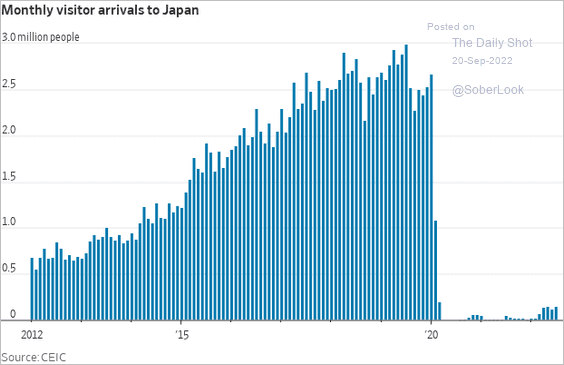 Source: @WSJ Read full article
Back to Index
China
1. Investment in manufacturing and infrastructure have been resilient, but real estate investment continues to retreat.
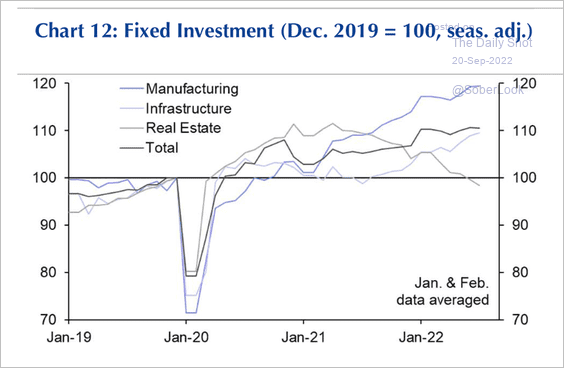 Source: Capital Economics
This chart shows newly-started construction.
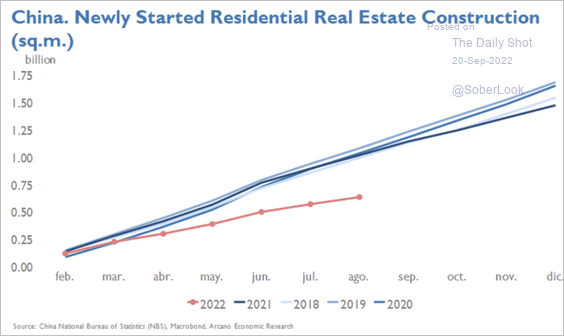 Source: Arcano Economics
——————–
2. Non-performing loan balances in the property sector have risen substantially (SOE = state-owned enterprises; POE = private-owned enterprises).
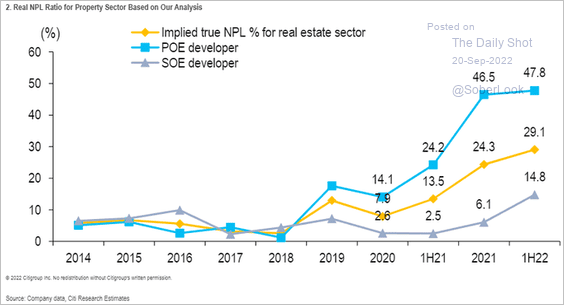 Source: @SofiaHCBBG
3. Reduced land sales are pressuring local governments’ budgets. According to the FT, “local government financing vehicles are rushing to buy vast quantities of land with borrowed funds.”
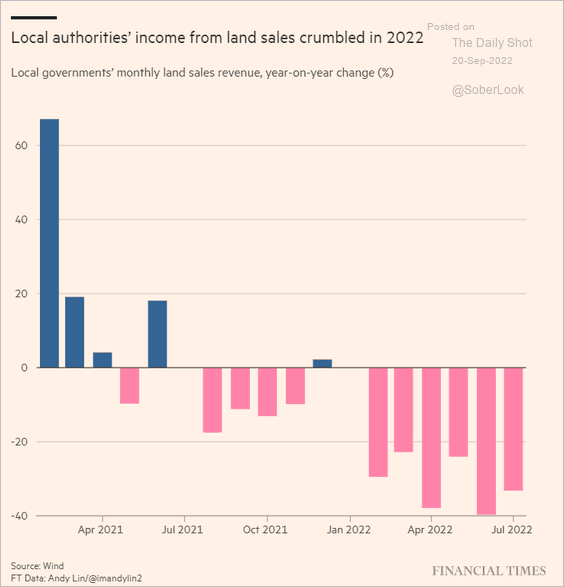 Source: @financialtimes Read full article
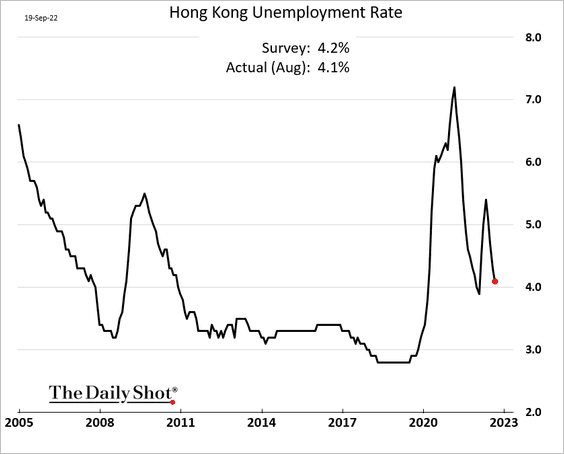
4. Hong Kong’s unemployment rate has been declining.
Back to Index
Emerging Markets
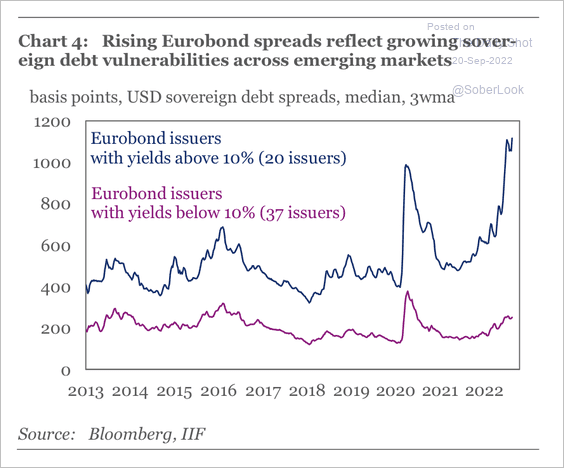
1. Sovereign bond spreads for high-yield borrowers have surpassed pandemic highs.
 Source: IIF
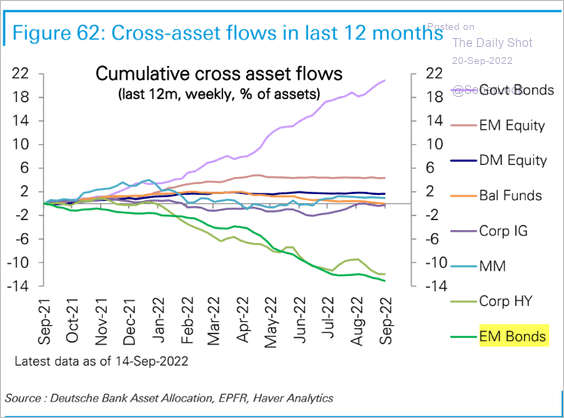
2. Bond funds continue to see outflows.
 Source: Deutsche Bank Research
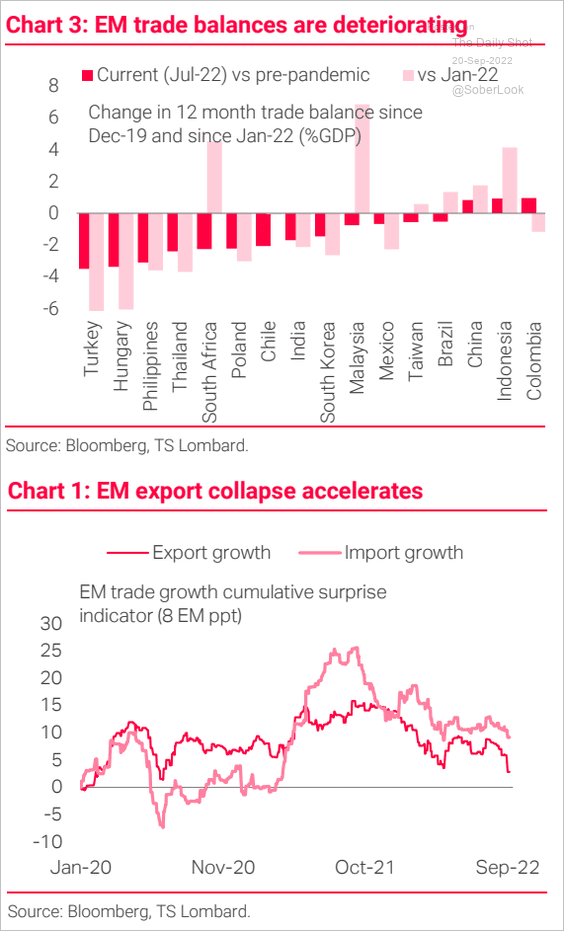
3. Trade balances have been deteriorating.
 Source: TS Lombard
Back to Index
Cryptocurrency
1. Recent bitcoin sell-offs have triggered spikes in long liquidations. The latest extreme was in August when BTC broke below $23K.
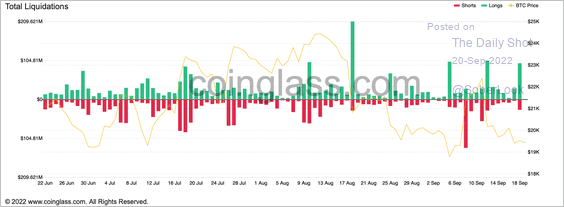 Source: Coinglass
2. Bitcoin’s put/call ratio is ticking higher.
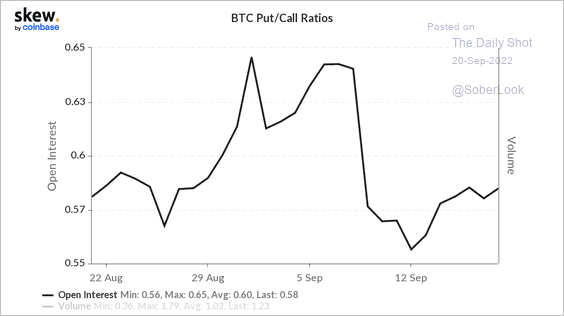 Source: Skew
3. Total bitcoin supply held by long-term holders reached a new all-time high.
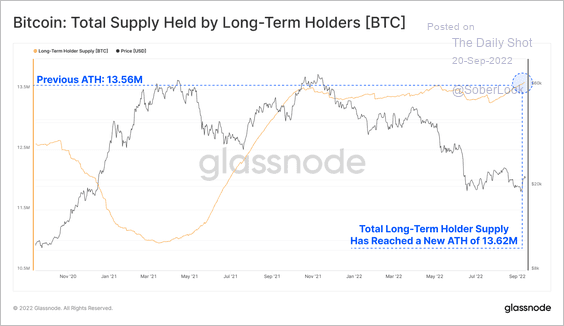 Source: @glassnode
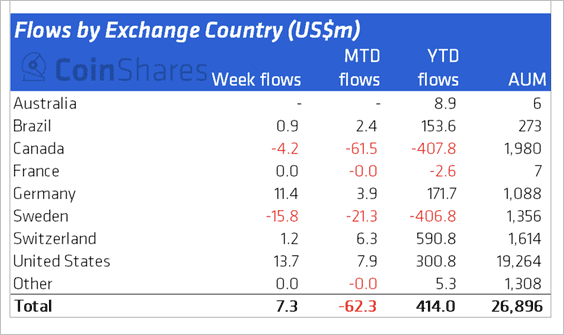
4. Crypto funds saw minor inflows last week, led by Bitcoin-focused products. However, Ethereum-focused products continued to see outflows.
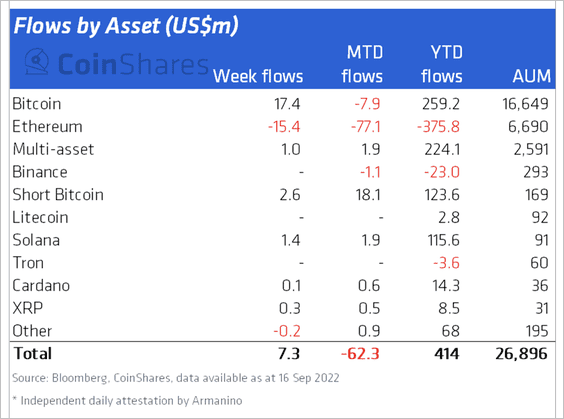 Source: CoinShares Read full article
Inflows have been focused on the US and Germany, while Sweden and Canada experienced outflows.
 Source: CoinShares Read full article
Back to Index
Commodities
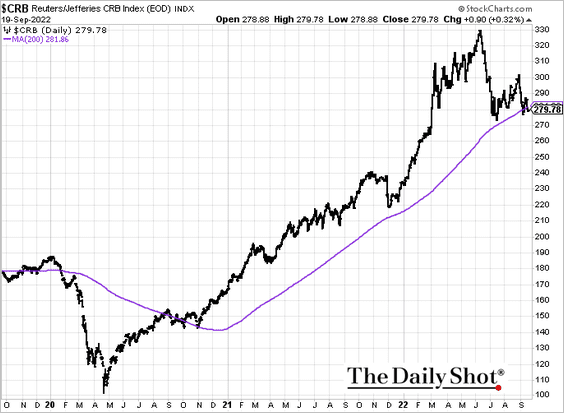
1. The CRB commodity index is testing support at the 200-day moving average.
2. Lithium prices are climbing again.
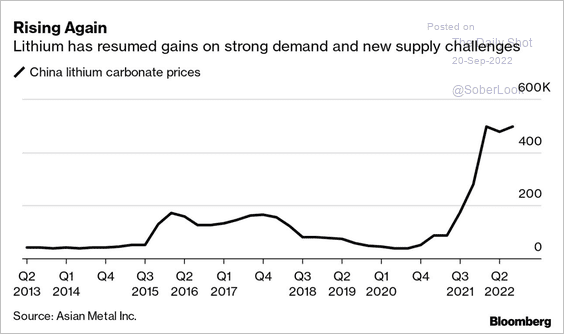 Source: @annieLee23, @business Read full article
Back to Index
Energy
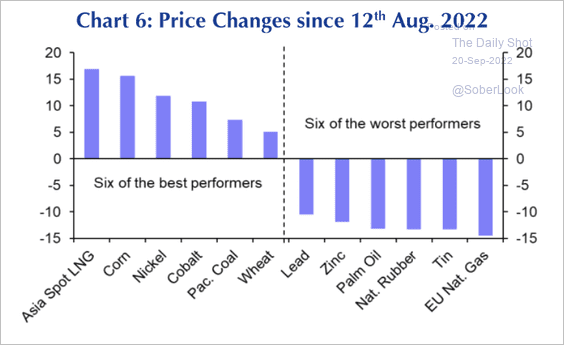
1. Asia spot LNG saw a large price rise last month ahead of the winter season.
 Source: Capital Economics
2. Here is a look at bullish and bearish drivers for Brent oil, according to Fitch. Blue dots denote supply side drivers, and red denotes demand (2 charts).
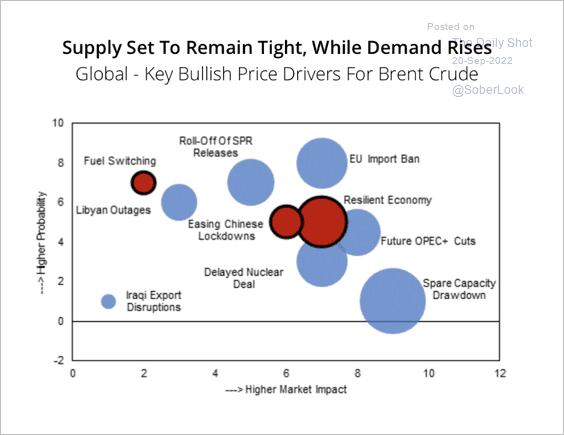 Source: Fitch Solutions Macro Research
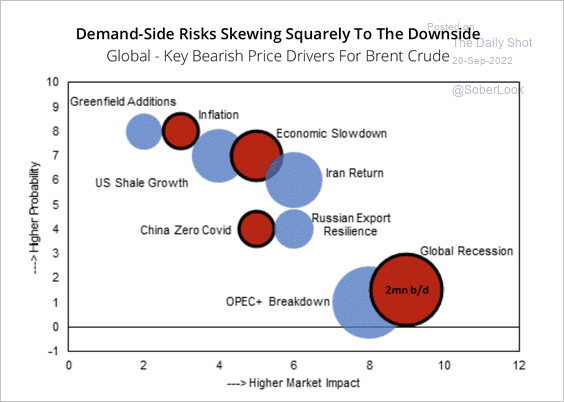 Source: Fitch Solutions Macro Research
Rising inventories could pressure prices.
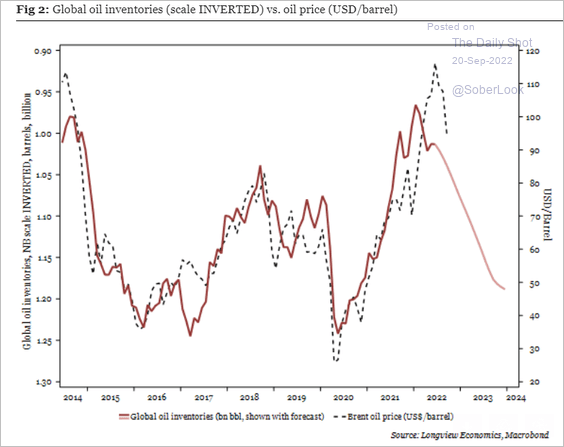 Source: Longview Economics
Back to Index
Equities
1. US financial conditions continue to tighten.
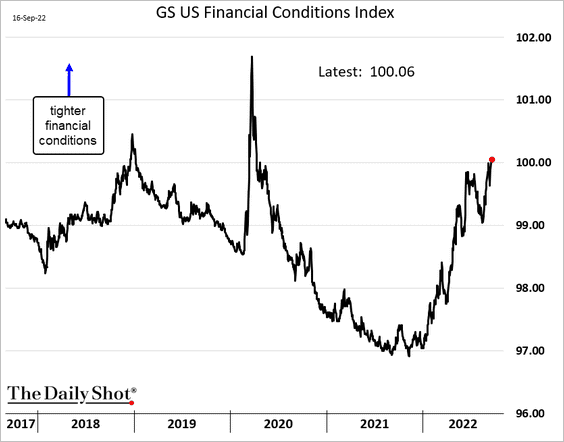
How correlated are equity factors to financial conditions?
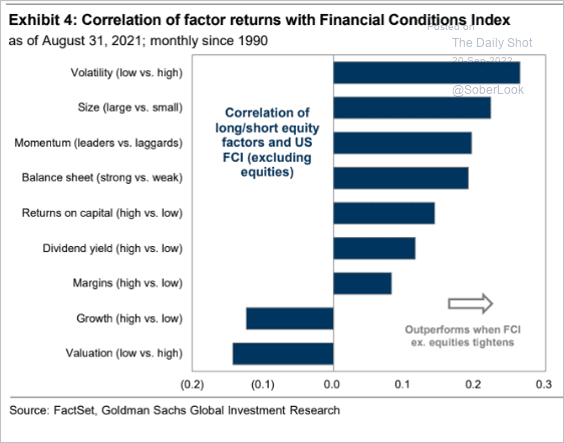 Source: Goldman Sachs; @MikeZaccardi
——————–
2. Bullish options bets remain low.
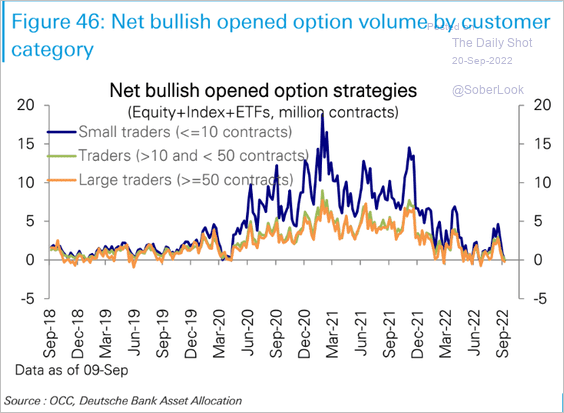 Source: Deutsche Bank Research
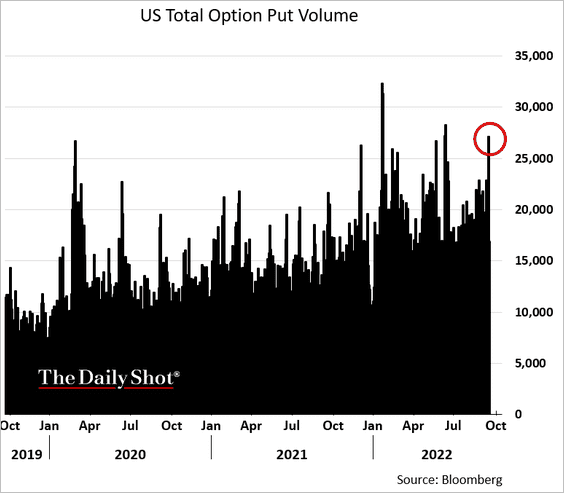
Put option volume jumped this week.
——————–
3. S&P 500 earnings are significantly above their long-term trend.
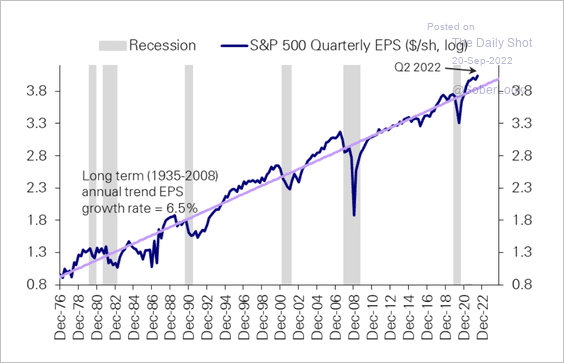 Source: Deutsche Bank Research
• A stronger US dollar points to more downward earnings revisions.
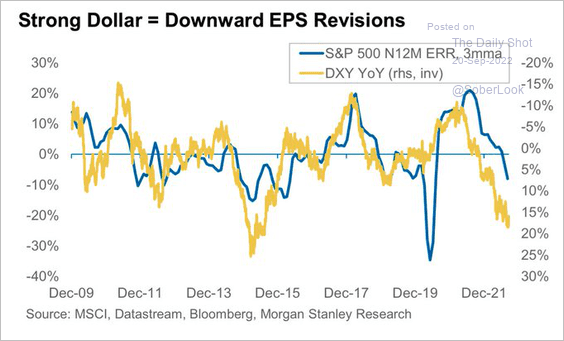 Source: Morgan Stanley Research; @WallStJesus
• The PMI-based earnings indicator from S&P Global also signals significant downgrades ahead.
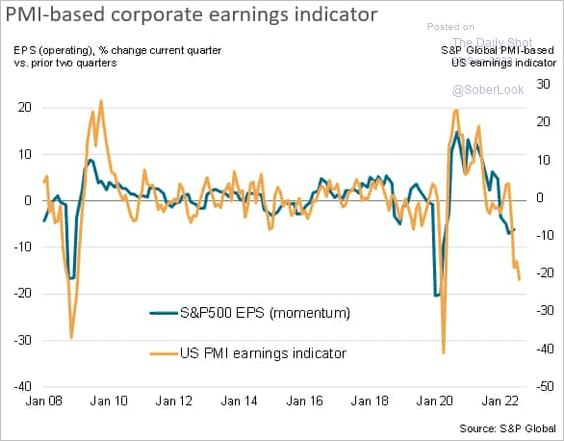 Source: S&P Global PMI
——————–
4. Institutions have been the primary sellers this year. According to S&P Global Market Intelligence, “In the five weeks ending Sept. 7, long-only investors sold $51.2 billion worth of equities …”
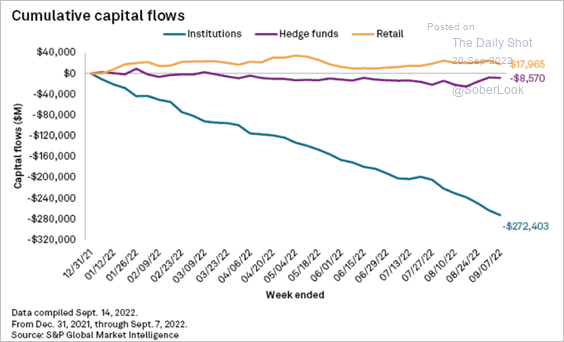 Source: S&P Global Market Intelligence
5. Investors prefer the US market relative to other regions.
 Source: Evercore ISI Research
6. S&P 500 valuations look reasonable without the tech mega-caps.
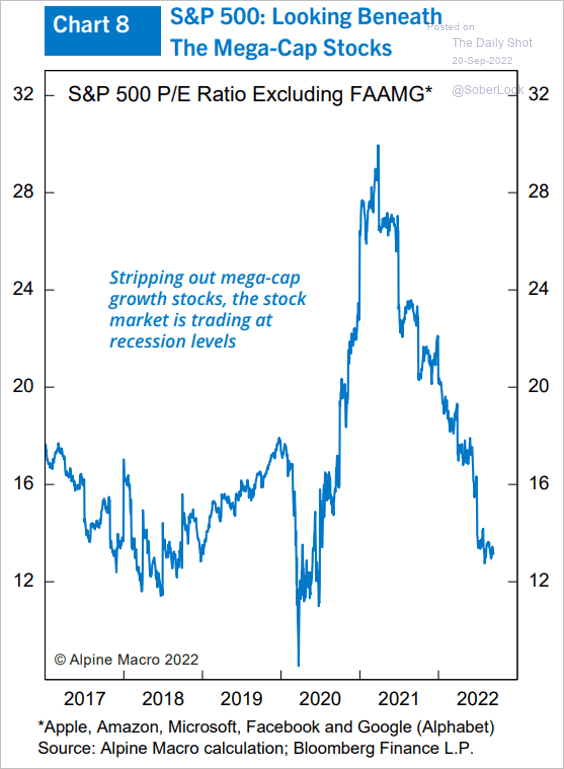 Source: Alpine Macro
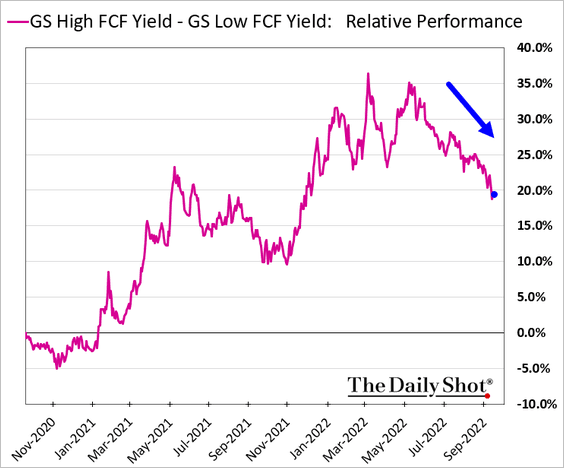
7. Quality names have been underperforming.
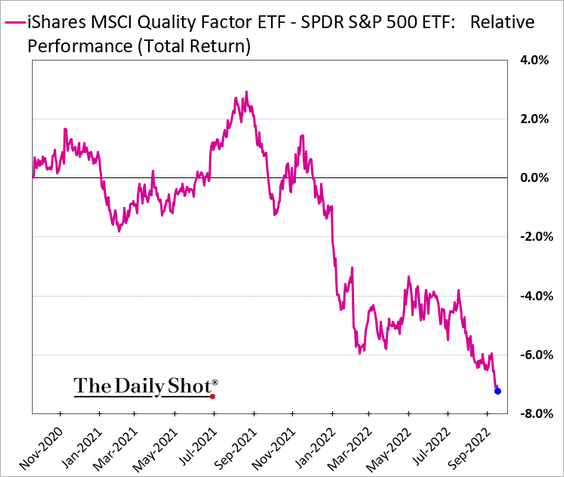
Here is the relative performance of companies with high vs. low free-cash-flow yields.
——————–
8. ESG ETF flows slowed sharply this year.
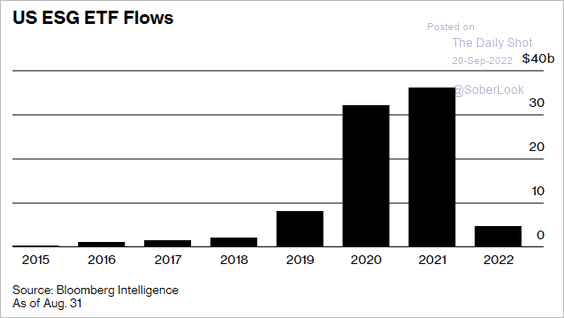 Source: Bloomberg Read full article
Back to Index
Credit
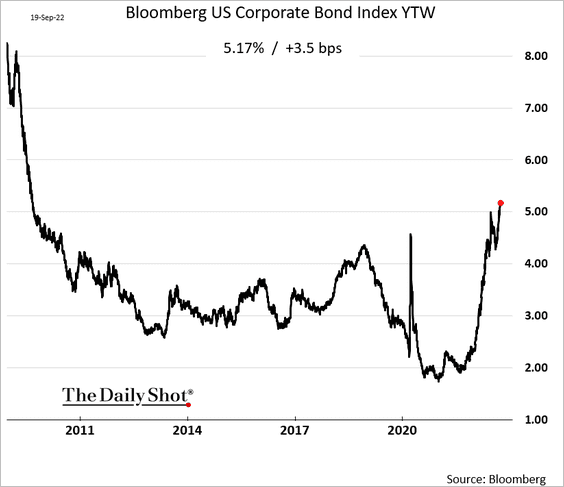
1. Investment-grade bond yields hit the highest level in years.
2. This chart shows US gross and net corporate bond issuance.
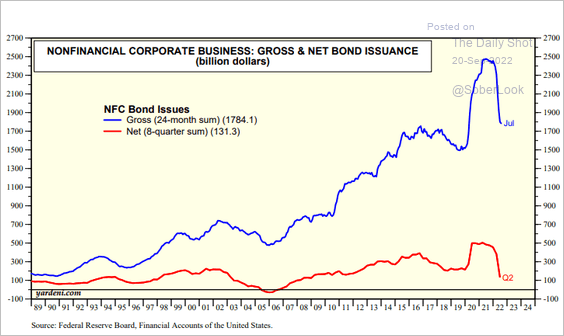 Source: Yardeni Research
3. CLOs could see their CCC buckets “overflowing” if downgrades pick up.
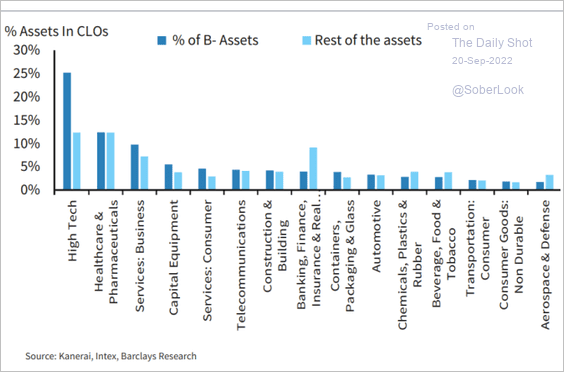 Source: Barclays Research; III Capital Management
Back to Index
Global Developments
1. It’s been a rough year for government bonds.
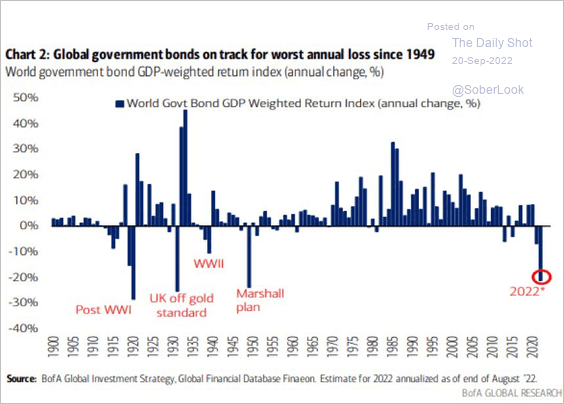 Source: BofA Global Research
2. Bond issuance, when adjusted for inflation, is at multi-year lows. The rapid rise in borrowing costs and weak investor appetite have kept many issuers away from primary markets this year, according to IIF.
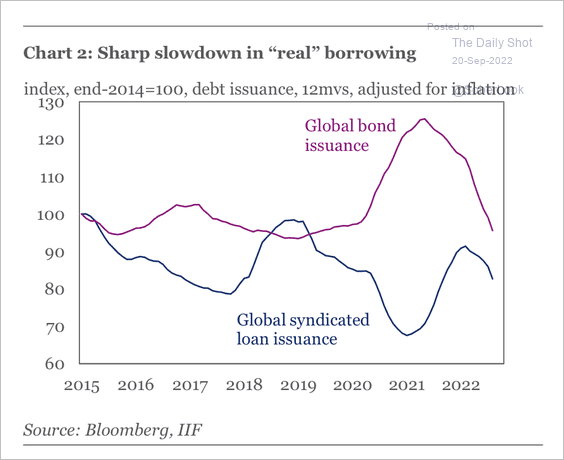 Source: IIF
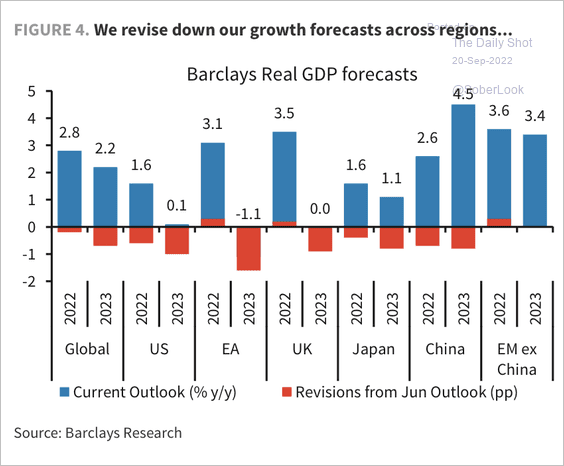
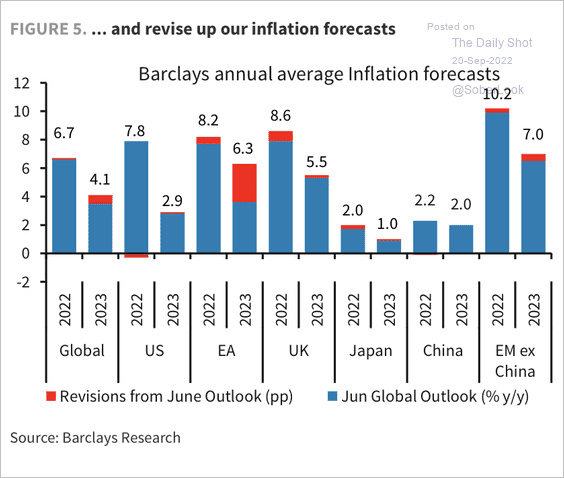
3. Barclays expects global growth to be among the lowest annual rates in the post-WW-II period next year. And elevated inflation could create more hardship (3 charts).
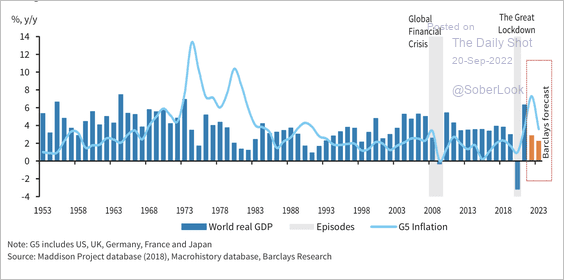 Source: Barclays Research
 Source: Barclays Research
 Source: Barclays Research
——————–
4. This chart shows PE ratios in select economies (compared to historical ranges).
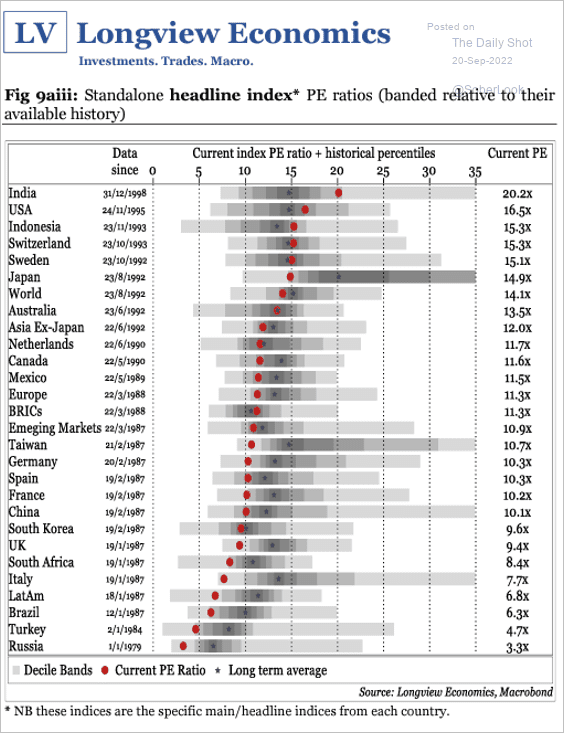 Source: Longview Economics
——————–
Food for Thought
1. Views on “quiet quitting“:
 Source: YouGov Read full article
2. Telecommuting rates are holding at 30%.
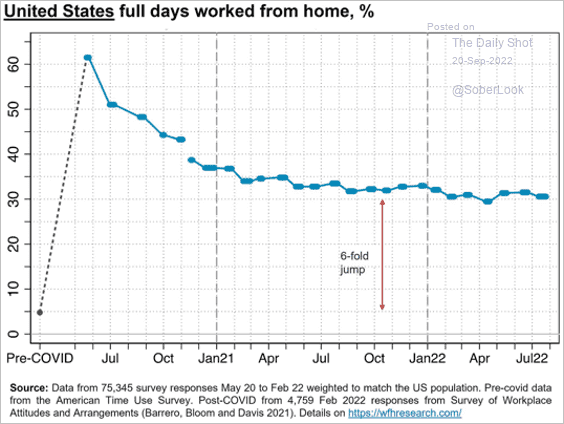 Source: Bain & Company
3. Home products protecting users’ privacy:
 Source: @CivicScience Read full article
4. Wildfire emissions by latitude:
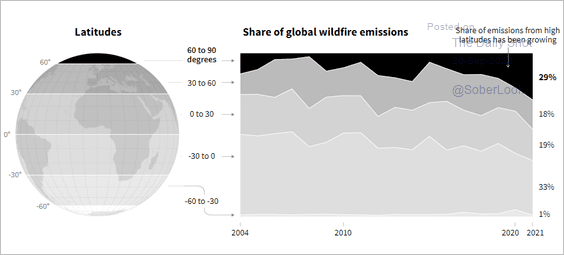 Source: Reuters Read full article
5. Most important issues facing the US:
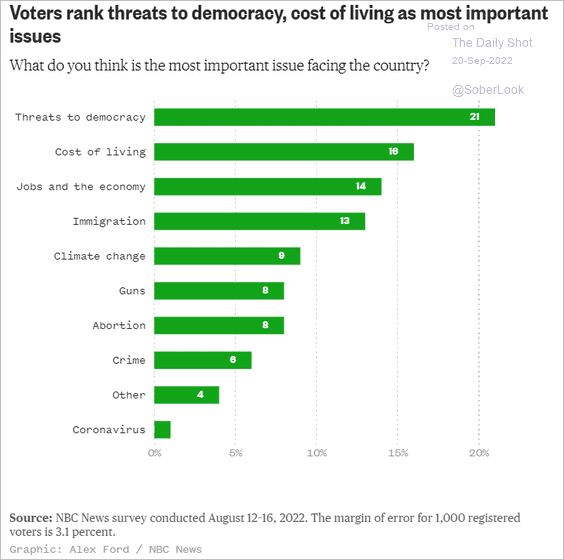 Source: NBC News Read full article
6. US vacancy rates by property type:
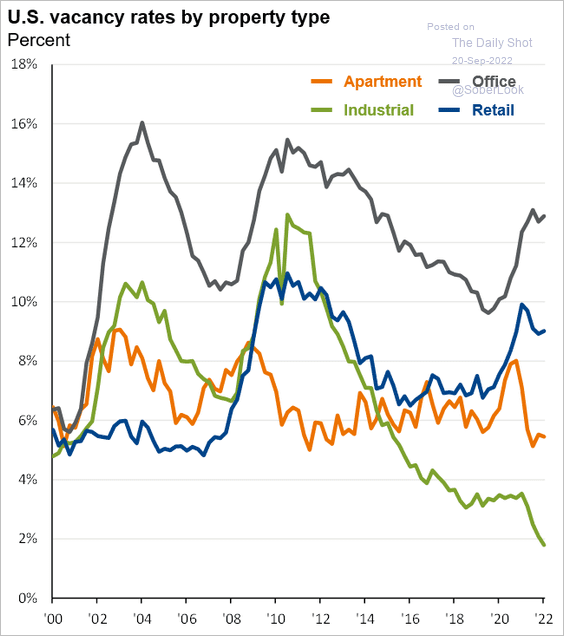 Source: J.P. Morgan Asset Management
7. Curve-fitting methods:
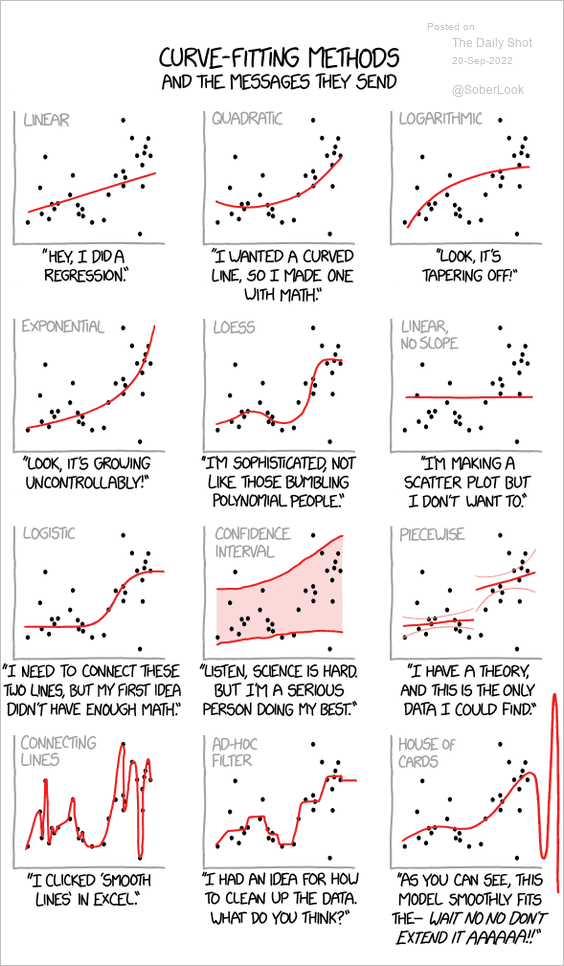 Source: @dwhiginbotham
——————–
Back to Index