
The Daily Shot: 22-Sep-22
• The United States
• Canada
• The United Kingdom.
• The Eurozone
• Asia – Pacific
• China
• Emerging Markets
• Energy
• Equities
• Rates
• Food for Thought
The United States
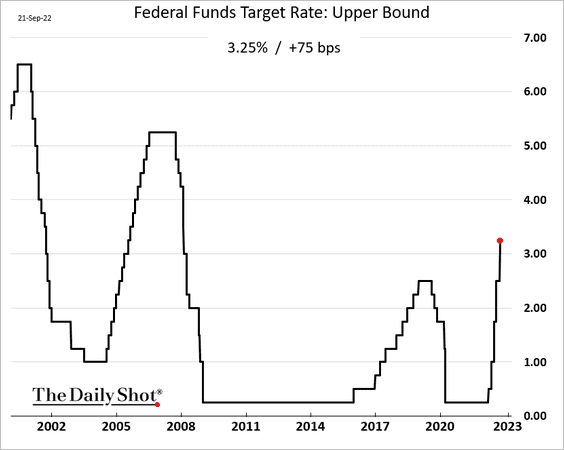
1. The Federal Reserve raised rates by 75 bps (in line with expectations) and promised more jumbo rate hikes ahead.
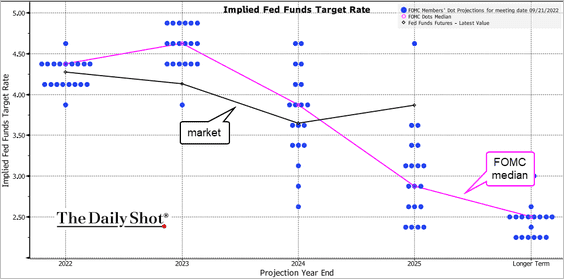
• The dot plot was hawkish, with the FOMC projections pushed well above market expectations for the end of 2023.
 Source: @TheTerminal, Bloomberg Finance L.P.
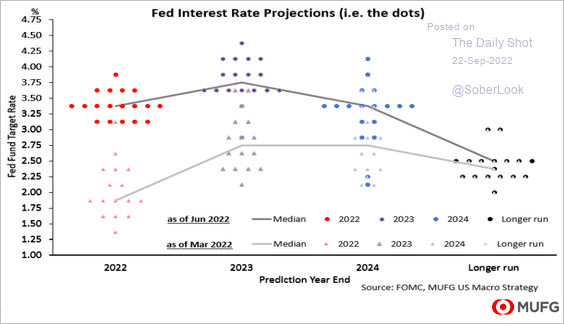
Here are the dots relative to June.
 Source: MUFG Securities
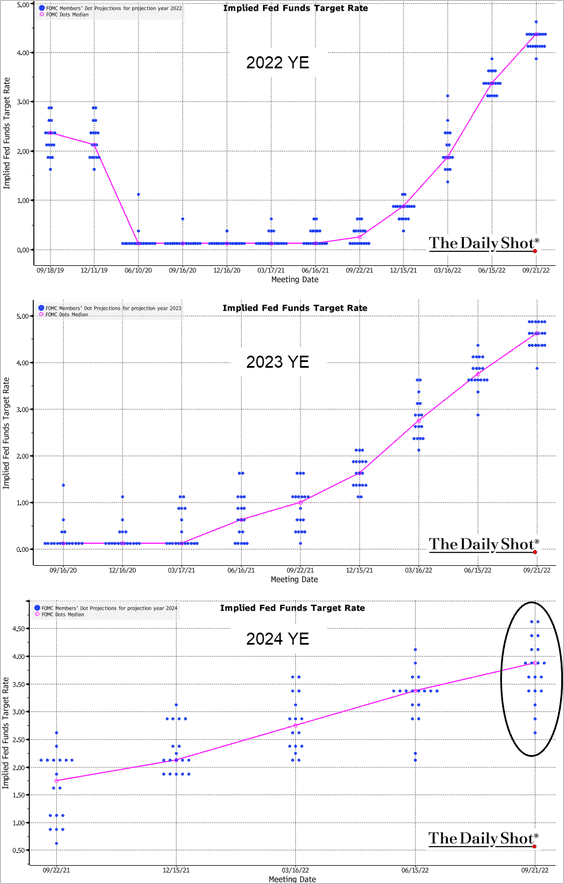
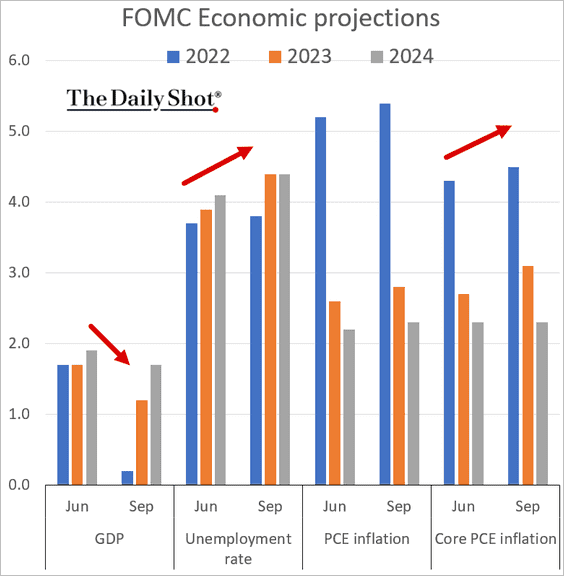
This chart shows the evolution of FOMC’s rate projections by year. Notice the uncertainty at the end of 2024.
 Source: @TheTerminal, Bloomberg Finance L.P.
• The FOMC is projecting slower growth, higher unemployment, and higher inflation vs. the June forecasts. The central bank is prepared to push the economy into a recession to reduce demand and ease inflationary pressures.
——————–
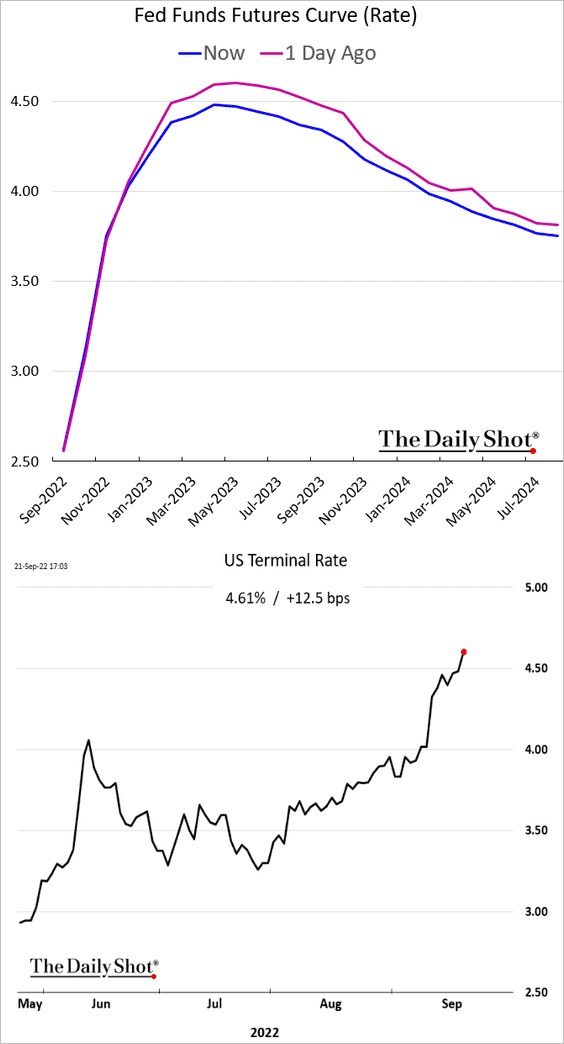
2. Let’s look at how the markets reacted.
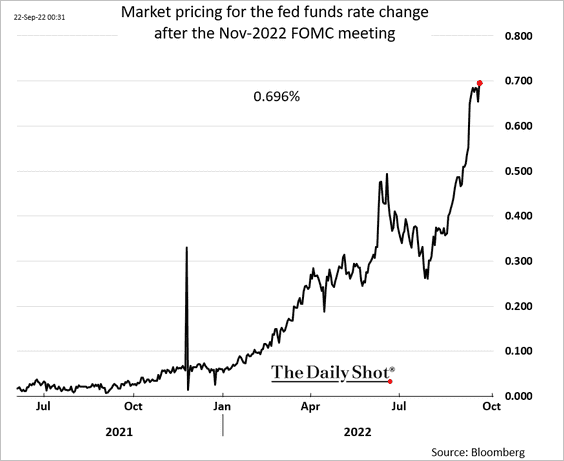
• The market is pricing in a high probability of another 75 bps rate hike in November, …
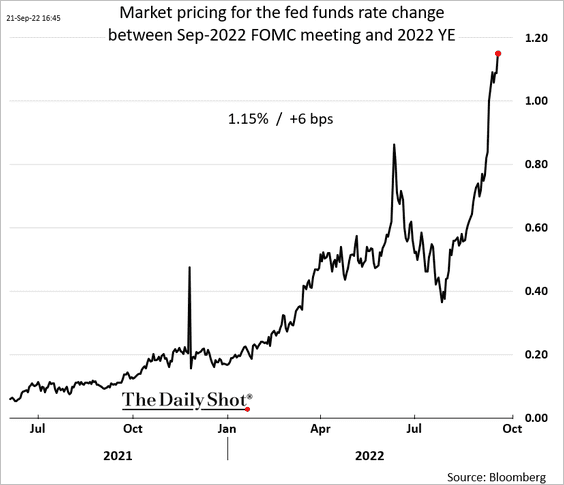
… with a total 115 bps of rate hikes by the end of the year, …
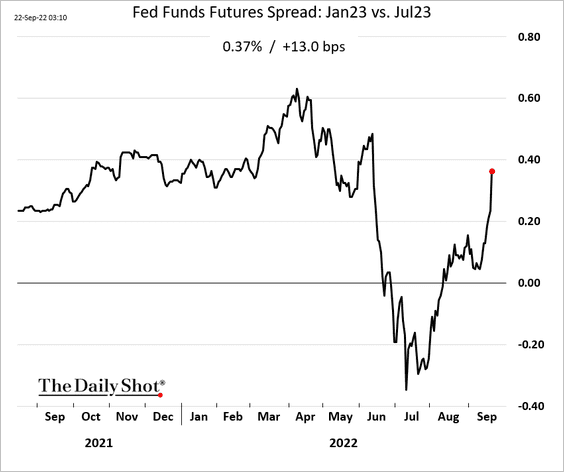
… and more rate increases in the first half of 2023.
• The expected terminal rate climbed above 4.6% (not that far off from the 5% some economists are predicting).
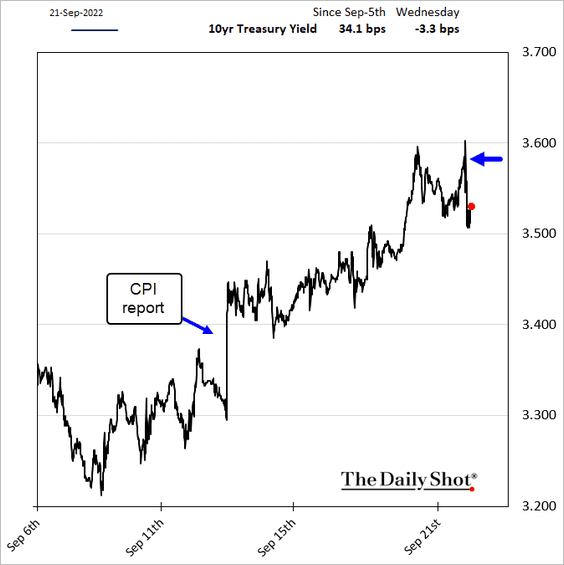
• The 10yr Treasury yield moved lower as the market prices in a recession.
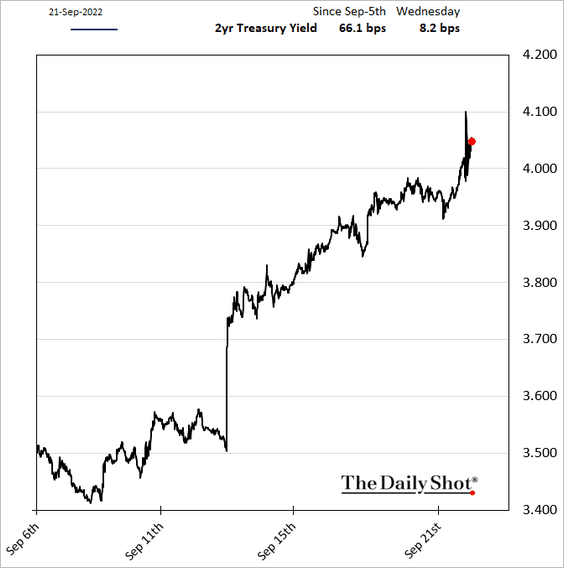
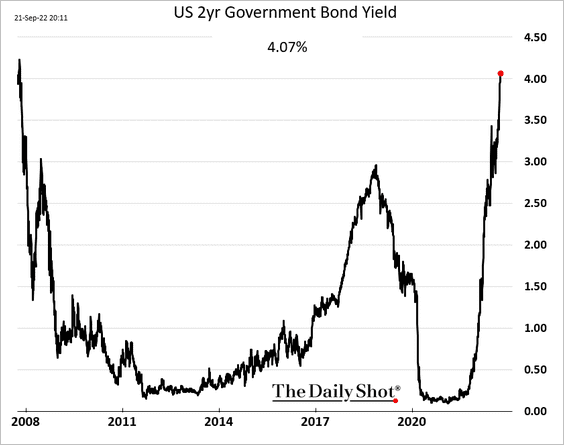
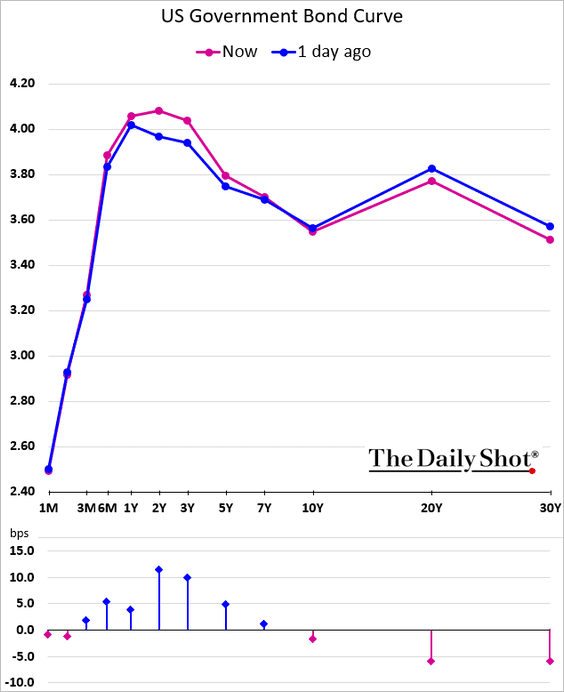
The 2-year yield climbed above 4% for the first time since 2008 (2 charts).
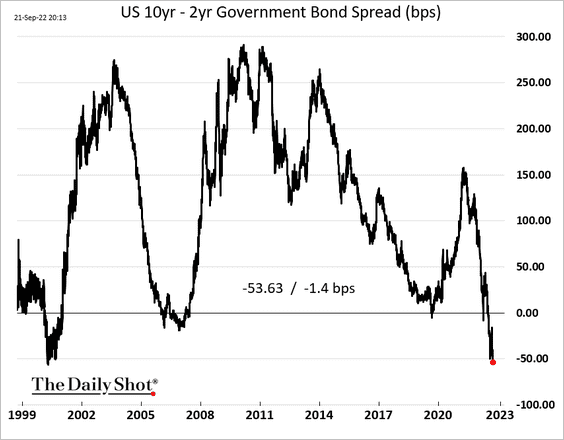
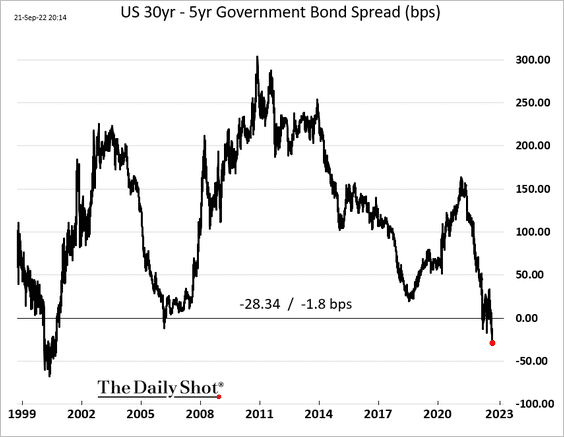
• The yield curve moved deeper into inversion territory (3 charts).
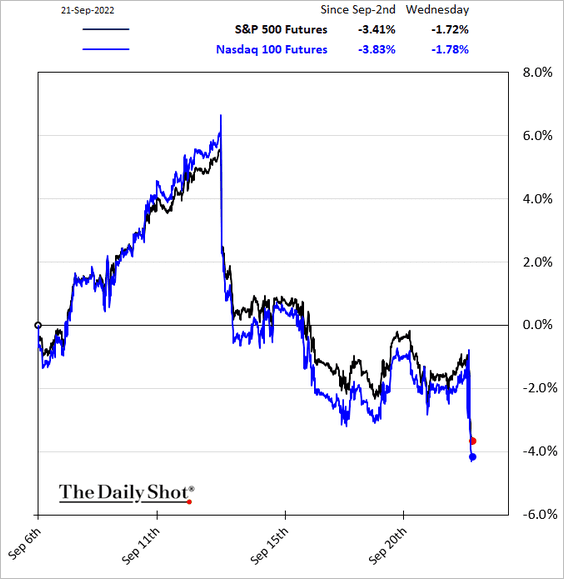
• Stocks tumbled.
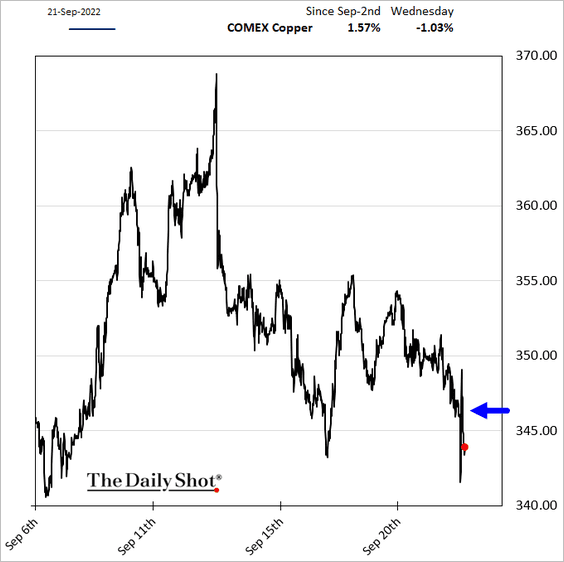
• Metals were down as well.
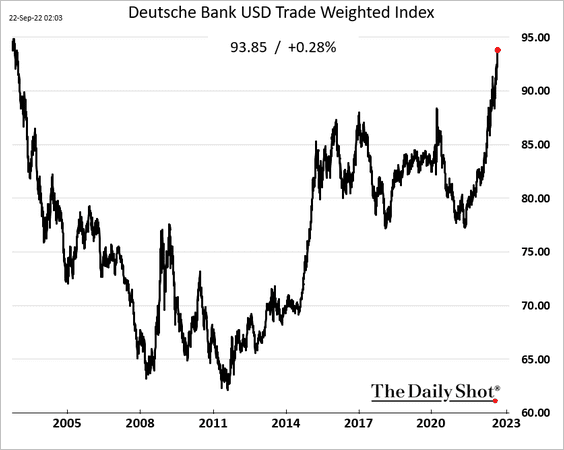
• The US dollar continues to surge (two-decade high).
——————–
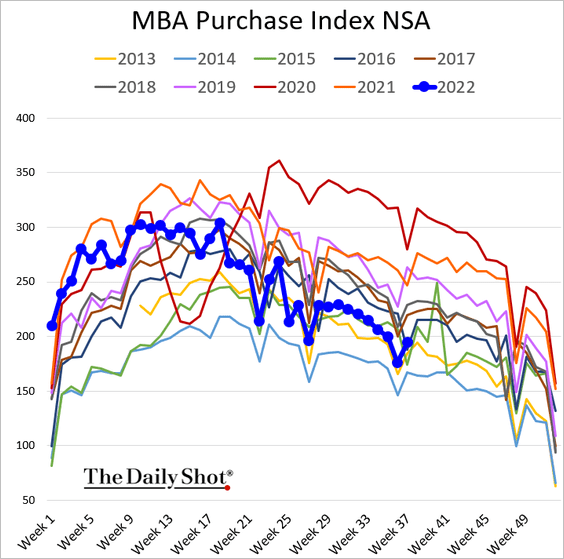
3. The housing market is slowing but not crashing.
• Mortgage applications are slightly above 2013 levels.
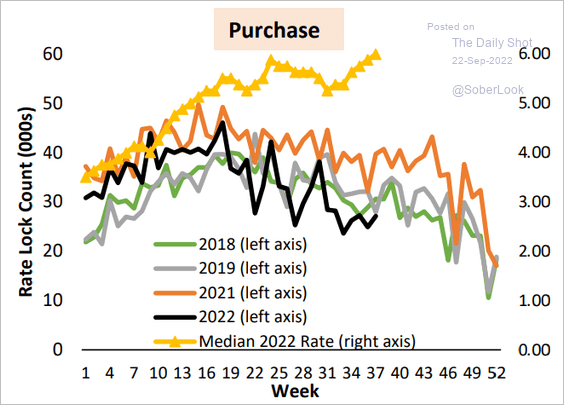
Here is the rate lock count.
 Source: AEI Center on Housing Markets and Finance
• Home price appreciation is easing rapidly.
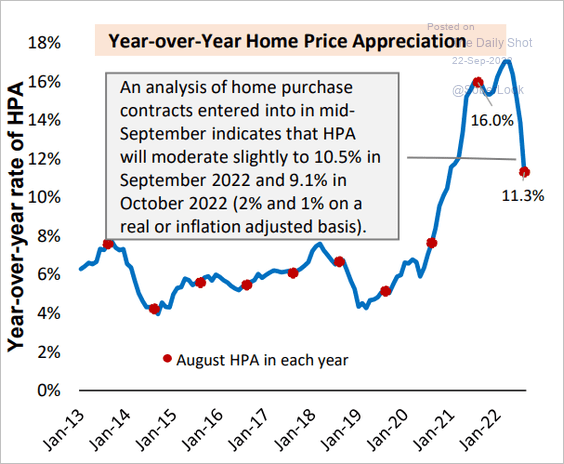 Source: AEI Center on Housing Markets and Finance
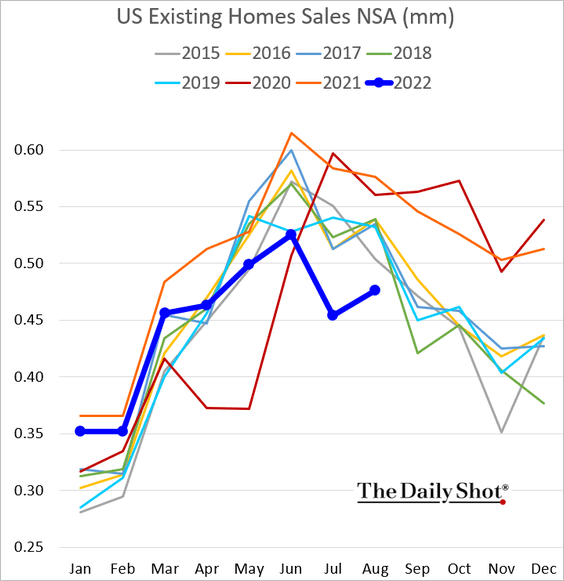
• Existing home sales were stronger than expected (still at multi-year lows for this time of the year).
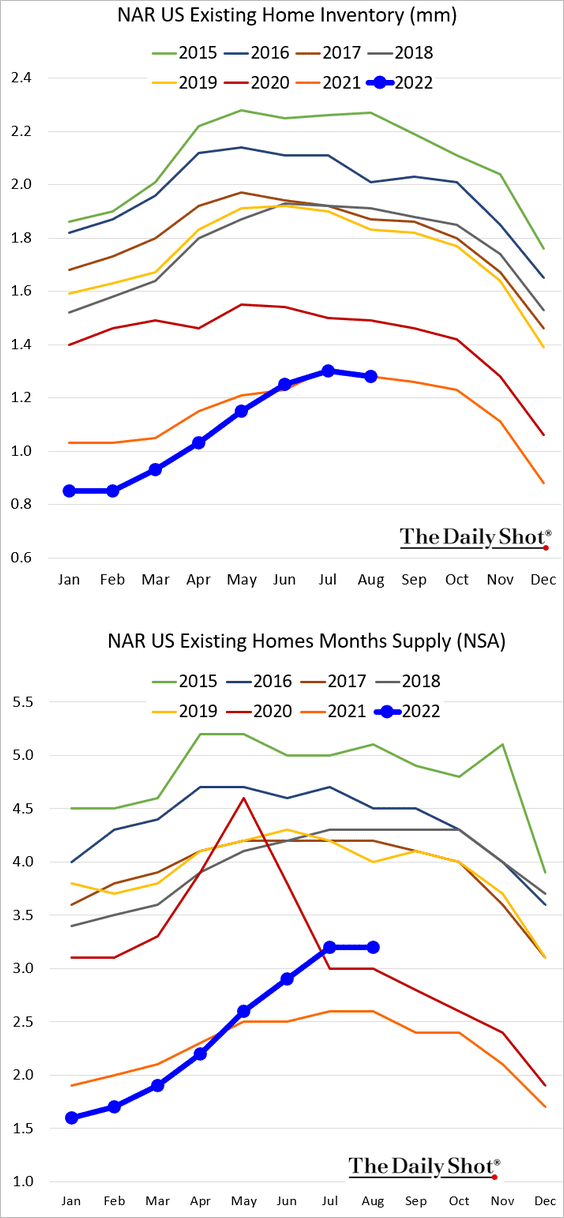
Inventories have risen but remain tight.
There is more pain ahead for home sales.
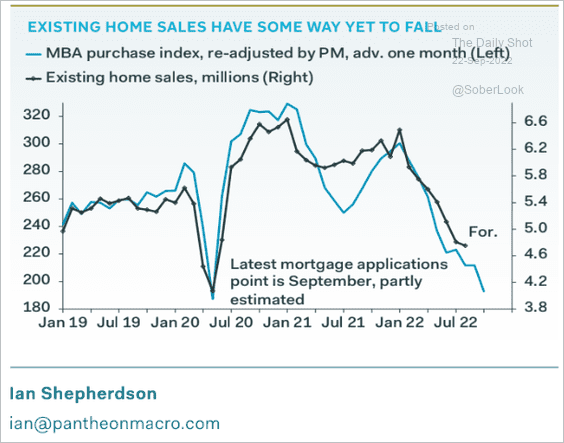 Source: Pantheon Macroeconomics
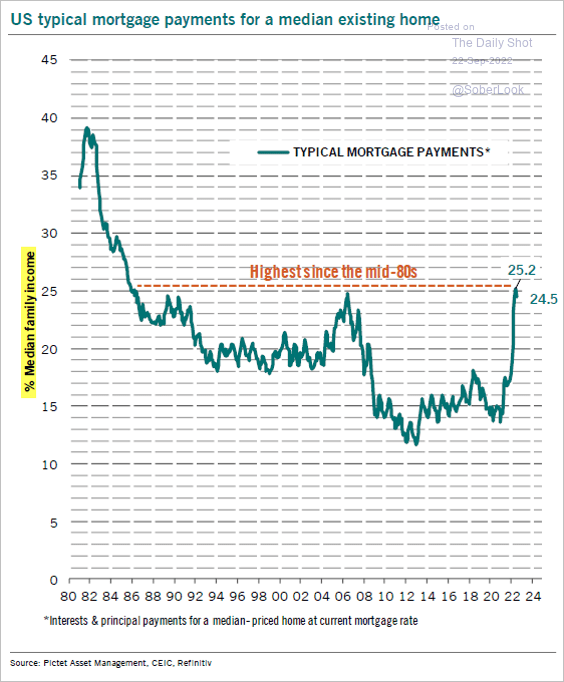
• Mortgage rates continue to surge, …
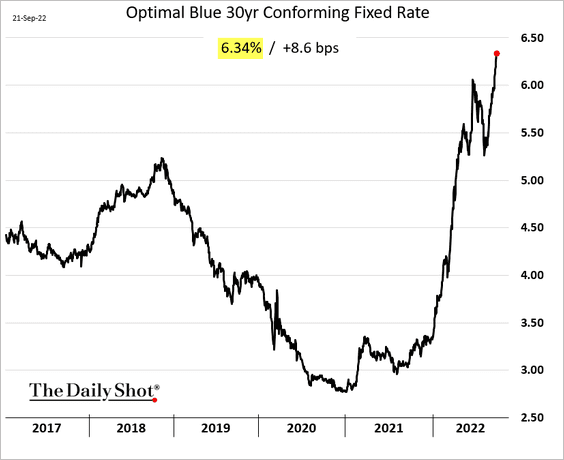
… and affordability is deteriorating.
 Source: @RollinFrederic, @PkZweifel
• Authorized but not started housing projects remain near record highs, especially in multi-family housing.
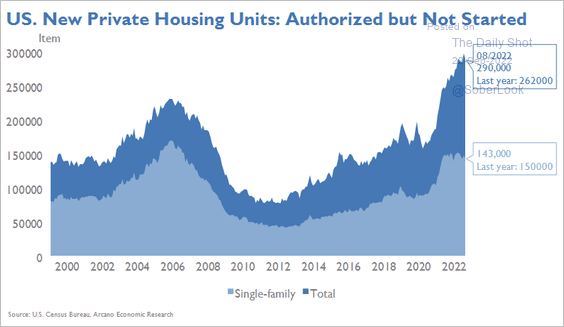 Source: Arcano Economics
• Population-adjusted residential construction has been relatively low since the housing crisis.
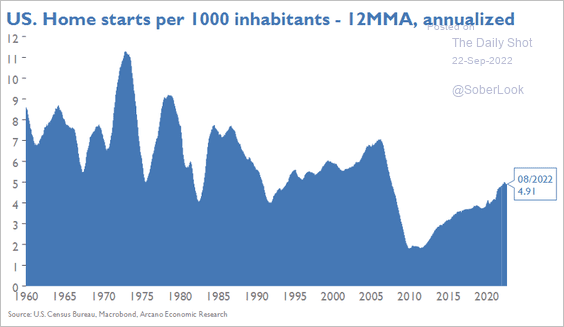 Source: Arcano Economics
——————–
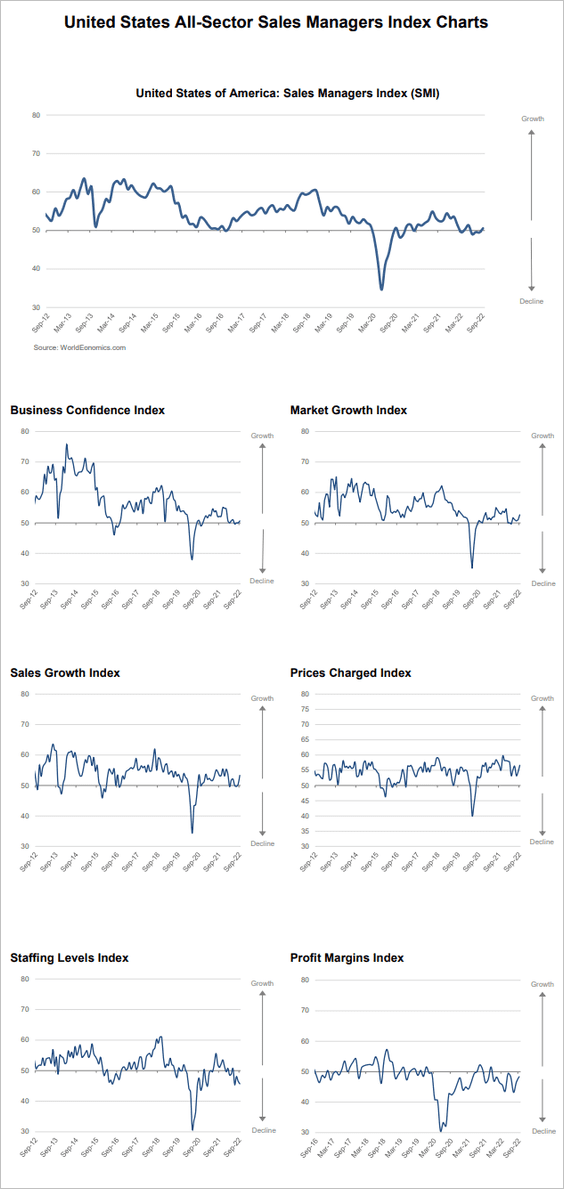
4. According to the Wold Economics SMI report, US business activity is not contracting in September (SMI > 50).
Back to Index
Canada
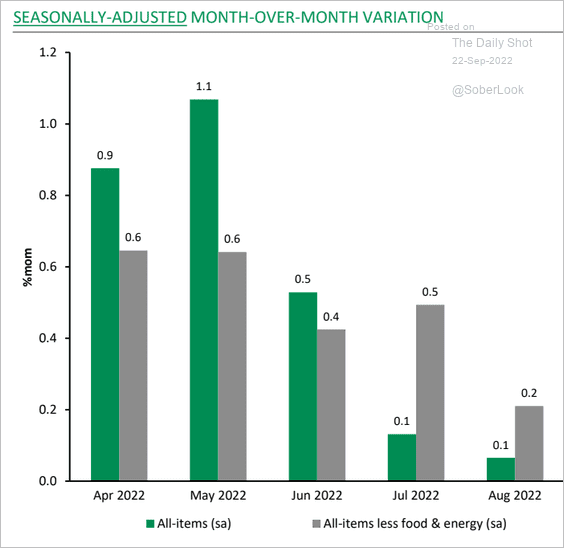
1. The seasonally-adjusted monthly changes in the CPI show moderating price gains.
 Source: Desjardins
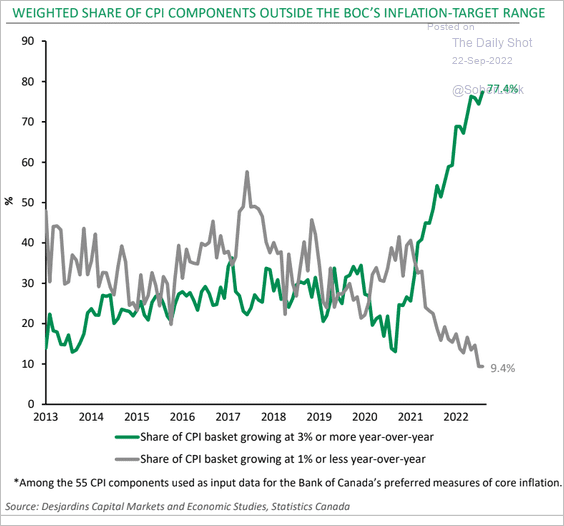
2. Here is the share of CPI items outside of the BoC’s target range.
 Source: Desjardins
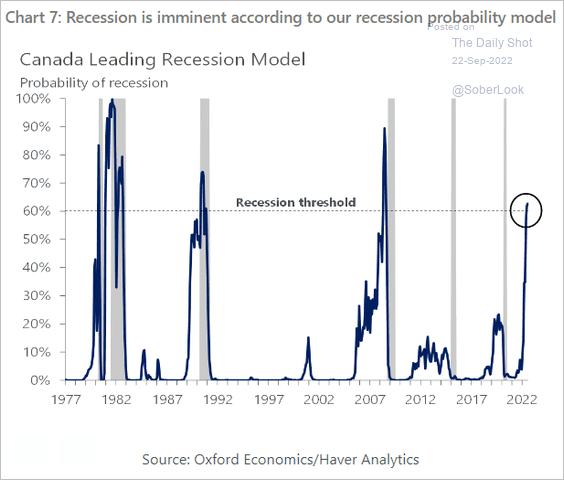
3. The Oxford Economics’ recession probability indicator is above 60%.
 Source: Oxford Economics
4. In the last decade, immigrant workers accounted for almost 85% of Canada’s workforce growth, providing an influx of educated and motivated entrants into the labor force.
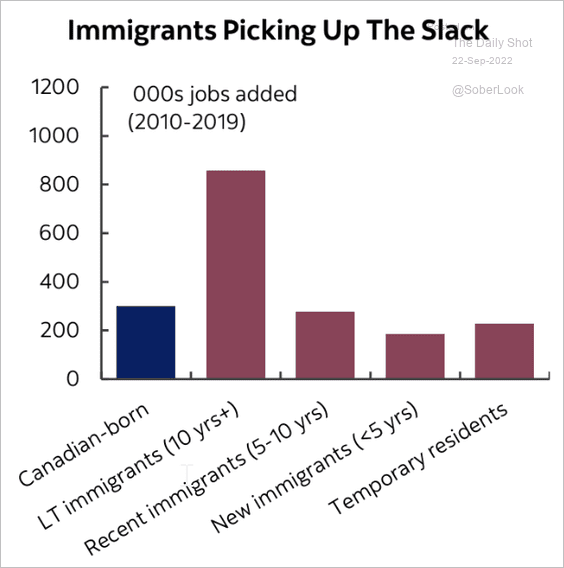 Source: Scotiabank Economics
There is an education pay gap between immigrants and Canadian-born citizens of around $20-25k annually.
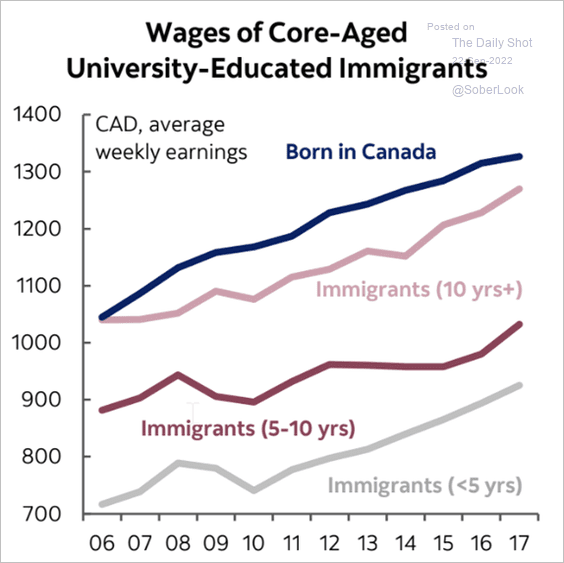 Source: Scotiabank Economics
Back to Index
The United Kingdom.
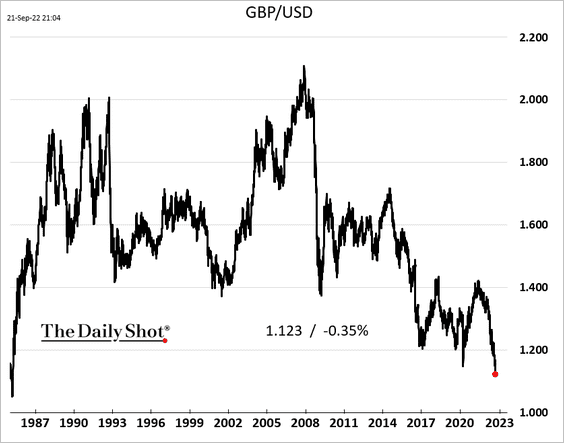
1. The pound is hitting multi-decade lows vs. USD.
2. The CBI orders index was firmer than expected.
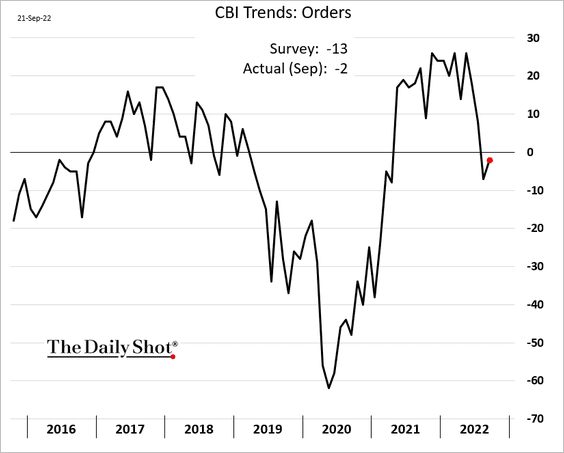
But production expectations are tumbling.
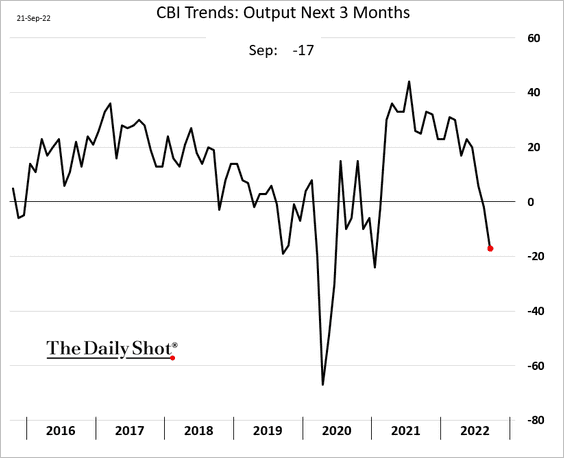
 Source: Reuters Read full article
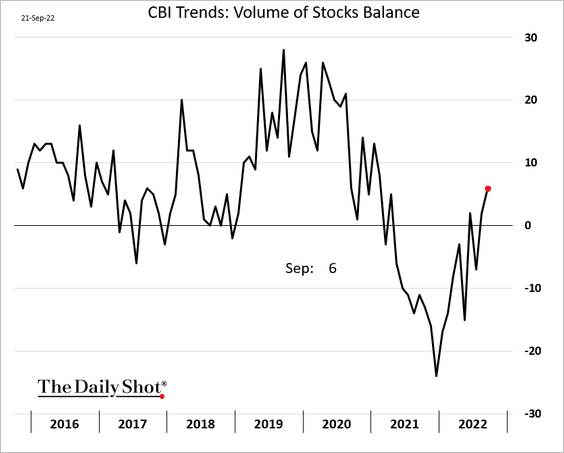
Companies expect to keep boosting prices, …
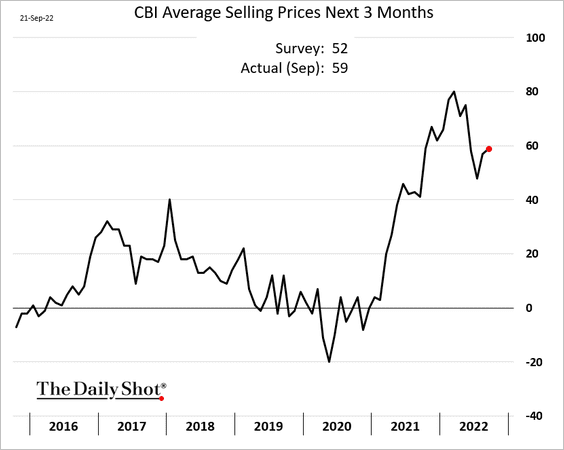
… despite normalizing inventories.
——————–
3. Government borrowing exceeded expectations. And there is much more to come.
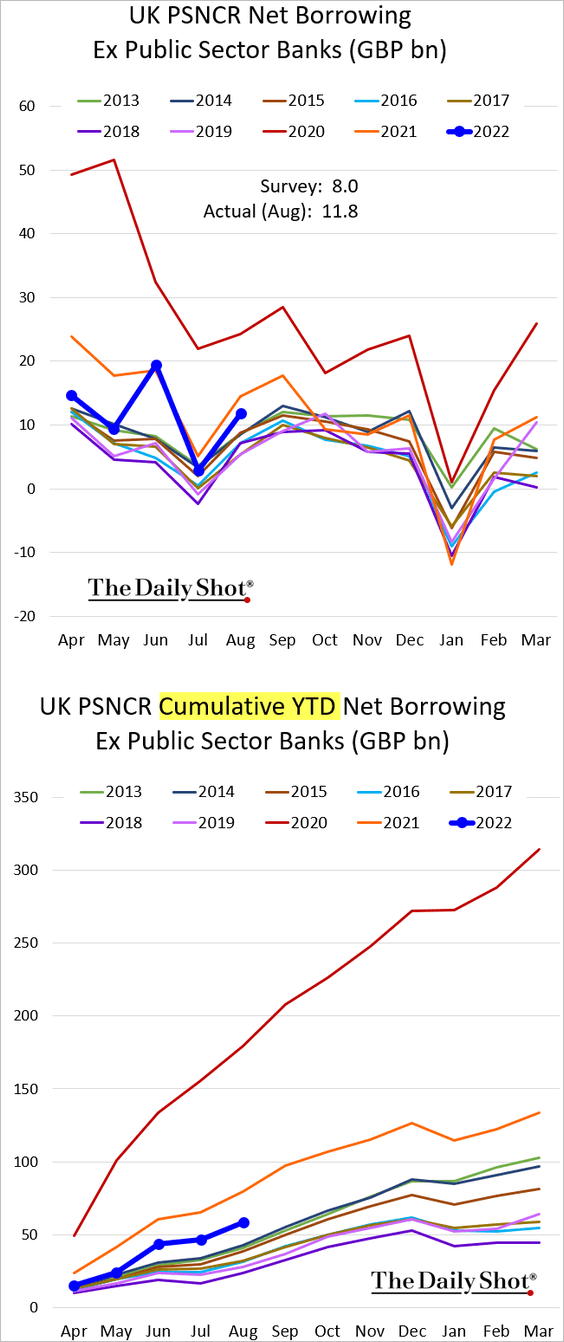
 Source: iNews Read full article
——————–
4. This chart shows the UK’s shift from a two-party system.
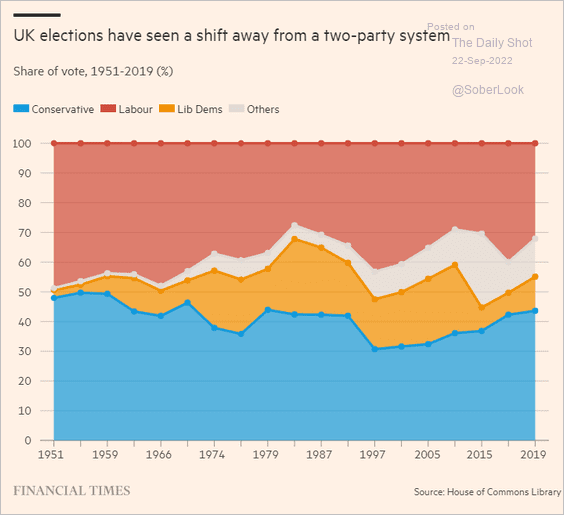 Source: @financialtimes Read full article
Back to Index
The Eurozone
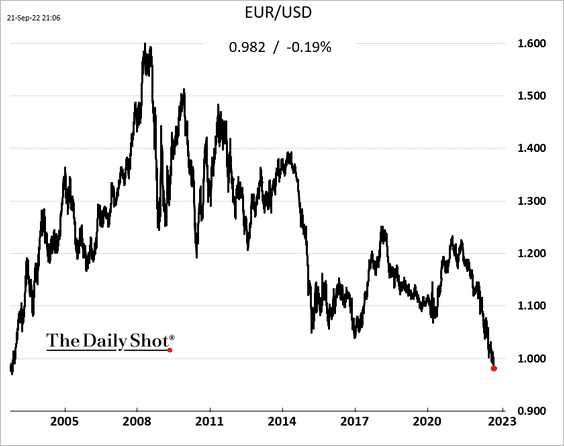
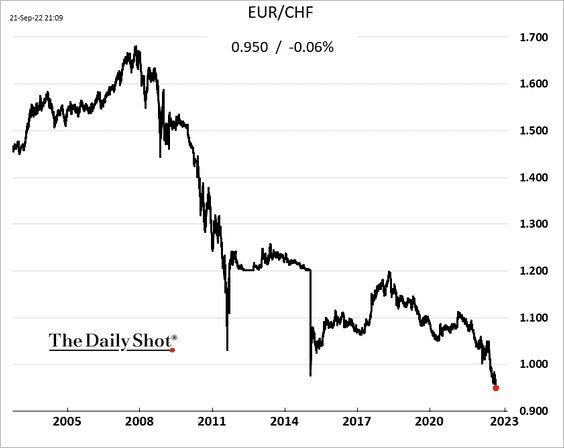
1. The euro continues to tumble.
• vs. the dollar:
• vs. the Swiss franc:
——————–
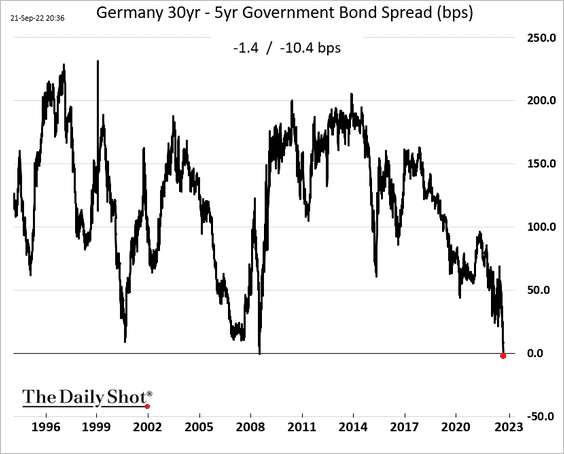
2. Germany’s yield curve keeps flattening and is starting to invert in some parts.
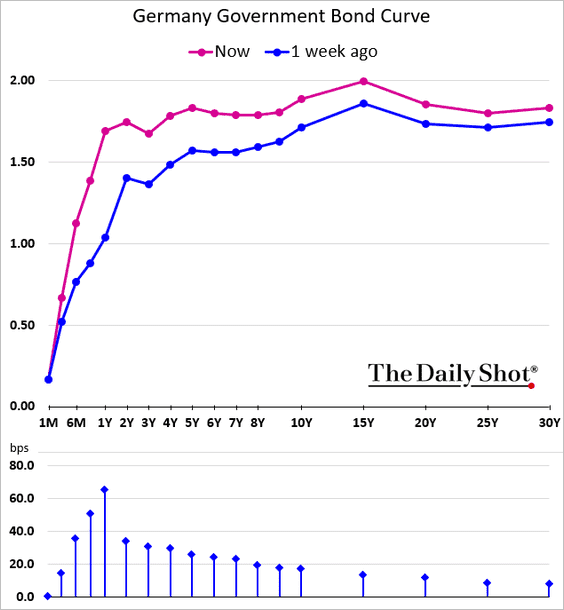
Here is the 30yr – 5yr spread.
——————–
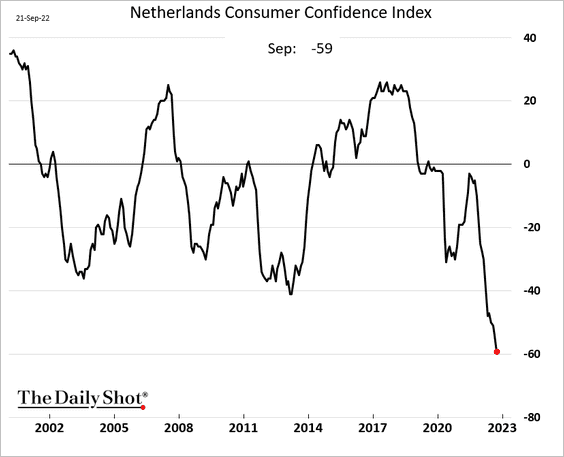
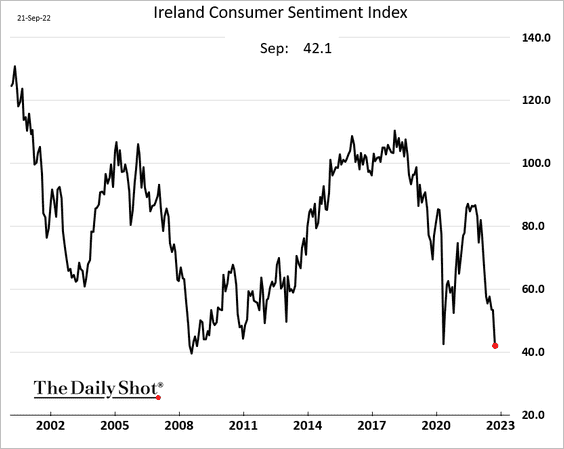
3. Sentiment continues to deteriorate.
• The Netherlands:
• Ireland:
——————–
4. These charts show the share of natural gas consumption by sector and the share of energy generation by source.
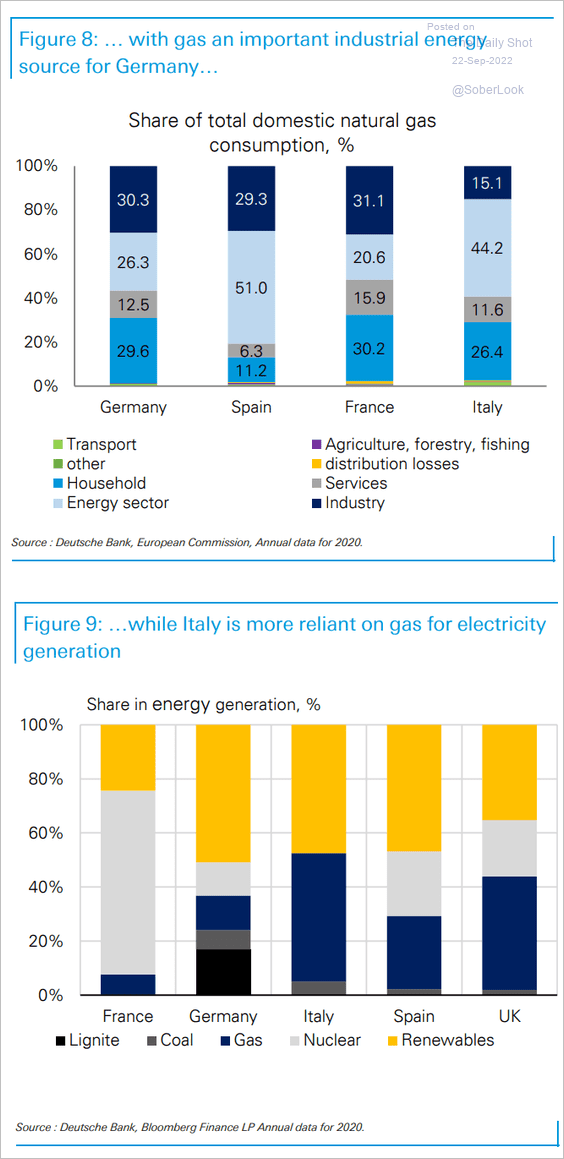 Source: Deutsche Bank Research
Back to Index
Asia – Pacific
1. Japan’s rent inflation remains subdued.
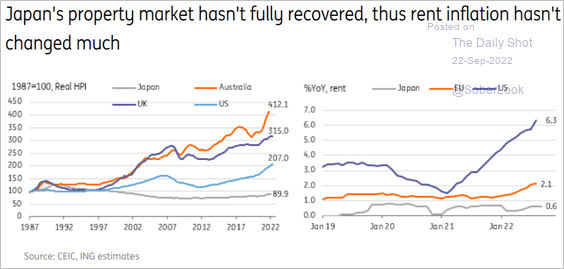 Source: ING
2. Here is South Korea’s GDP per capita vs. the OECD average.
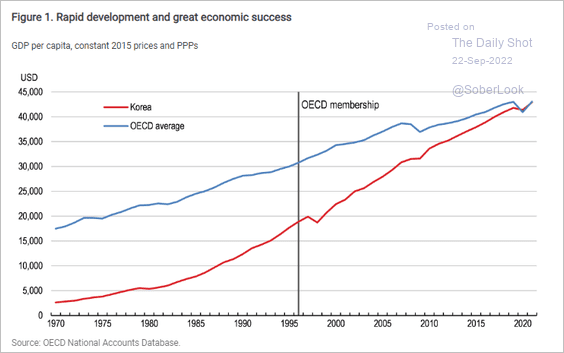 Source: OECD Read full article
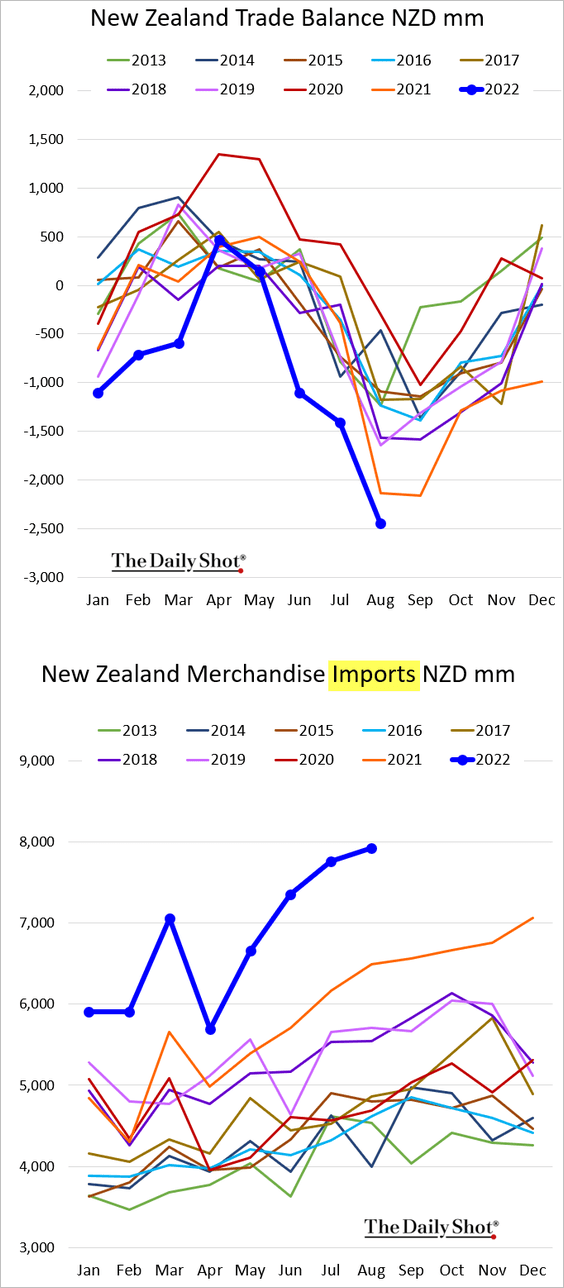
3. New Zealand’s trade gap hit a new record as energy costs surge.
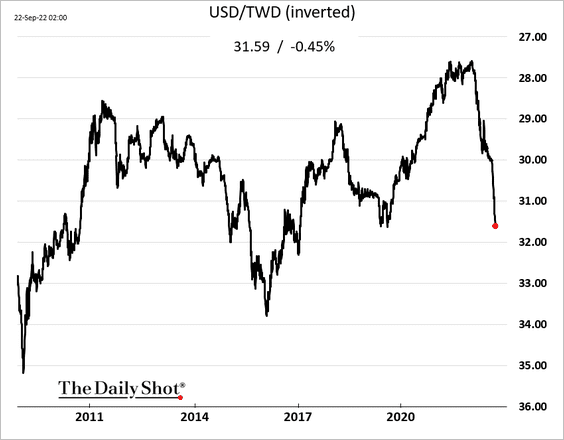
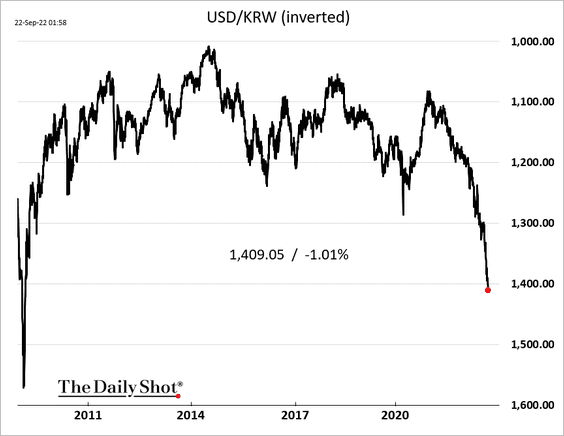
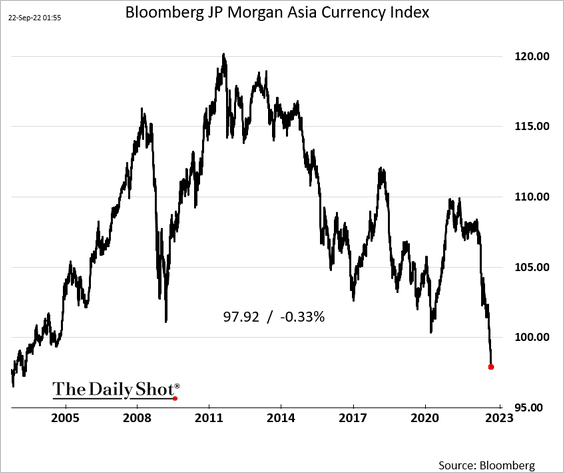
4. Asian currencies are tumbling vs. USD.
• The Tawian dollar:
• The South Korean won:
• Bloomberg’s Asia currency index:
Back to Index
China
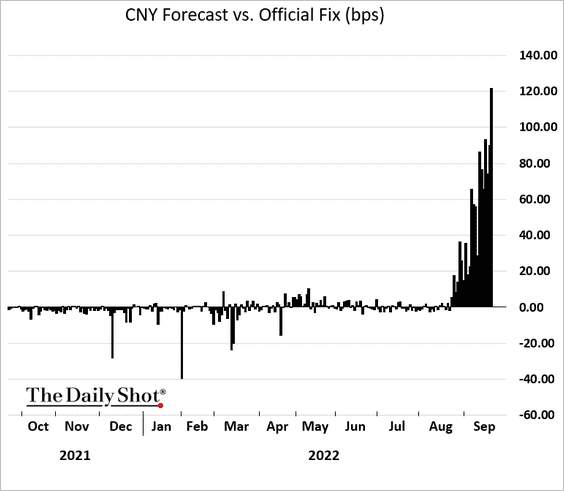
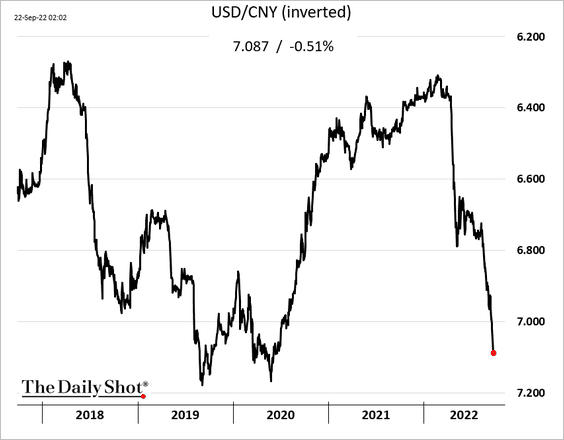
1. The PBoC has lost control of the renmonbi.
——————–
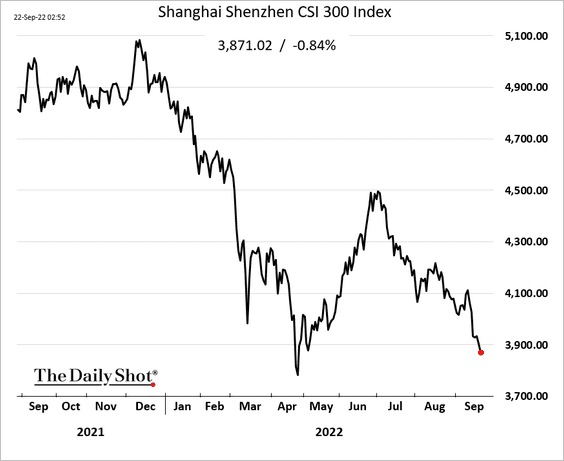
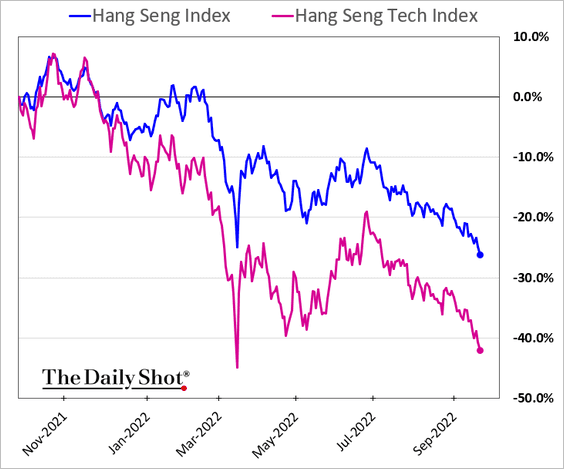
2. The stock market remains under pressure.
——————–
3. The World Economics SMI report shows further deterioration in business activity this month.
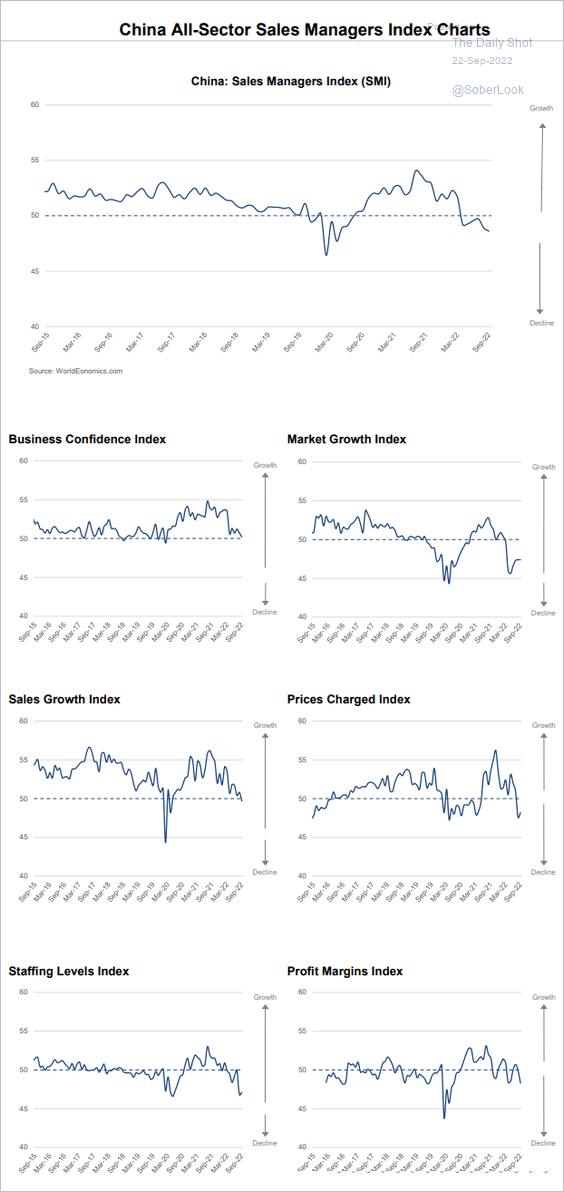 Source: World Economics
4. China is facing disinflation.
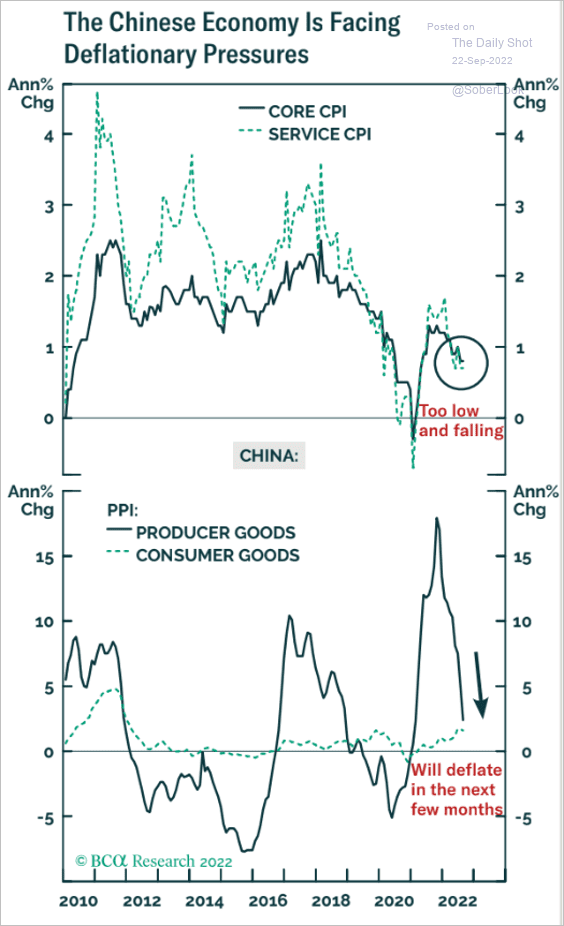 Source: BCA Research
5. Hybrid firms (state and private ownership) are better able to access long-term financing than private firms.
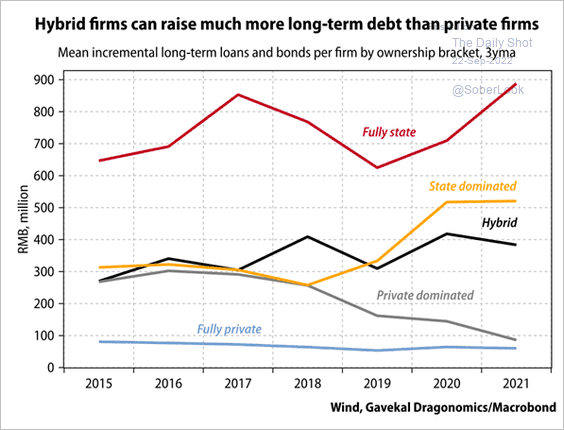 Source: Gavekal Research
Back to Index
Emerging Markets
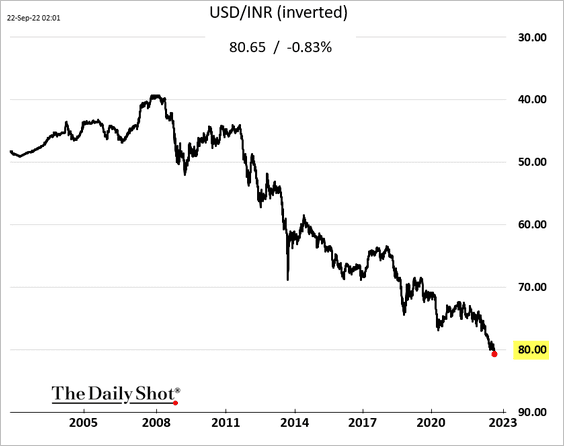
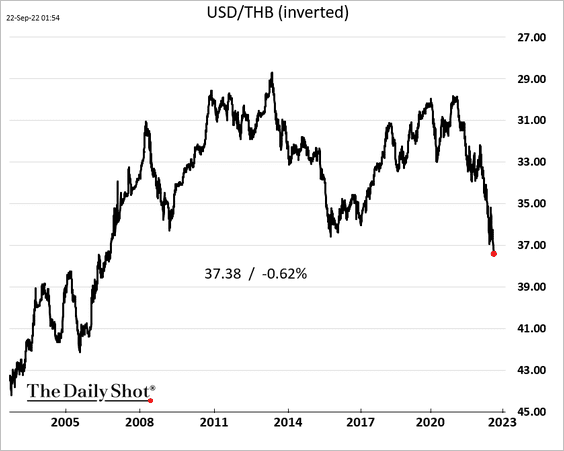
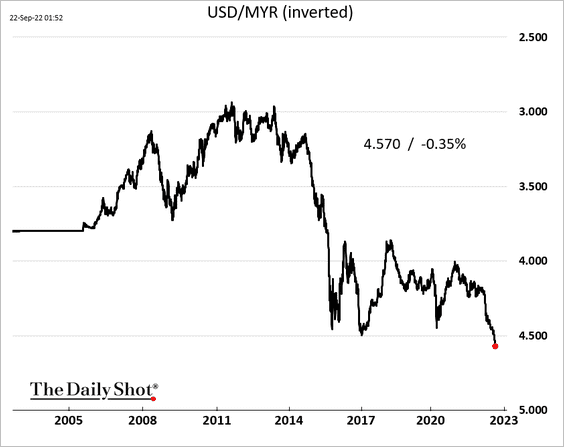
1. Asian currencies are hitting multi-year lows vs. USD.
• The Indian rupee (record low):
• The Thai baht:
• The Malaysian ringgit:
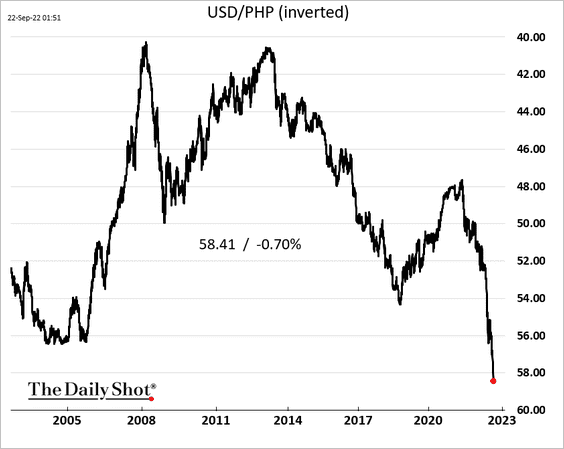
• The Philippine peso:
——————–
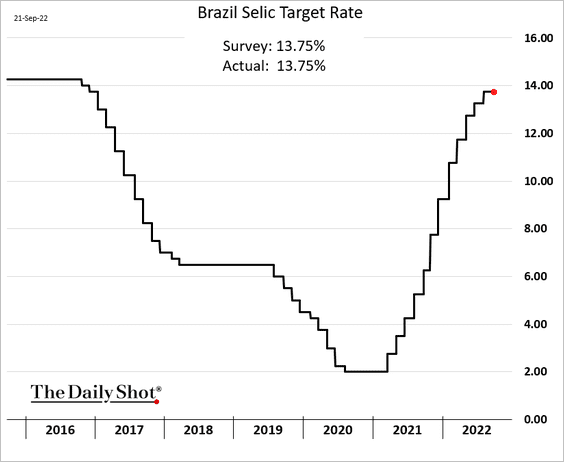
2. Brazil’s central bank is on hold (is the cycle over?).
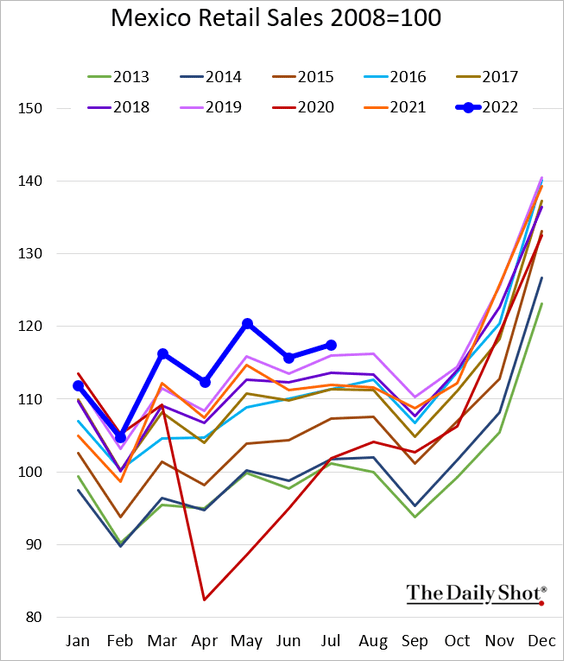
3. Mexican retail sales have been holding up.
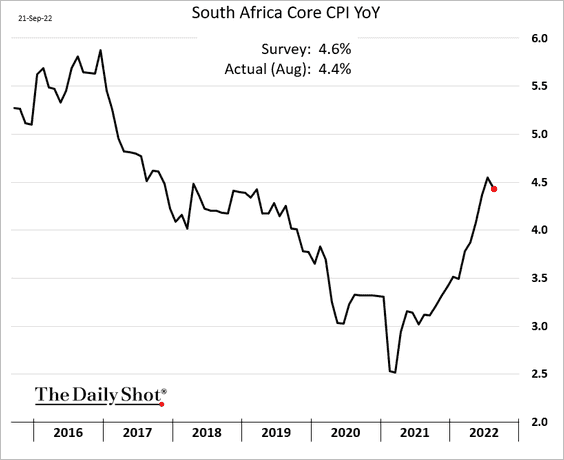
4. South Africa’s core inflation unexpectedly declined.
Back to Index
Energy
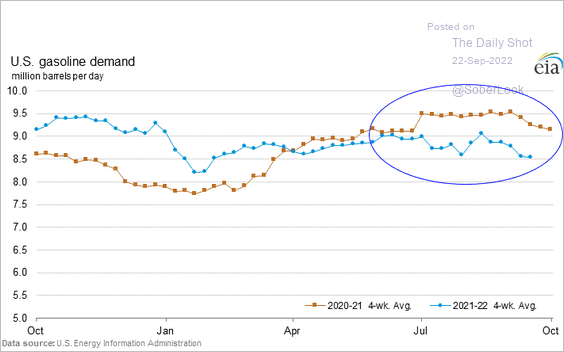
1. US refined product demand has softened despite lower prices.
• Gasoline:
• Distillates (diesel, heating oil, etc.):
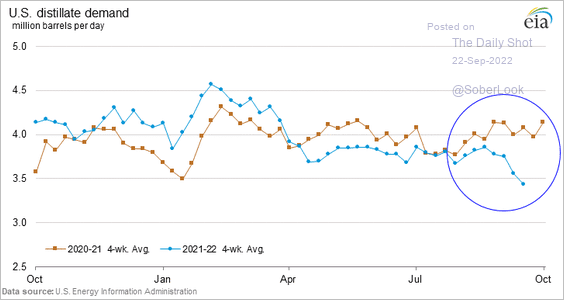 Source: EIA
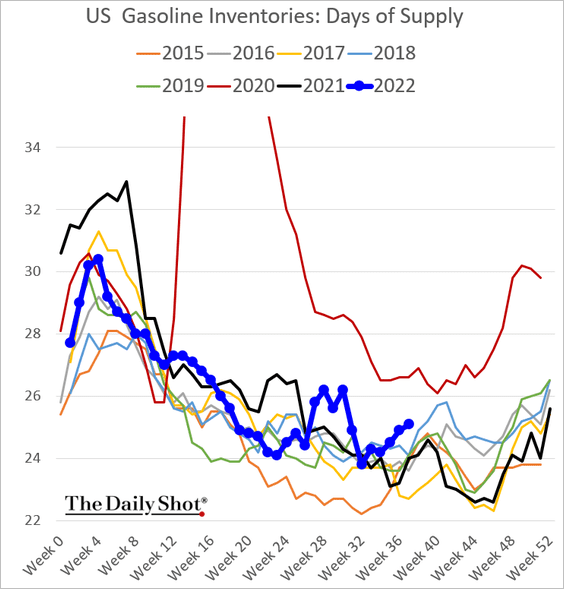
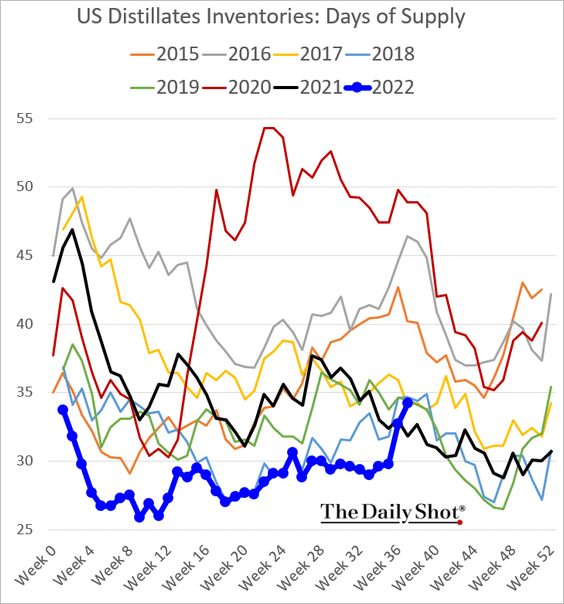
As a result, inventories have risen when measured in days of supply.
——————–
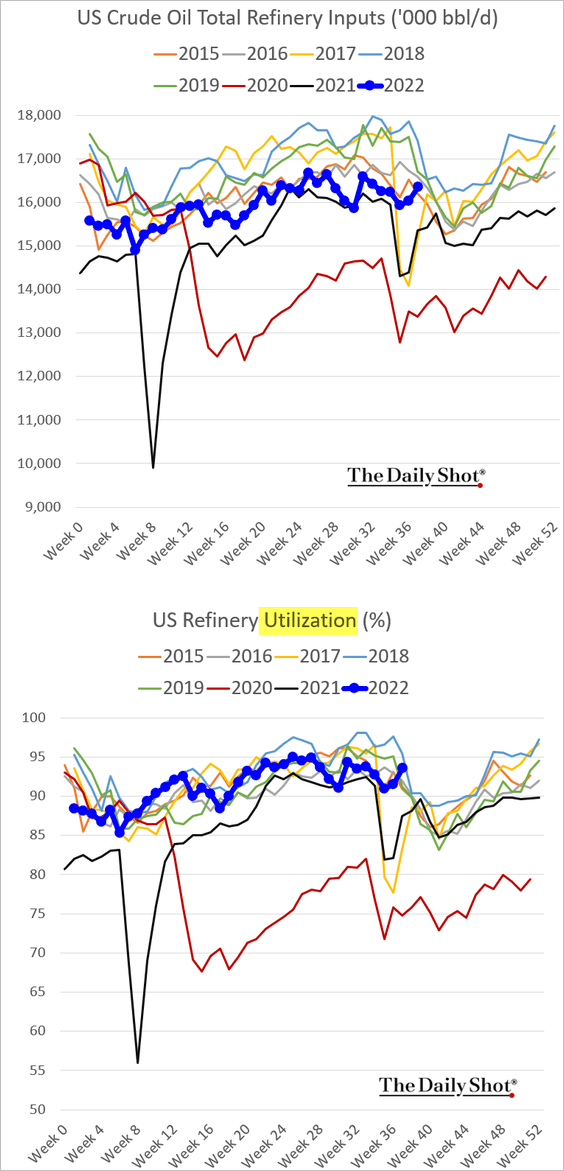
2. Refinery inputs are rebounding.
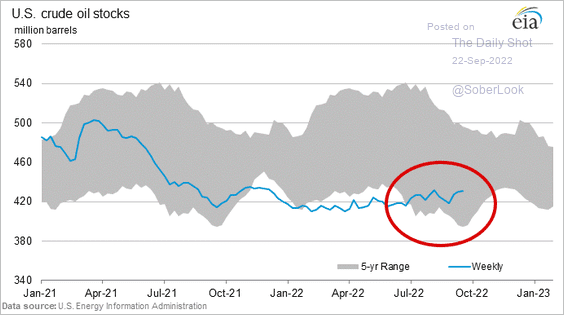
3. US oil inventories remain well inside the five-year range.
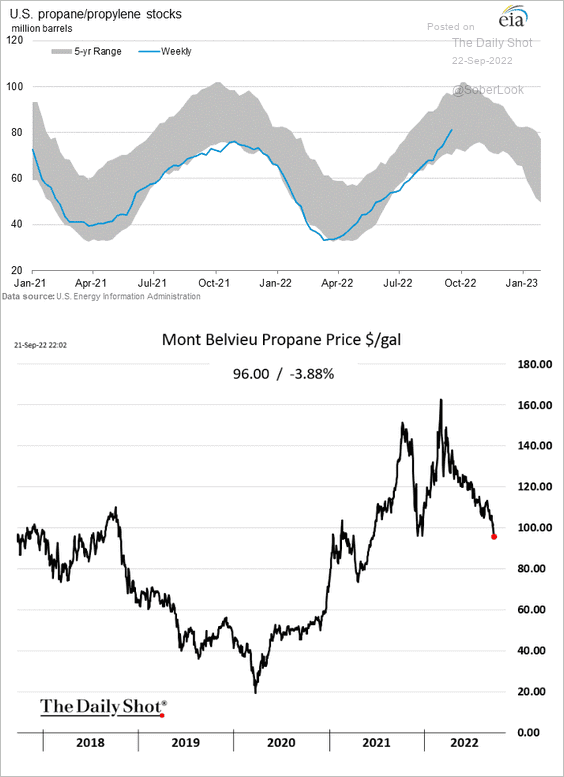
4. US Propane inventories are rebounding, which should help ease heating bills in parts of the country.
5. European natural gas futures jumped after Putin ordered partial mobilization but retreated shortly after amid ample inventories.
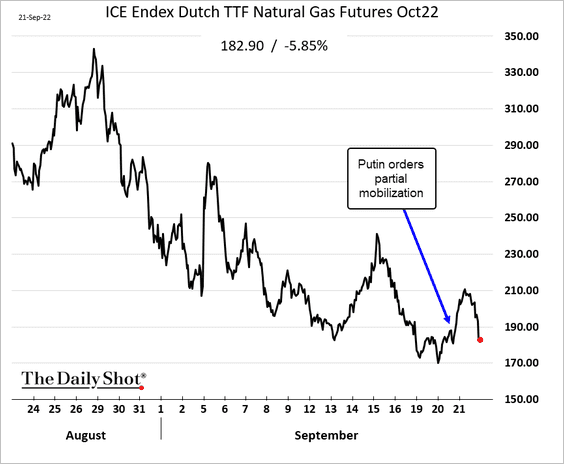
Europe is substituting some of the Russian gas with LNG.
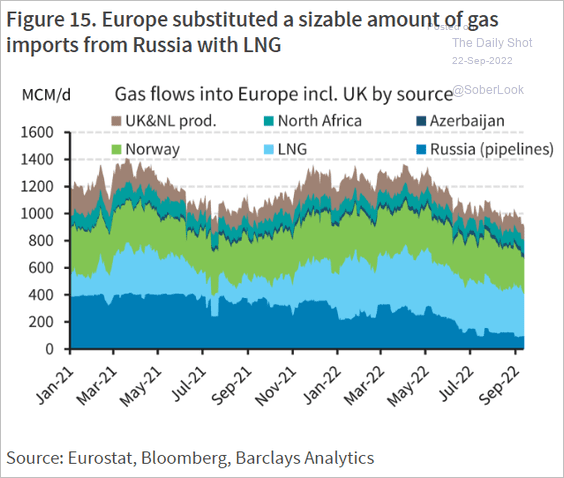 Source: Barclays Research
Back to Index
Equities
1. Retail investors continue to buy as institutions exit.
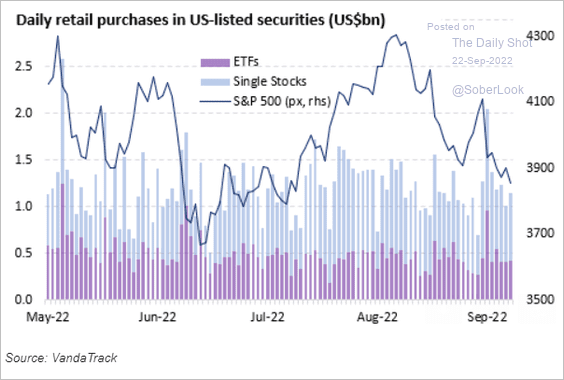 Source: Vanda Research
But retail trading volume is lower, …
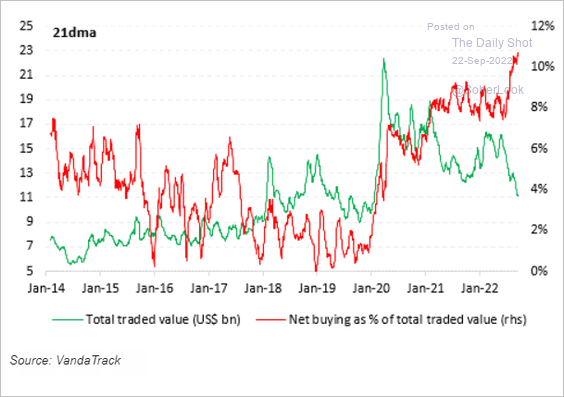 Source: Vanda Research
… as the Reddit crowd goes quiet.
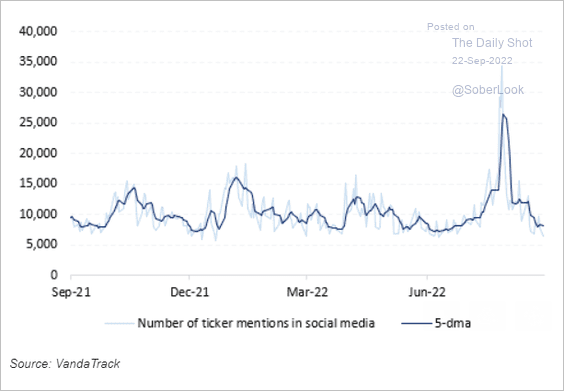 Source: Vanda Research
——————–
2. Time for another leg down in earnings estimates?
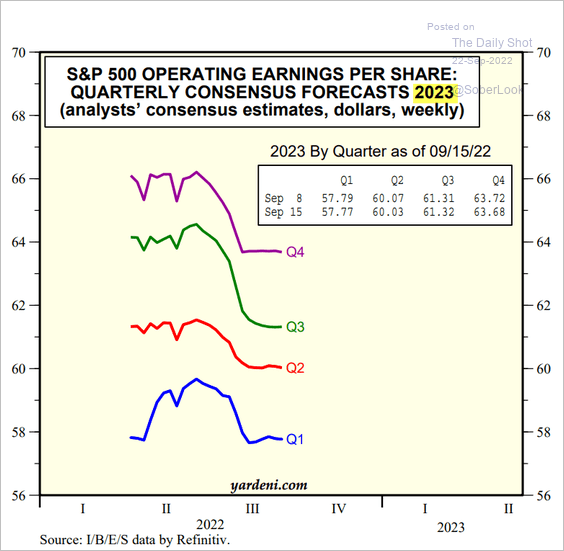 Source: Yardeni Research
Here is the evolution of earnings estimates by sector.
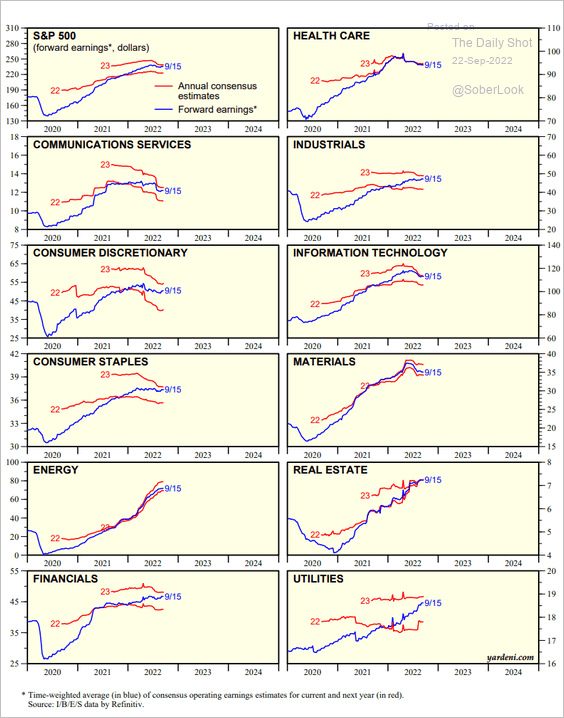 Source: Yardeni Research
——————–
3. Regional Fed manufacturing reports point to rapid declines in margins.
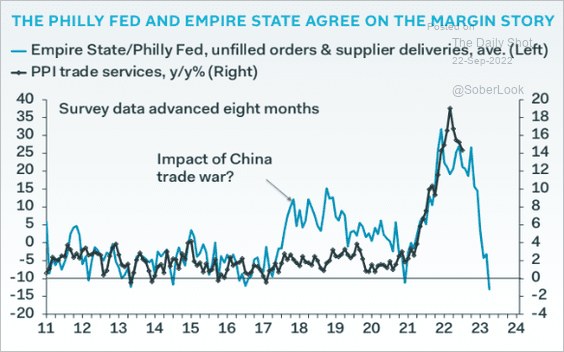 Source: Pantheon Macroeconomics
4. Cyclical sector earnings have remained elevated.
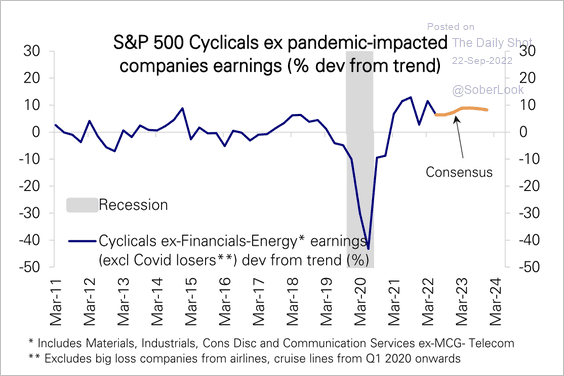 Source: Deutsche Bank Research
5. Skew levels have been high on individual stocks (driven by demand for out-of-the-money puts relative to calls), even as index skew reaches multi-year lows.
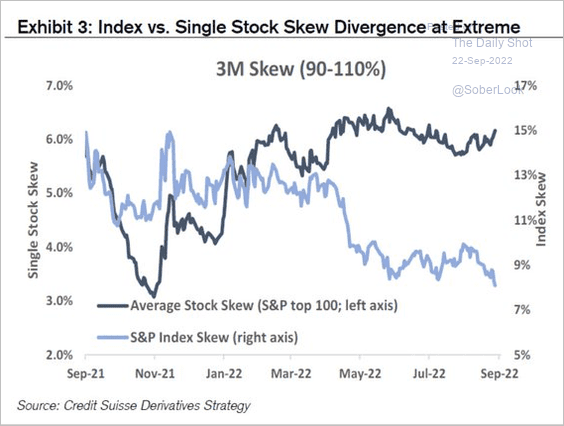 Source: @DiMartinoBooth, @business, @CreditSuisse
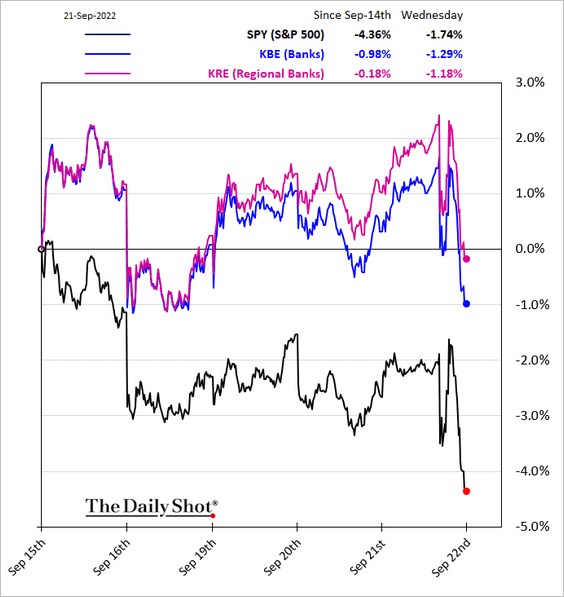
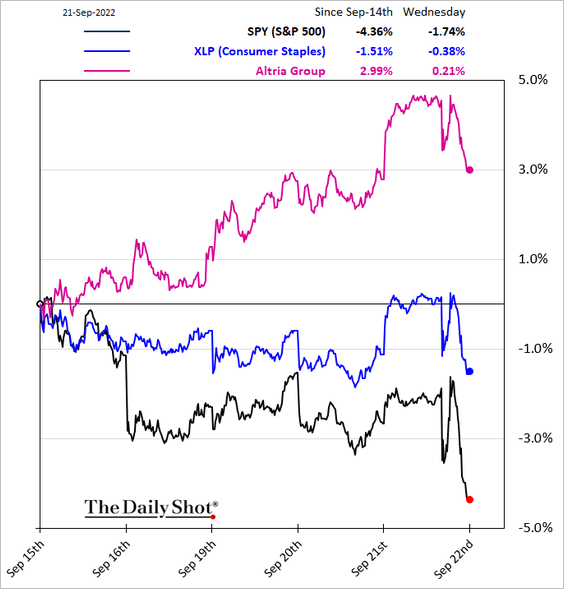
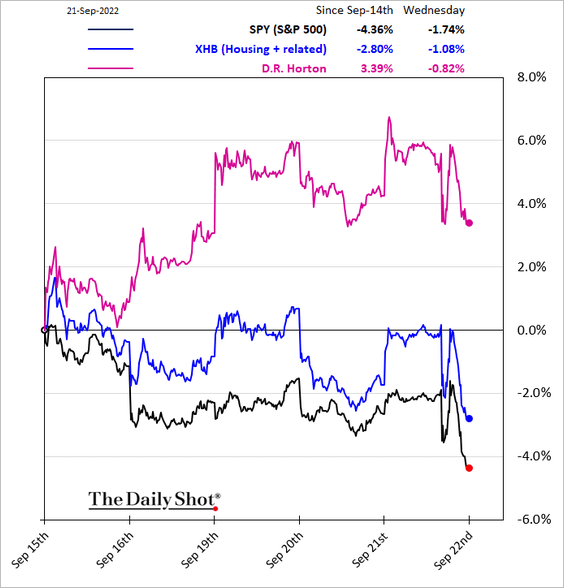
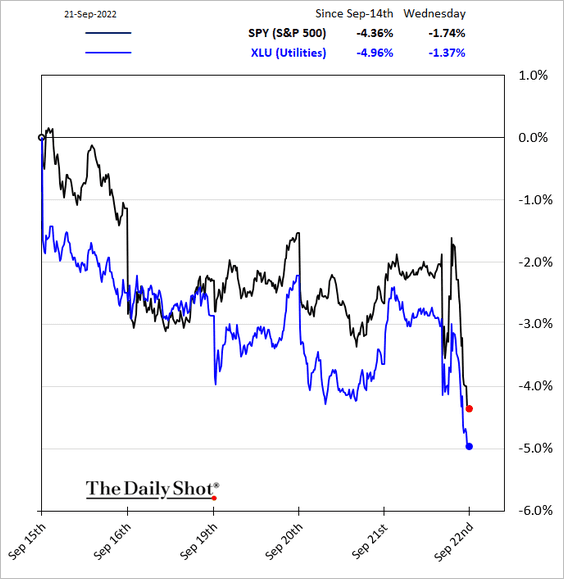
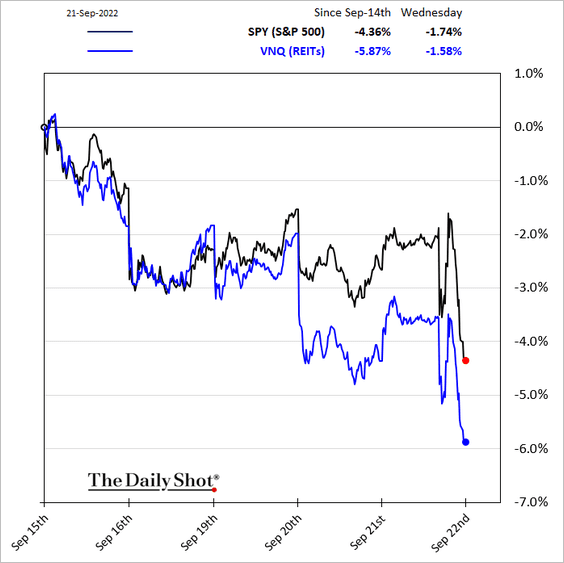
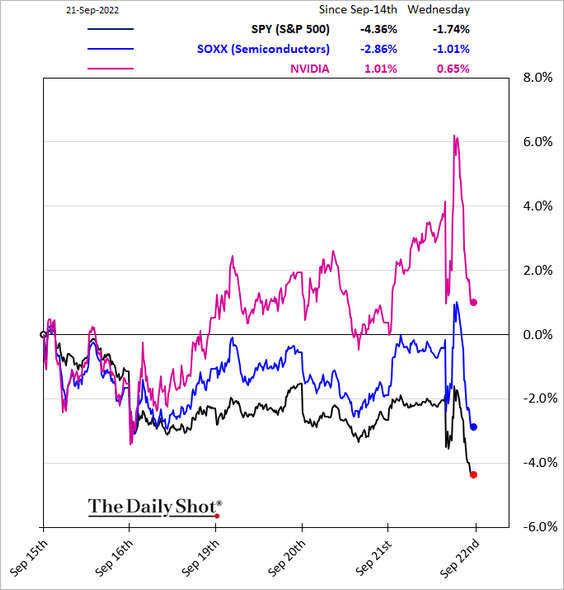
6. Next, we have some sector performance updates (over the past five business days).
• Banks:
• Consumer Staples:
• Housing:
• Transportation/logistics:
![]()
• Energy:
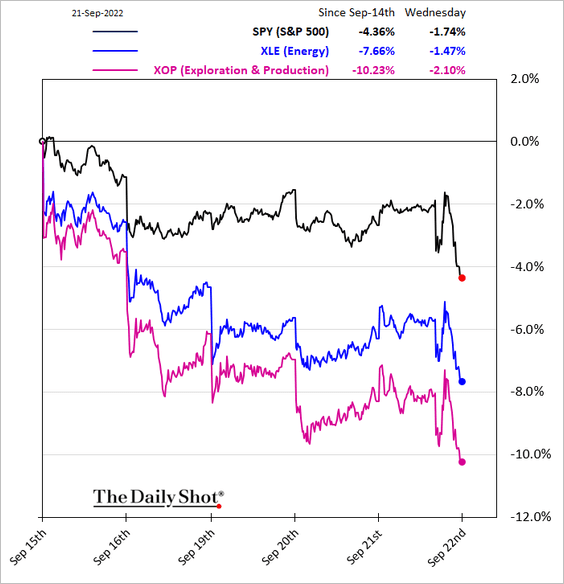
• Utilities:
• REITs:
• Semiconductors:
• Communication Services:
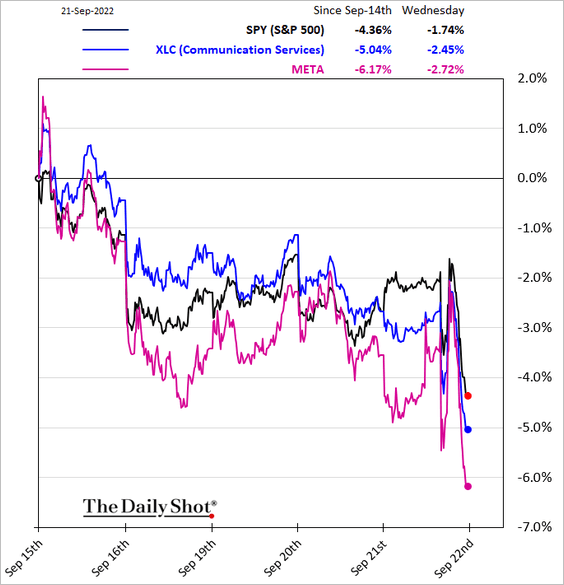
——————–
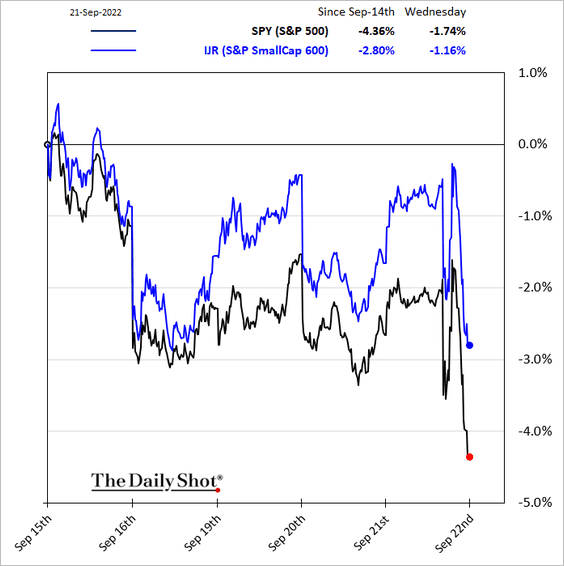
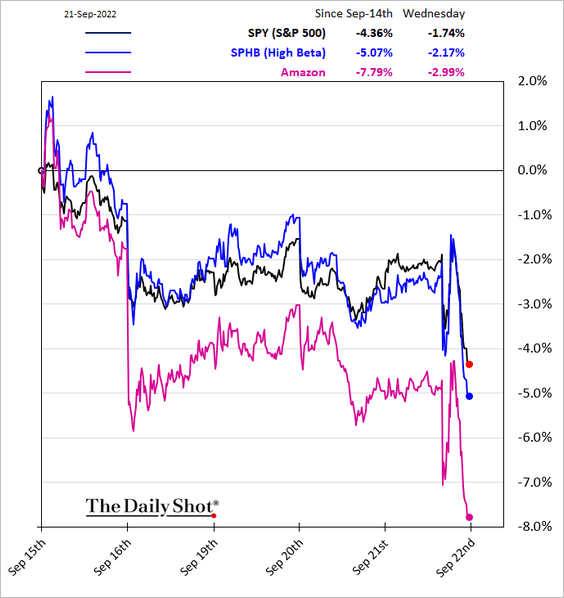
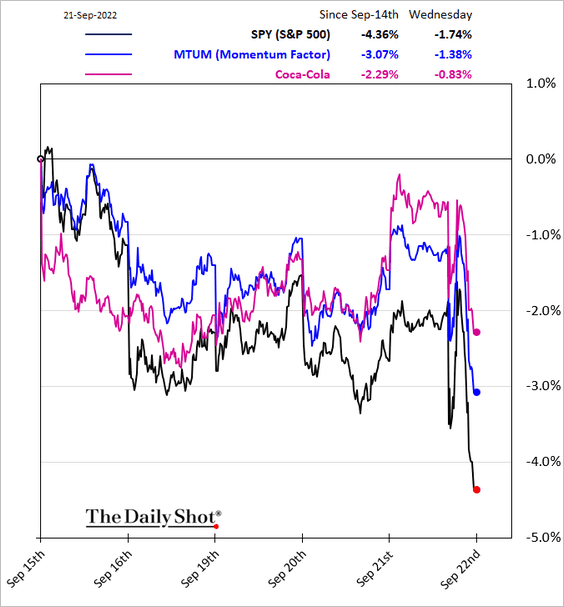
7. Finally, here are some equity factor charts.
• Small caps (S&P 600):
• High-beta:
• Momentum:
Back to Index
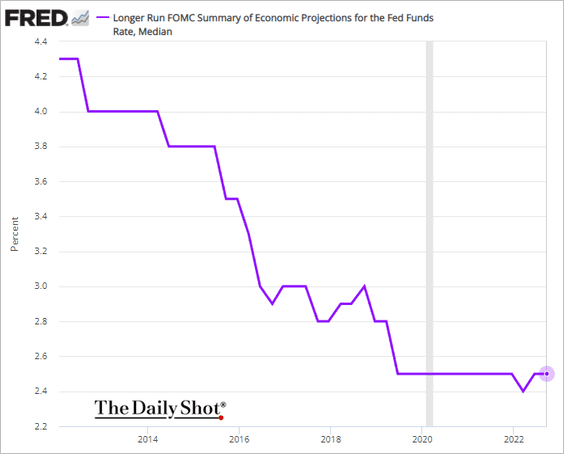
Rates
1. The FOMC still sees the nominal neutral rate at 2.5%.
2. SOFR derivatives are taking off.
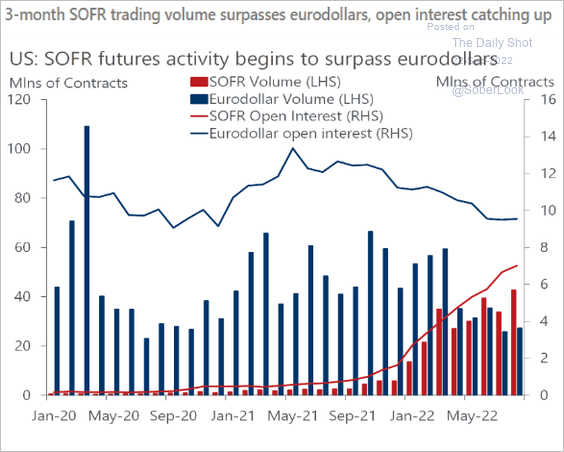 Source: Oxford Economics
——————–
Food for Thought
1. Visualizing the income statements of the largest US tech firms:
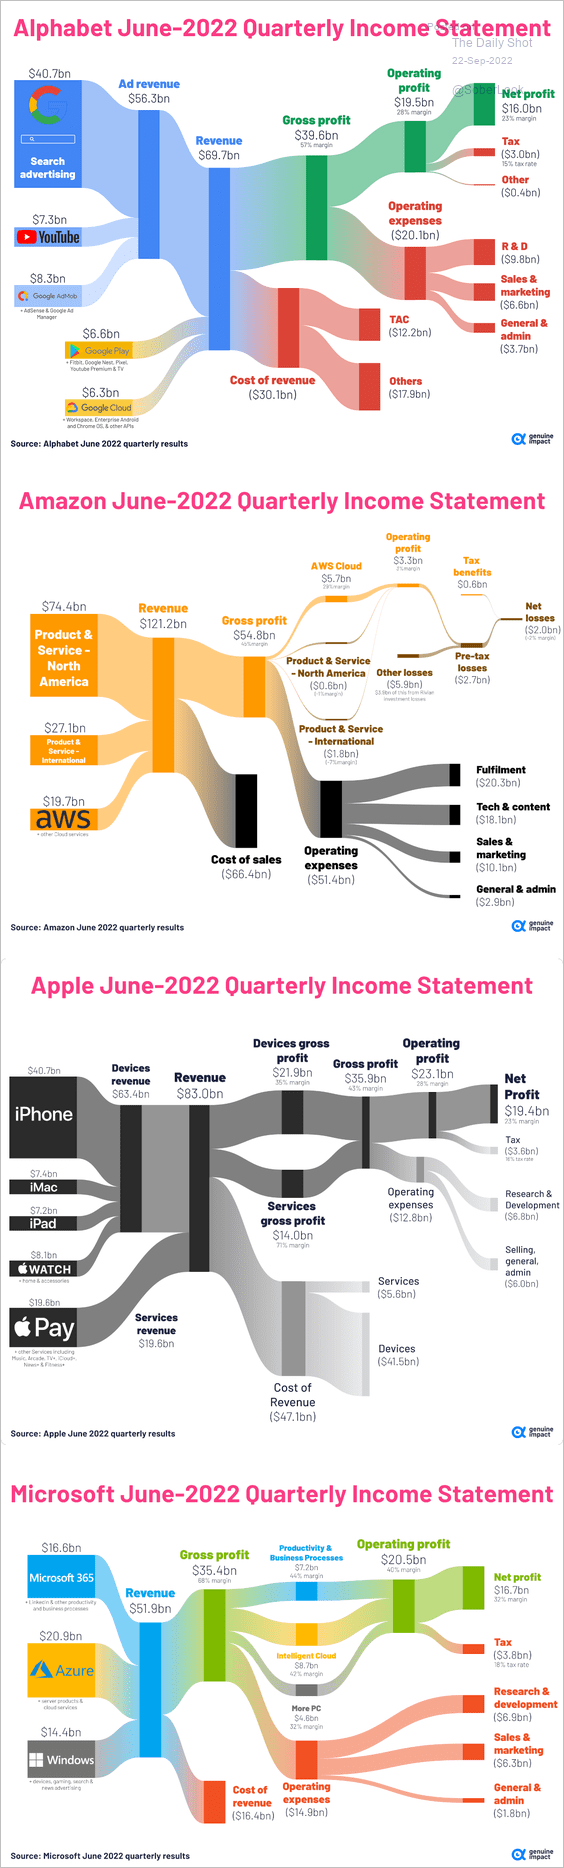 Source: Visual Capitalist Read full article
2. Spending on sports:
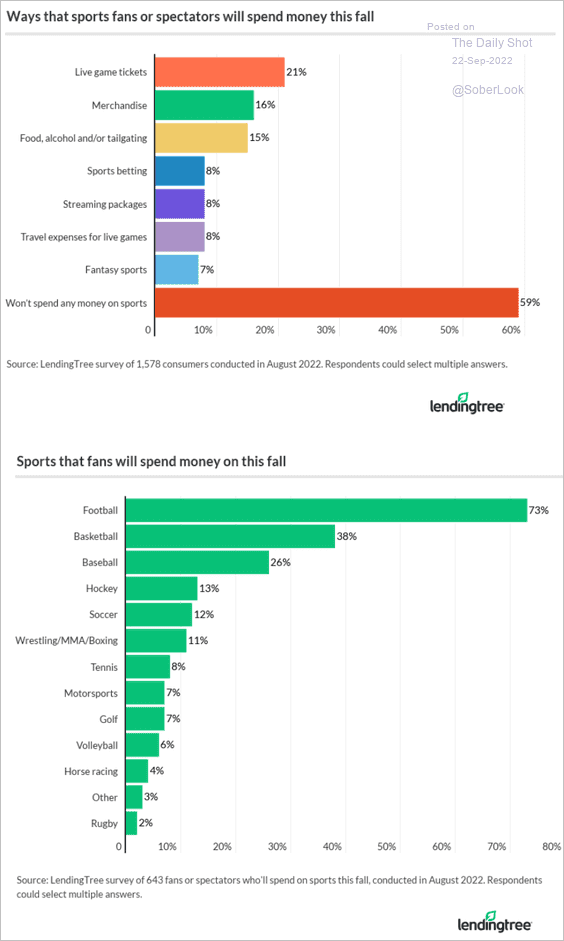 Source: LendingTree Read full article
3. A college education is increasingly valuable, especially in urban areas.
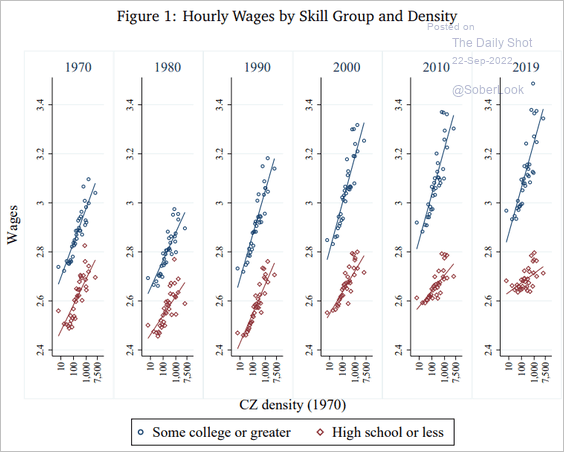 Source: AEI Center on Housing Markets and Finance
4. Concerns about kids’ safety at school:
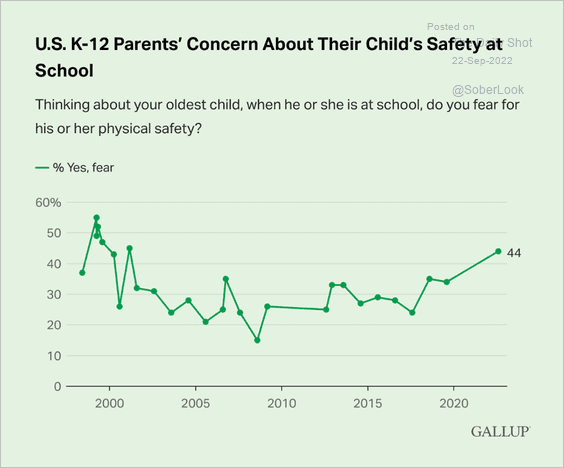 Source: Gallup Read full article
5. Life expectancy vs. GDP per capita:
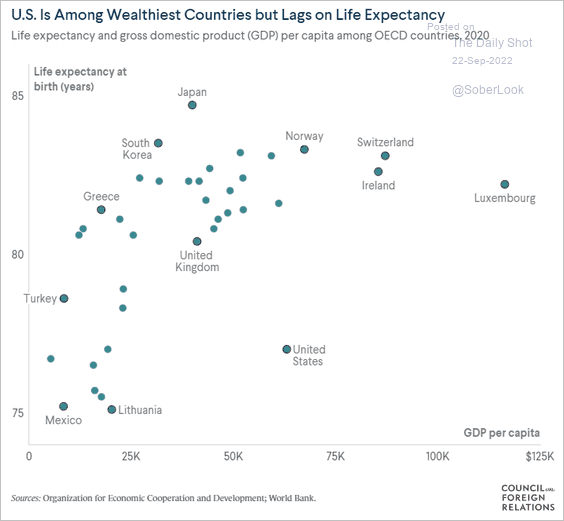 Source: Council on Foreign Relations Read full article
6. Hard plastics in the North Pacific Garbage Patch:
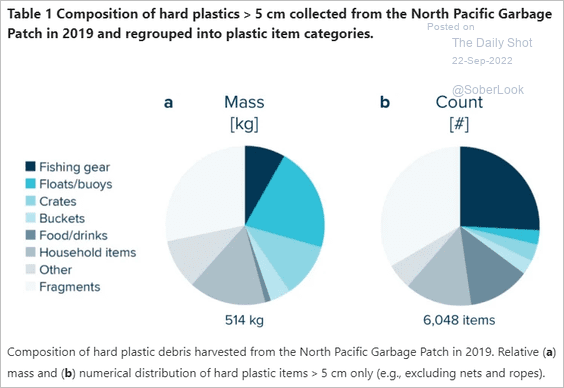 Source: Nature Read full article
• Origins of plastics in the North Pacific Garbage Patch:
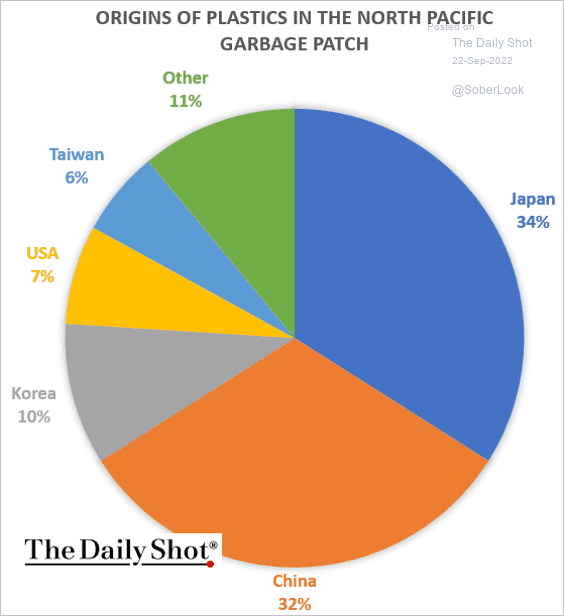 Source: Nature Read full article
——————–
7. Sleep vs. body weight in mammals:
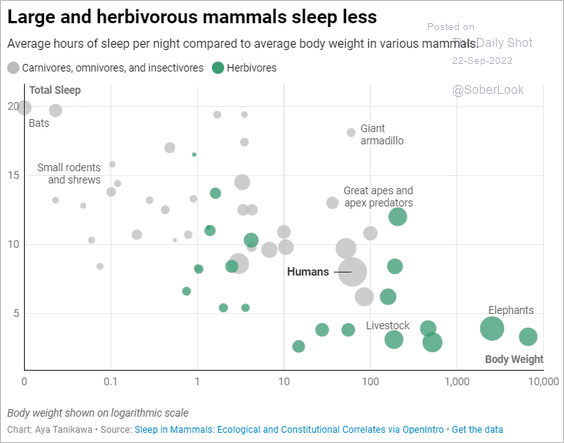 Source: Datawrapper Read full article
——————–
Back to Index