
The Daily Shot: 26-Sep-22
• The United States
• Canada
• The United Kingdom
• The Eurozone
• Europe
• Japan
• Asia – Pacific
• China
• Emerging Markets
• Cryptocurrency
• Commodities
• Energy
• Equities
• Credit
• Rates
• Global Developments
• Food for Thought
The United States
1. The S&P Global Flash PMI report showed surprising resilience in the nation’s business activity. We saw signs of stability earlier this month in the World Economics SMI index (chart).
• Manufacturing orders are back in growth territory (2nd panel).
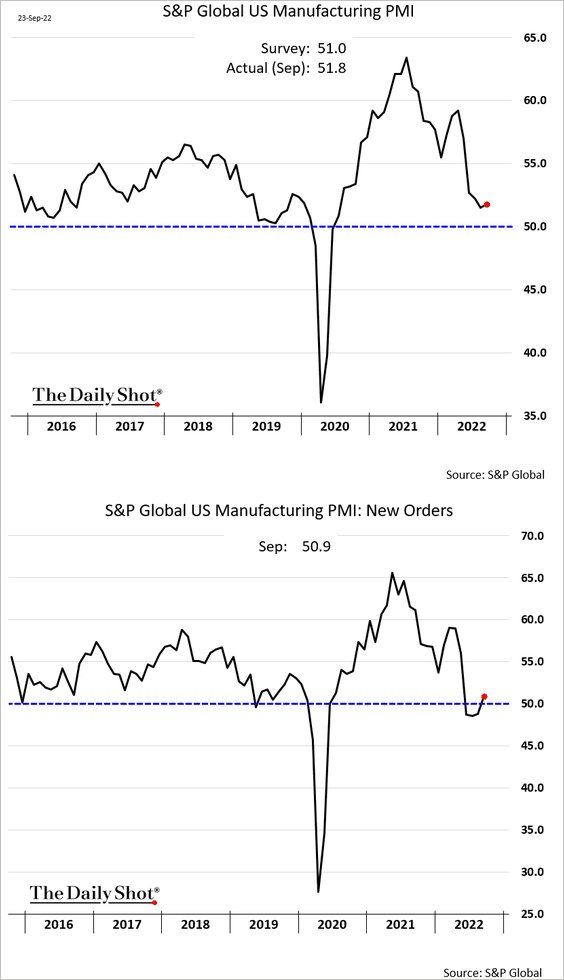
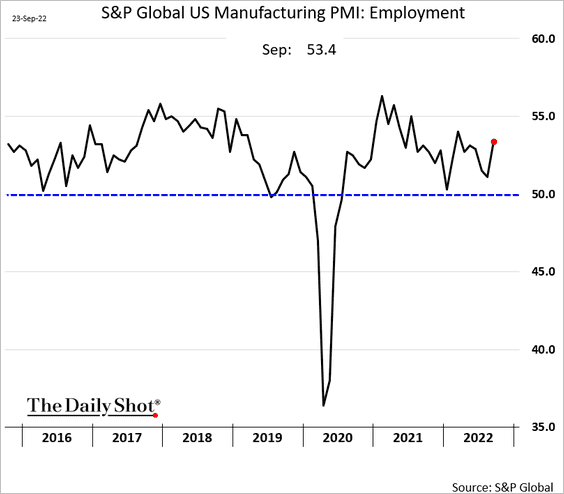
• Manufacturing-sector hiring strengthened.
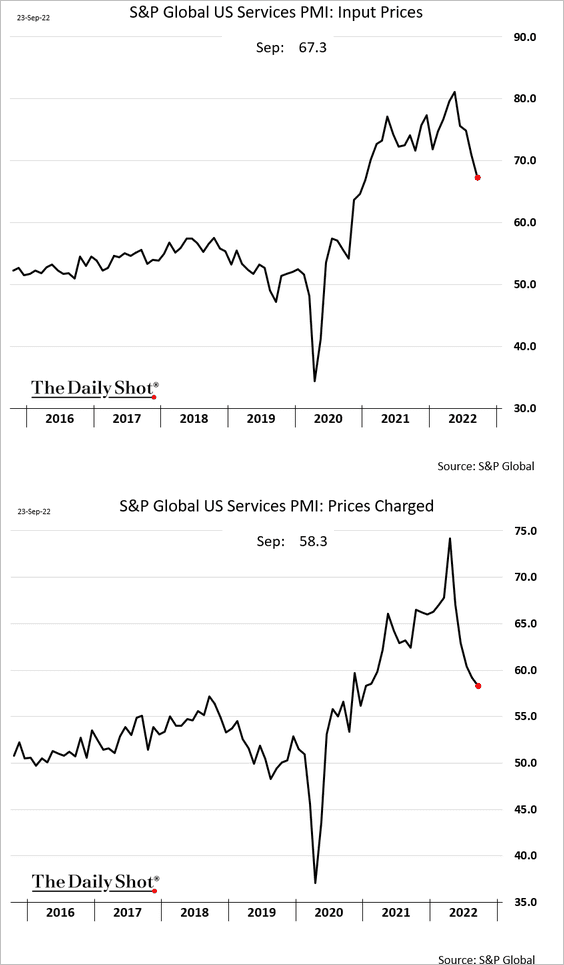
• Services are still contracting, but the PMI is back near 50.

• Price pressures remain elevated but have started to ease.
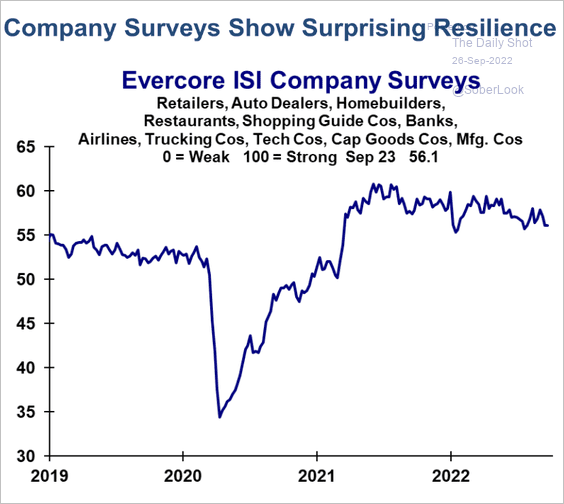
A separate survey from Evercore ISI also shows stability in business activity.
 Source: Evercore ISI Research
——————–
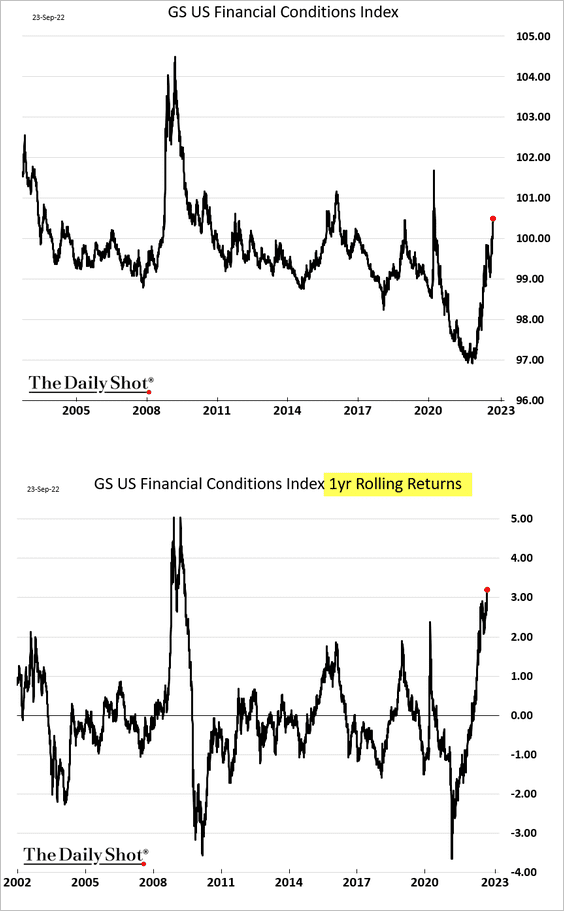
2. But there is pain ahead for the economy as financial conditions tighten rapidly (2 charts).
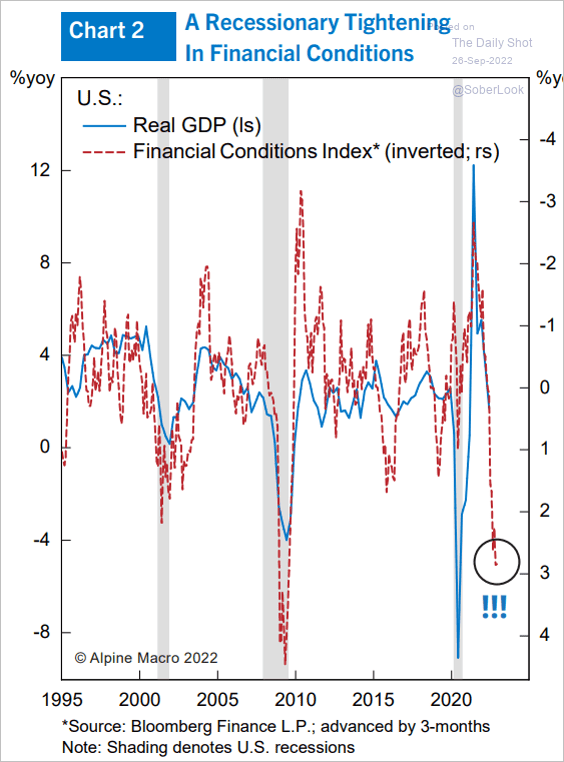 Source: Alpine Macro
Investors increasingly anticipate a 2023 US recession.
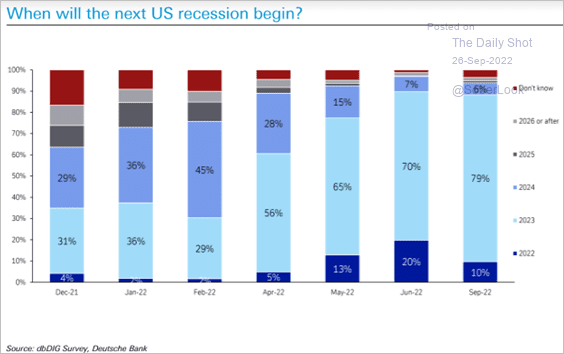 Source: Deutsche Bank Research
——————–
3. The market is now almost certain that we will get another 75 bps Fed rate hike in November and potentially in December.
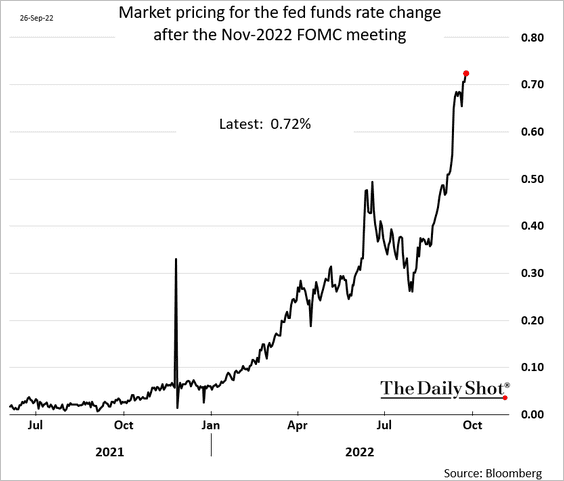
• Goldman now sees 75 bps in November, 50 bps in December, and 25 bps in February.
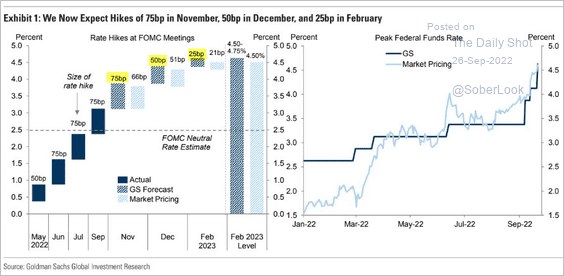 Source: Goldman Sachs
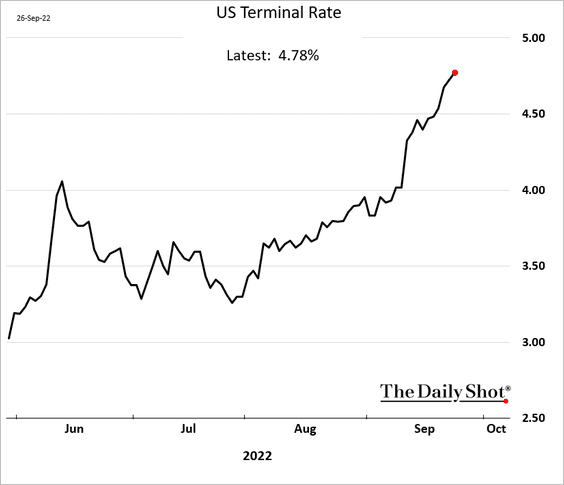
• The terminal rate (the maximum fed funds rate in this cycle) is nearing 5%.
• Is the market too hawkish? Here is a forecast from EY-Parthenon.
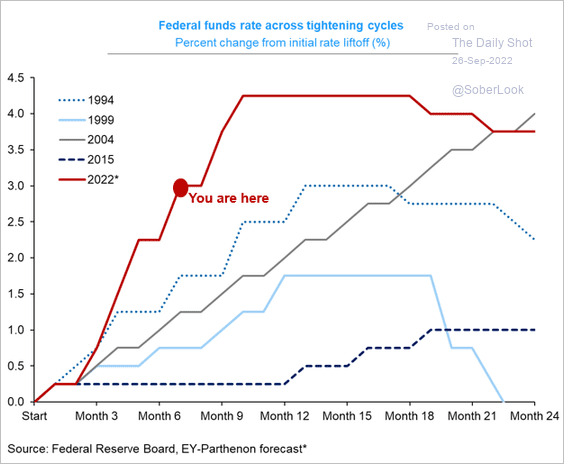 Source: @GregDaco
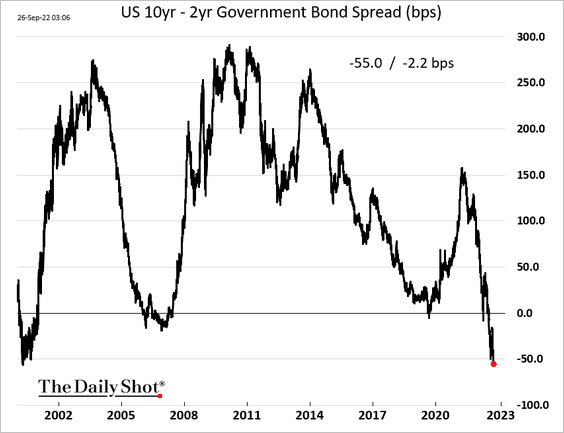
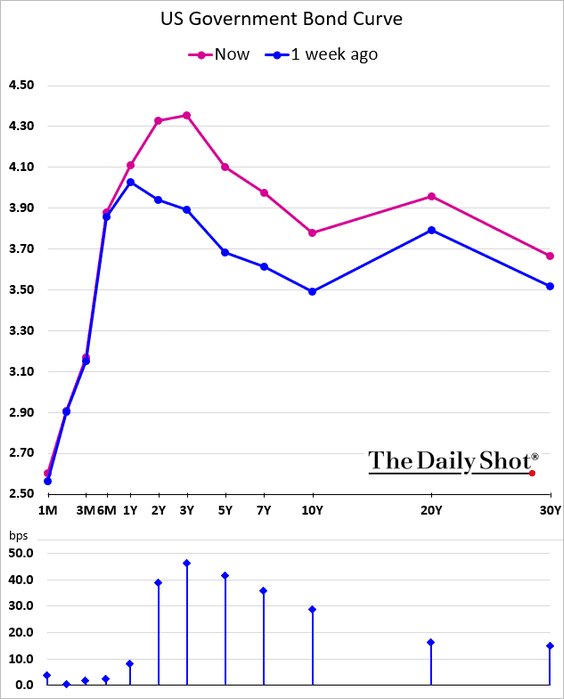
• The 2-year Treasury yield continues to surge …
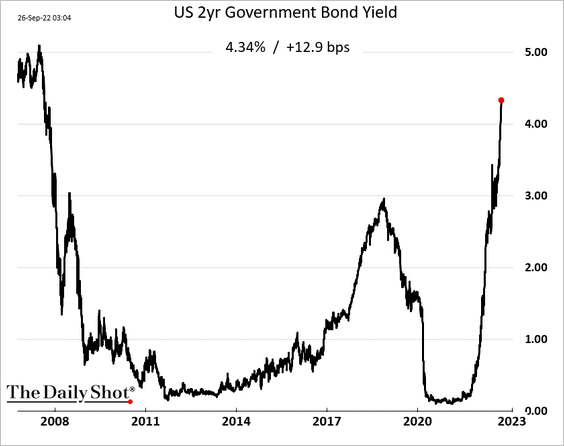
… as the yield curve inverts further (2 charts).
——————–
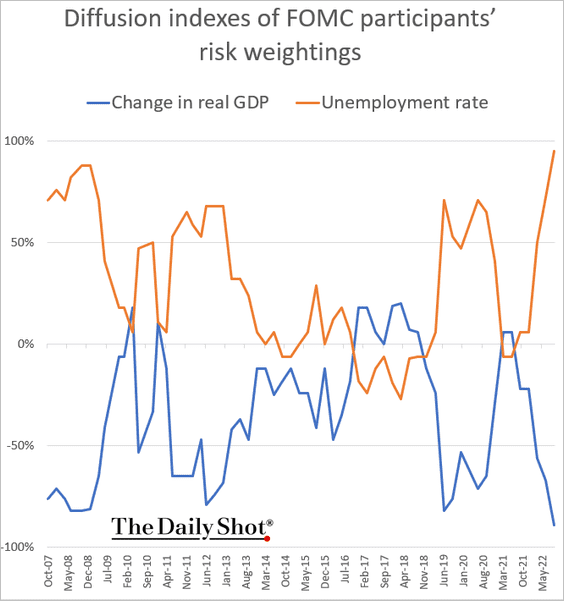
4. The FOMC members see extreme downside risks to their economic forecasts.
5. Leading indicators point to slower business investment ahead.
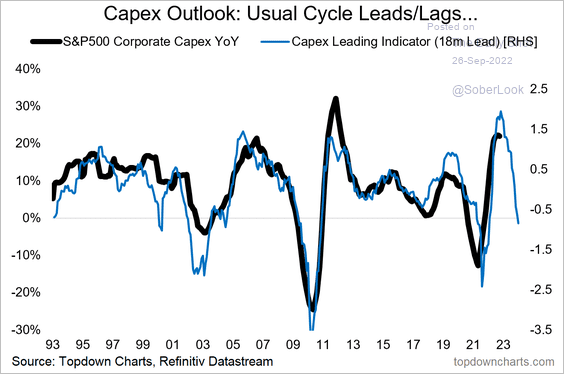 Source: @topdowncharts Read full article
Back to Index
Canada
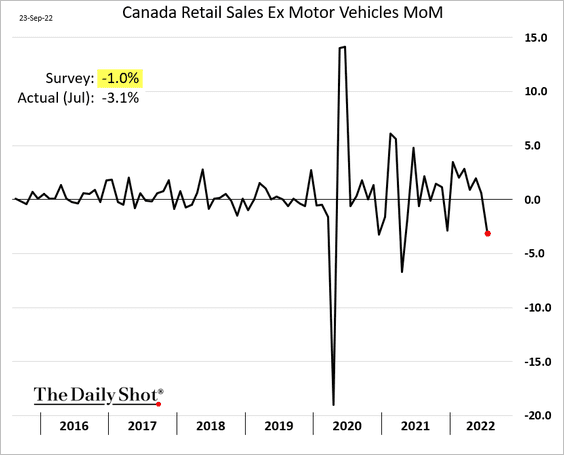
1. Retail sales tumbled in July.
2. Canada’s turn to deleverage?
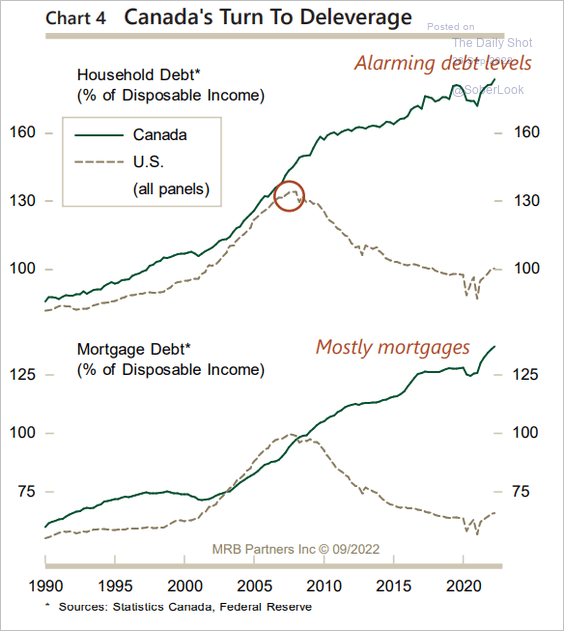 Source: MRB Partners
Back to Index
The United Kingdom
1. The UK government announced a massive stimulus package.
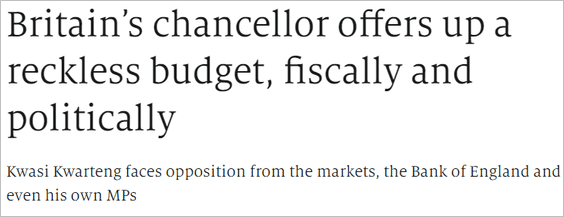 Source: The Economist Read full article
And there is more to come.
 Source: The Telegraph Read full article
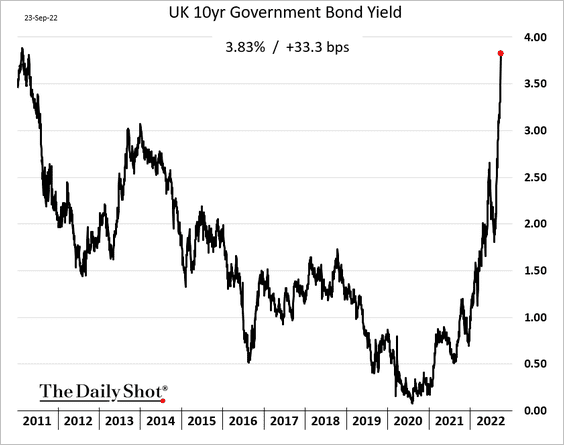
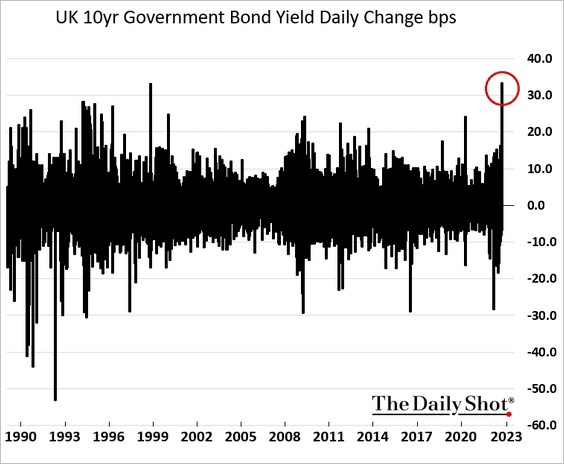
• The BoE will have to hike rates much more aggressively to offset the stimulus impact on prices.
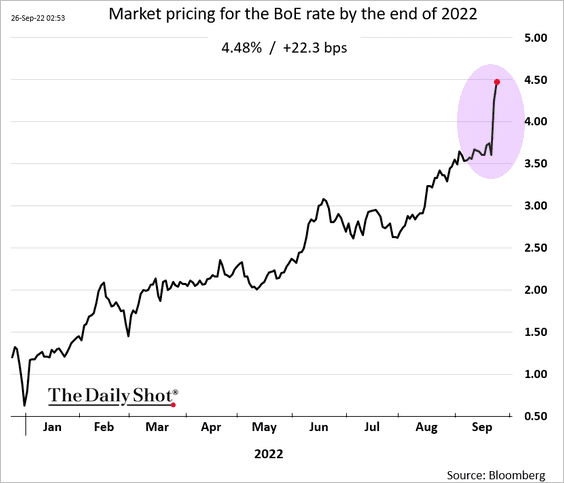
• A massive amount of extra debt will be hitting the markets. The surge in yields after the budget announcement was unprecedented in recent decades.
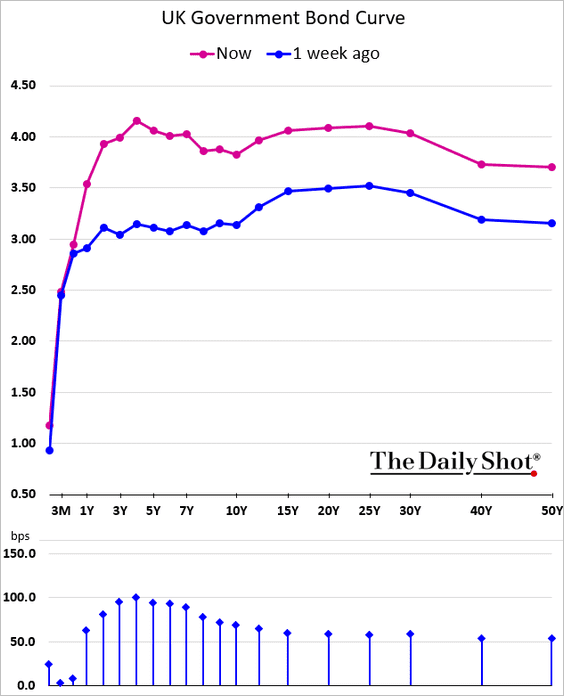
Here is the yield curve.
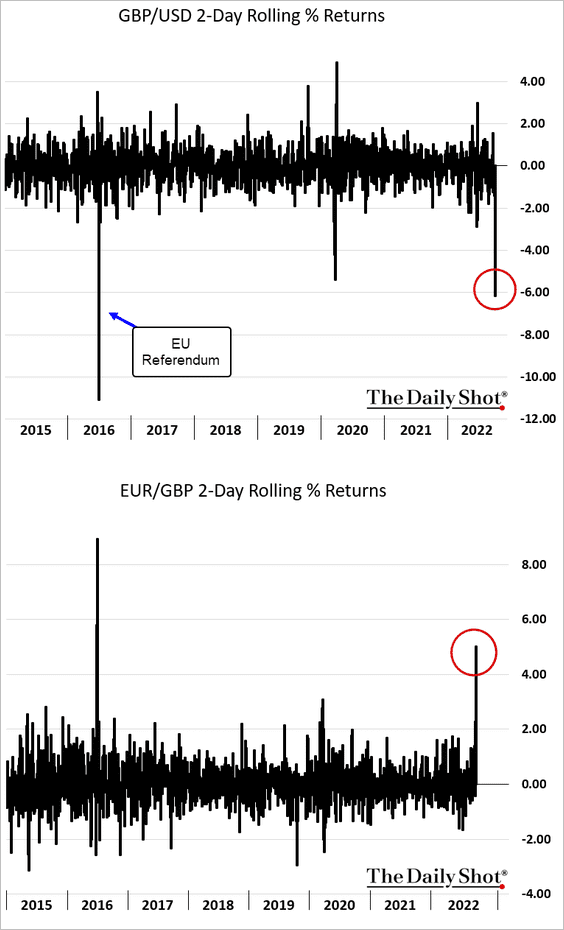
• The pound plummeted to record lows.
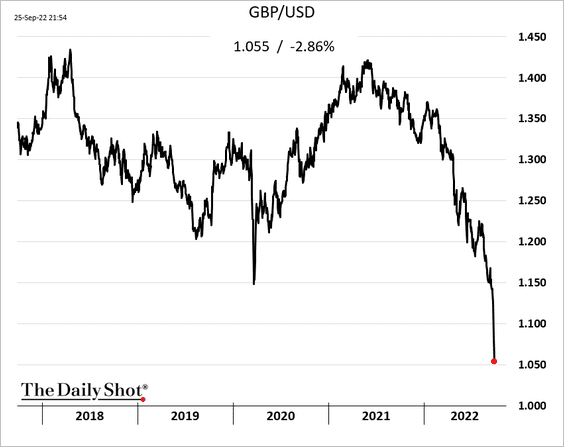
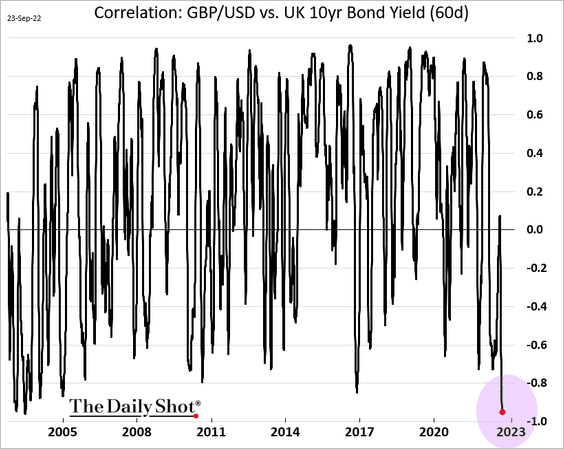
• The correlation between gilt prices and the pound surged.
——————–
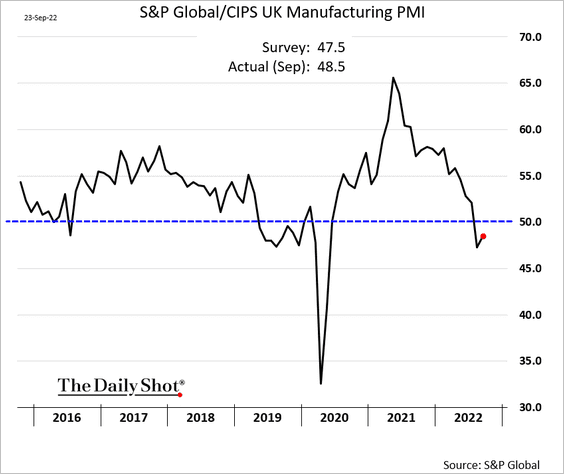
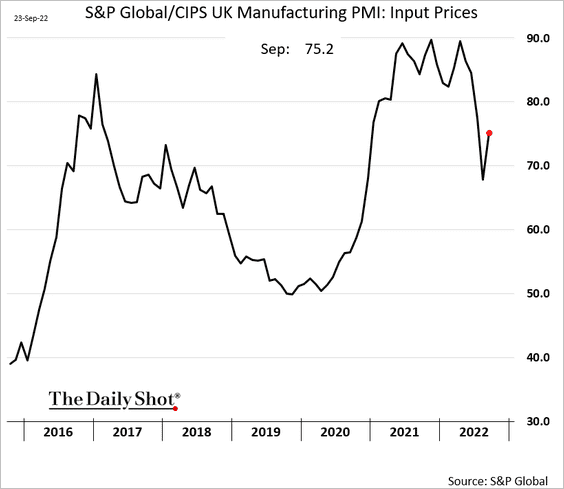
2. The September PMI report showed a slower contraction in manufacturing.
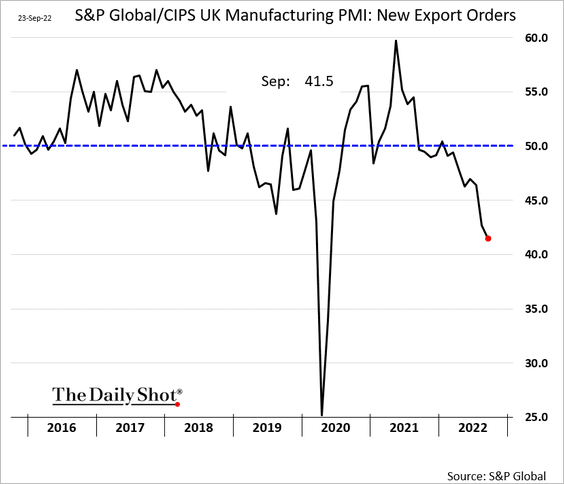
– But export orders are crashing.
– Price pressures persist.
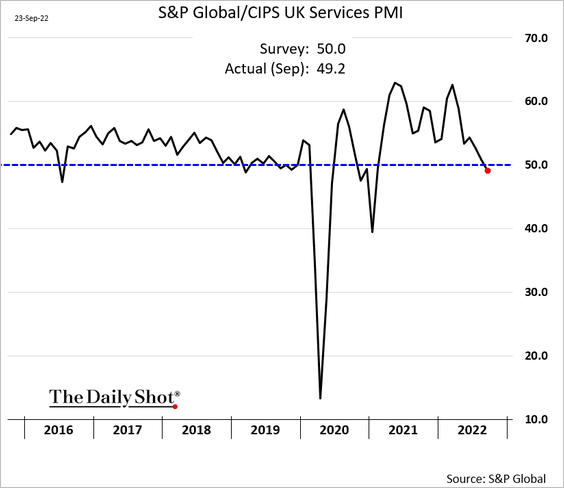
• Service-sector activity entered contraction territory.
• Here is the composite PMI:
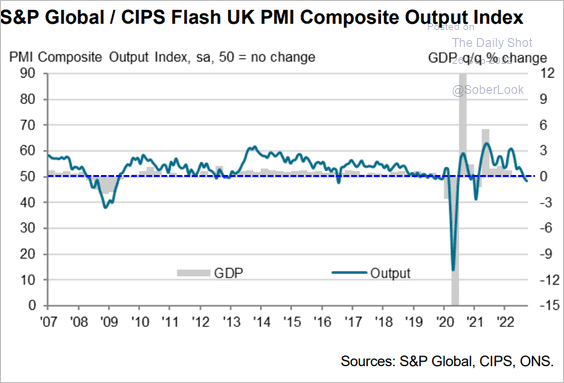 Source: S&P Global PMI
——————–
3. Retail sales declined this month.
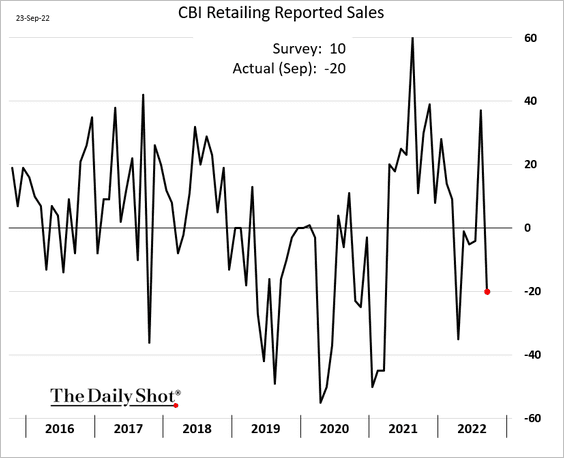
 Source: CBI Read full article
Back to Index
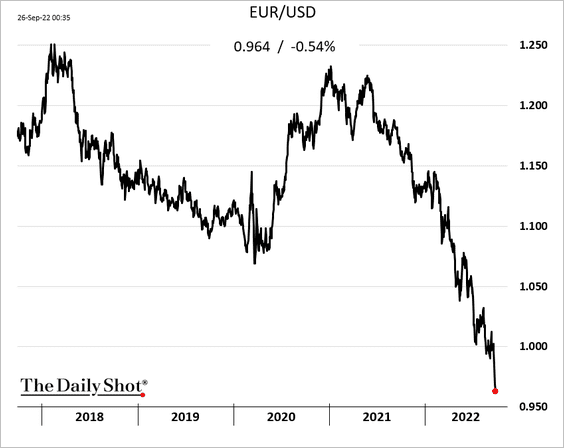
The Eurozone
1. The euro continues to sink vs. the dollar.
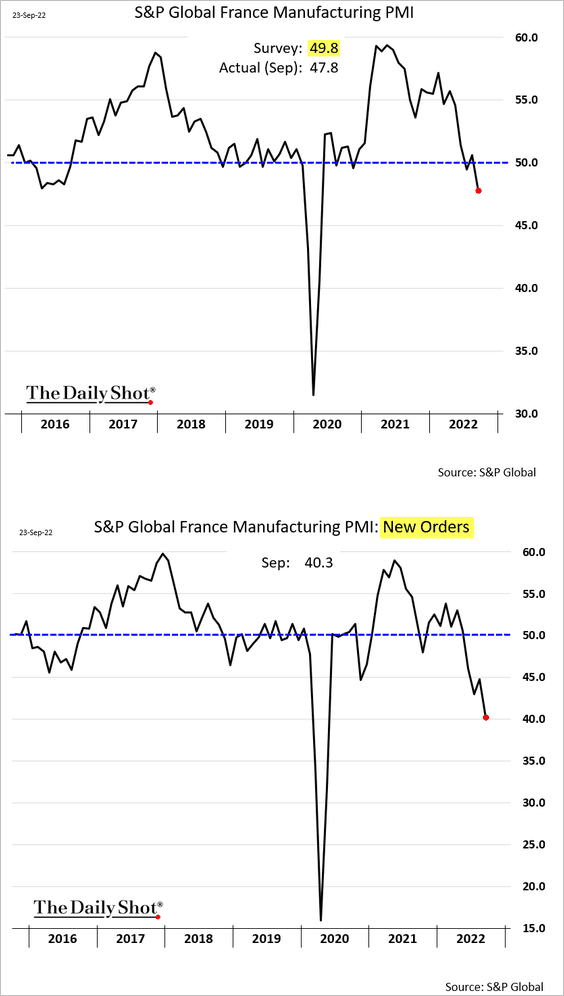
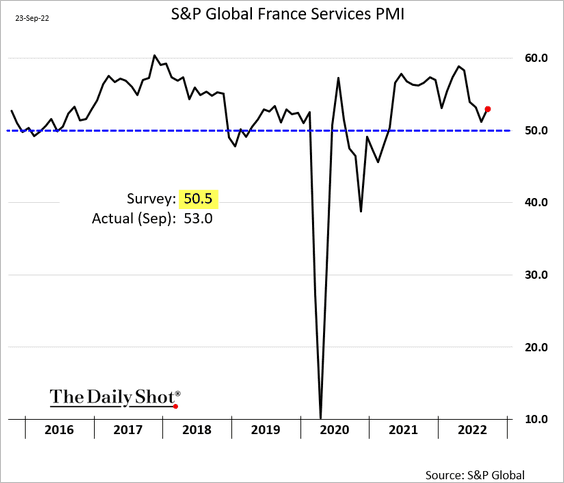
2. The PMI report shows the economy entering a recession.
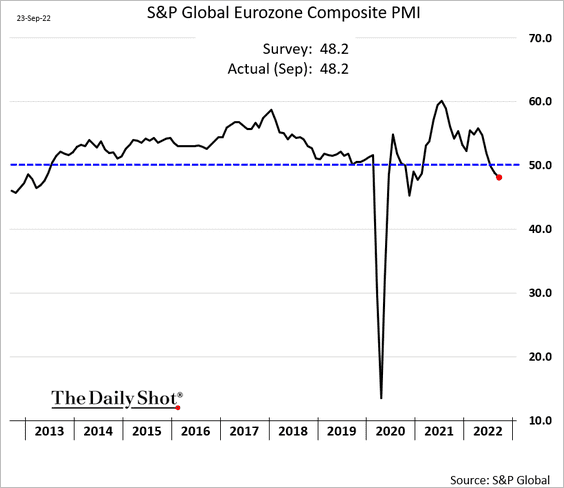
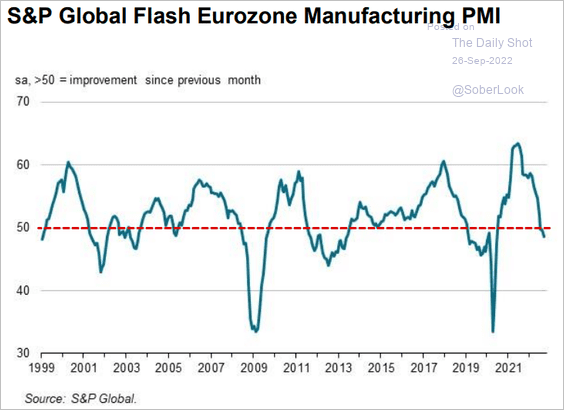 Source: S&P Global PMI
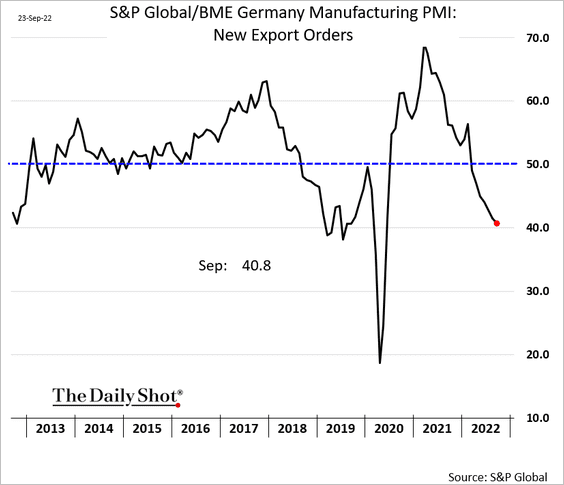
• Manufacturing PMI for Germany:
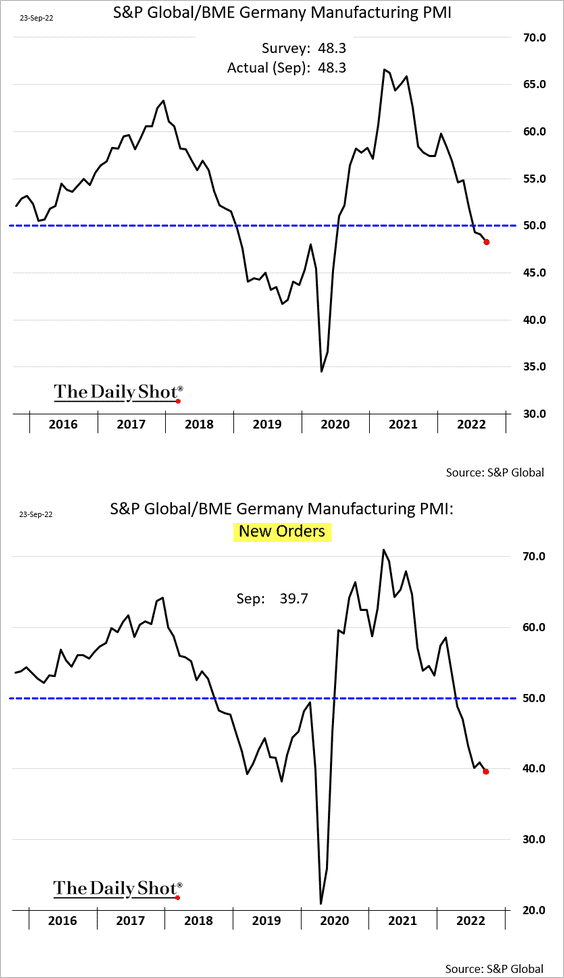
– Germany manufacturing export orders:
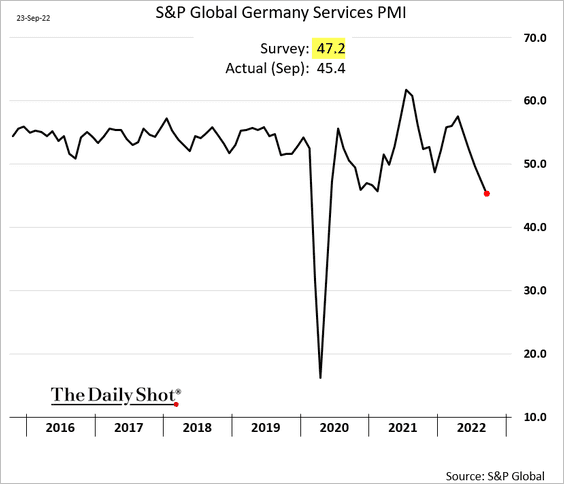
– Germany services PMI (accelerating contraction):
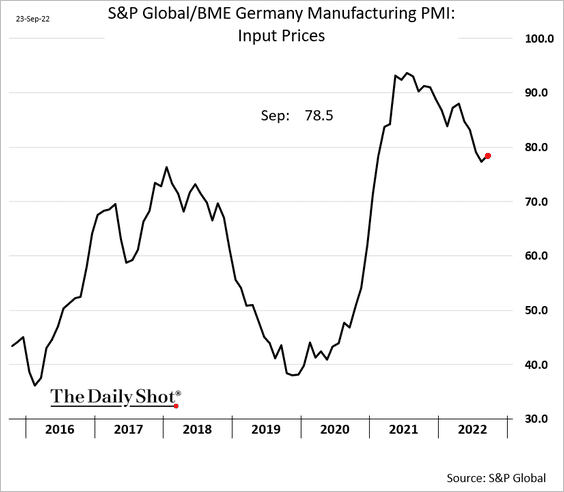
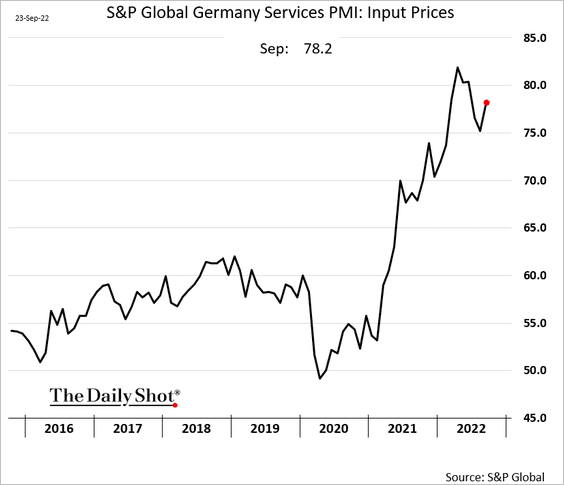
– Price pressures persist (2 charts):
• France manufacturing PMI (new orders crashing):
– France services PMI (resilient for now):
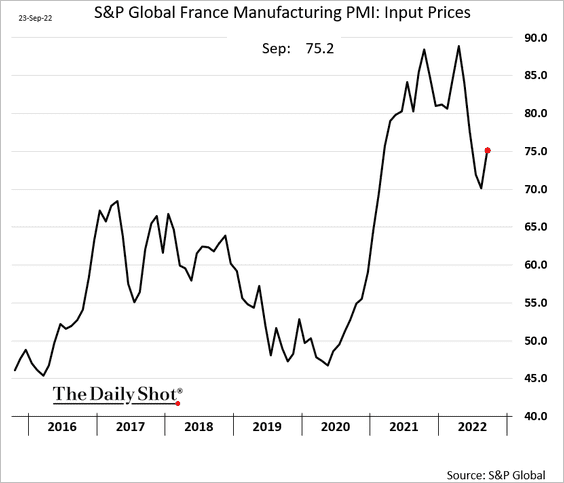
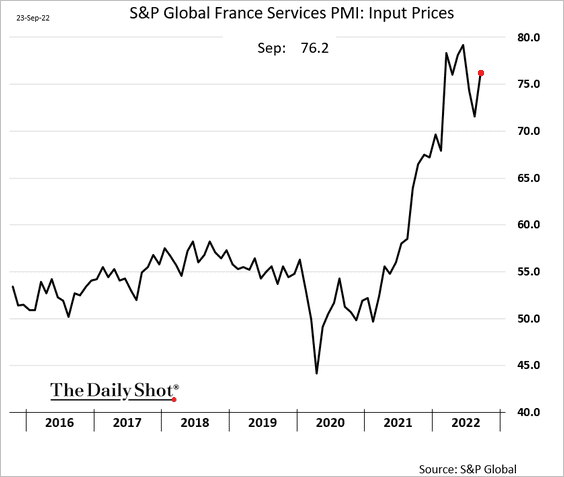
– Price pressures persist (2 charts):
——————–
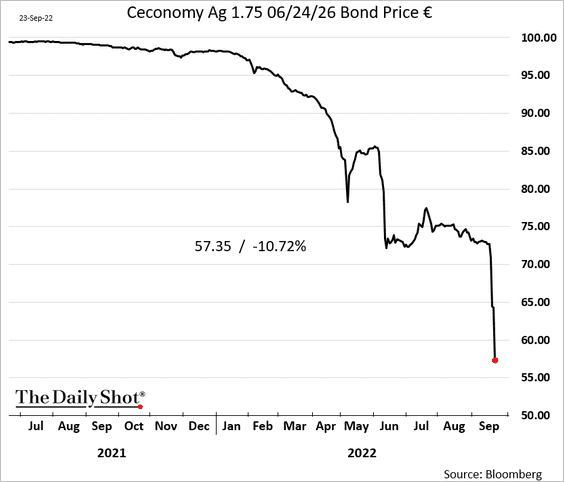
2. This chart shows Ceconomy’s bond price. Will we see contagion to other weak credits?
Back to Index
Europe
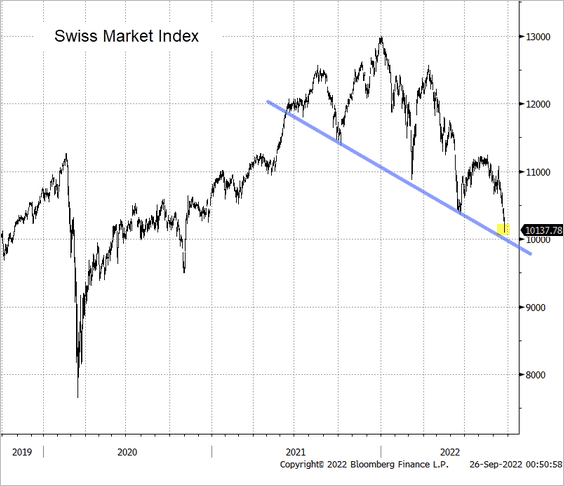
1. The Swiss stock market index is at support.
 Source: @TheTerminal, Bloomberg Finance L.P.
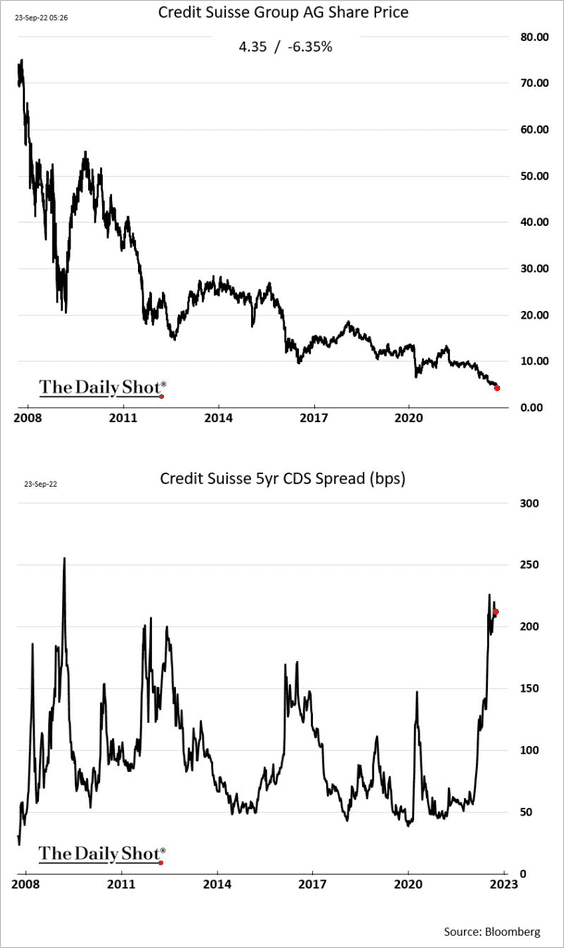
Could troubles at Credit Suisse spill over into the broader banking system?
——————–
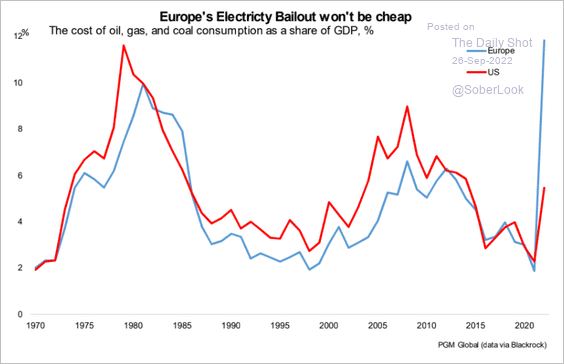
2. Europe’s electricity bailout will be expensive.
 Source: PGM Global
Back to Index
Japan
1. Will Japan hold the line at 145 yen to the dollar?
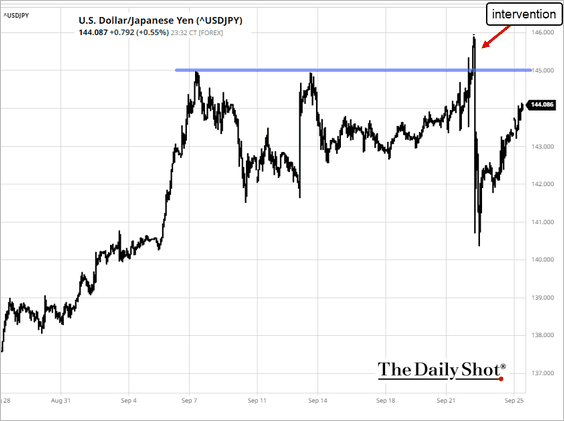
 Source: Reuters Read full article
——————–
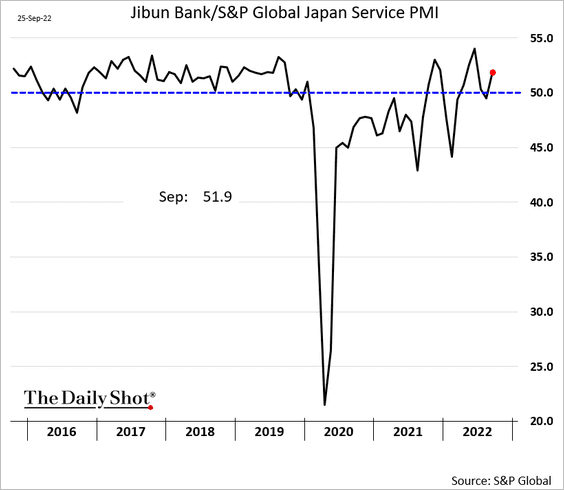
2. Japan’s business activity remains resilient for now.
• Services (back to growth):
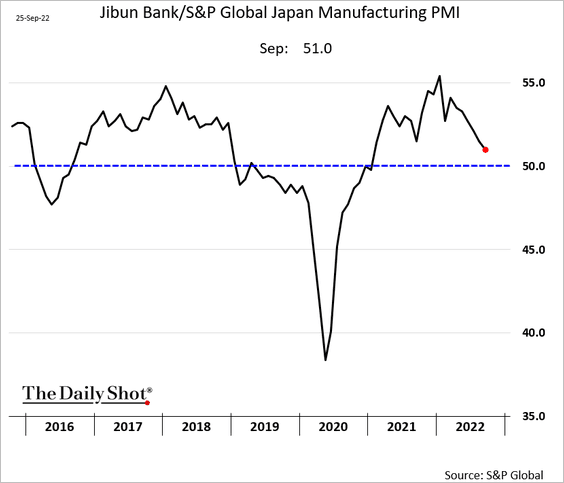
• Manufacturing (growth is slowing):
• Composite:
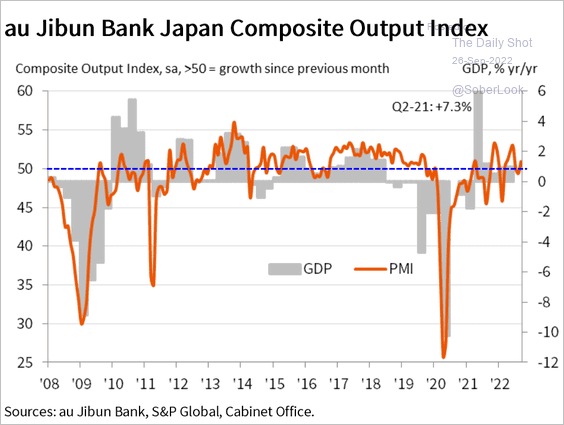 Source: S&P Global PMI
Back to Index
Asia – Pacific
1. Will South Korea intervene in the FX market to halt the won’s plunge?
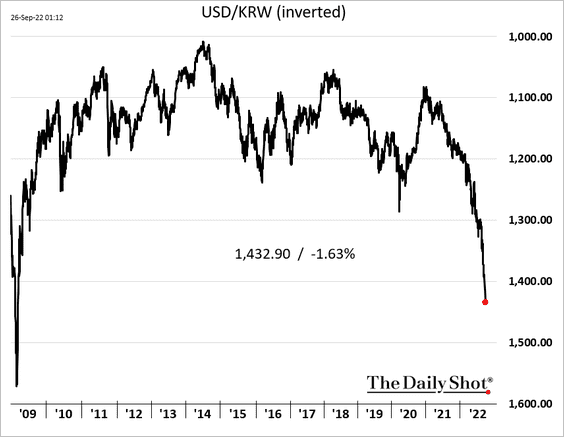
 Source: Reuters Read full article
——————–
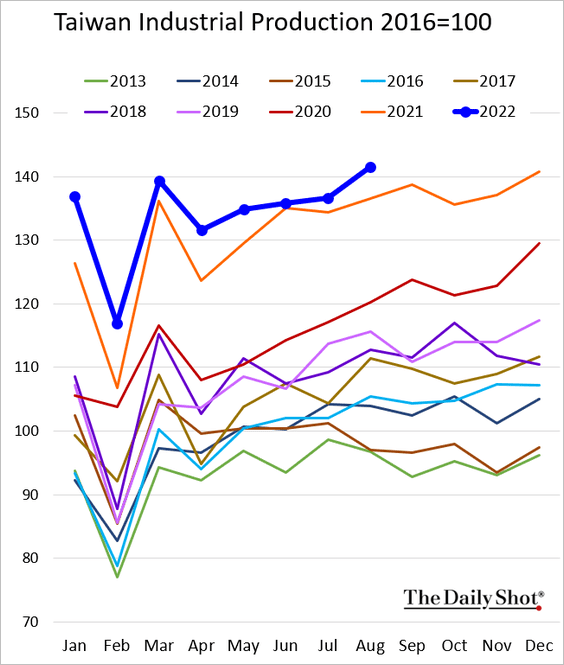
2. Taiwan’s industrial output remains robust.
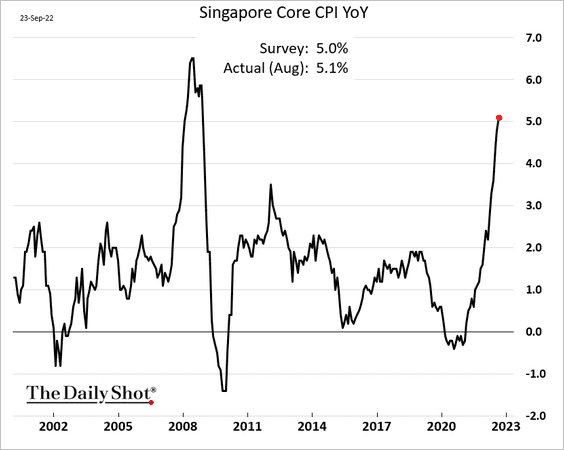
3. Singapore’s core inflation is now above 5%.
Back to Index
China
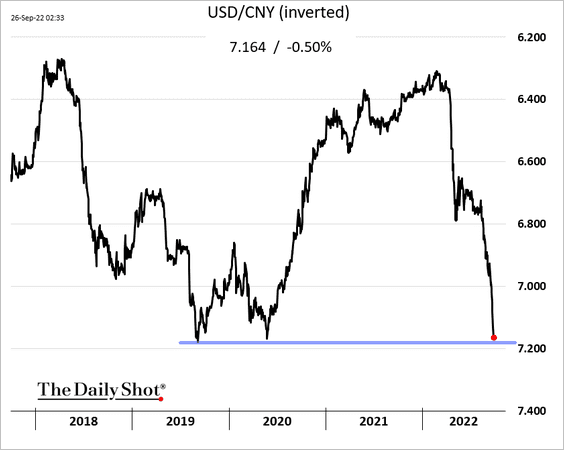
1. The renminbi has become unanchored.
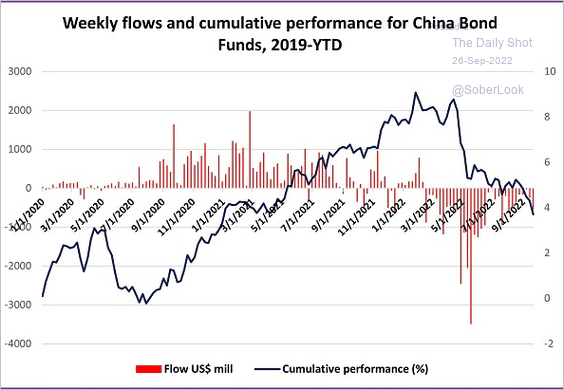
2. Investors continue to pull capital out of China-focused bond funds.
 Source: EPFR Global Navigator
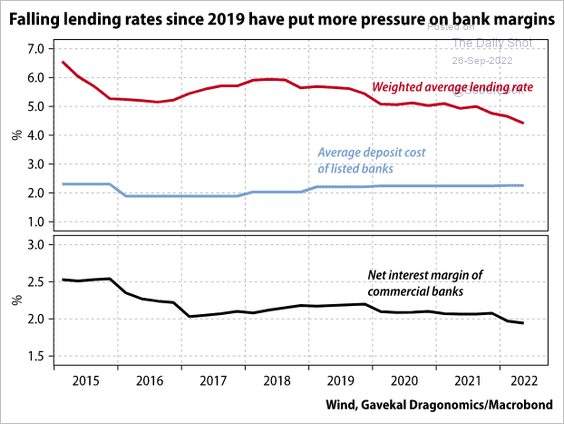
3. Banks’ net interest margins have been trending lower.
 Source: Gavekal Research
Back to Index
Emerging Markets
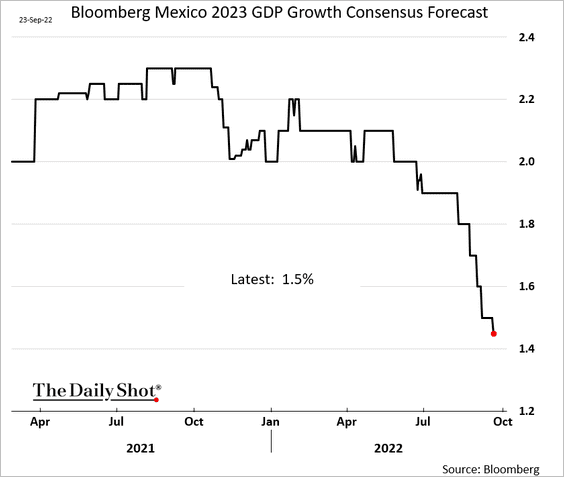
1. Projections for Mexico’s growth continue to deteriorate.
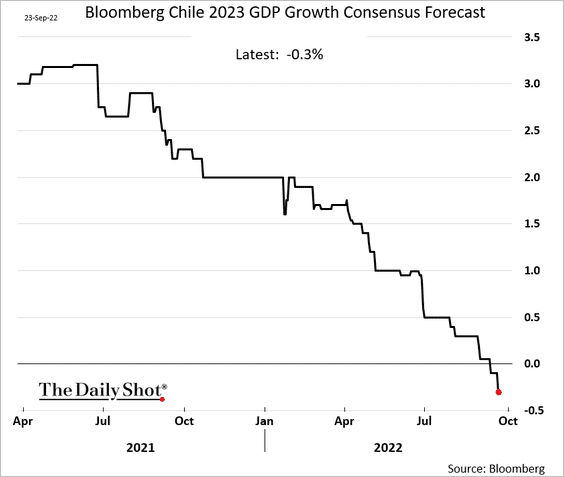
2. Forecasters now expect Chile’s economy to shrink in 2023.
3. Overall inflation has continued to surprise to the downside, which means EM central banks could pause policy tightening.
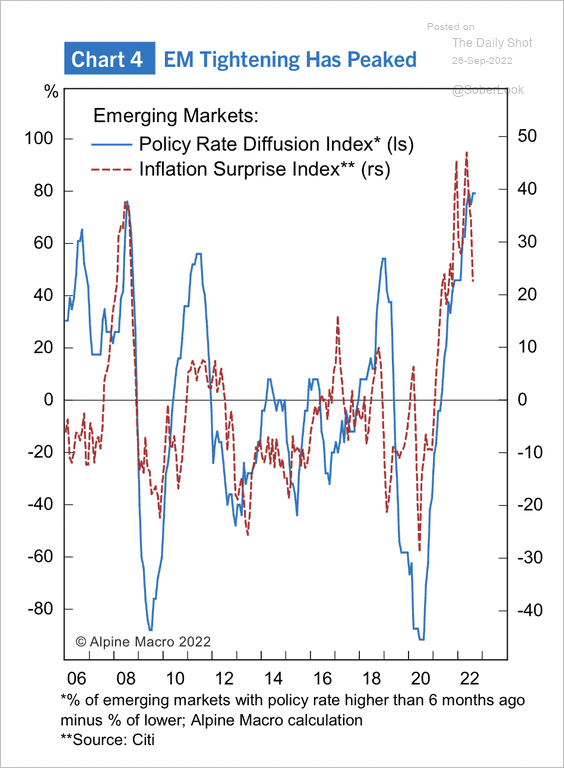 Source: Alpine Macro
Indeed, monetary policy conditions are starting to ease, especially in countries that have tightened the most.
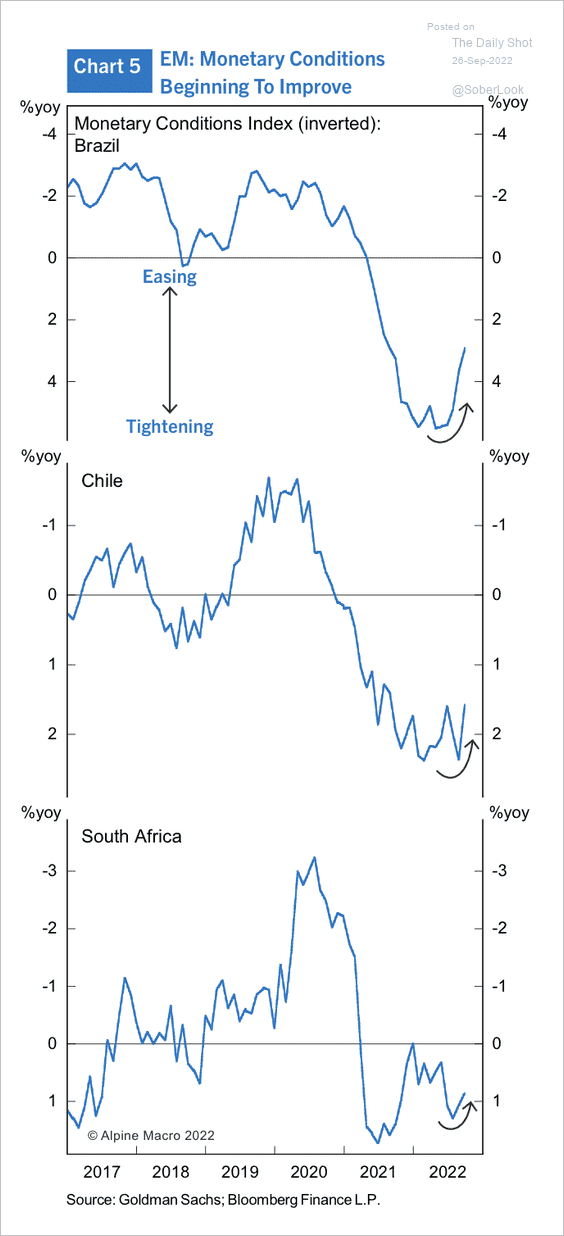 Source: Alpine Macro
——————–
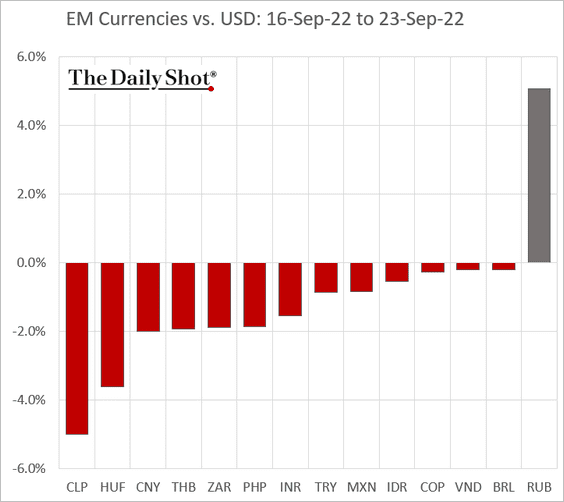
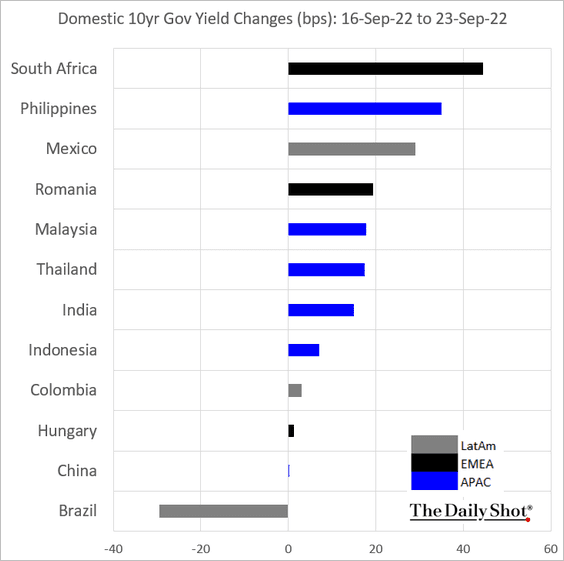
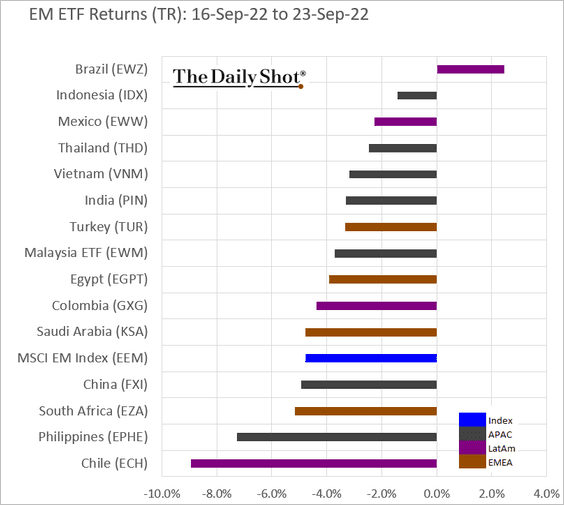
4. Next, we have some performance data from last week.
• Currencies:
• Bond yields:
• Equity ETFs:
Back to Index
Cryptocurrency
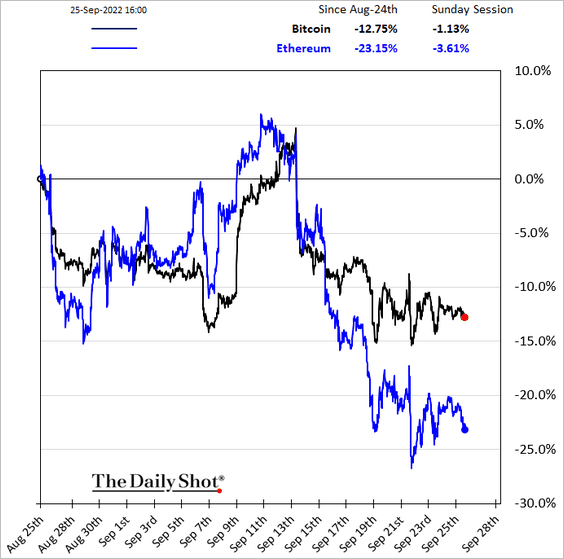
1. Ether continues to underperform.
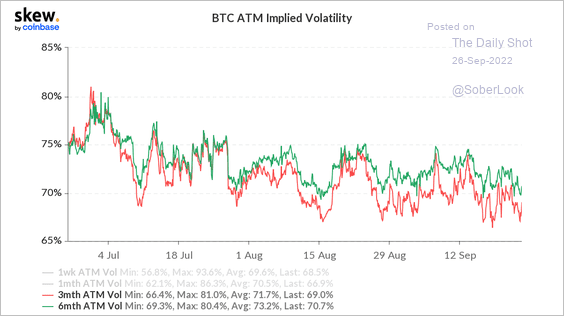
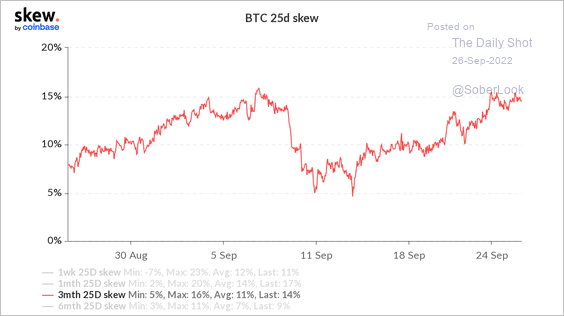
2. Bitcoin’s implied volatility ticked higher over the weekend but remains low relative to July.
 Source: Skew
Bitcoin’s 25 delta skew has increased over the past two weeks, which means puts are becoming more expensive than calls.
 Source: Skew
——————–
3. NFT transaction volumes continue to decline.
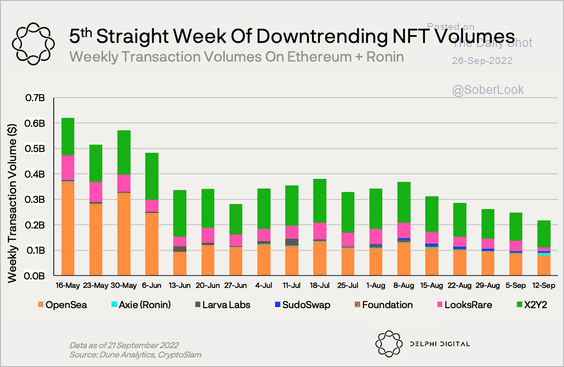 Source: @Delphi_Digital
4. The number of unique addresses engaging in decentralized finance (DeFi) applications have increased significantly over the past two years.
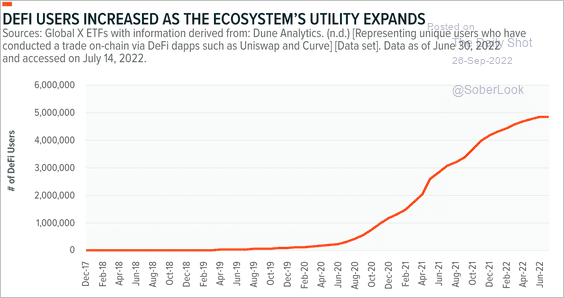 Source: Global X ETFs Read full article
5. Beyond financial use cases, potential applications of blockchain technology are vast.
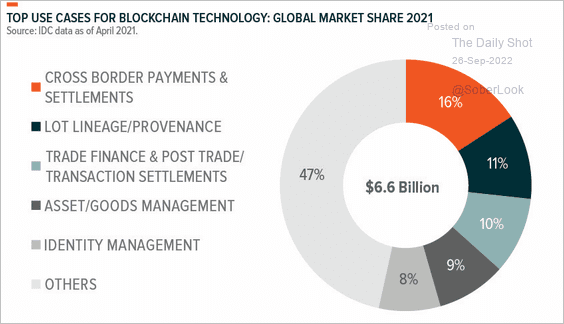 Source: Global X ETFs Read full article
Back to Index
Commodities
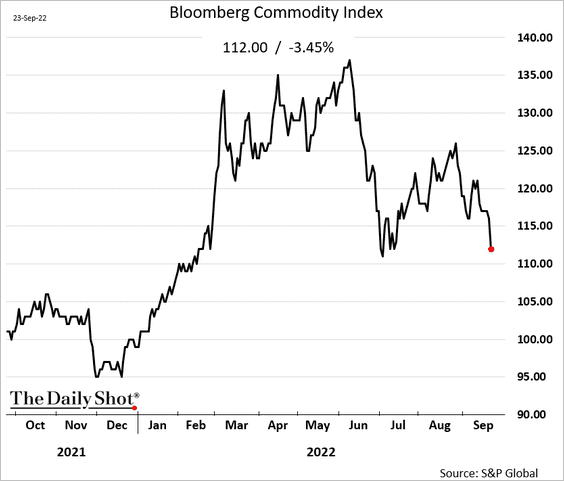
1. Bloomberg’s broad commodities index is back at the June lows.
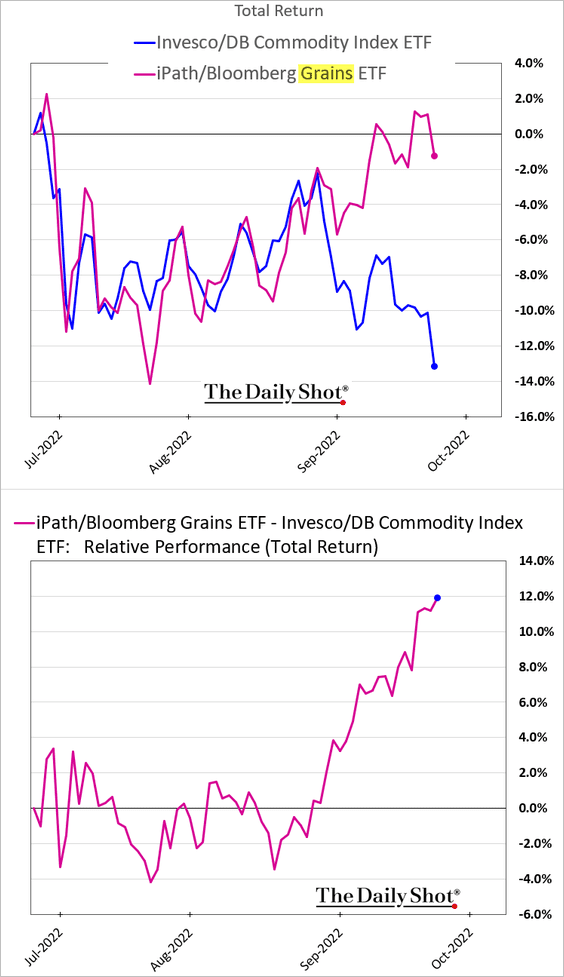
2. Grains have been outperforming.
3. China’s soy meal prices have been surging.
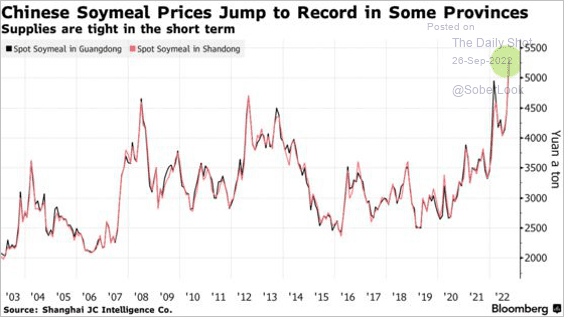 Source: @markets Read full article
The government wants to reduce the nation’s dependence on soy imports.
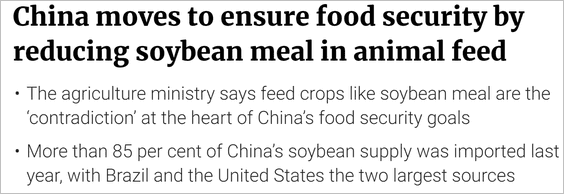 Source: South China Morning Post Read full article
——————–
4. The strong dollar is a headwind for copper prices.
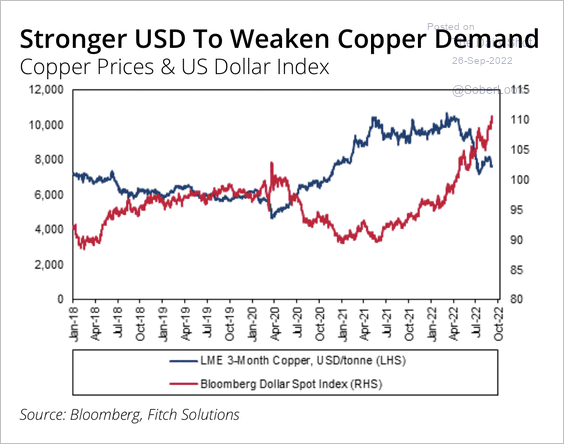 Source: Fitch Solutions Macro Research
However, low inventories could keep copper prices elevated.
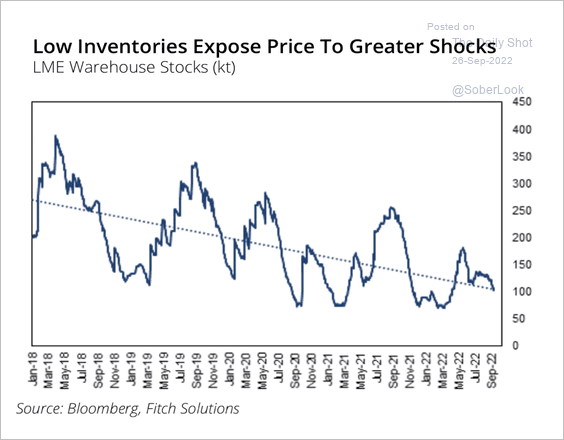 Source: Fitch Solutions Macro Research
——————–
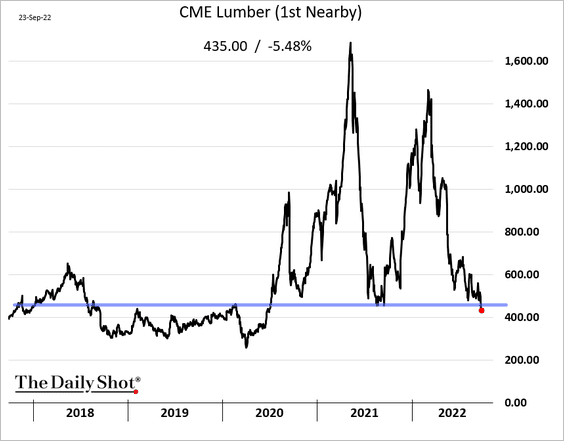
5. US lumber prices are falling as the housing market comes under pressure.
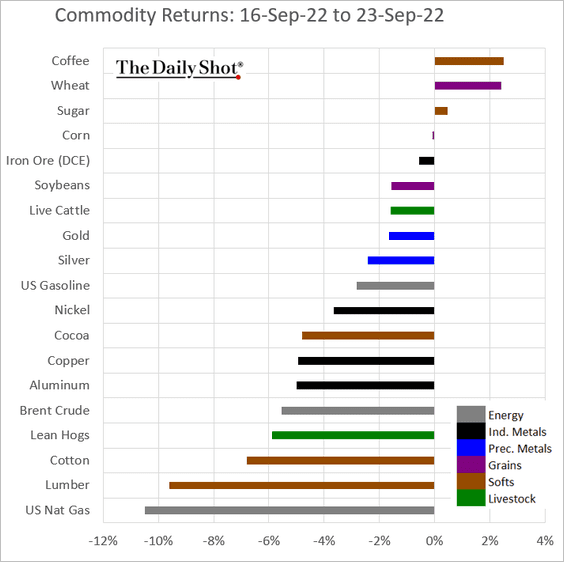
6. Here is last week’s performance across key markets.
Back to Index
Energy
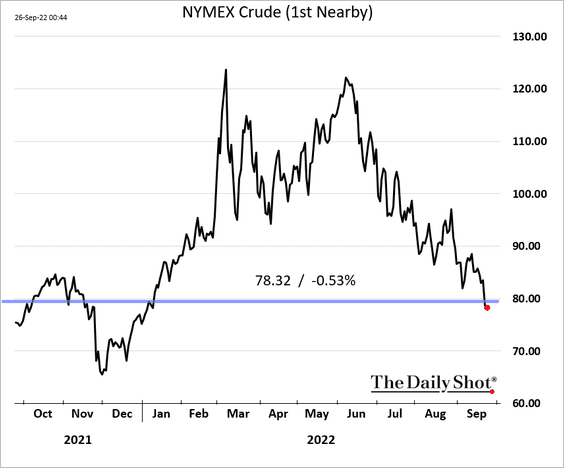
1. Oil prices declined further last week.
 Source: Reuters Read full article
Time to start refilling the US strategic oil reserves?
 Source: Bloomberg Read full article
——————–
2. The oil market could hit a significant surplus early next year.
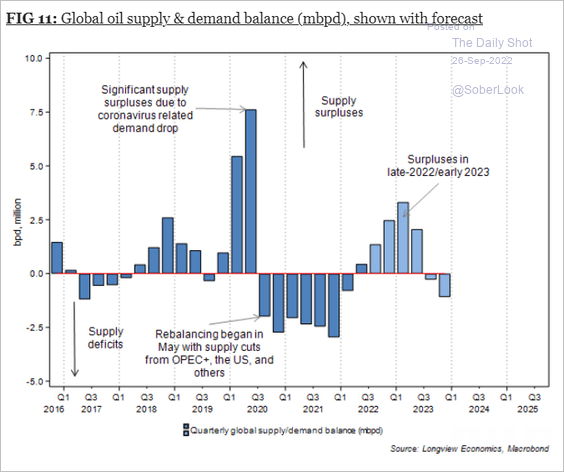 Source: Longview Economics
Back to Index
Equities
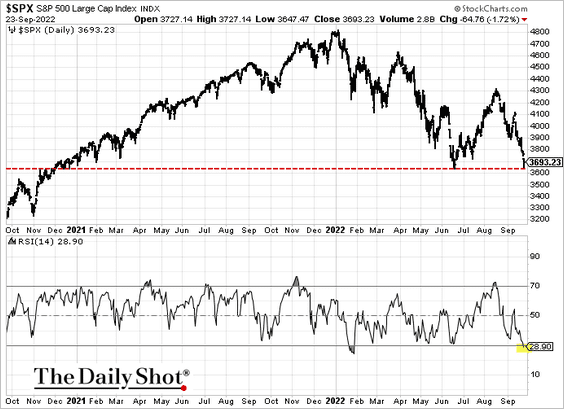
1. The S&P 500 held support at the June low. The index now appears to be oversold.
Extreme bearishness also points to a bounce.
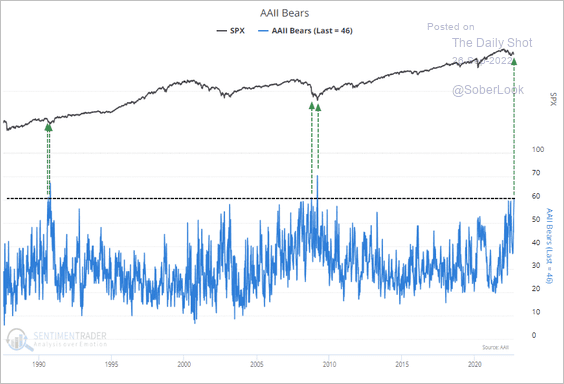 Source: SentimenTrader
However, market bottoms tend to occur in October.
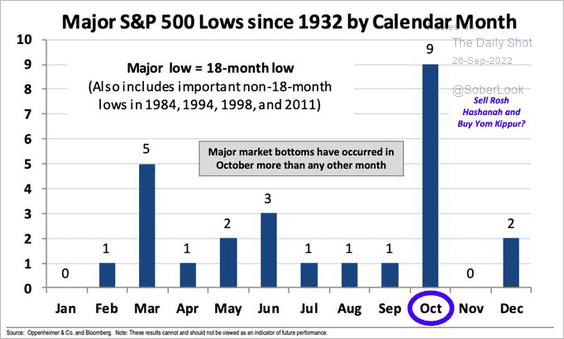 Source: @SamRo, @AriWald
——————–
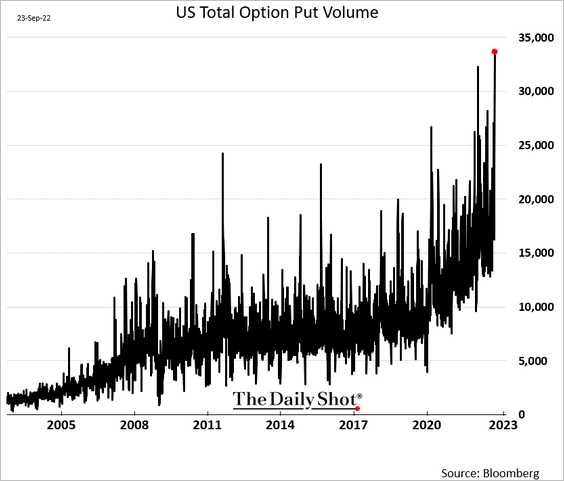
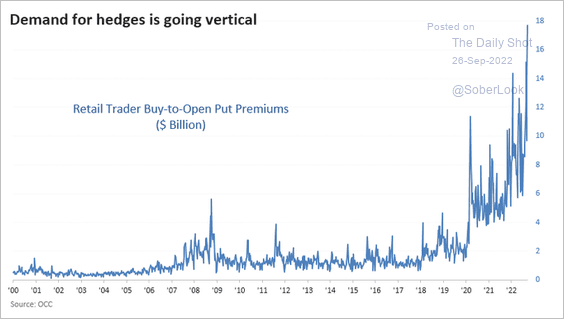
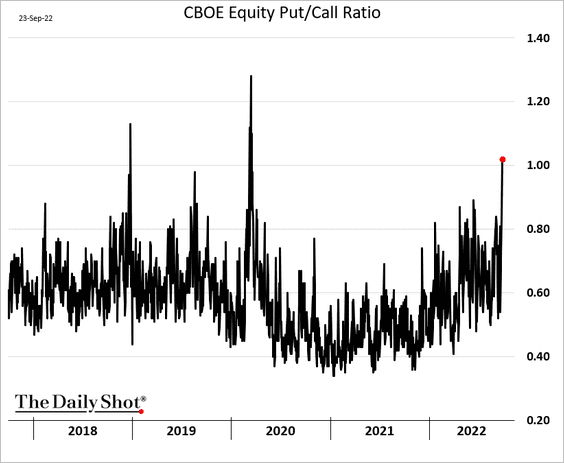
2. Put option volume surged last week.
 Further reading
Retail traders loaded up on puts. A market bounce could be painful.
 Source: @jasongoepfert
Here is the single-stock put/call ratio.
——————–
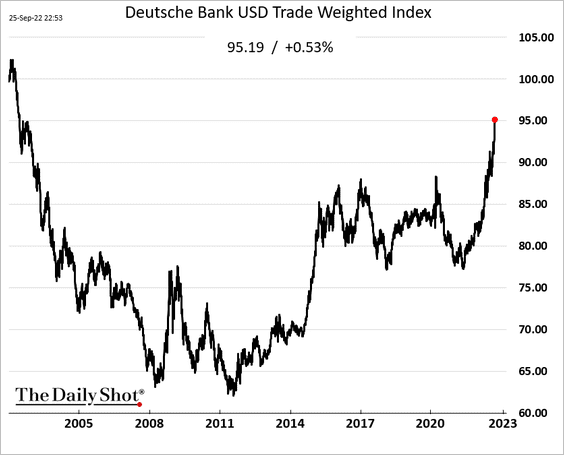
3. The US dollar surge continues to be a headwind for stocks.
More earnings downgrades are coming.
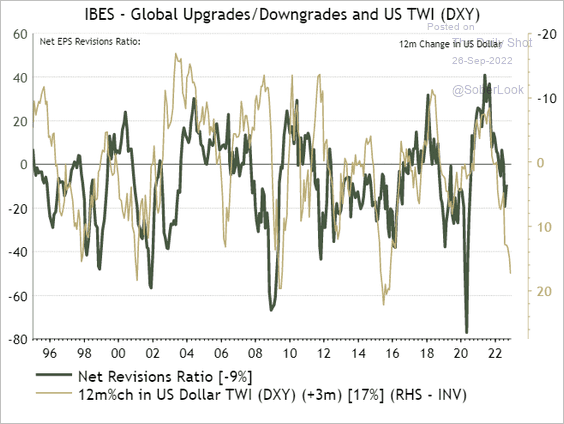 Source: @IanRHarnett
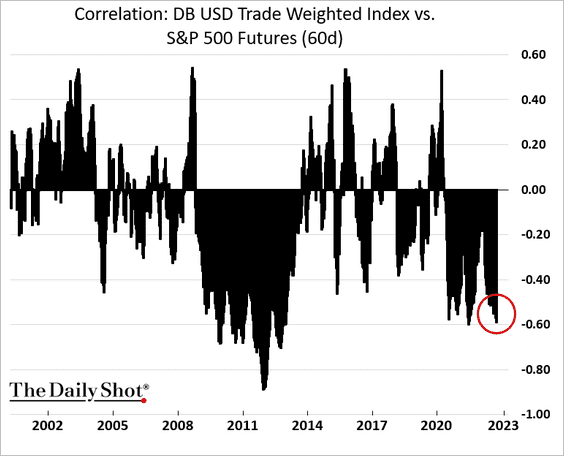
Here is the correlation between the US dollar index and S&P 500 futures.
——————–
4. Stocks are following previous bear-market trajectories.
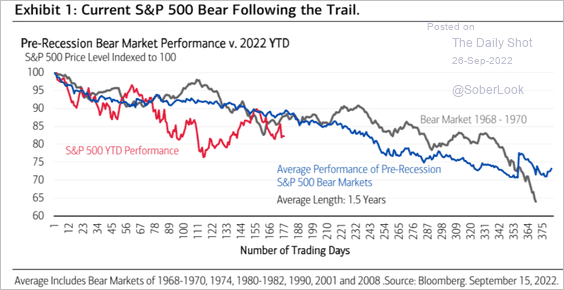 Source: Merrill Lynch
The 2008 analogy is holding.
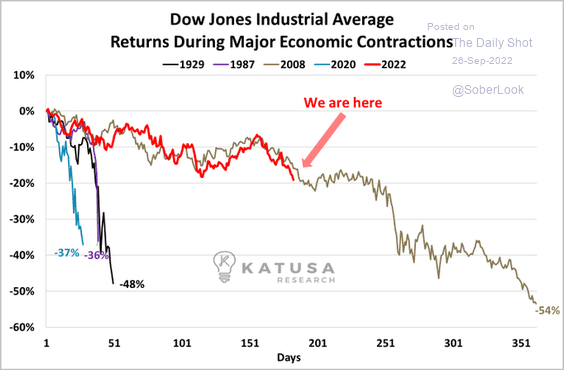 Source: @KatusaResearch
——————–
5. It’s hard to buy the dip in an autocorrelated market.
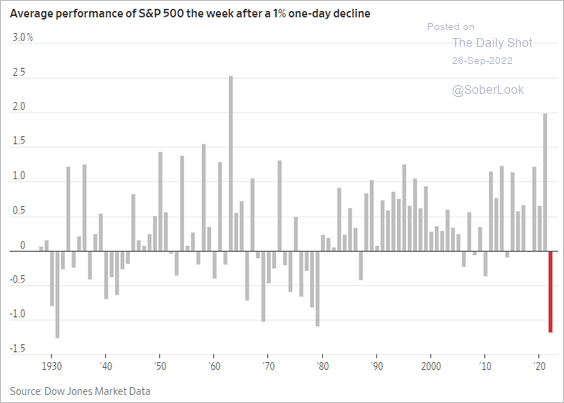 Source: @WSJ Read full article
6. Large-cap active managers are performing a bit better this year vs. the index.
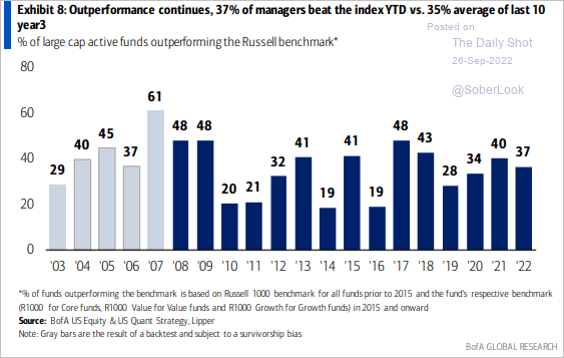 Source: BofA Global Research
7. Many SPACs are returning cash to investors.
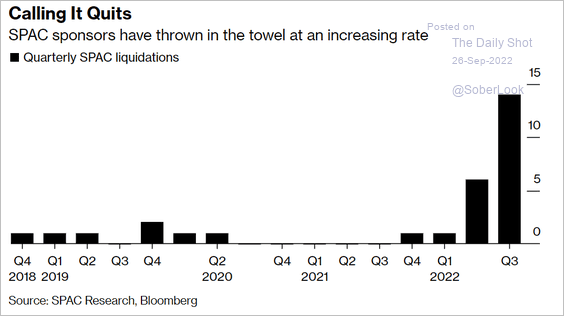 Source: Bloomberg Read full article
8. REITs no longer look attractive relative to bonds.
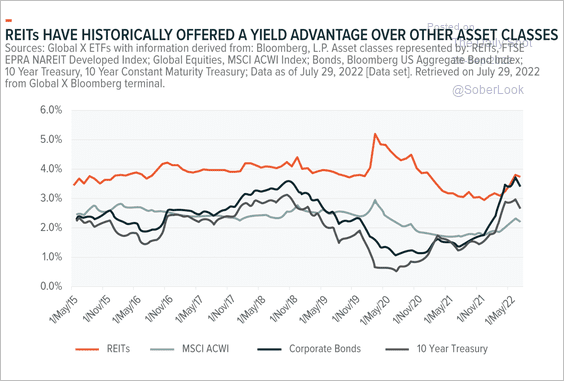 Source: Global X ETFs Read full article
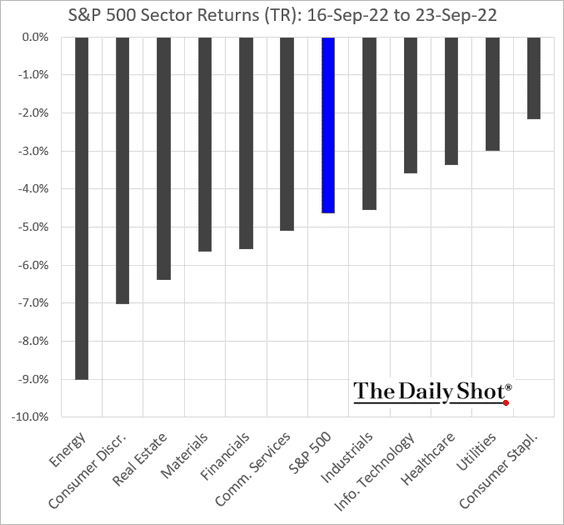
9. Next, we have some performance data from last week.
• Sectors:
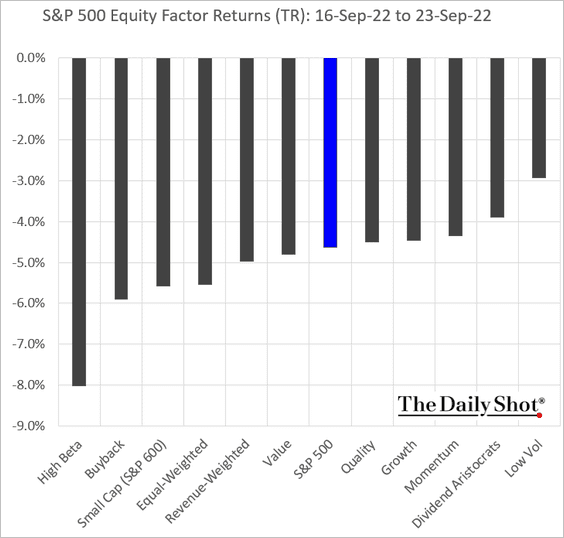
• Equity factors:
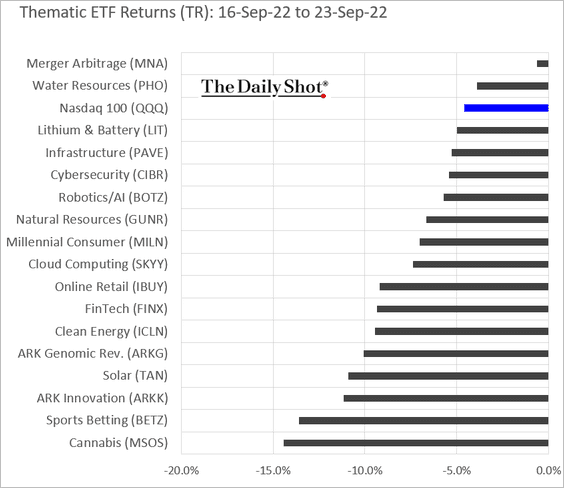
• Thematic ETFs:
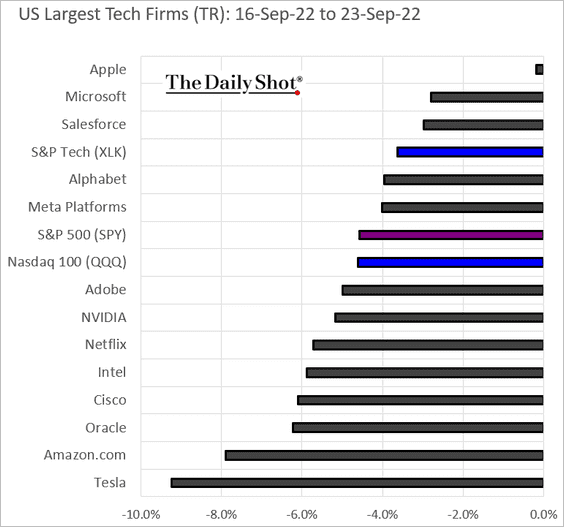
• The largest US tech firms:
Back to Index
Credit
1. Commercial property financing is becoming expensive.
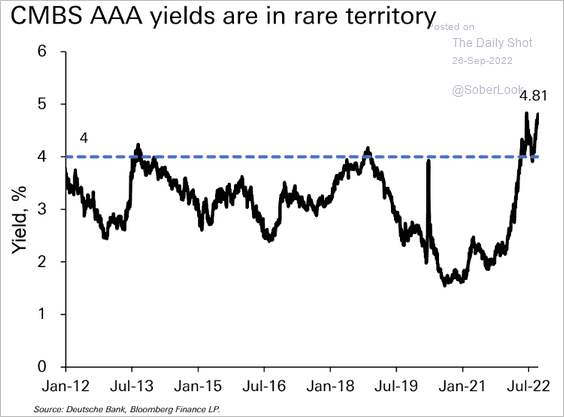 Source: Deutsche Bank Research
2. Business loan balances on banks’ balance sheets are returning to the pre-COVID trend.
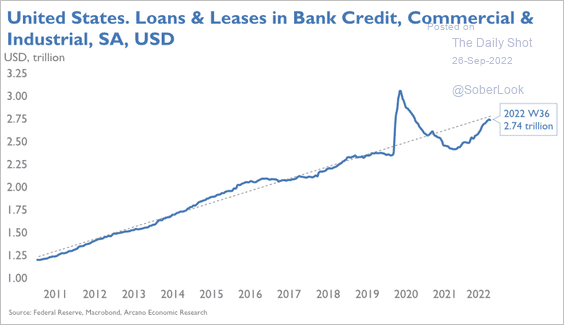 Source: Arcano Economics
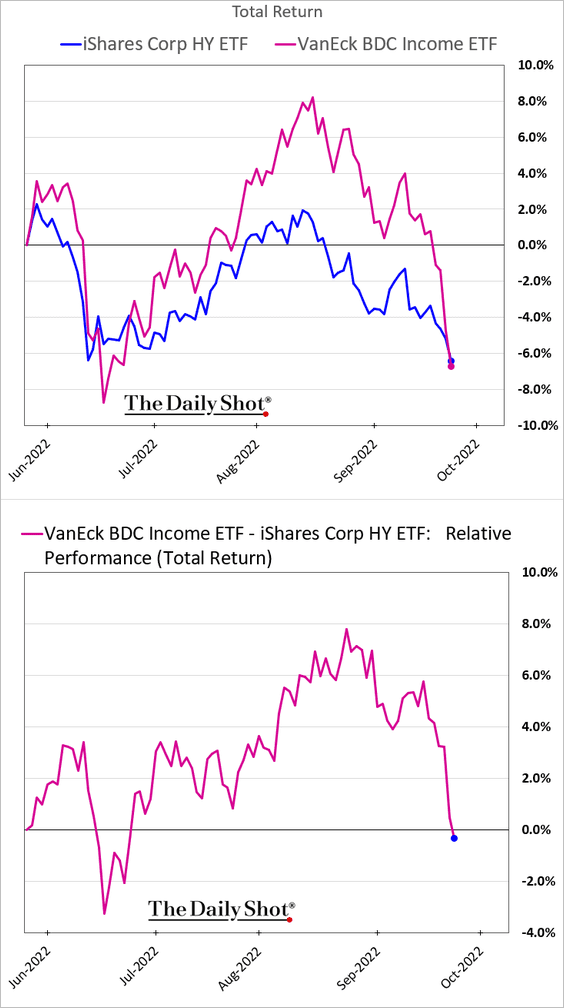
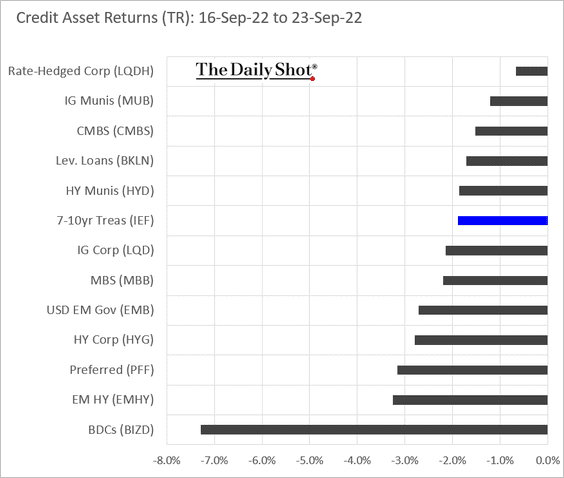
3. BDCs took a hit last week.
4. Here is a look at last week’s performance across credit asset classes.
Back to Index
Rates
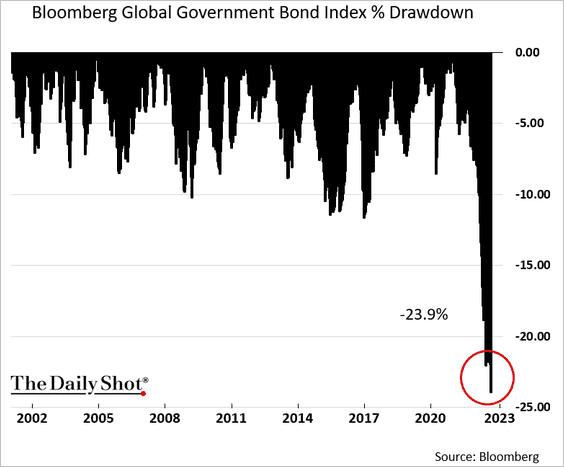
1. The drawdown in global government bonds has been unprecedented.
2. Real rates rather than inflation expectations have been driving Treasury yields higher.
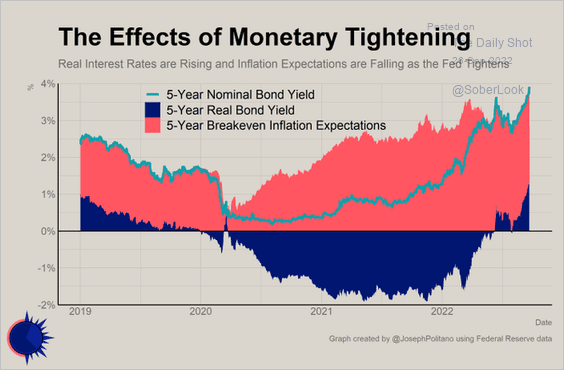 Source: @JosephPolitano
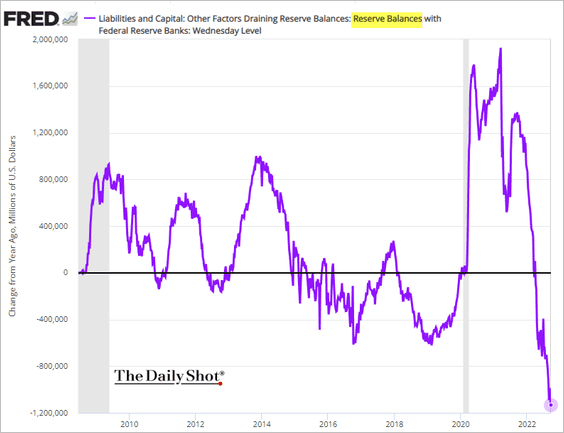
3. As mortgage refinancing activity ground to a halt, it became challenging for the Fed to reduce its MBS balances (without selling these bonds outright).
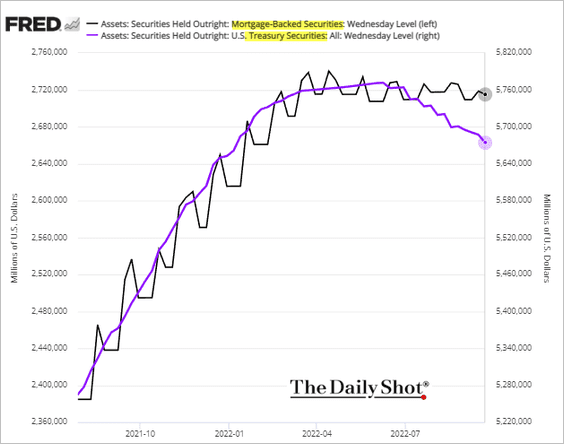
Nonetheless, reserve liquidity in the banking system is down sharply this year. This trend has been a headwind for risk assets.
——————–
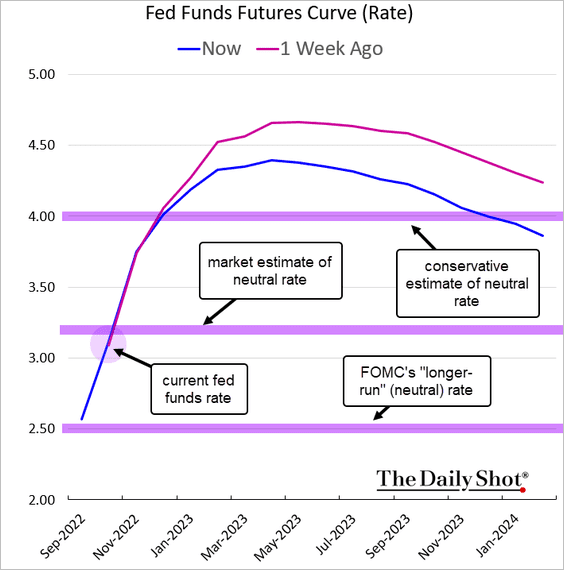
4. The market now prices the nominal long-run (“neutral”) rate above 3%.
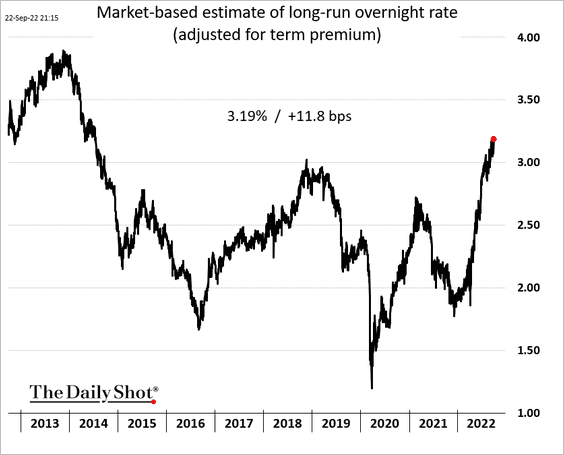
Others see the neutral rate as being even higher, perhaps closer to 4%. It would mean that the current fed funds rate is still accommodative. However, rate expectations are now well into restrictive territory.
Back to Index
Global Developments
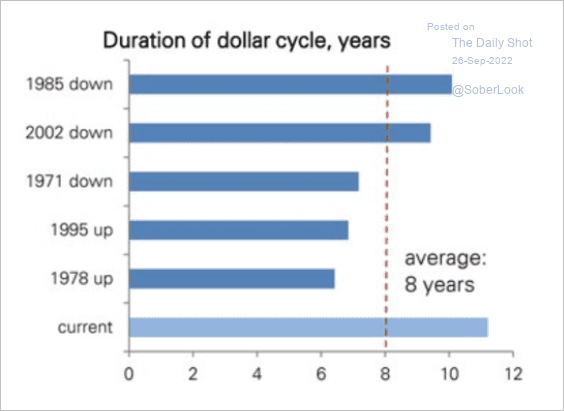
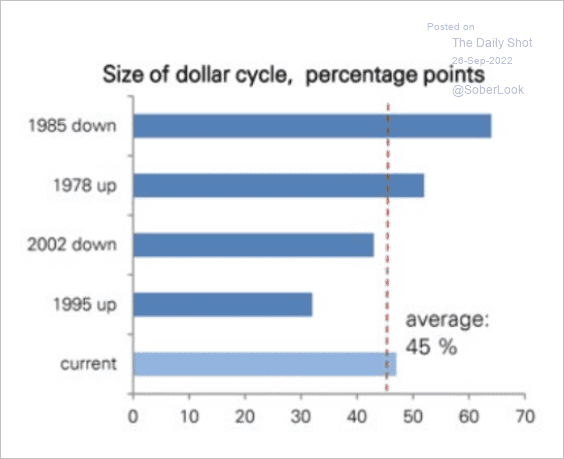
1. This has been the longest dollar cycle in history but more typical in magnitude (2 charts).
 Source: Deutsche Bank Research
 Source: Deutsche Bank Research
——————–
2. Higher yields will likely persist until a recession takes hold, which is ultimately bearish for risk assets, according to MRB Partners. And rising real yields are negative for gold, which reduces its safe-haven appeal.
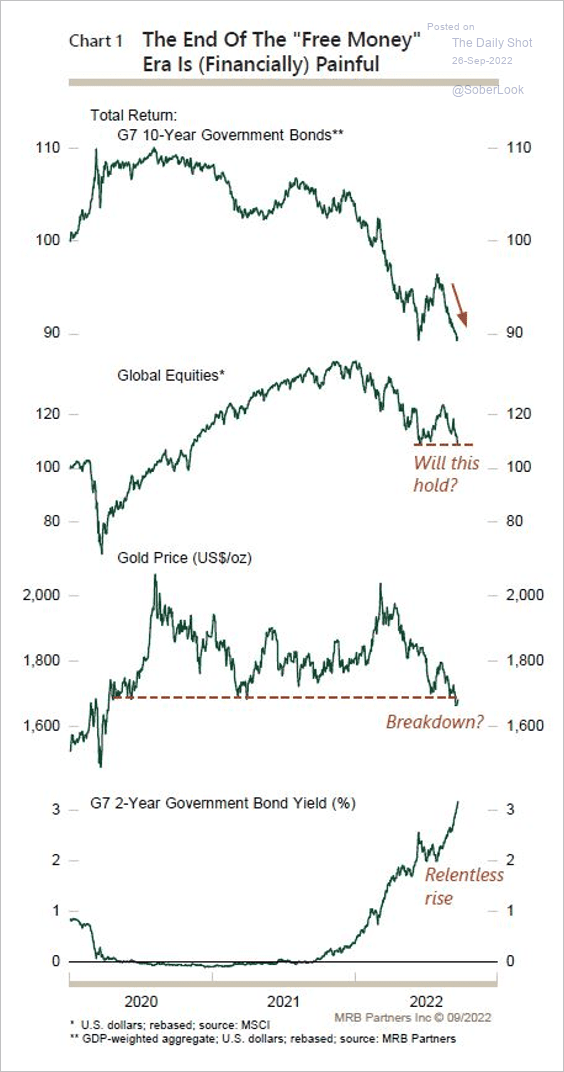 Source: MRB Partners
3. Supply shortages continue to ease.
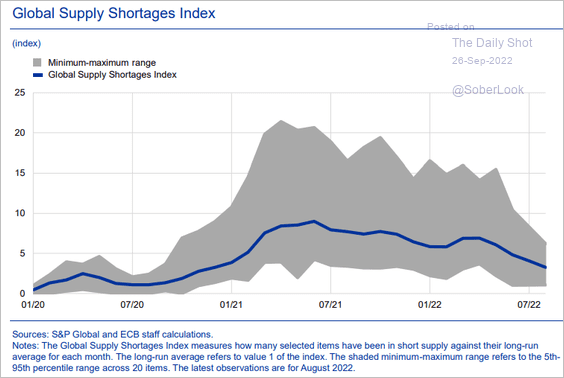 Source: ECB
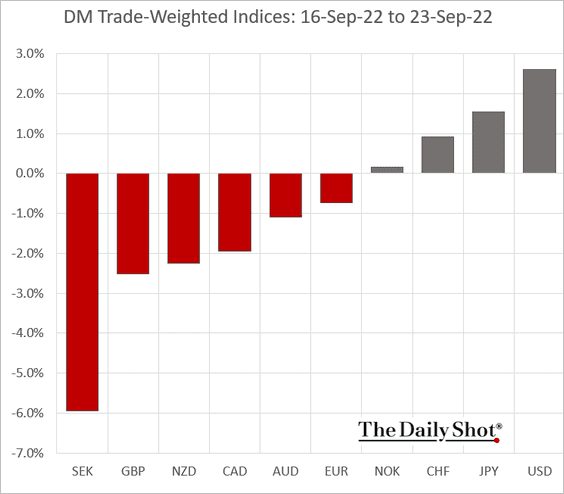
4. Next, we have some performance data from last week.
• DM trade-weighted currency indices:
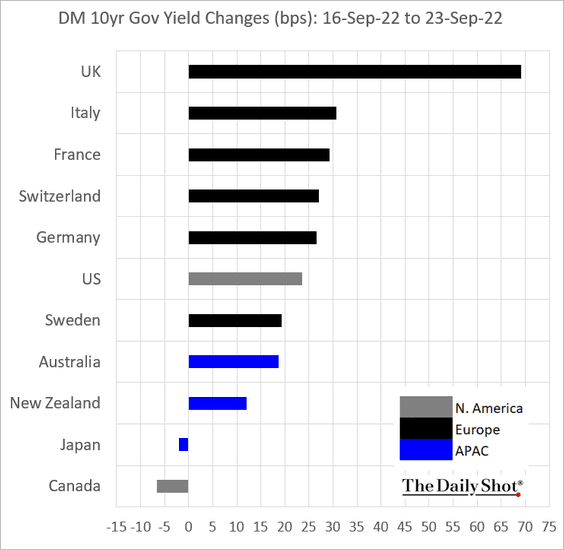
• Sovereign yields:
——————–
Food for Thought
1. Podcast preferences:
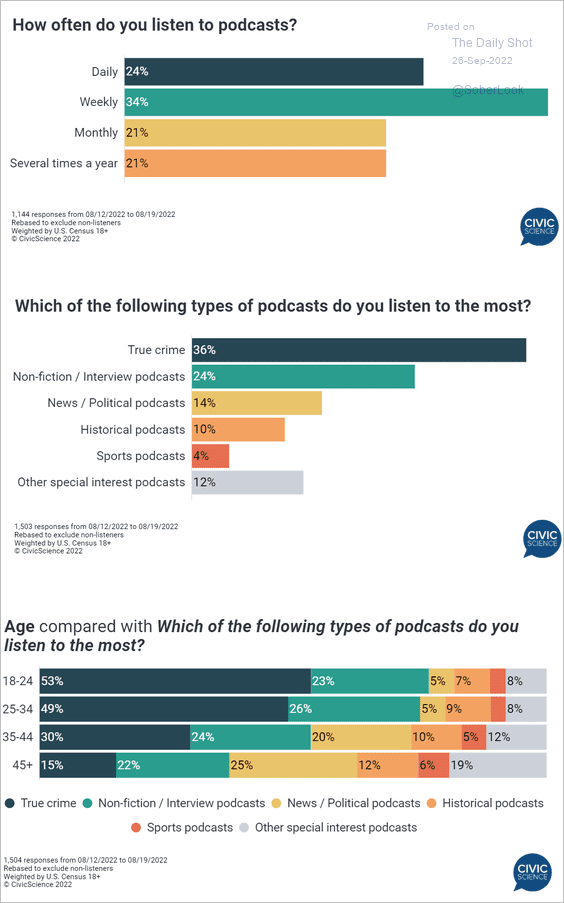 Source: @CivicScience Read full article
2. Cyber insurance premiums:
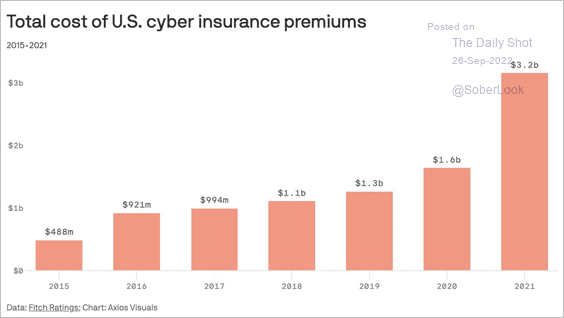 Source: @axios Read full article
3. Battery recycling:
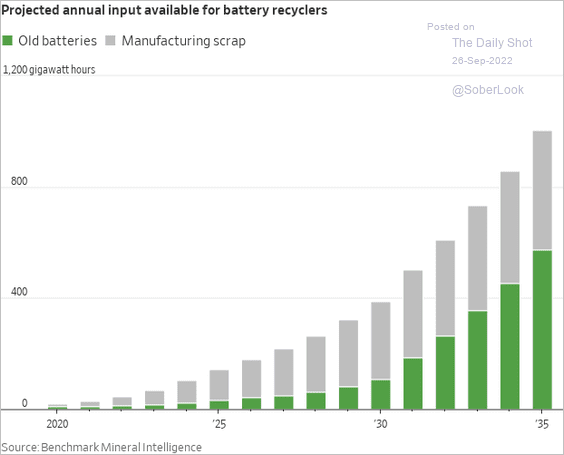 Source: @WSJ Read full article
4. GOP governors transporting migrants:
![]() Source: @axios Read full article
Source: @axios Read full article
5. US adults who reported being in fair or poor health:
 Source: USAFacts Read full article
6. Select US and Canadian university endowments:
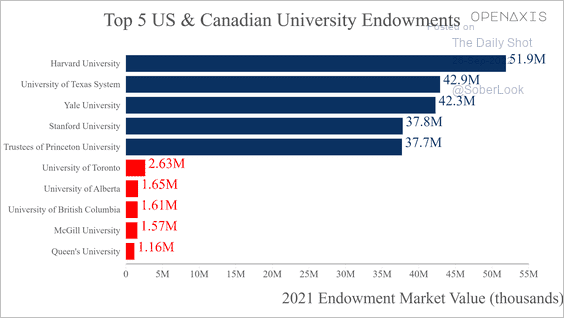 Source: @OpenAxisHQ
7. The periodic table of “endangered” elements:
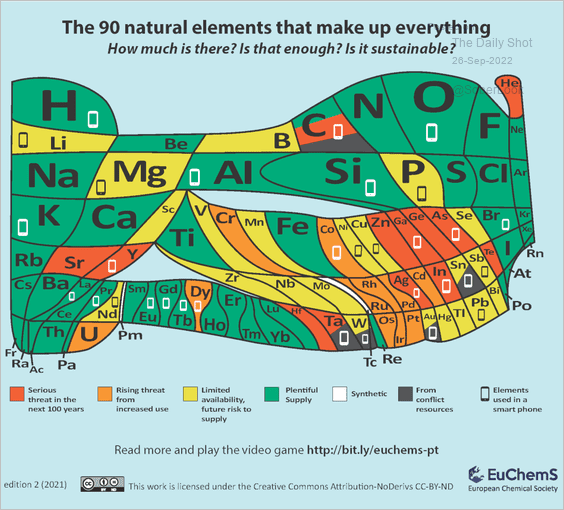 Source: Visual Capitalist Read full article
——————–
Back to Index