
The Daily Shot: 27-Sep-22
• The United States
• The United Kingdom
• The Eurozone
• Europe
• Asia – Pacific
• China
• Emerging Markets
• Cryptocurrency
• Commodities
• Energy
• Equities
• Rates
• Global Developments
• Food for Thought
The United States
1. Let’s begin with some data on recession risks.
• The yield curve inversion boosted the probability of a recession in the next few months.
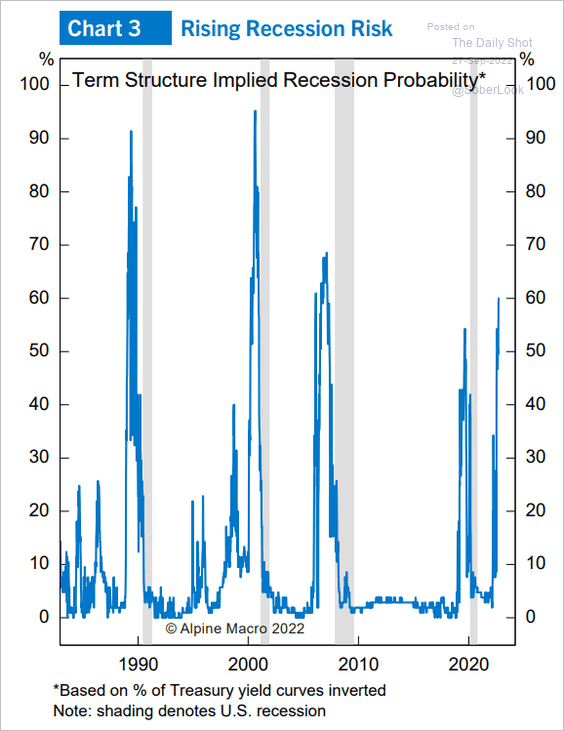 Source: Alpine Macro
• Recessions tend to get triggered when the fed funds rate reaches the misery index.
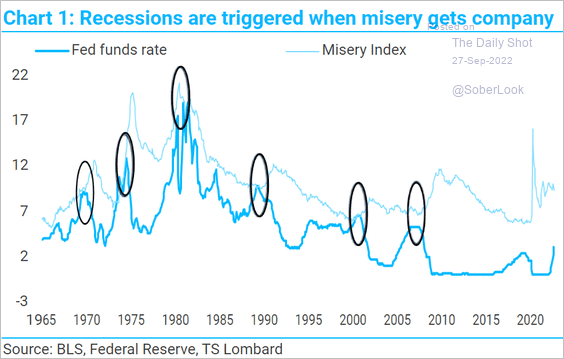 Source: TS Lombard
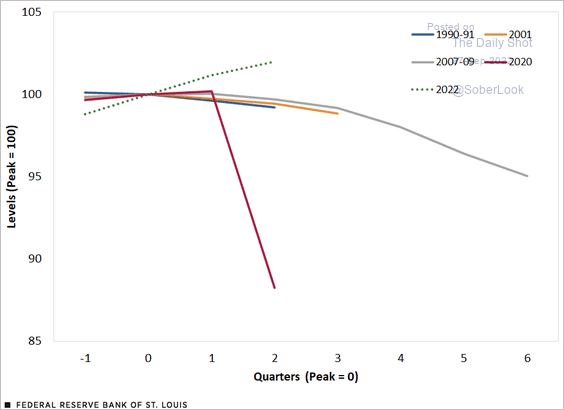
• Most economic indicators experience varying degrees of positive growth during the two quarters prior to a recession. However, immediately following the onset of a recession, all indicators simultaneously decline.
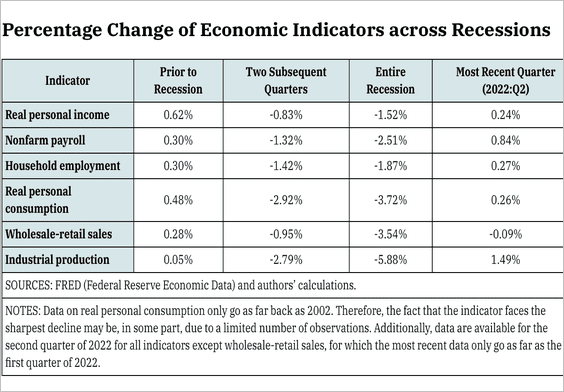 Source: St. Louis Fed Read full article
So far, industrial production and employment are still in growth mode despite this year’s technical recession (2 charts).
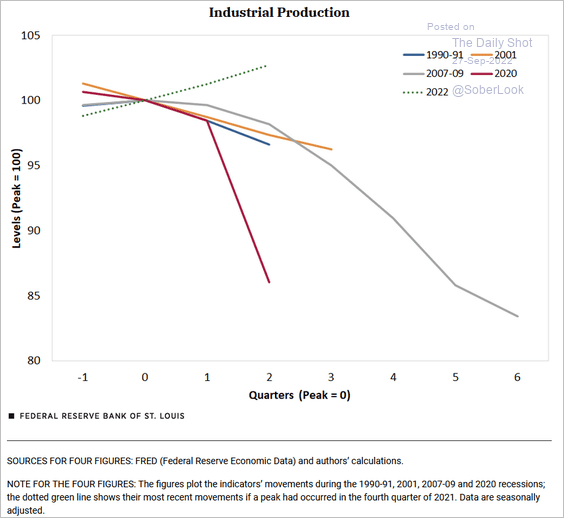 Source: St. Louis Fed Read full article
 Source: St. Louis Fed Read full article
——————–
2. The Fed has more wood to chop to dampen consumer demand.
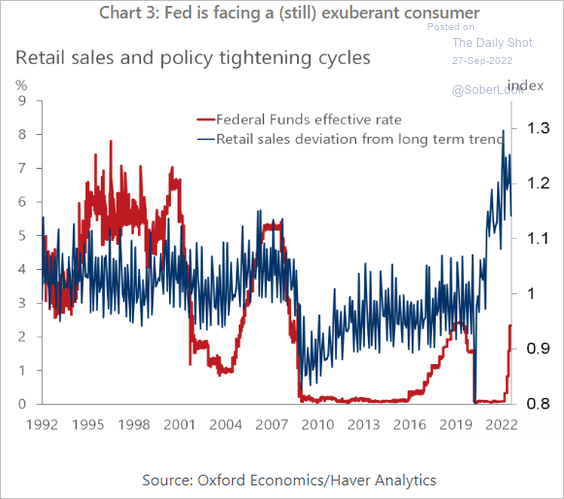 Source: Oxford Economics
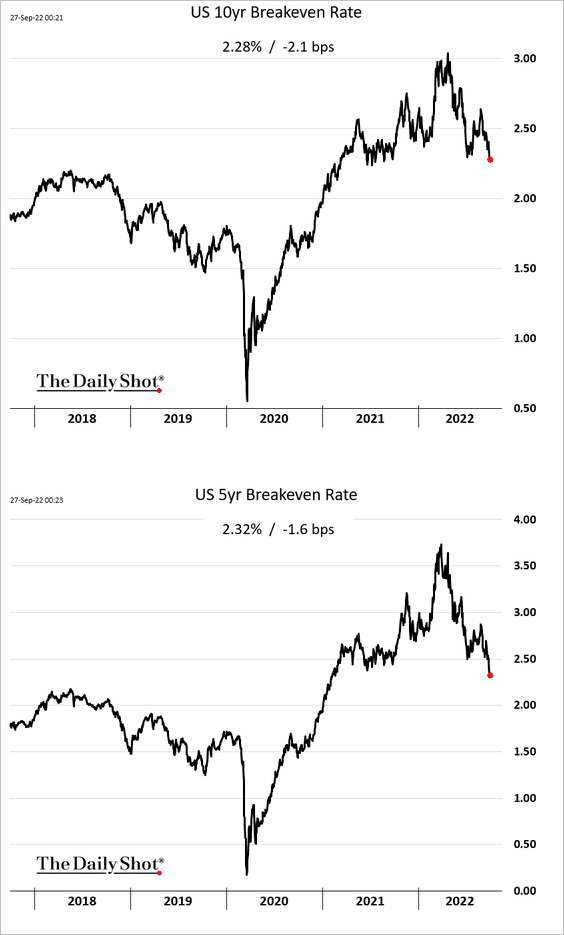
3. Market-based inflation expectations have been declining with oil prices.
4. The drawdown in US equity and fixed income markets has been extreme.
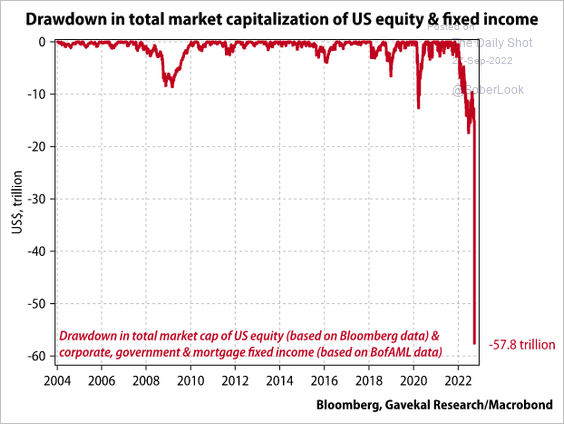 Source: Gavekal Research
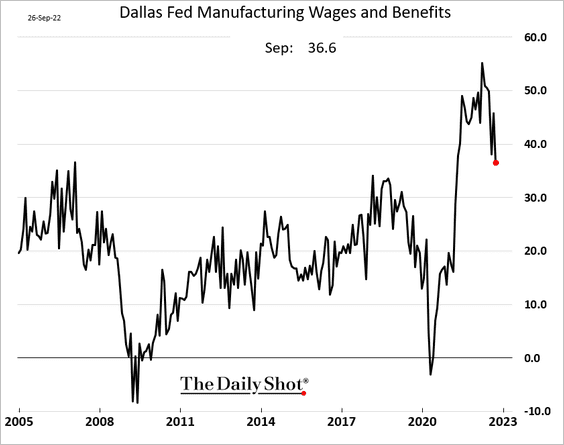
5. The Dallas Fed’s manufacturing index was softer than expected this month.
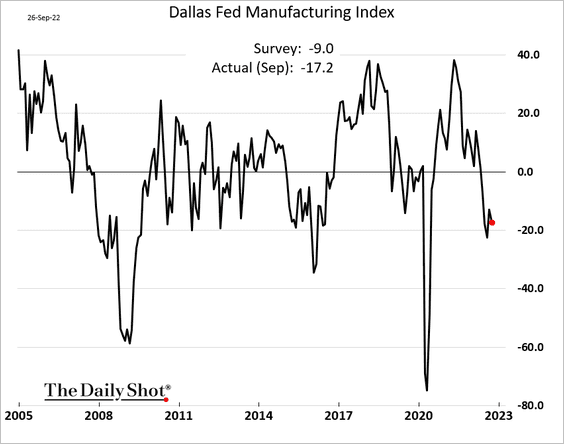
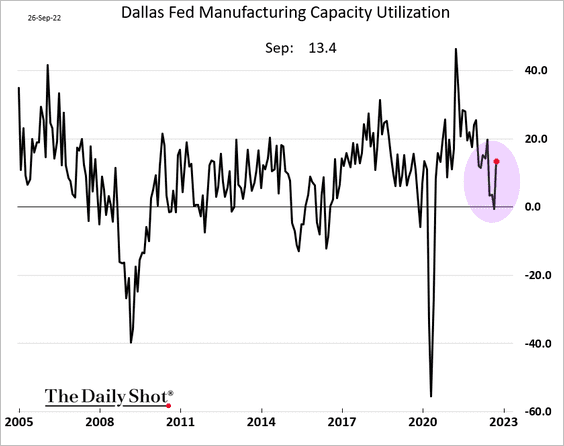
Most key indicators improved.
• Capacity utilization:
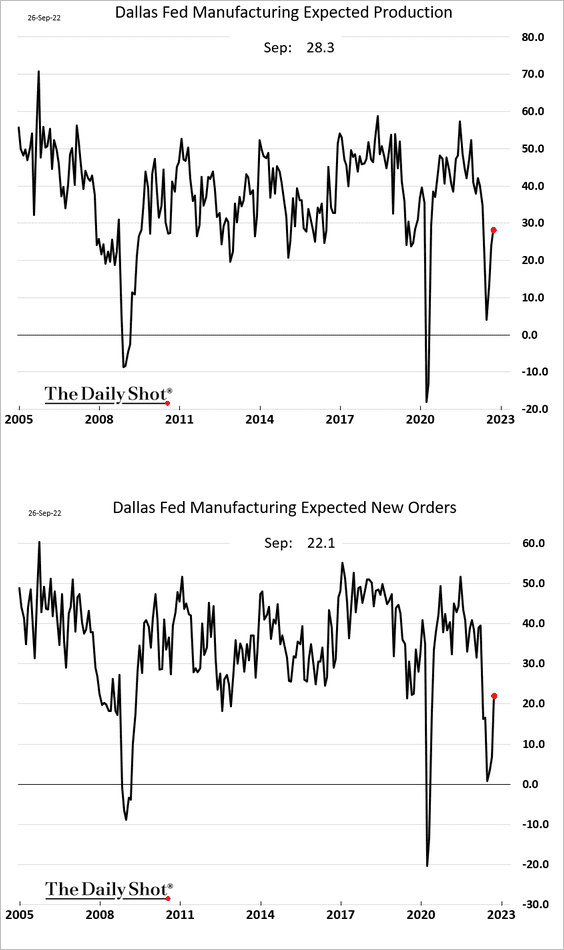
• Expected production and new orders:
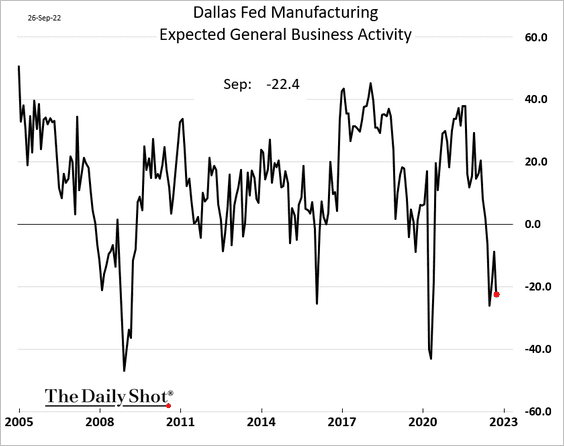
But expected business activity deteriorated.
Wage growth is moderating.
——————–
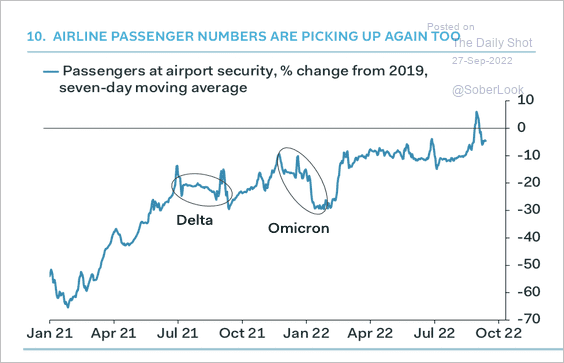
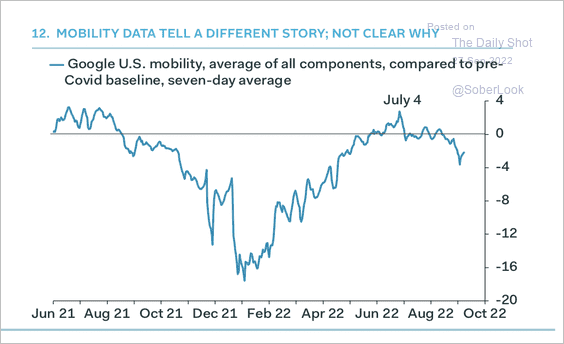
6. Airline passenger numbers have improved, but overall mobility is back below pre-COVID levels (2 charts).
 Source: Pantheon Macroeconomics
 Source: Pantheon Macroeconomics
Back to Index
The United Kingdom
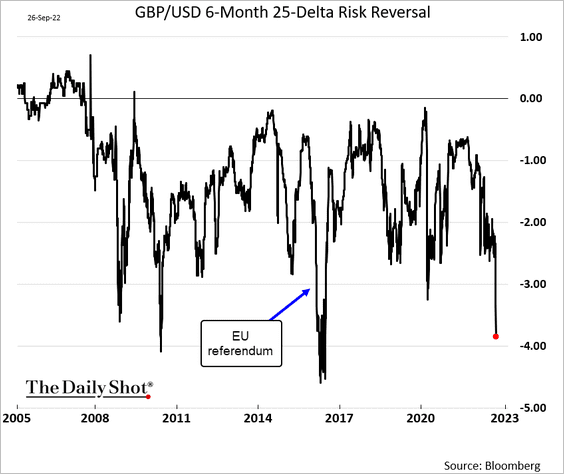
1. The GBP/USD implied volatility surged since the mini-budget announcement, …
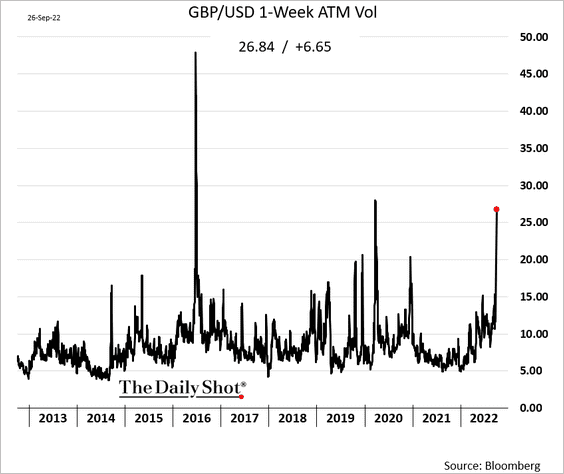
… as did downside protection costs.
——————–
2. GBP/USD is now cheap relative to fundamentals
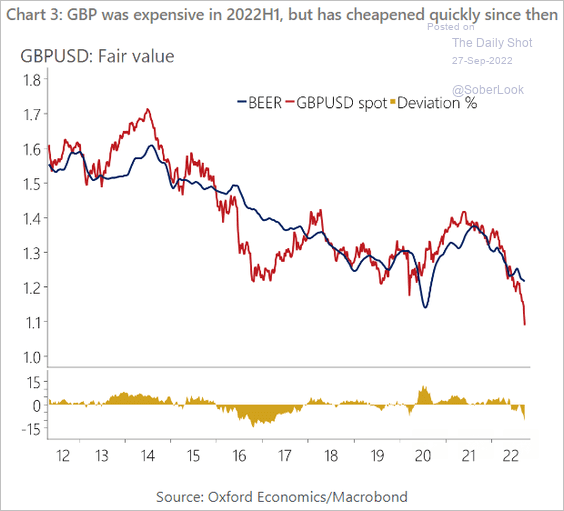 Source: Oxford Economics
3. The yield curve inversion is hitting extreme levels.
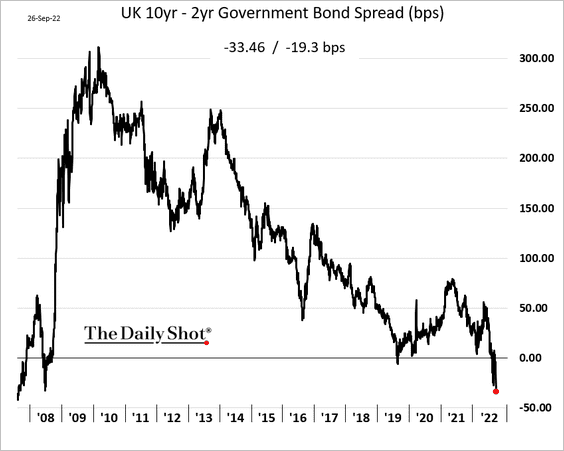
The nation’s recession probability now tops other advanced economies.
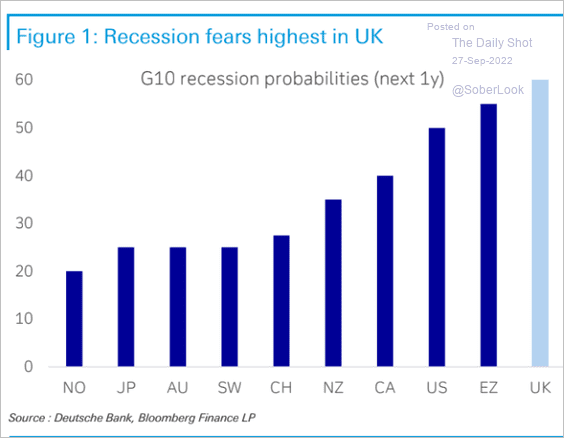 Source: Deutsche Bank Research
——————–
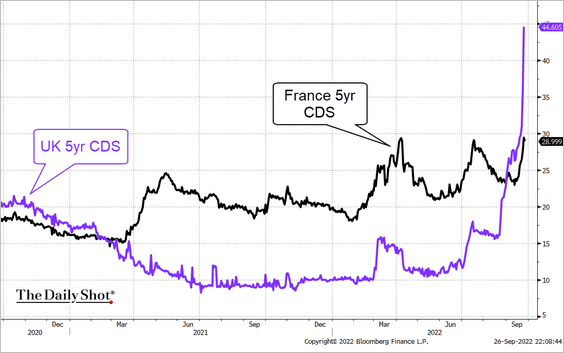
4. The UK sovereign CDS spread rose sharply.
 Source: @TheTerminal, Bloomberg Finance L.P.
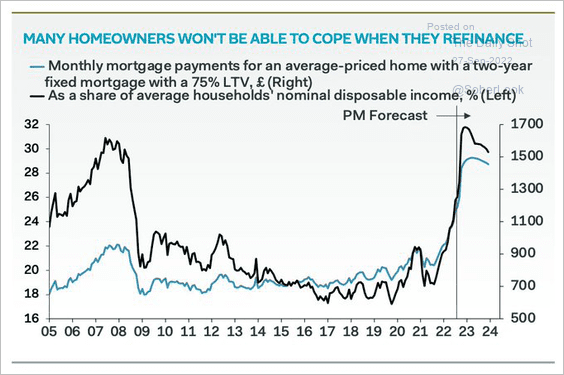
5. Mortgage payments are going to reset to much higher levels, putting severe pressure on household budgets.
Samuel Tombs (Pantheon Macroeconomics): – If mortgage rates rise to 6%-as implied by markets’ current expectations for Bank Rate-the average household refinancing a 2yr fixed rate mortgage in the first half of 2023 will see monthly repayments jump to £1,490, from £863. Many simply won’t be able to afford this …
 Source: @samueltombs
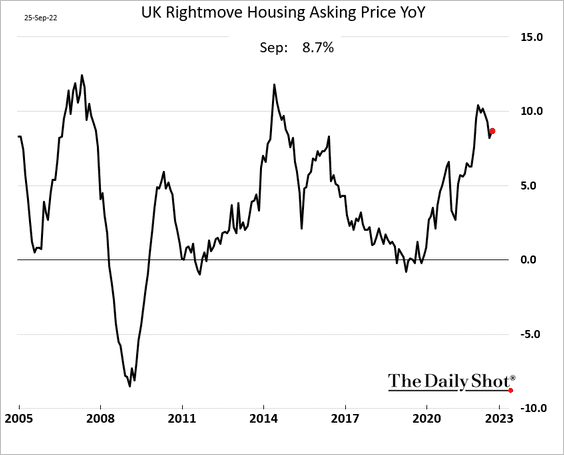
Home price appreciation, which has been resilient, will take a hit.
Back to Index
The Eurozone
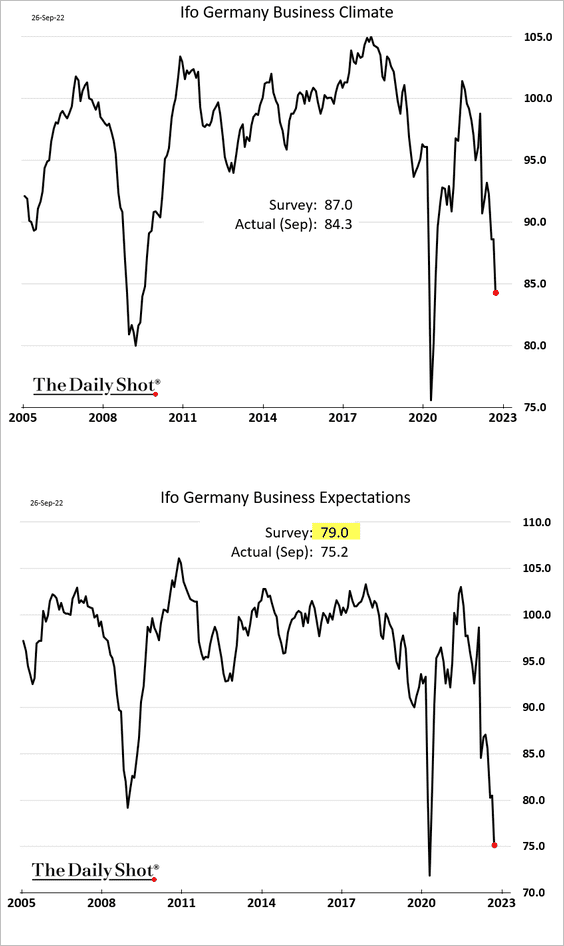
1. The Ifo report showed Germany’s business expectations hitting extreme lows.
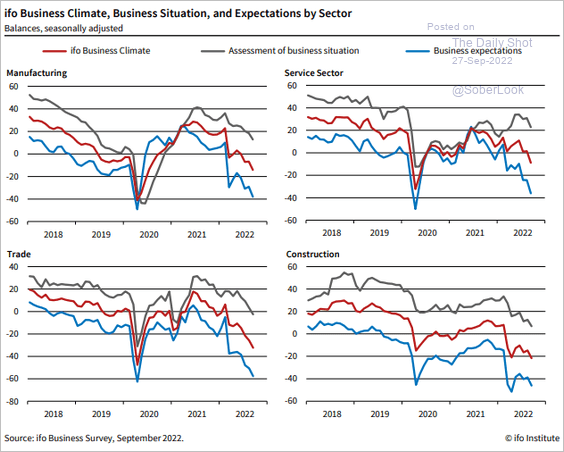 Source: ifo Institute
This trend doesn’t bode well for business investment and economic growth (2 charts).
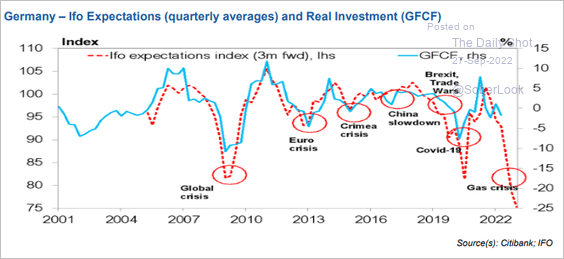 Source: III Capital Management
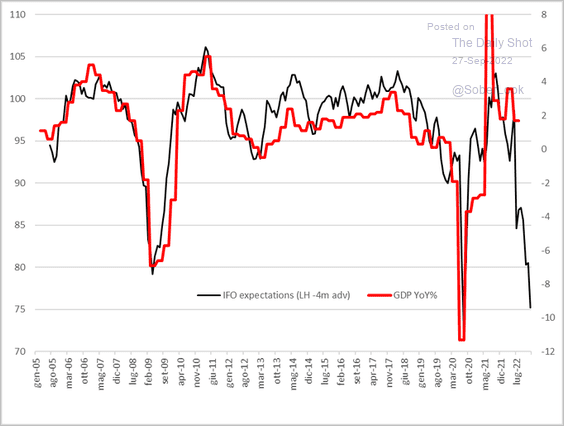 Source: @CavaggioniMario
——————–
2. Germany’s yield curve continues to flatten/invert.
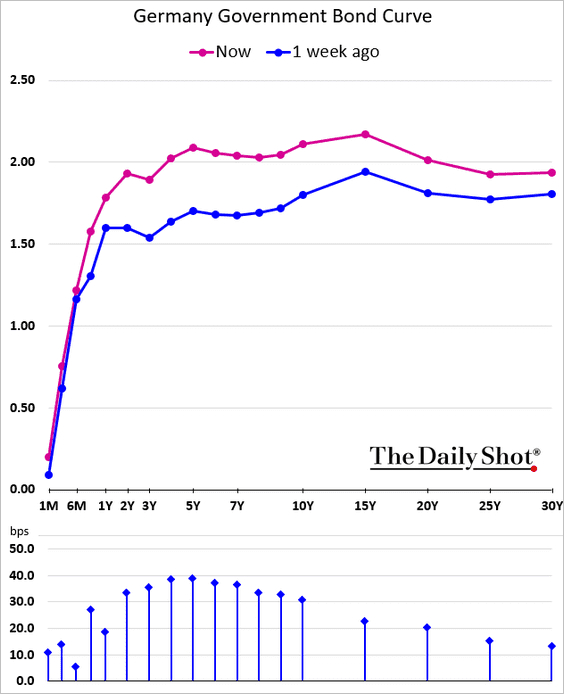
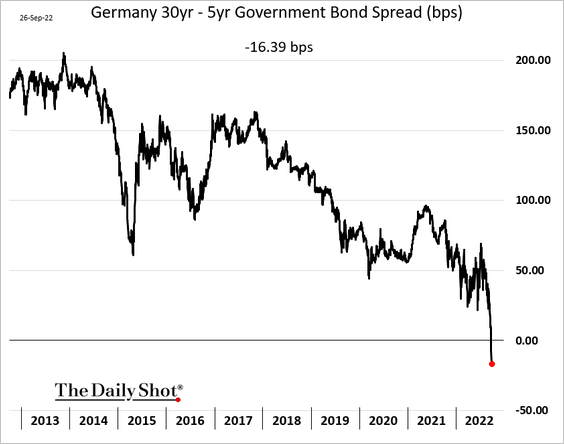
And there is more to come.
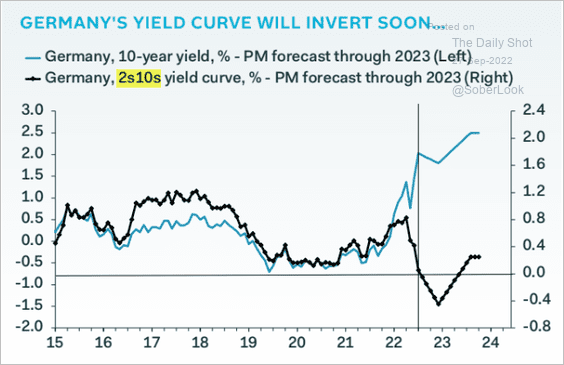 Source: Pantheon Macroeconomics
——————–
3. Next, we have some updates on Italy.
• The right-wing bloc won a clear majority in both houses.
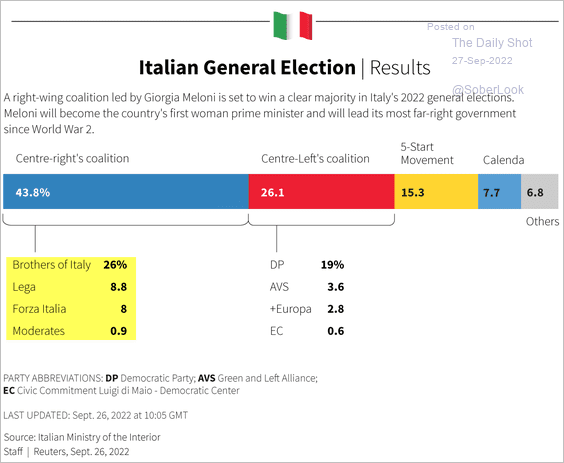 Source: Reuters Read full article
The Italy-Germany spread widened.
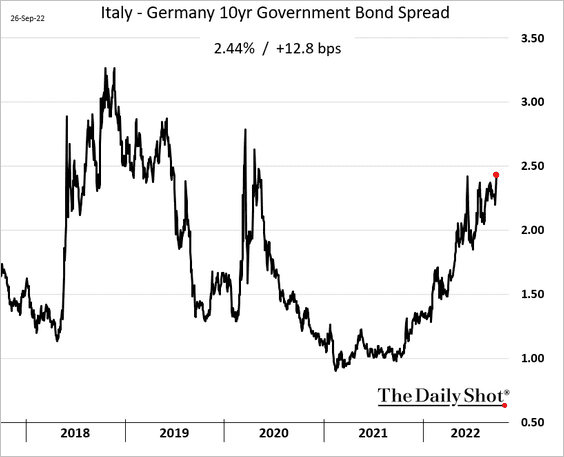
But the government struck a conciliatory tone toward the EU.
 Source: @Alemrome, @chiaraalbanese, @FlaviaRotondi, @bpolitics Read full article
• Here is voter turnout.
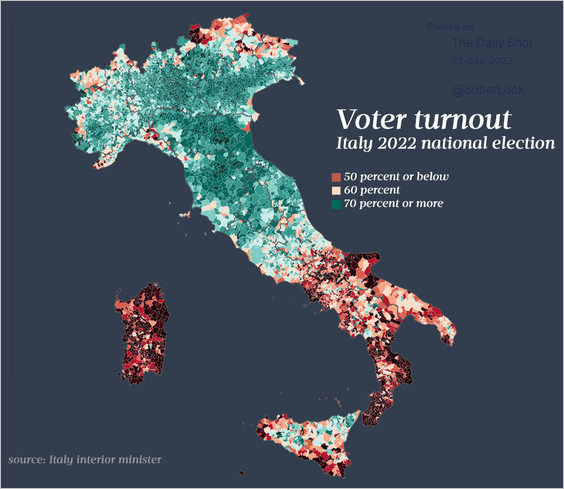 Source: Filippo Teoldi
• Italy could run out of natural gas this winter.
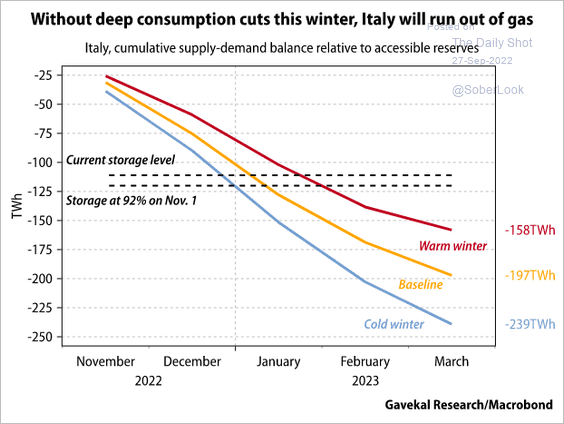 Source: Gavekal Research
• Italians have been relatively optimistic.
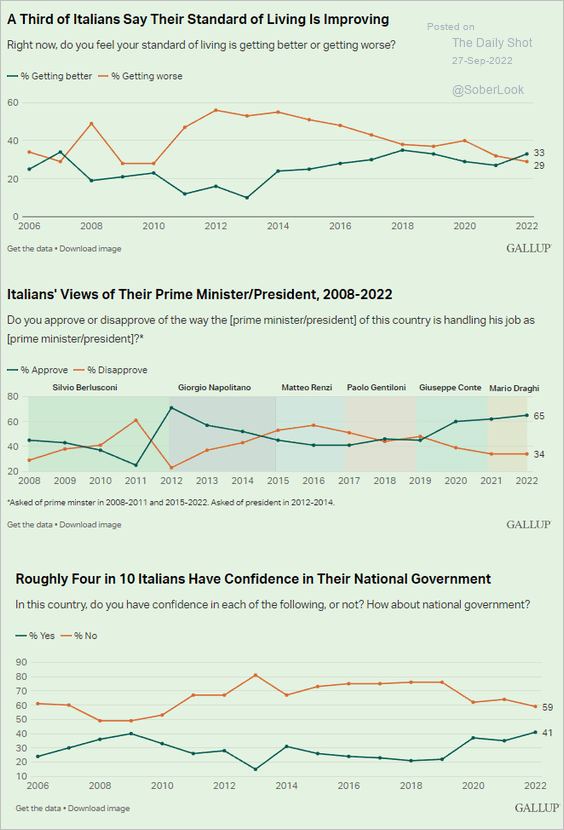 Source: Gallup Read full article
• The Italian debt-to-GDP ratio is expected to remain close to 150%.
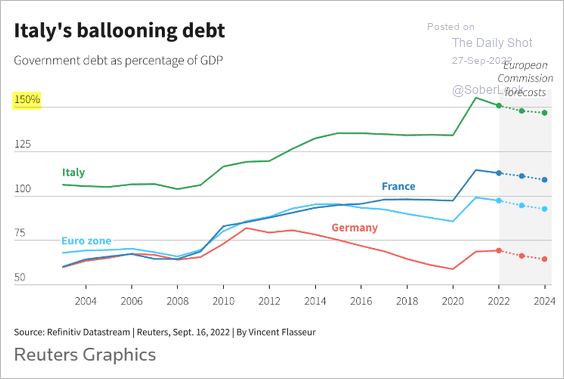 Source: Reuters Read full article
Here are some scenarios.
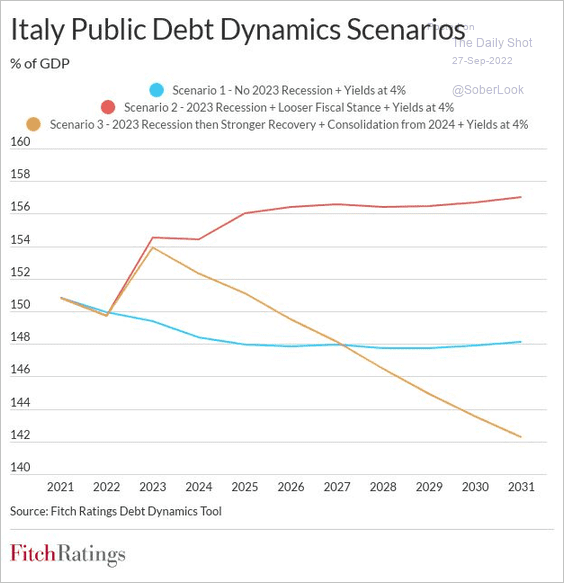 Source: Fitch Ratings
• Italian GDP growth has been consistently underperforming the Eurozone.
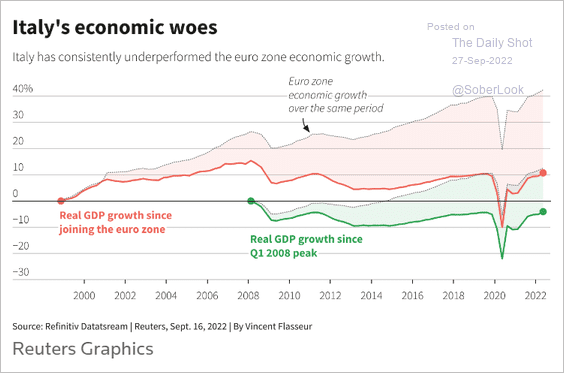 Source: Reuters Read full article
Back to Index
Europe
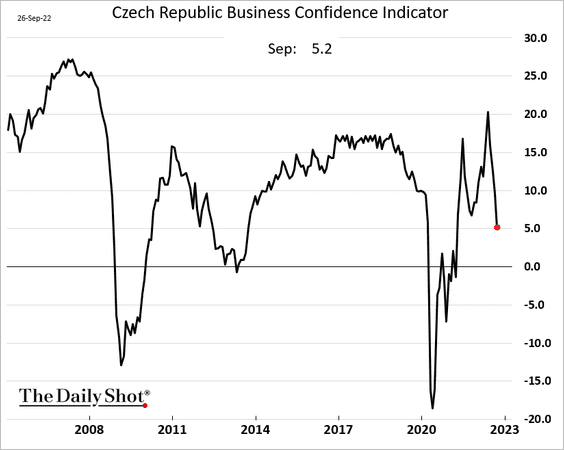
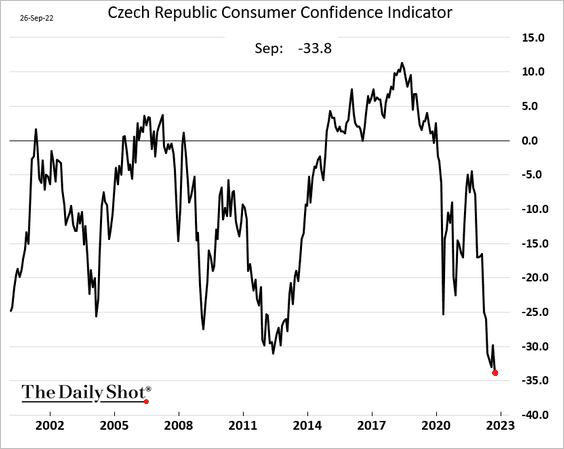
1. Czech business confidence has rolled over.
And consumer confidence hit a new low.
——————–
2. How much have European governments allocated since September 2021 to shield households and businesses from rising energy prices?
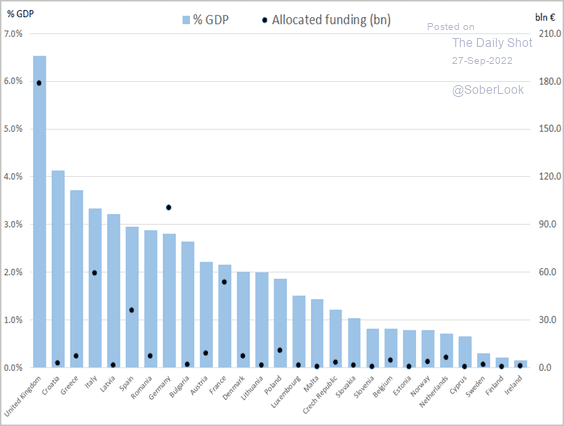 Source: @Tagliapietra_S, @Bruegel_org, @GSgaravatti Read full article
Back to Index
Asia – Pacific
1. This chart shows the contributions to Japan’s trade balance.
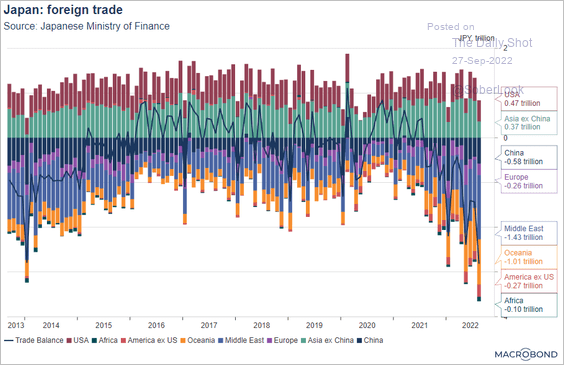 Source: Macrobond
2. South Korea’s consumer confidence improved this month.
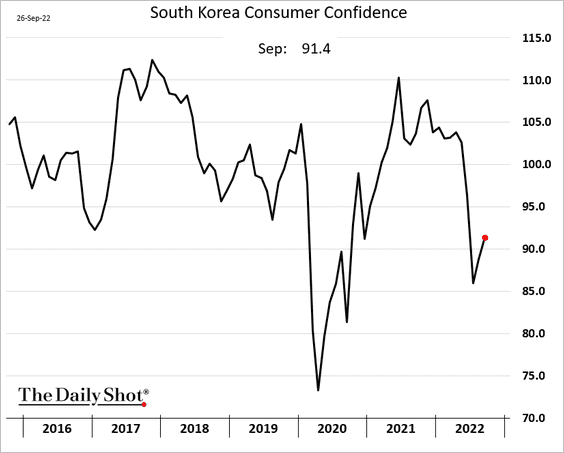
China’s lockdowns dampened its purchases from South Korea.
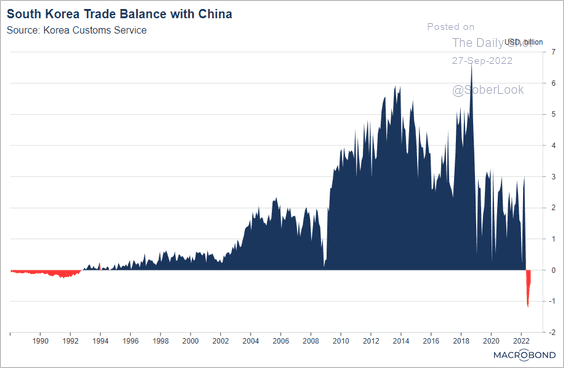 Source: Macrobond
——————–
3. Singapore is taking financial services “market share” from Hong Kong.
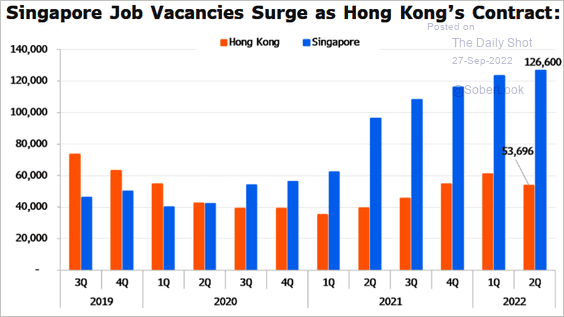 Source: Francis Chan, Bloomberg Intelligence Read full article
Back to Index
China
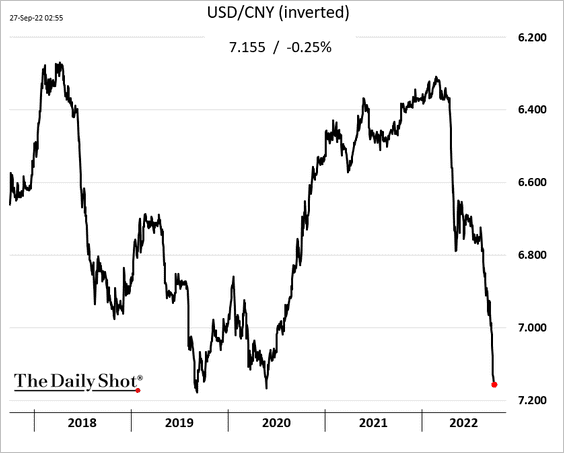
1. The PBoC continues its attempts to prod the renmonbi higher.
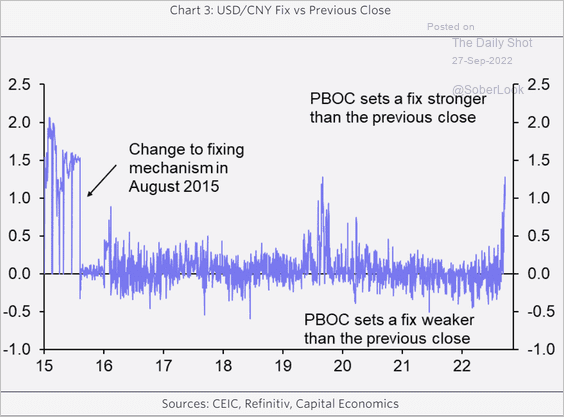 Source: Capital Economics
It hasn’t worked so far.
——————–
2. The current property market downturn has been the worst on record.
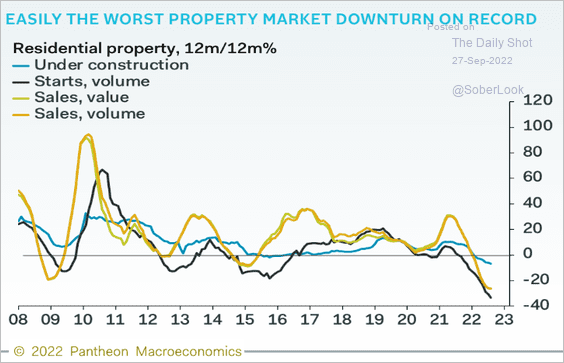 Source: Pantheon Macroeconomics
![]() Source: Arcano Economics
Source: Arcano Economics
——————–
3. Retail sales remain well below the pre-COVID trend.
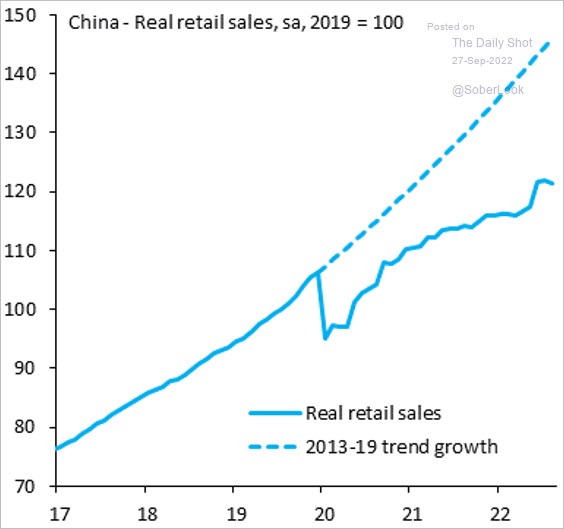 Source: @SergiLanauIIF
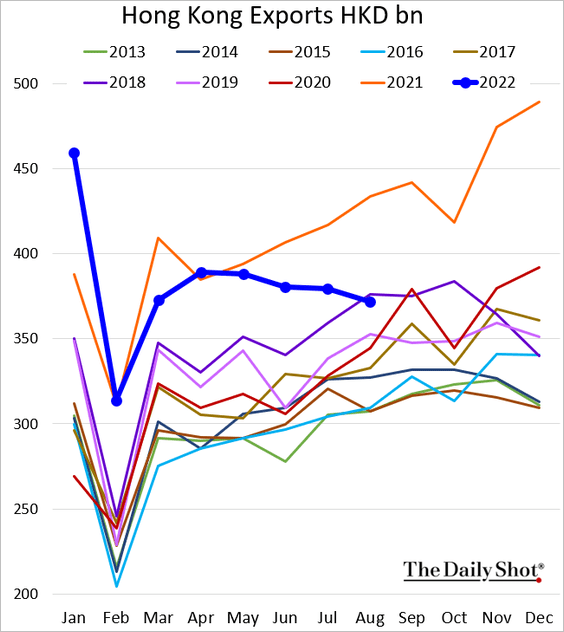
4. Hong Kong’s exports continue to soften.
Back to Index
Emerging Markets
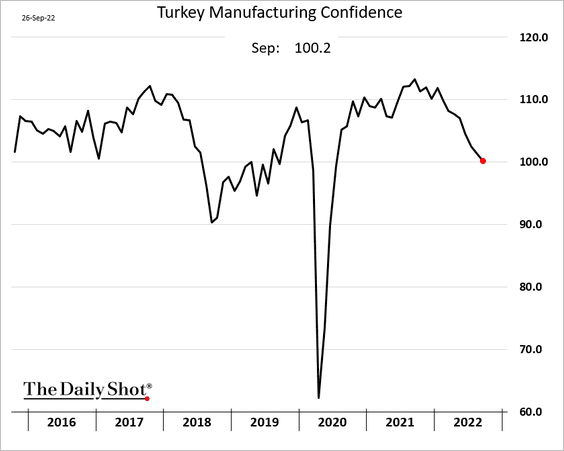
1. Turkey’s manufacturing confidence keeps trending lower.
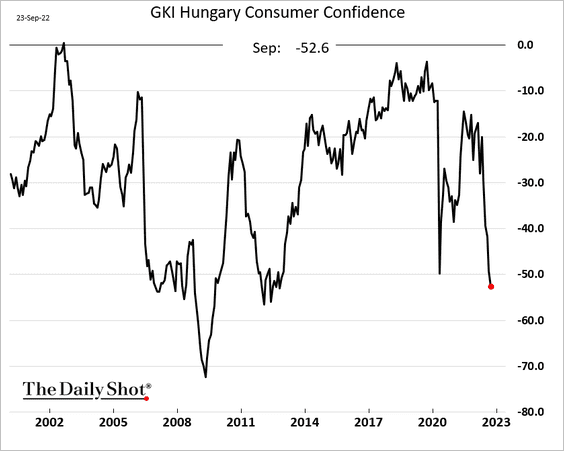
2. Hungary’s consumer confidence is deteriorating.
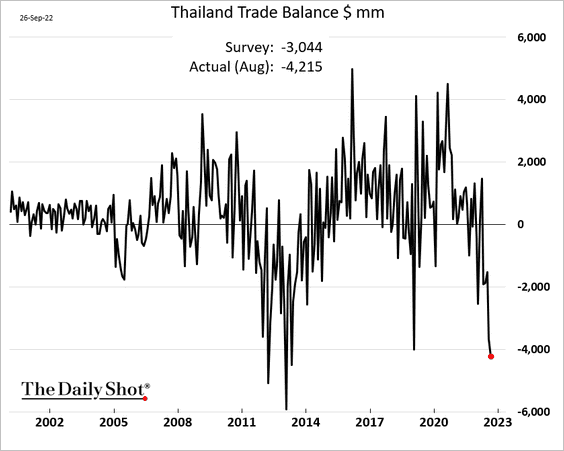
3. Here is Thailand’s trade balance.
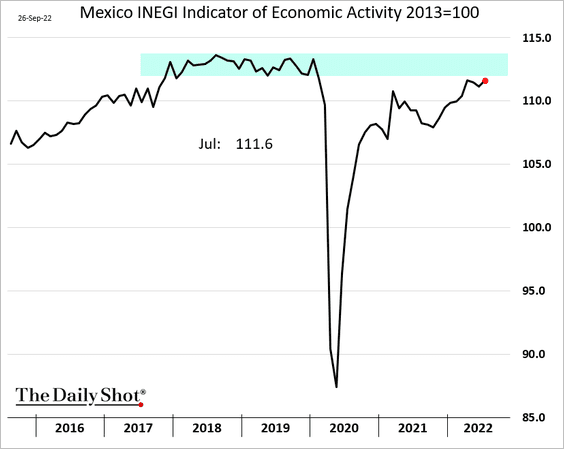
4. Mexico’s economic activity is trending higher but remains below pre-COVID levels.
5. This chart shows Brazil’s presidential job approval over time.
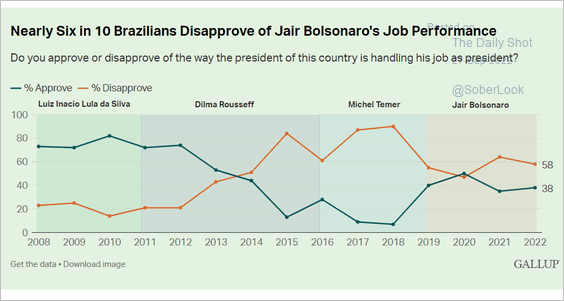 Source: Gallup Read full article
6. There are early signs that the EM profit cycle is beginning to recover.
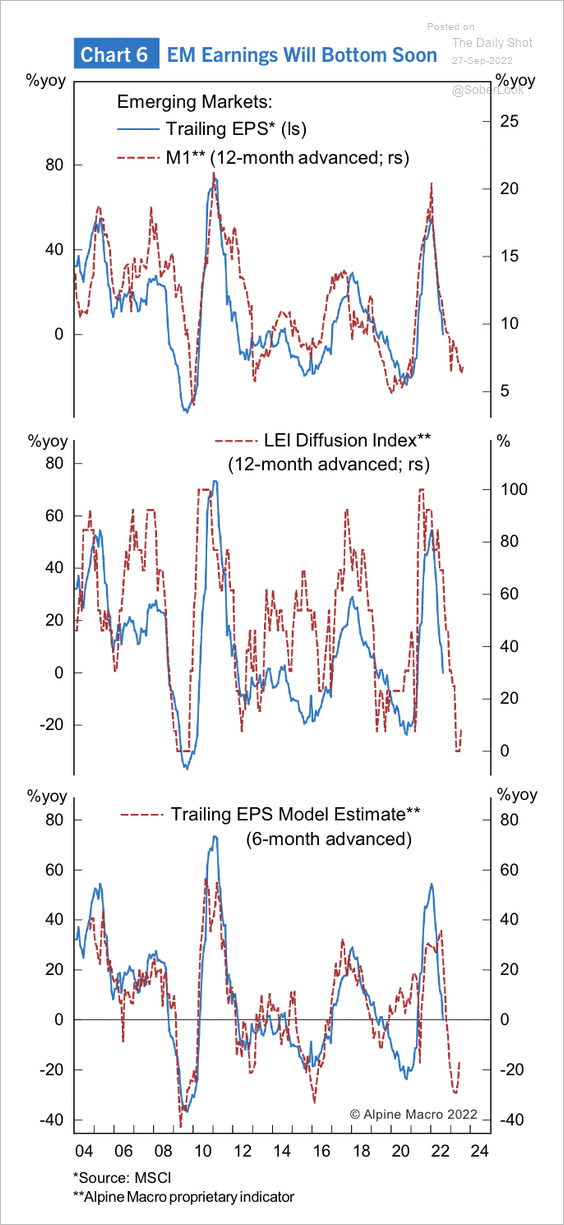 Source: Alpine Macro
Back to Index
Cryptocurrency
1. Crypto investment products saw minor inflows last week, led by Ethereum-focused funds (following significant outflows year-to-date).
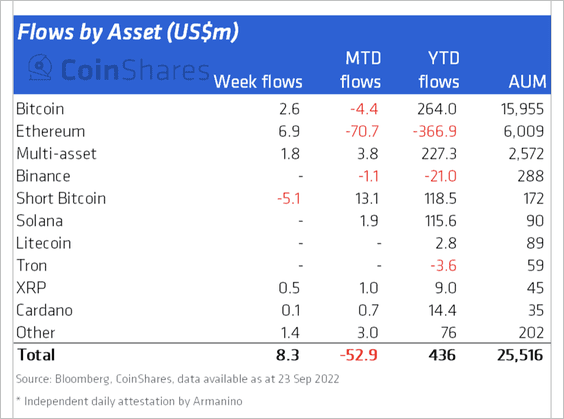 Source: CoinShares Read full article
Funds in Germany and Switzerland accounted for most inflows last week, while Canadian funds continued to see outflows.
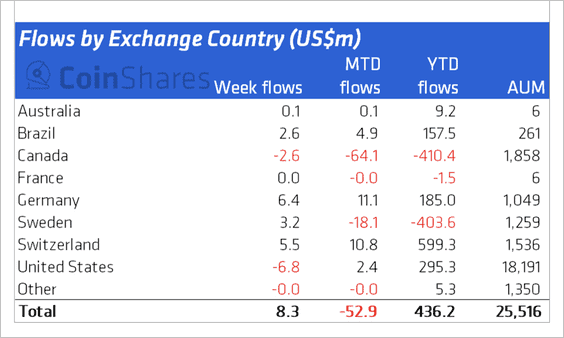 Source: CoinShares Read full article
——————–
2. The BTC/ETH price ratio is approaching initial resistance at its 200-day moving average. That could indicate a brief pause in the crypto sell-off.
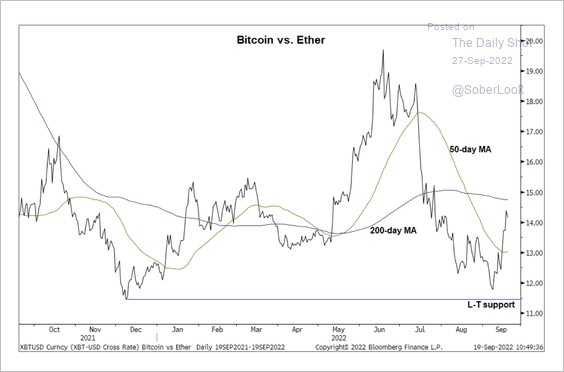 Source: @StocktonKatie
3. Monthly Bitcoin network adoption has reached a new cycle low, indicating a declining influx of new users on the blockchain.
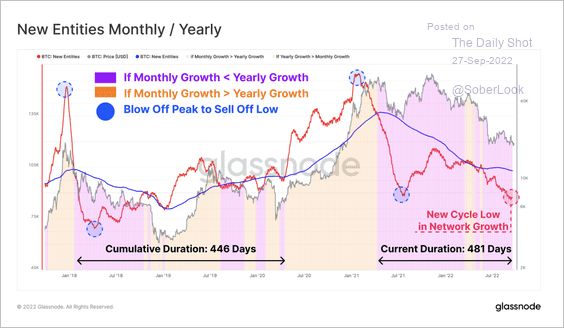 Source: Glassnode Read full article
4. Transfer volume on the Bitcoin network has also collapsed but is not yet extreme compared to prior lows.
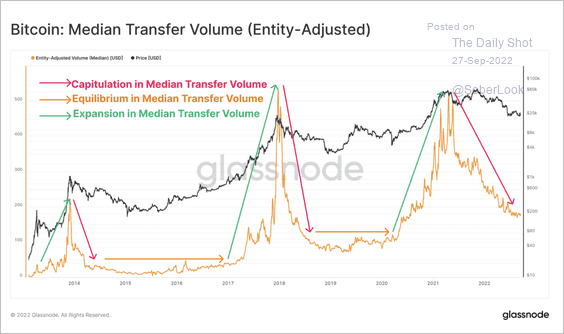 Source: Glassnode Read full article
Back to Index
Commodities
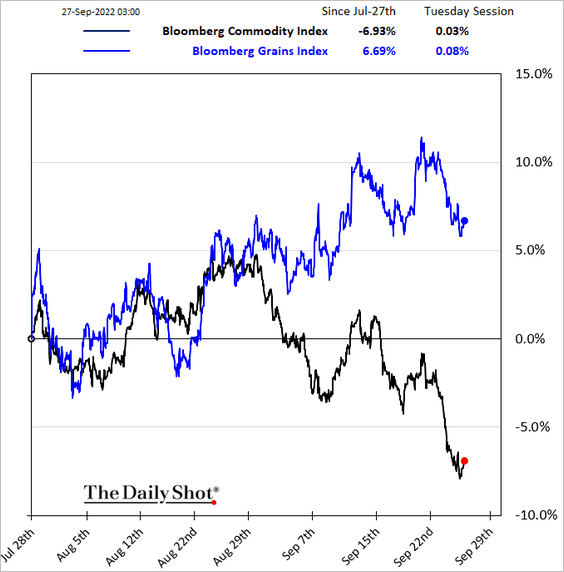
1. Grains continue to outperform.
2. Fitch expects lower steel prices, driven by ongoing weakness in China’s property market alongside looming recession risks in Europe.
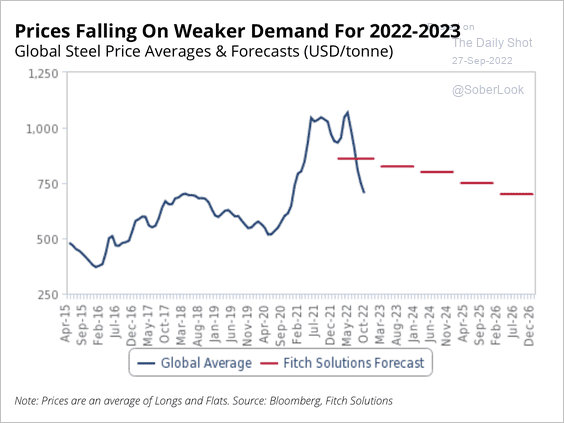 Source: Fitch Solutions Macro Research
3. The strong dollar and weaker economic growth have triggered a cyclical decline in commodity prices.
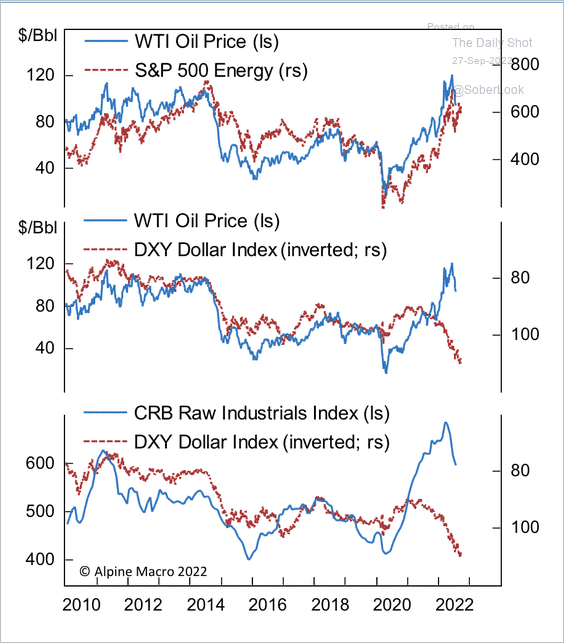 Source: Alpine Macro
Back to Index
Energy
1. Asia is increasingly dependent on LNG imports.
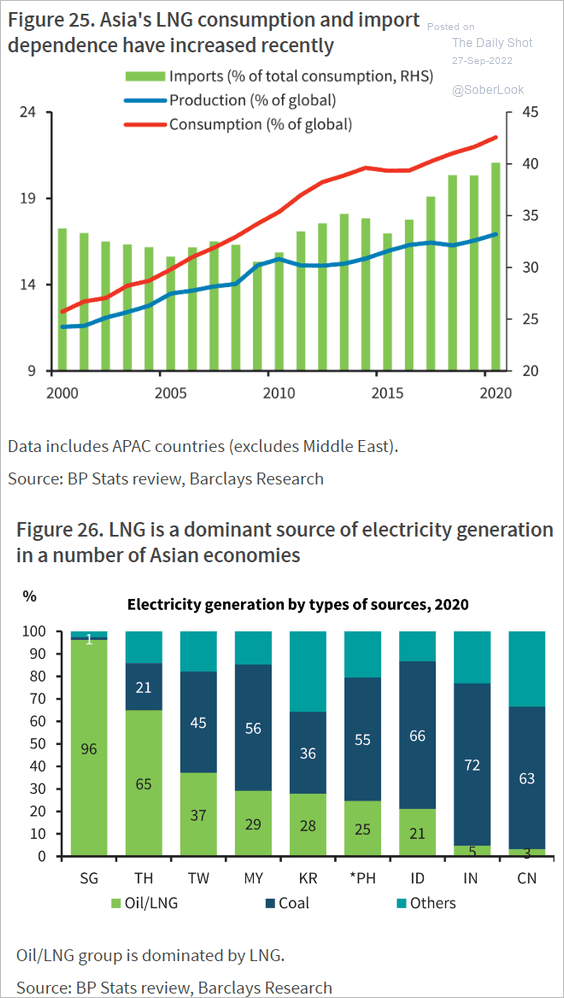 Source: Barclays Research
2. Lower oil prices could result in downgrades of energy sector forward earnings.
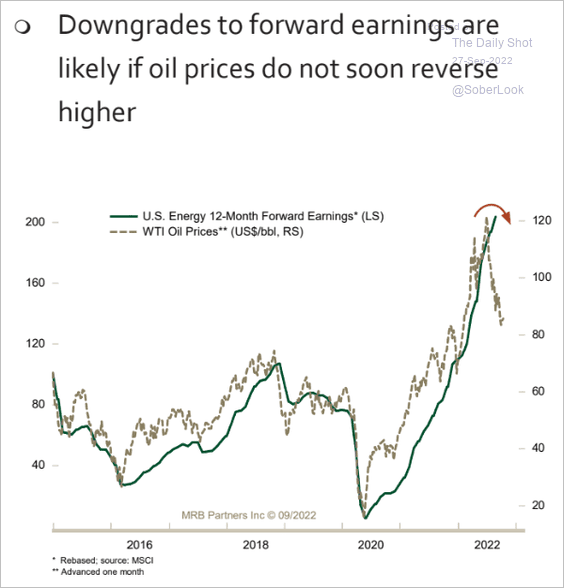 Source: MRB Partners
Back to Index
Equities
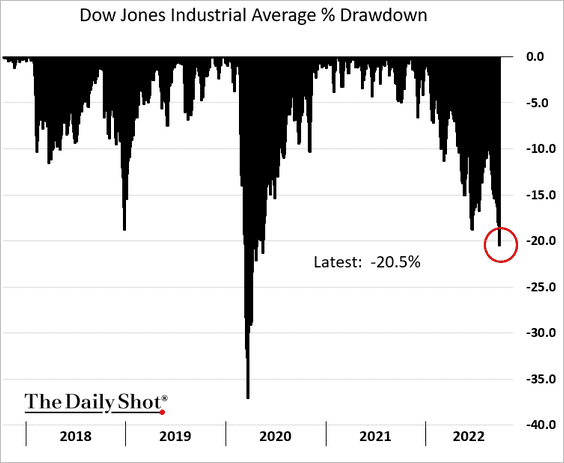
1. The S&P 500 is on course for one of the worst years in recent decades.
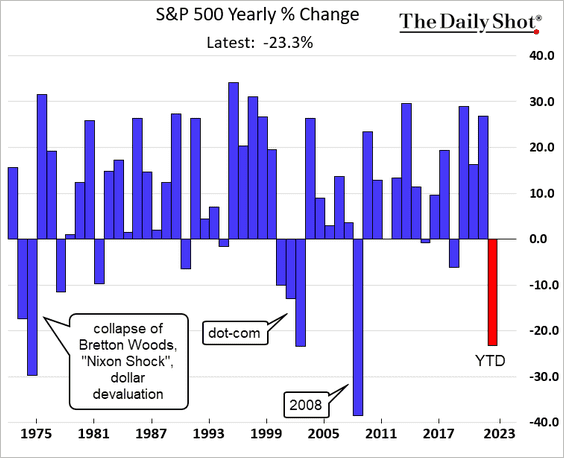
The Dow hit bear-market territory.
——————–
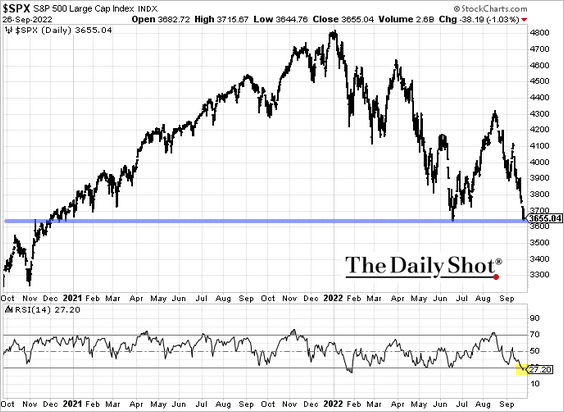
2. The S&P 500 is at support, with technical indicators (such as the RSI) pointing to a market bounce.
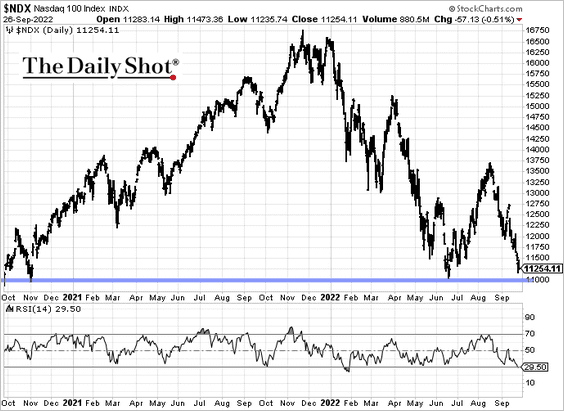
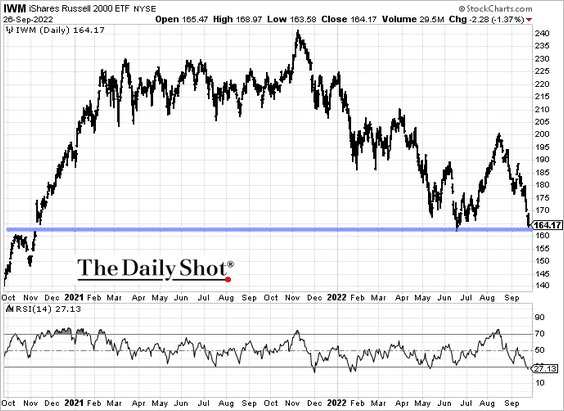
• Other indices are at support as well.
– Nasdaq 100:
– Russell 2000 (IWM):
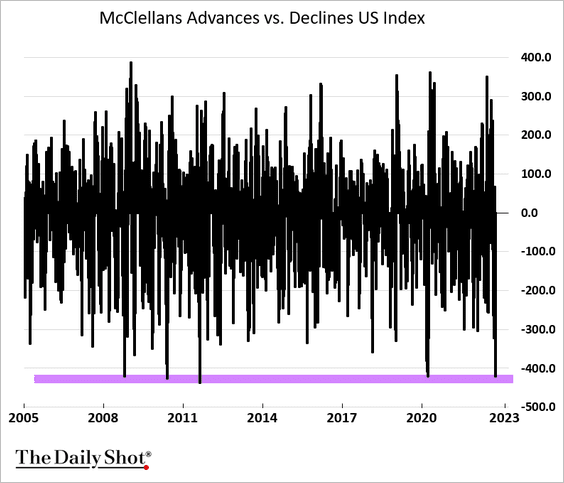
• The percentage of S&P 500 names trading above their 50-day moving average is at extreme lows (typically pointing to a market bounce).
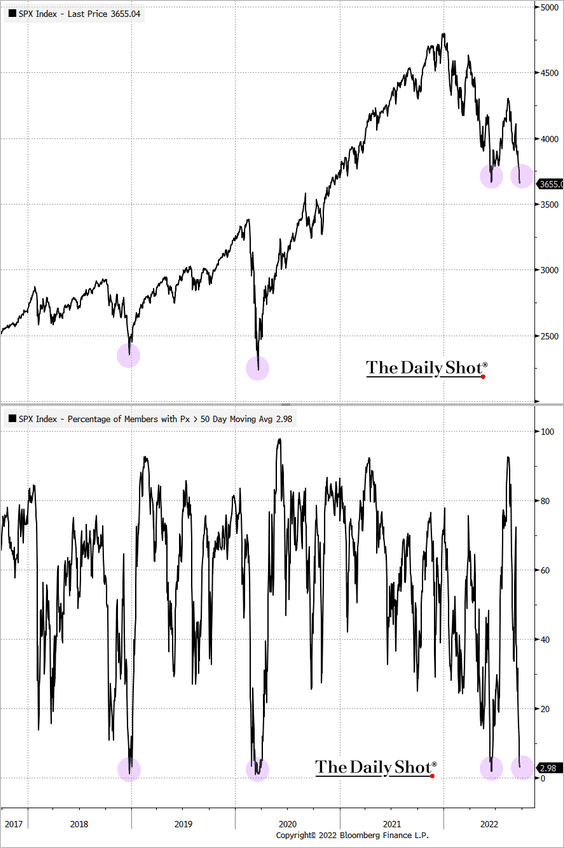 Source: @TheTerminal, Bloomberg Finance L.P.
• Market breadth is at extreme lows.
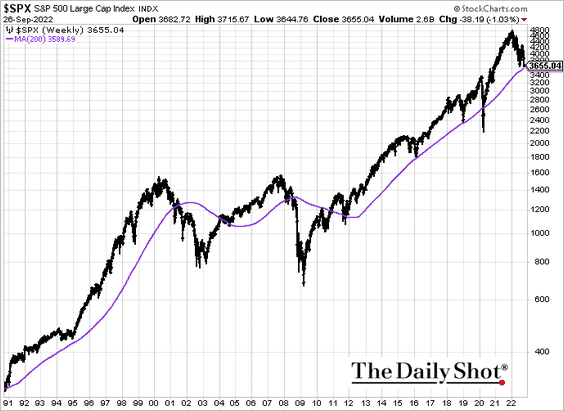
• The S&P 500 is also near support at the 200-week moving average.
——————–
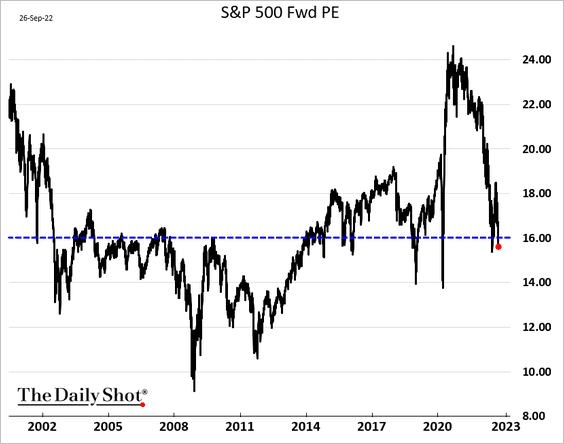
3. The S&P 500 forward PE ratio is back below 16x.
• Real rates will continue to put downward pressure on valuations.
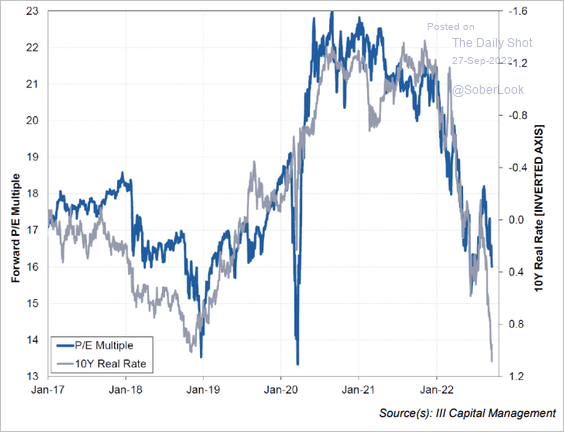 Source: III Capital Management
• Current valuations are still high relative to previous bear market lows.
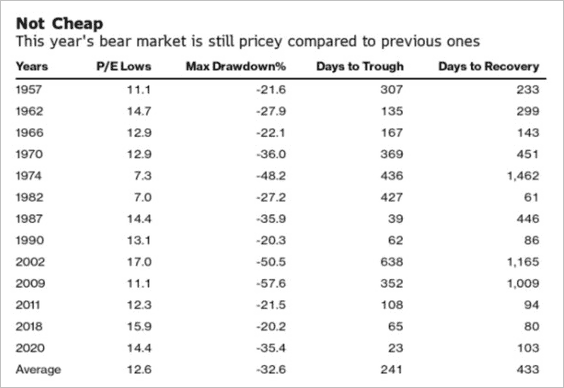 Source: @TheTerminal
——————–
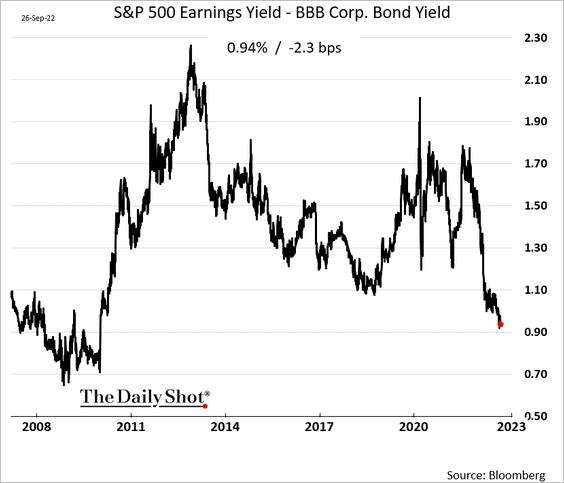
4. Large-cap stocks don’t look very attractive relative to corporate bonds.
The revenue-weighted S&P 600 (small-cap) index looks the most attractive relative to the 2-year Treasury yield.
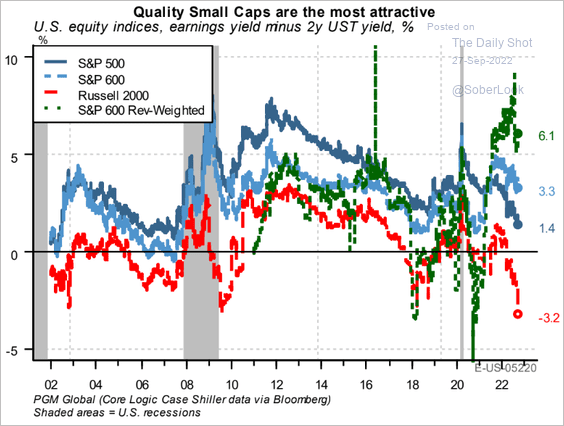 Source: PGM Global
——————–
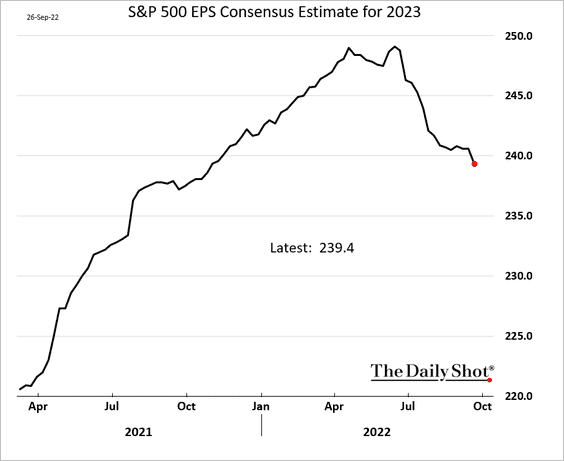
5. Earnings downgrades continue to outpace upgrades.
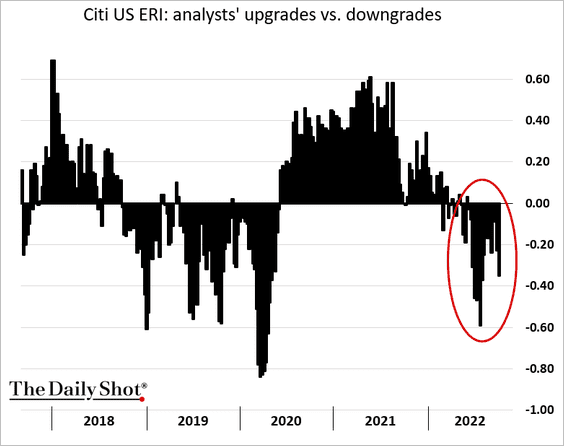
The S&P 500 2023 earnings estimate keeps falling. Some analysts expect this trend to continue.
——————–
6. Based on bottom-up price targets, analysts expect more than a 25% increase in the S&P 500 price over the next 12 months.
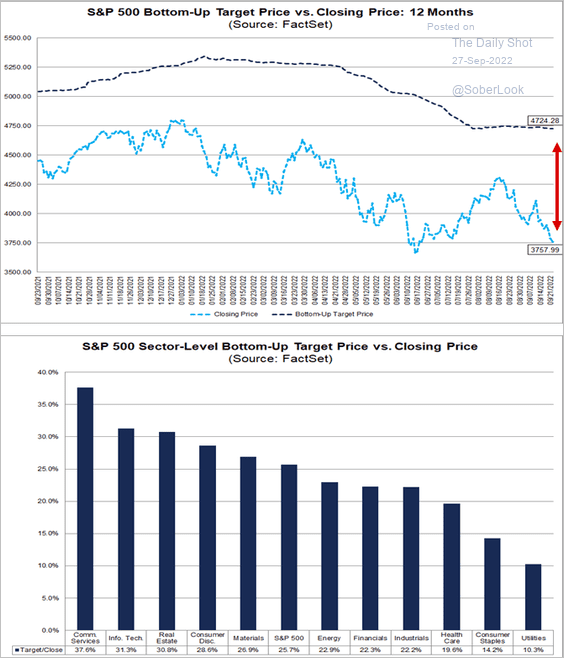 Source: @FactSet Read full article
Back to Index
Rates
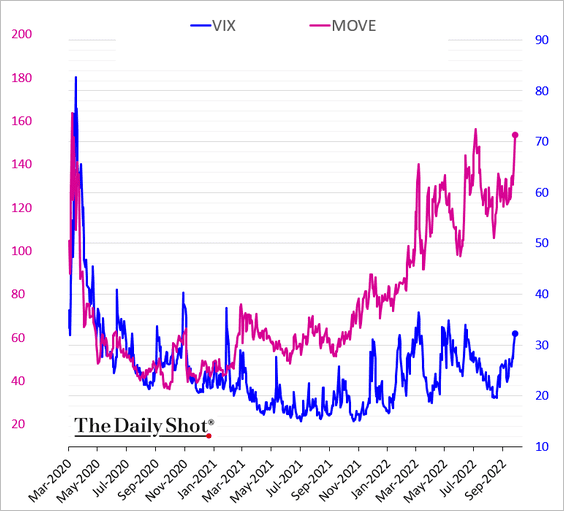
1. Treasury market implied volatility (MOVE) continues to outpace the equities vol (VIX).
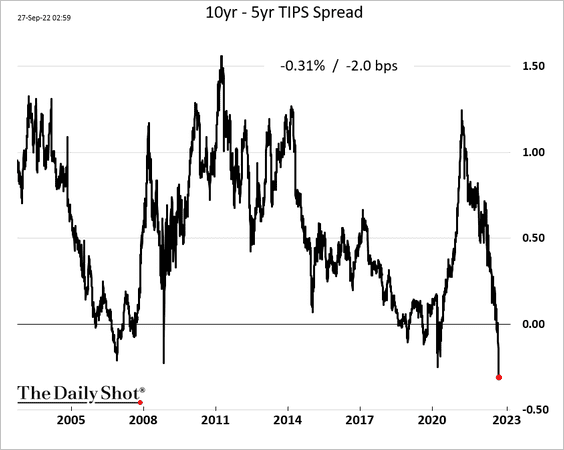
2. The surge in real yields (TIPS yield) has been unprecedented, putting downward pressure on stocks.
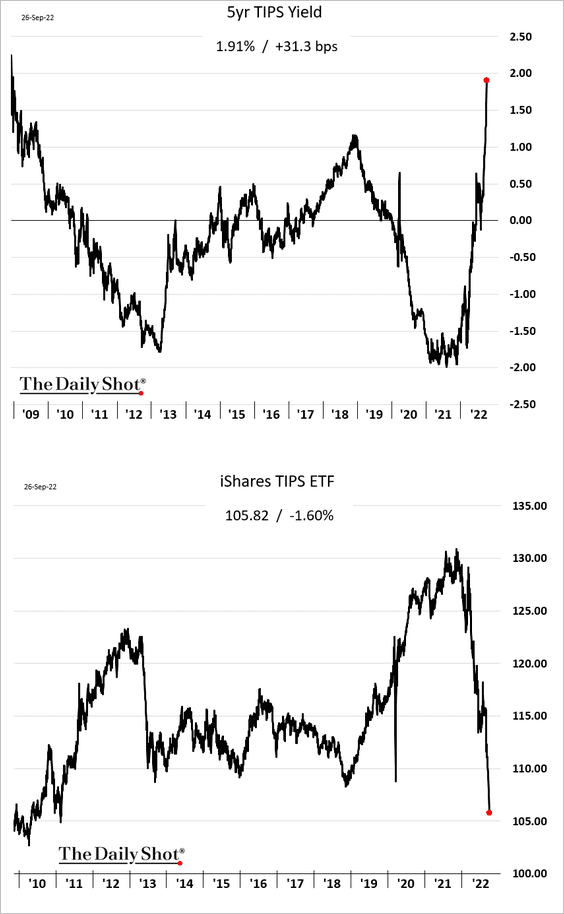
The TIPS curve is now deeply inverted.
——————–
3. Here is the Treasury market drawdown across the curve.
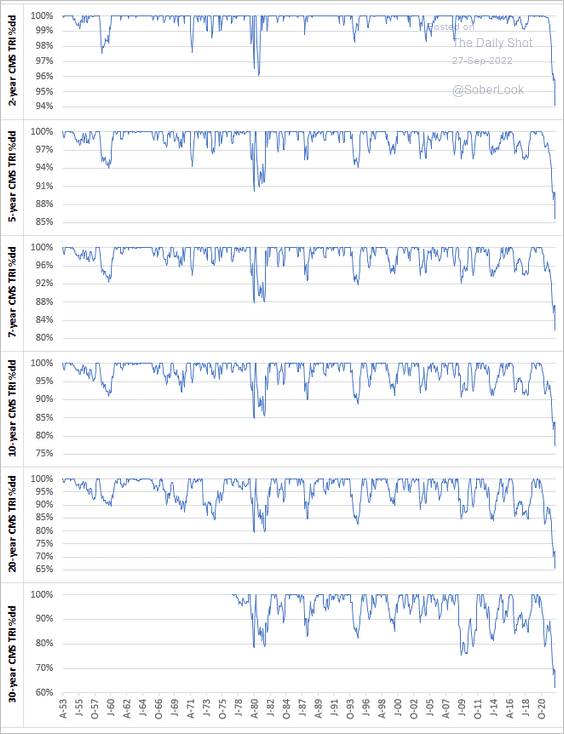 Source: @NewRiverInvest
Back to Index
Global Developments
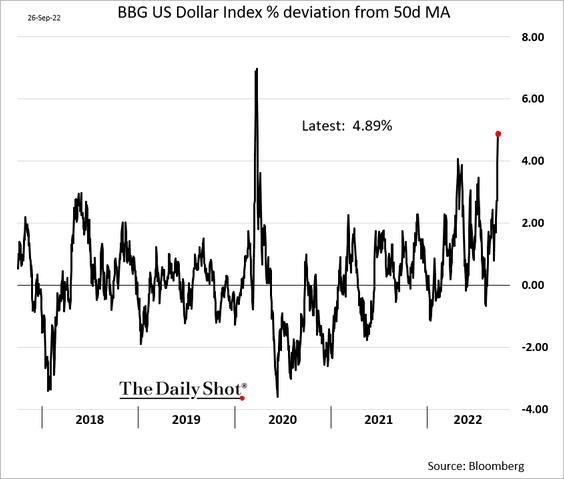
1. Technical indicators suggest that the dollar is overbought.
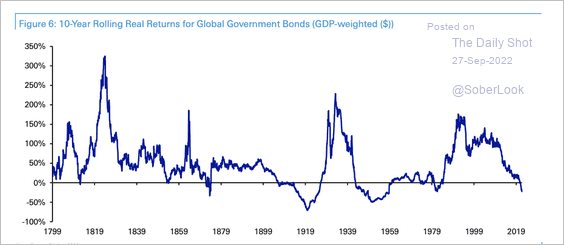
2. This is the first global bond bear market in 70 years.
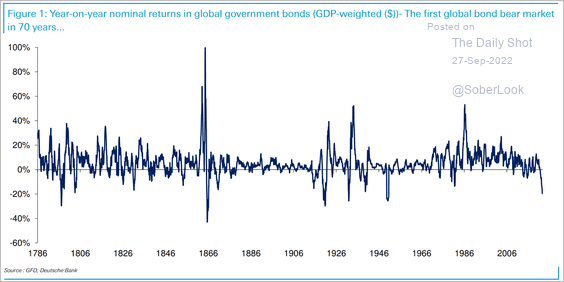 Source: Deutsche Bank Research
10-year real returns for global government bonds turned negative for the first time since 1985.
 Source: Deutsche Bank Research
——————–
3. Ship charter rates are dropping quickly.
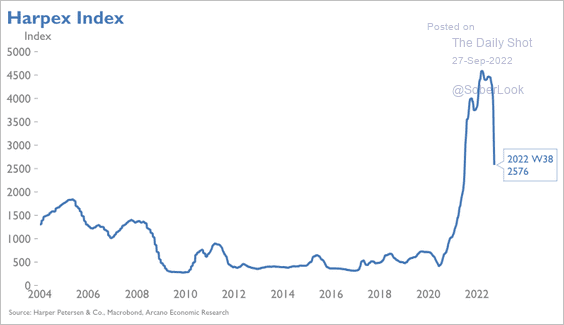 Source: Arcano Economics
4. This chart shows debt by sector in select economies (% of GDP).
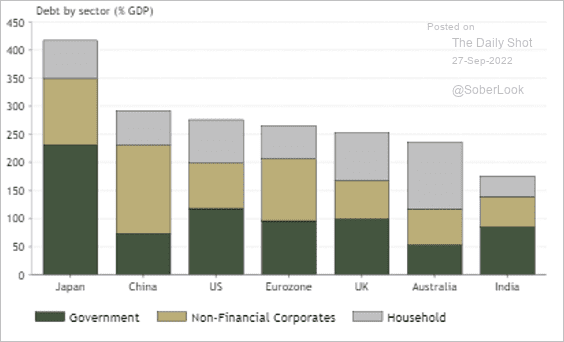 Source: @IanRHarnett
——————–
Food for Thought
1. Weekday bedtime:
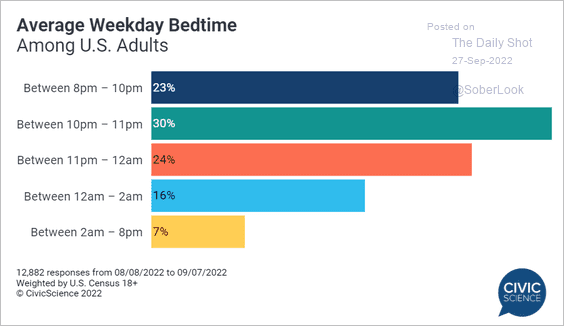 Source: @CivicScience Read full article
2. Teacher shortages:
 Source: @axios Read full article
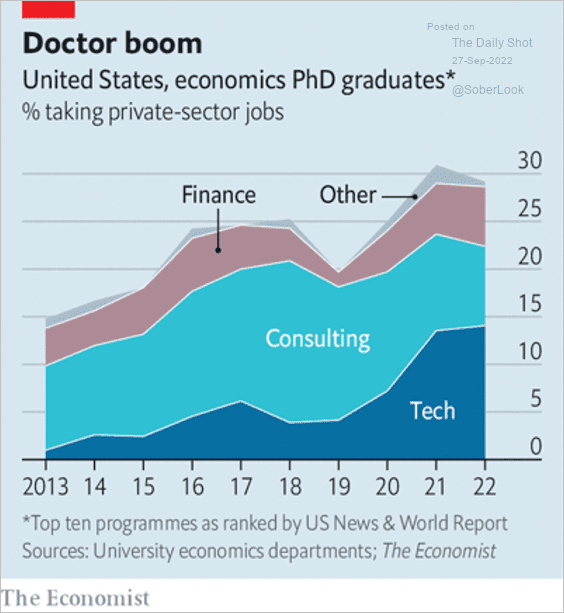
3. Ph.D. graduates in economics taking private-sector jobs:
 Source: The Economist Read full article
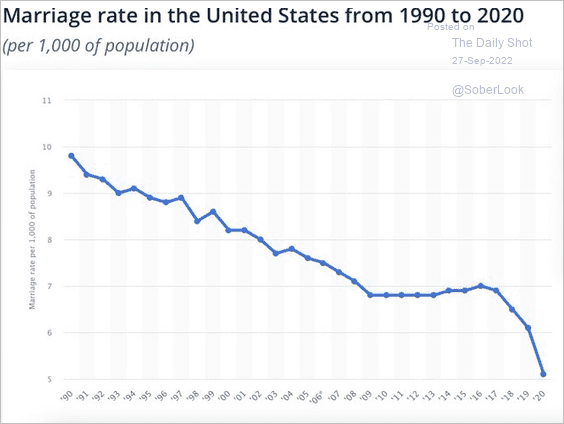
4. The US marriage rate since 1990:
 Source: @Noahpinion
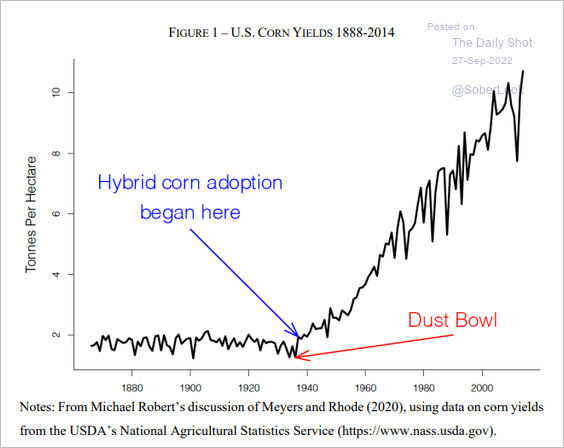
5. US corn yields:
 Source: @_brianpotter Read full article
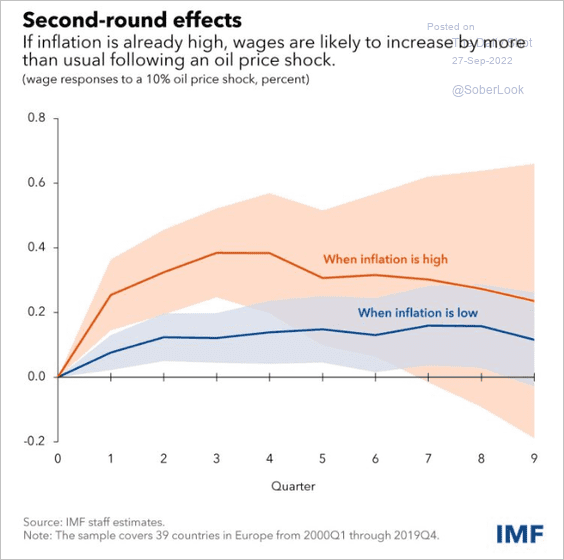
6. The impact of oil price shocks on wages:
 Source: IMF Read full article
7. States with the highest number of political TV ads:
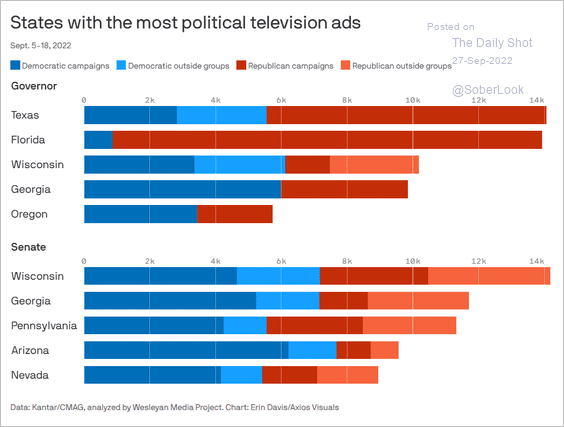 Source: @axios Read full article
8. Wikipedia traffic:
 Source: @chartrdaily
——————–
Back to Index