
The Daily Shot: 14-Oct-22
• The United States
• Canada
• The United Kingdom
• Europe
• Asia – Pacific
• China
• Emerging Markets
• Commodities
• Energy
• Equities
• Rates
• Global Developments
• Food for Thought
The United States
1. Once again, the CPI report surprised to the upside, pointing to entrenched inflation in the US.
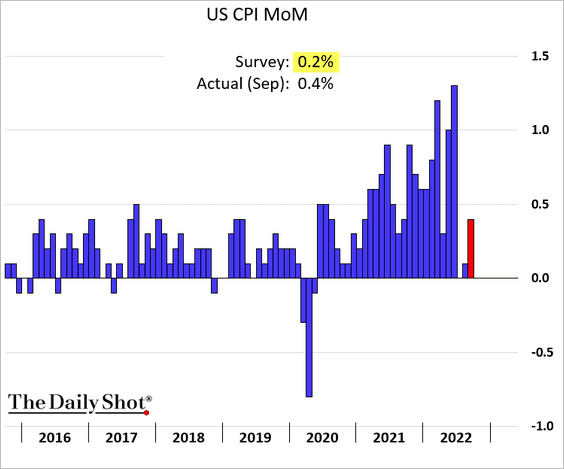
Below are the contributions.
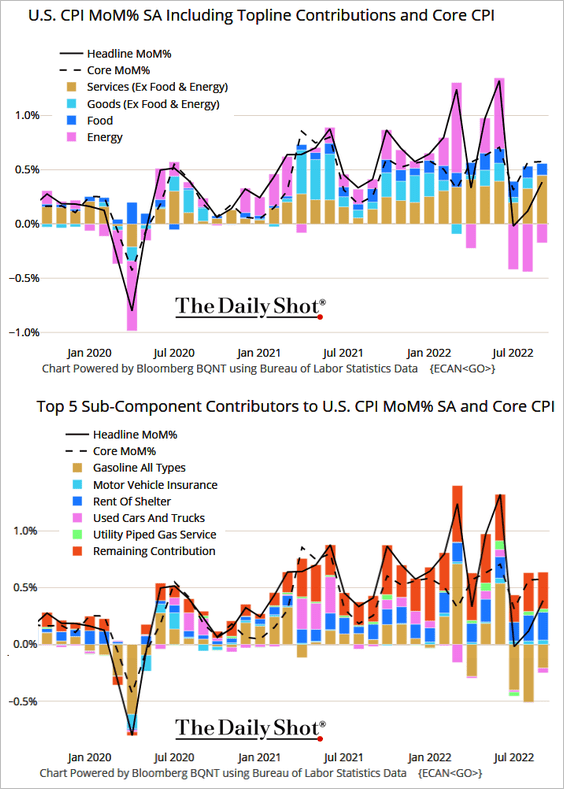 Source: @TheTerminal, Bloomberg Finance L.P.
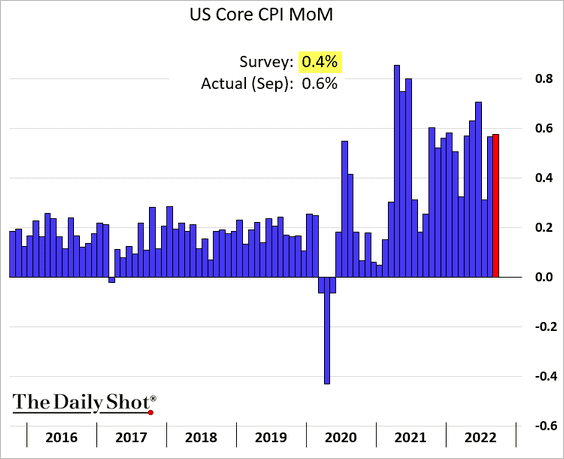
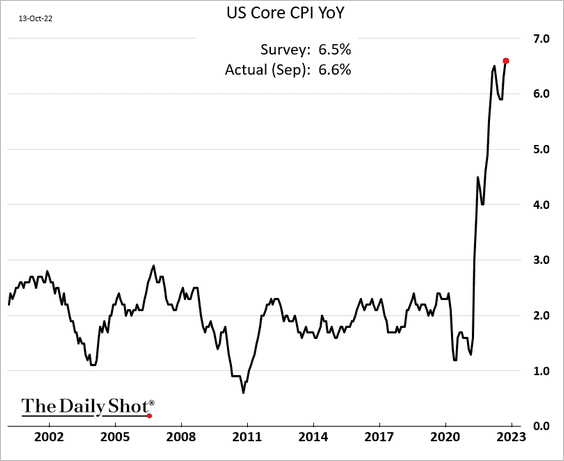
The core inflation climbed 0.6% in September, …
… hitting a multi-decade high on a year-over-year basis.
Here is a quote from Nomura.
… today’s report supports our long-held view that inflation is much more entrenched than the market consensus and the Fed’s expectations. As a result, we believe today’s data supports our above-consensus terminal rate forecast of 5.25-5.50%, including our call for 75bp hikes in both November and December.
• At 0.6% per month, the yearly core CPI is not moving down any time soon.
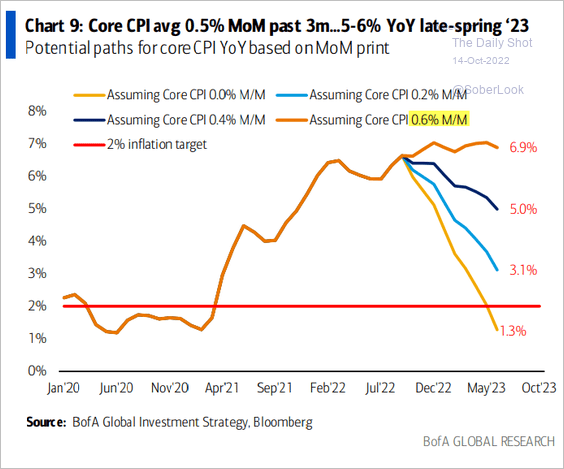 Source: BofA Global Research
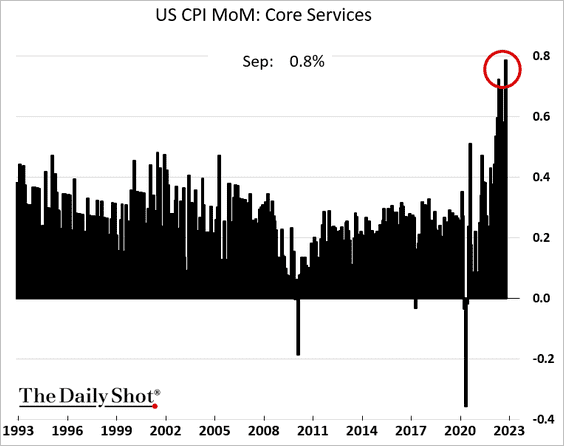
• The problem continues to be with the core services CPI, which hit a multi-decade high (month-over-month).
Here is the core services contribution on a year-over-year basis.
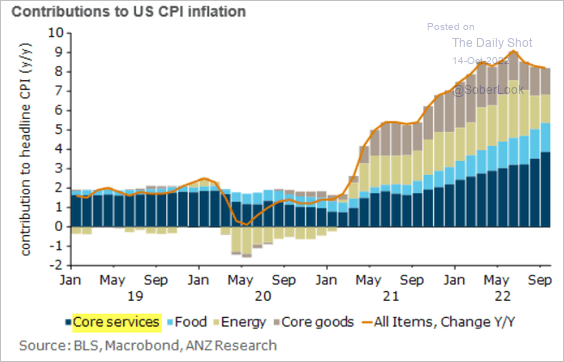 Source: @ANZ_Research
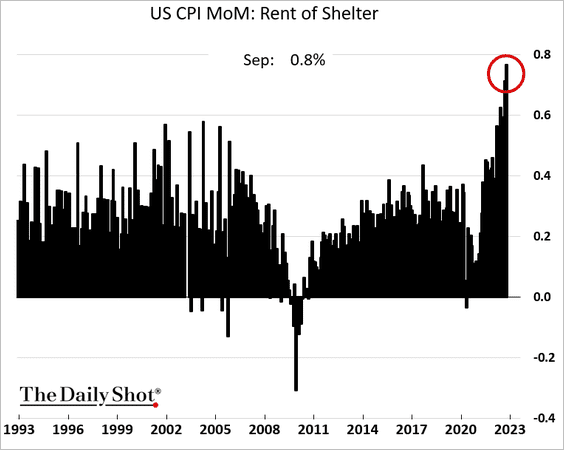
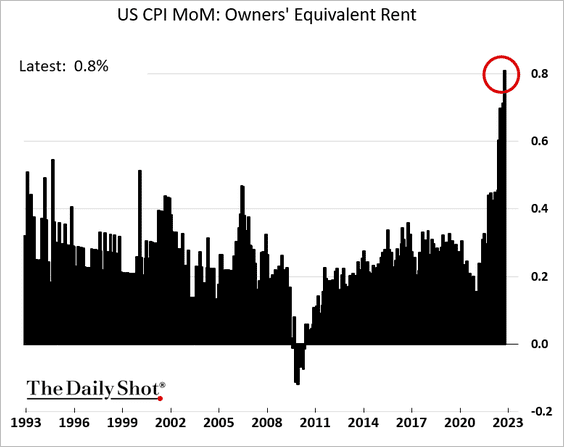
• Housing inflation continues to accelerate.
– Rent:
– Owners’ equivalent rent (2 charts):
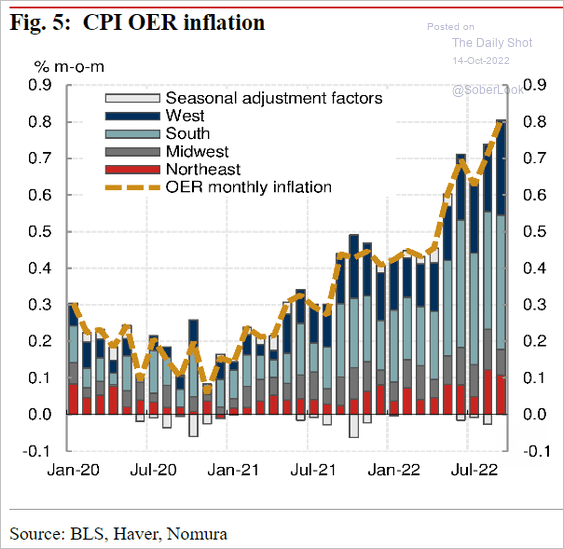 Source: Nomura Securities
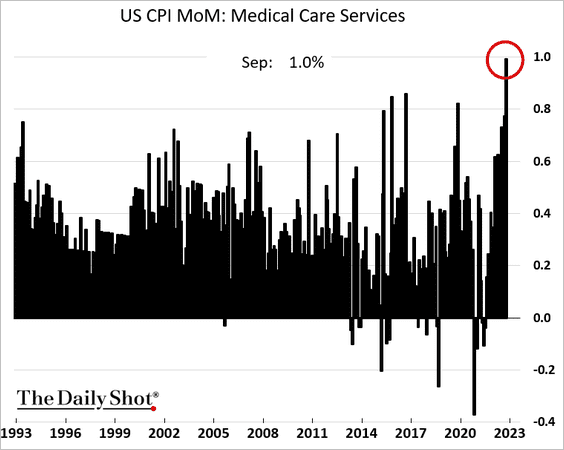
• And here is the CPI for medical care services.
Outside of the core CPI, food inflation remains elevated.

We will have more on the inflation report on Monday, including some forecasts.
——————–
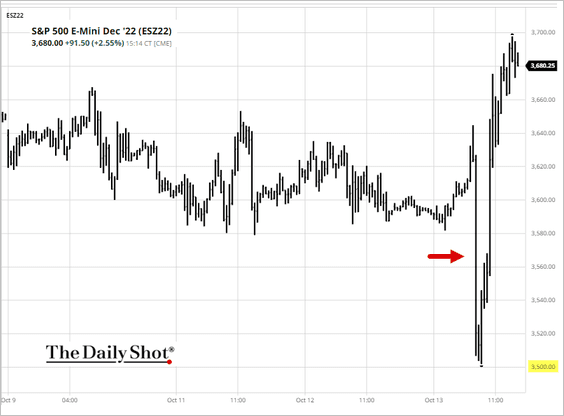
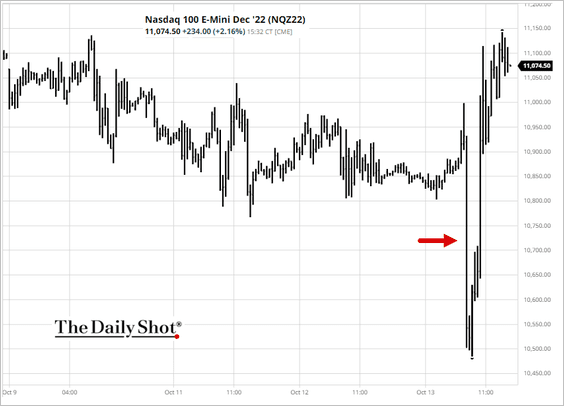
2. The market reaction was quite unexpected.
• Stocks tumbled and then rebounded, closing sharply higher. Investors were very short (or hedged) going into the CPI report. At 3,500 on the S&P 500 futures, short-covering ensued and continued for the rest of the day. We will likely see this rally reversed shortly.
 Source: barchart.com
 Source: barchart.com
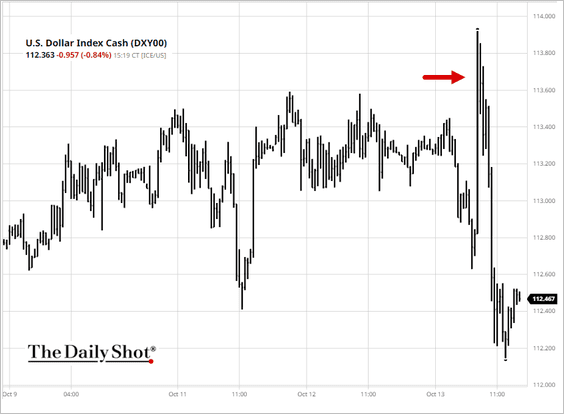
• The dollar ended lower.
 Source: barchart.com
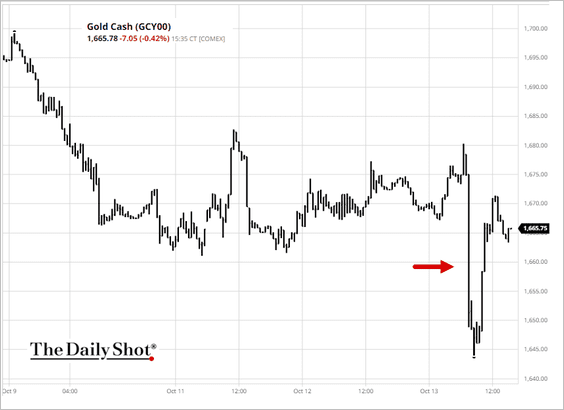
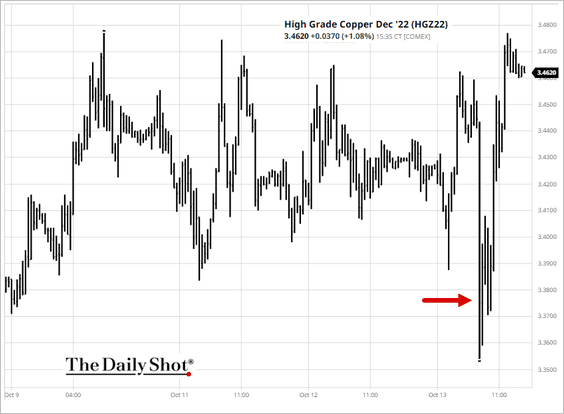
• Gold and copper rebounded.
 Source: barchart.com
 Source: barchart.com
• Treasuries ended down, …
– 10yr note futures:
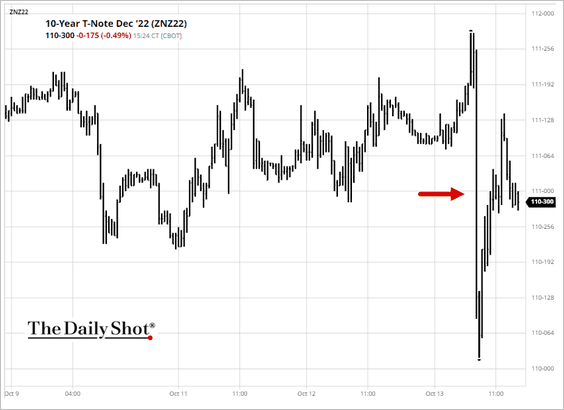 Source: barchart.com
– 2yr note futures:
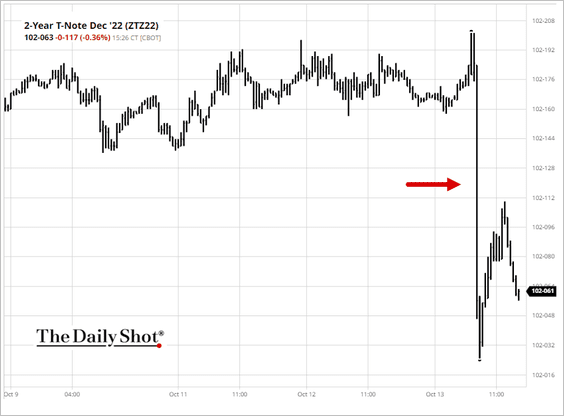 Source: barchart.com
… with the 2-year yield nearing 4.5%.

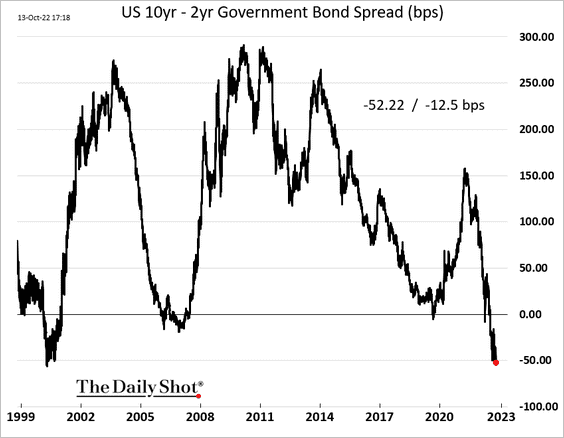
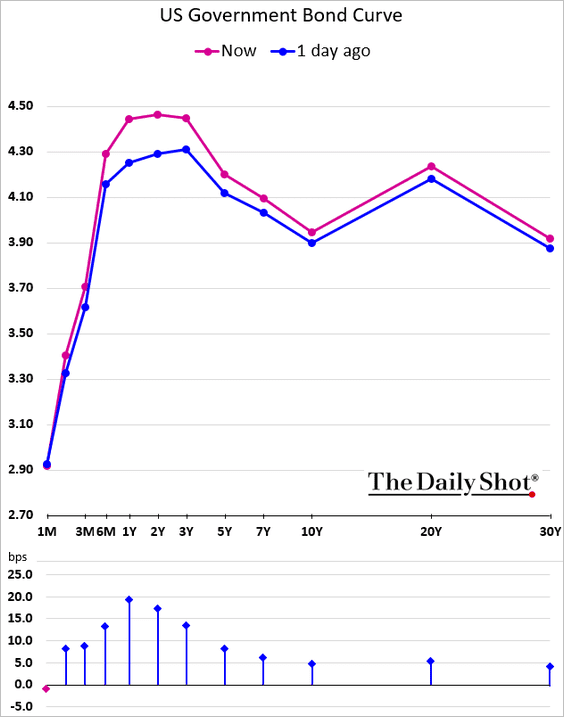
The yield curve inverted further as recession looms.
——————–
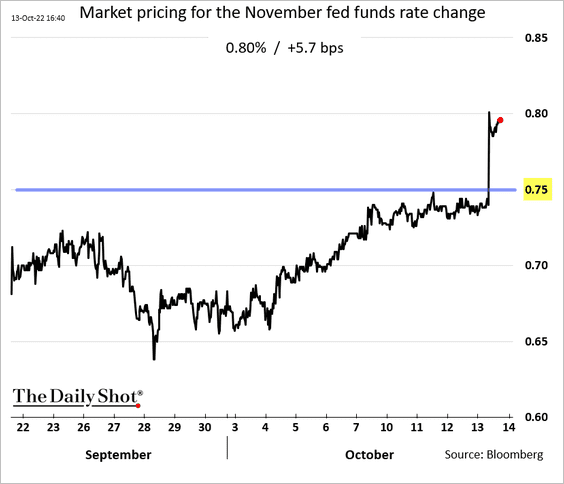
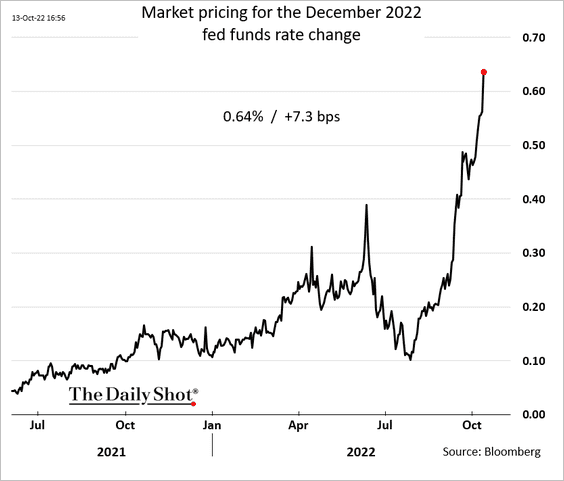
3. The market started pricing a chance of a 100 bps rate hike in November, …
… and an increased likelihood of 75 bps in December.
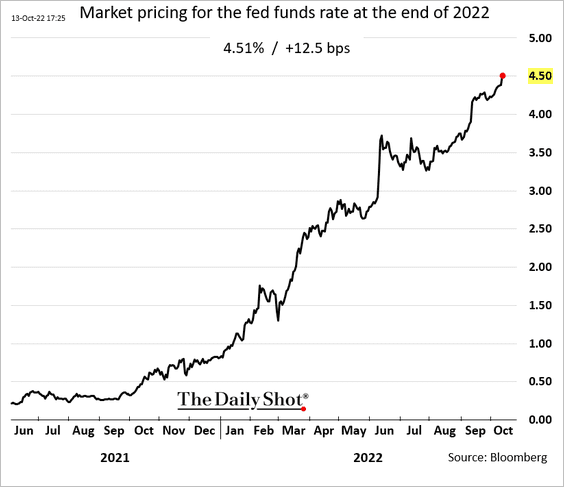
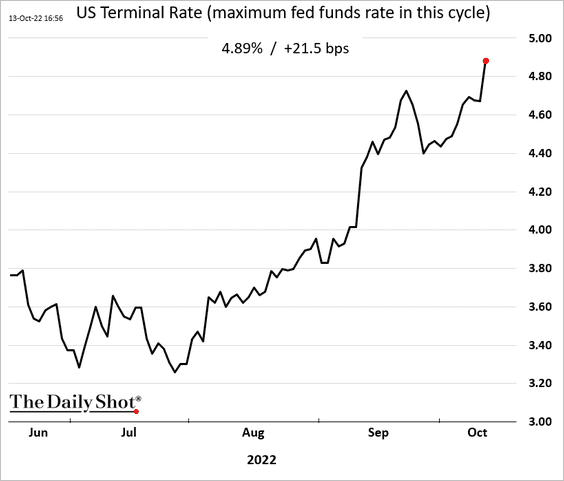
The year is expected to end with the fed funds rate at 4.5%, …
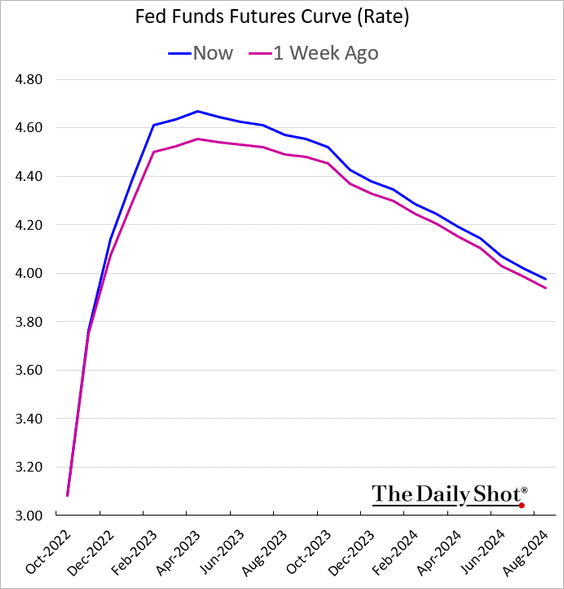
… with the terminal rate approaching 5% next year.
——————–
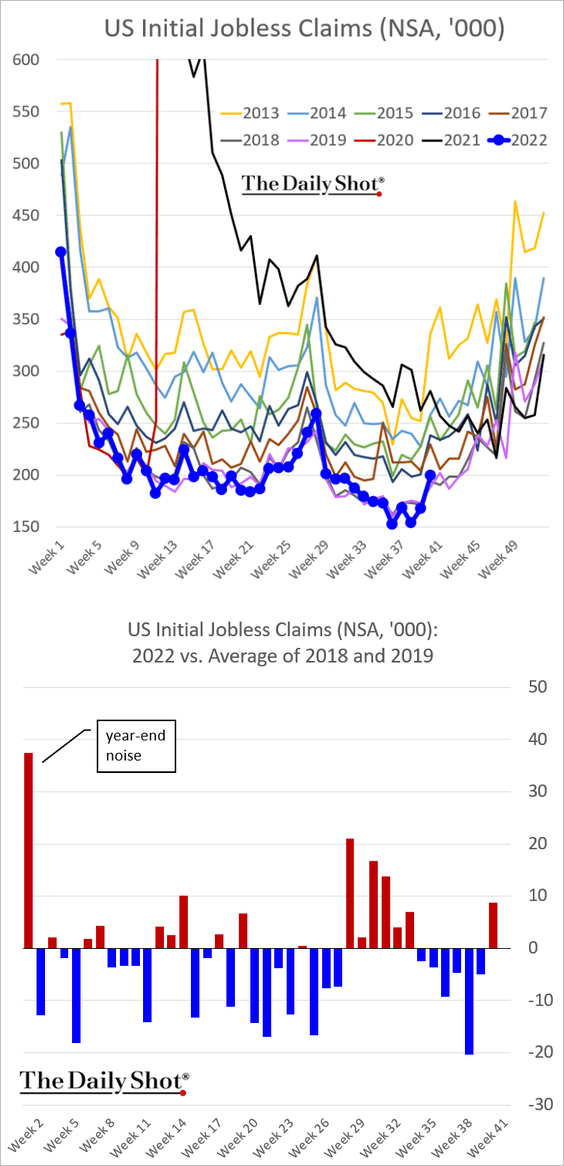
4. Jobless claims jumped last week, driven by storm-battered Florida.
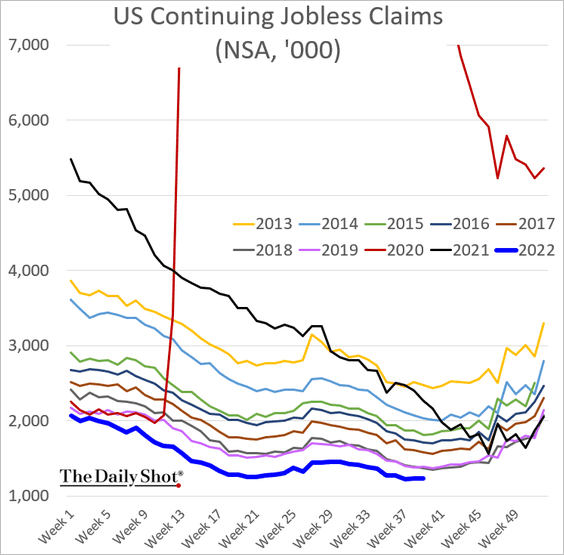
This chart shows continuing unemployment claims.
——————–
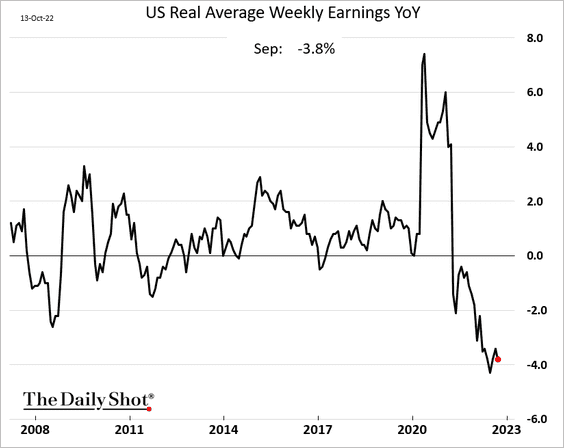
5. Real wage growth is holding deep in negative territory (2 charts).
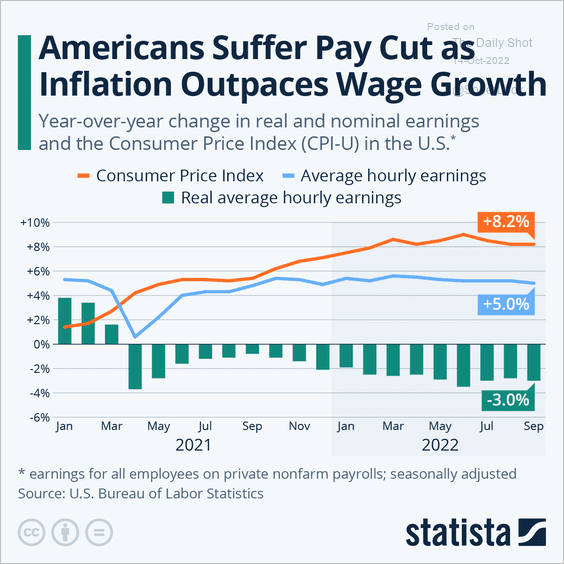 Source: Statista
——————–
6. Household spending expectations have been moderating.
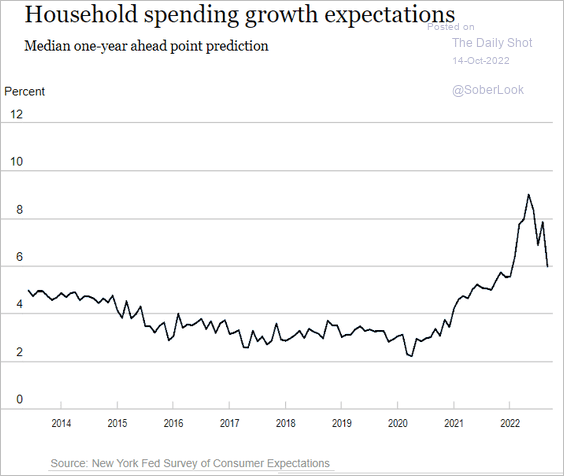 Source: Federal Reserve Bank of New York
7. Dollar rallies are typically associated with tighter financial conditions.
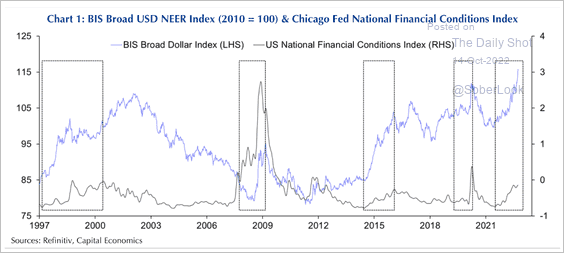 Source: Capital Economics
Back to Index
Canada
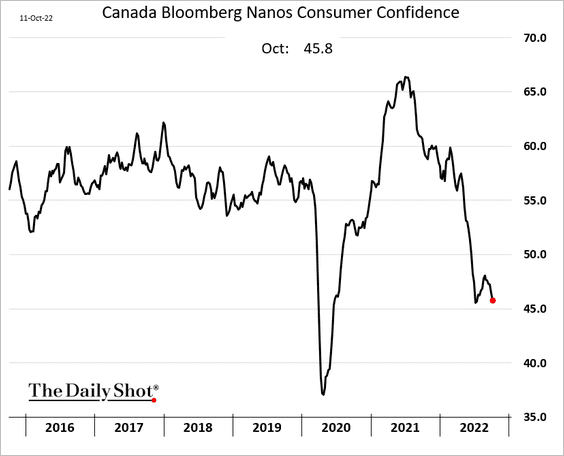
1. Consumer confidence is near the lowest levels since 2020.
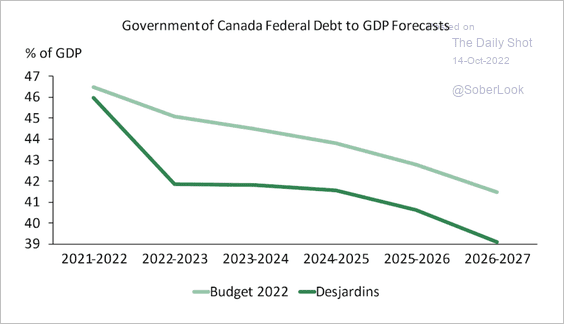
2. Desjardins expects an improvement in the forecasted government budget deficit this year. The tight labor market could reduce demand for income support, thereby lowering expenses (2 charts).
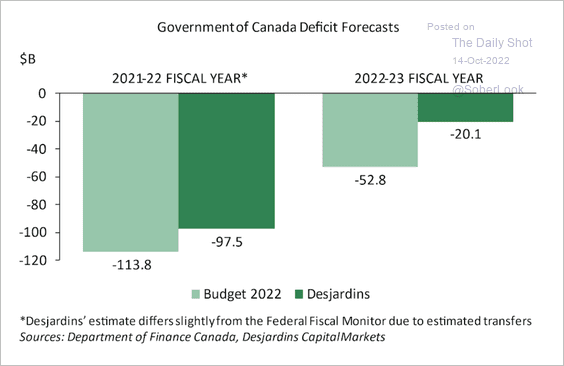 Source: Desjardins
 Source: Desjardins
Back to Index
The United Kingdom
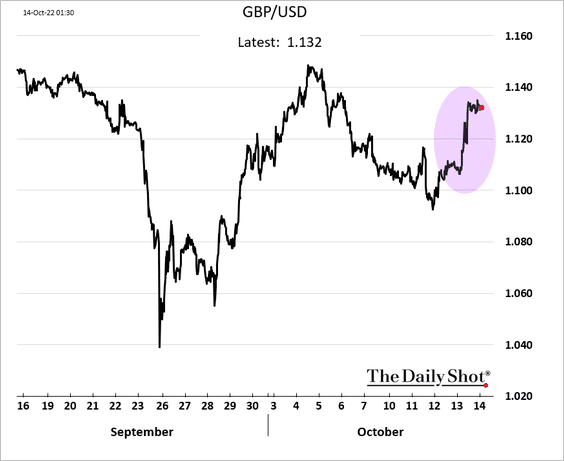
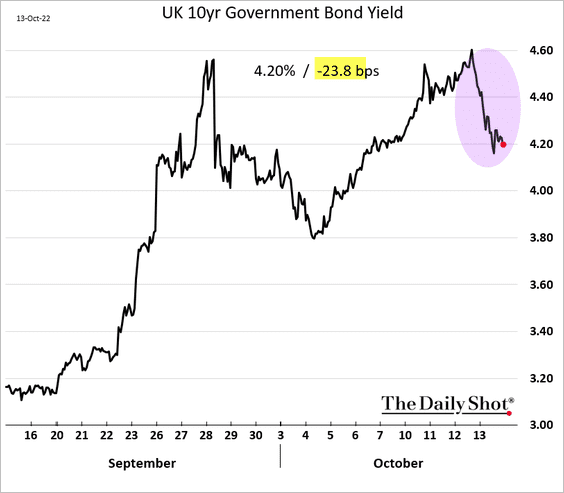
Rumors of a pullback in tax cuts sent gilts and the pound sharply higher.
 Source: Bloomberg Read full article
Back to Index
Europe
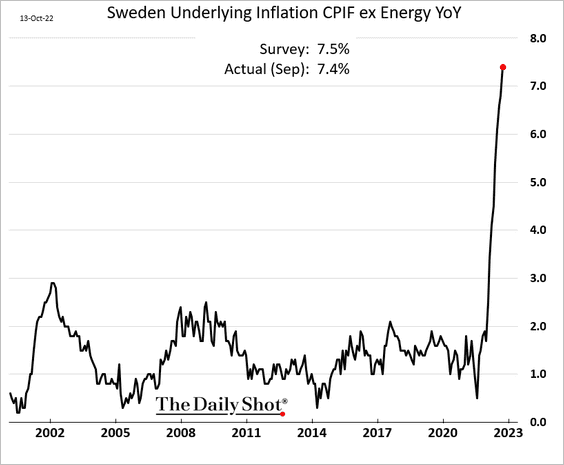
1. Sweden’s CPI continues to surge.
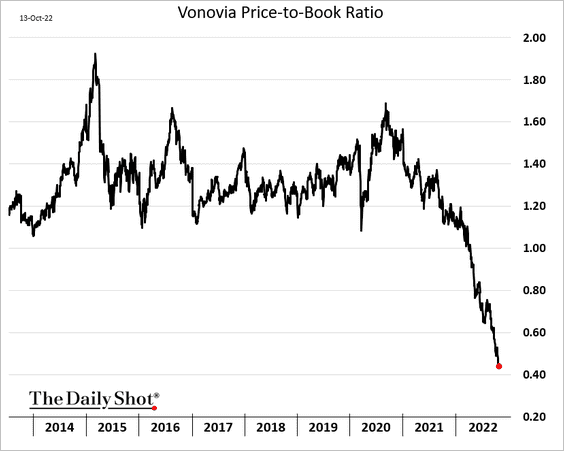
2. Germany’s largest landlord, Vonovia, will see many tenants under financial stress this winter (due to energy costs). Here is the company’s price-to-book ratio.
 Source: Reuters Read full article
——————–
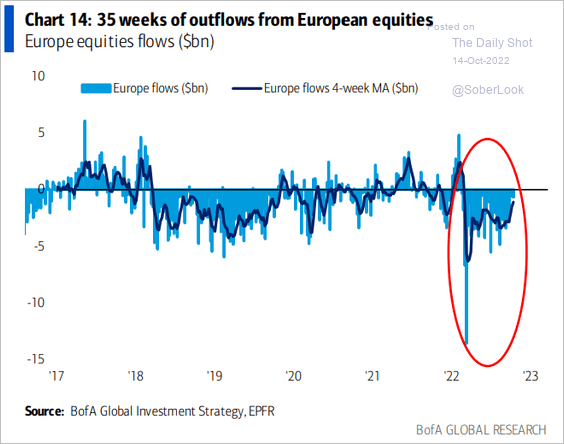
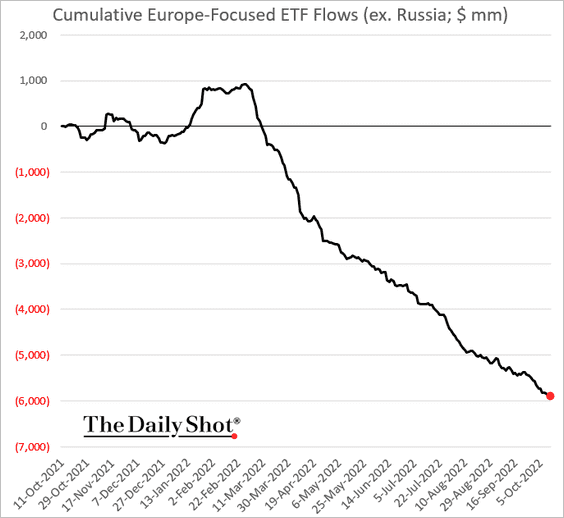
3. European equity funds continue to see outflows.
 Source: BofA Global Research
——————–
4. USD/CHF is testing long-term downtrend resistance.
 Source: BofA Global Research
5. Here are the most consumed energy sources by country.
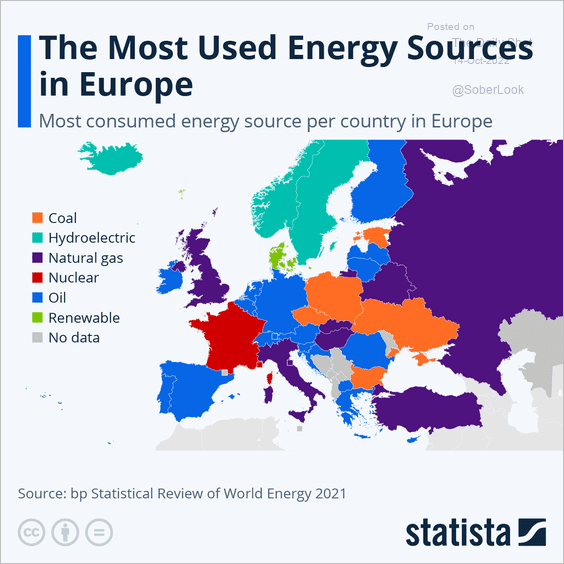 Source: Statista Read full article
Back to Index
Asia – Pacific
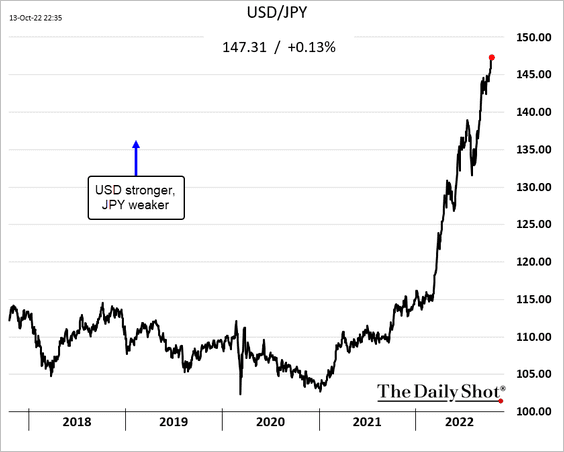
1. The yen continues to sink vs. USD.
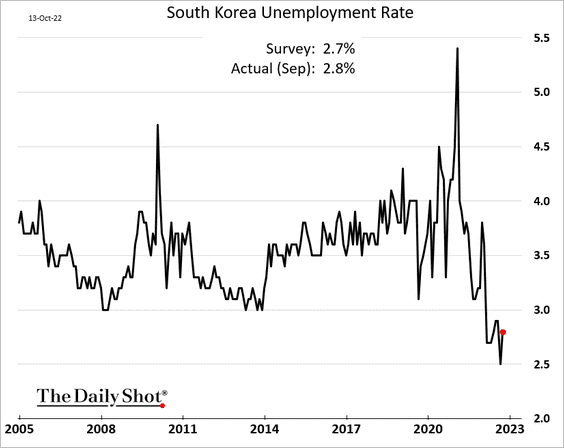
2. South Korea’s unemployment rate ticked higher but remains at historically low levels.
3. Singapore’s Q3 GDP growth surprised to the upside.
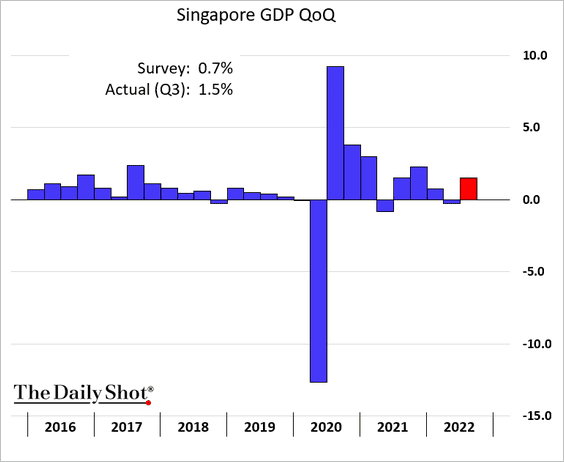
Singapore’s central bank continues to tighten monetary policy by guiding the currency higher.
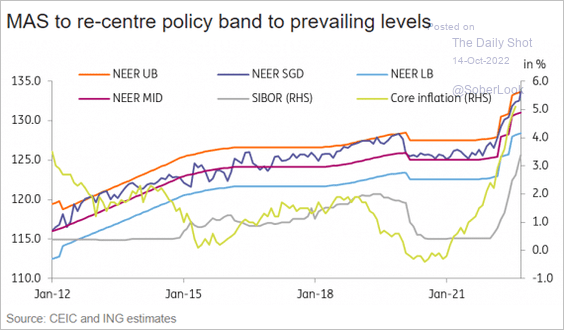 Source: ING
——————–
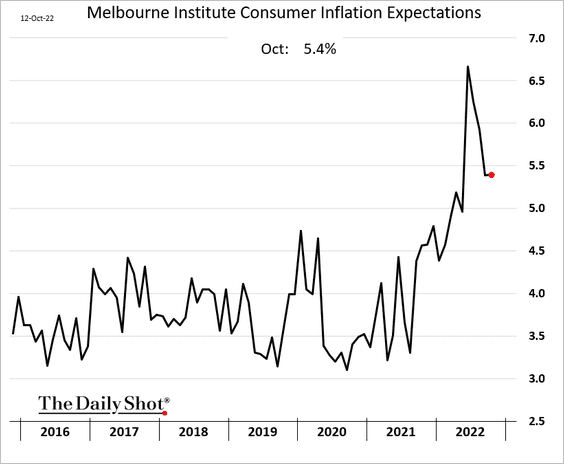
4. Next, we have some updates on Australia.
• Inflation expectations held steady this month.
• Home prices continue to slump.
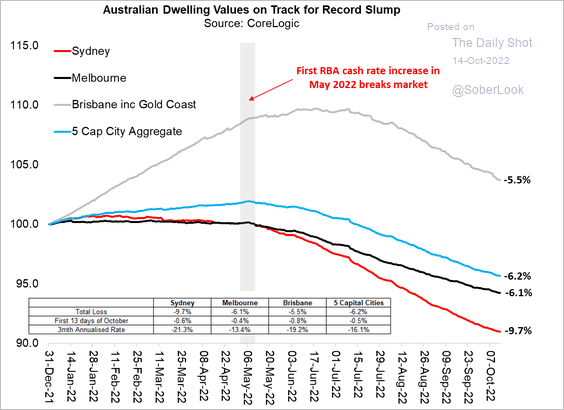 Source: Coolabah Capital Read full article
• Lower commodity prices and terms of trade could add further pressure on AUD/USD.
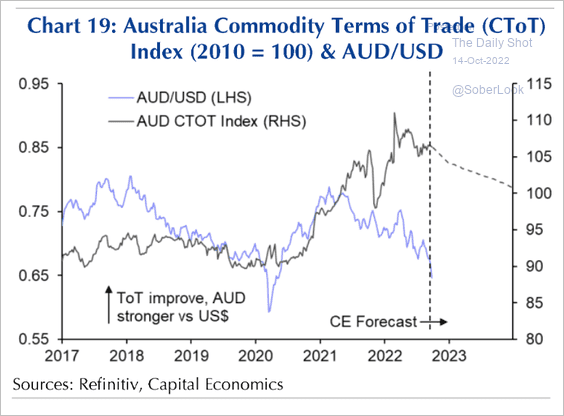 Source: Capital Economics
The Aussie dollar weakened massively vs. USD, but the trade-weighted index hasn’t declined much.
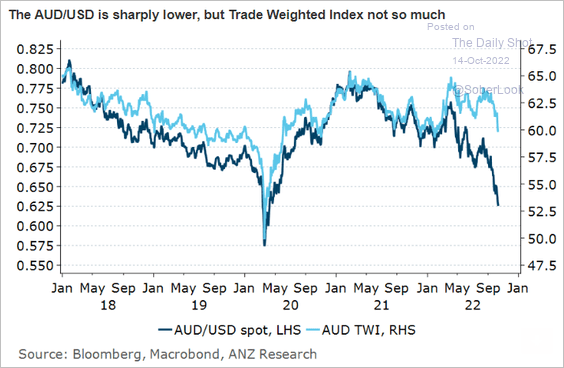 Source: @ANZ_Research
Back to Index
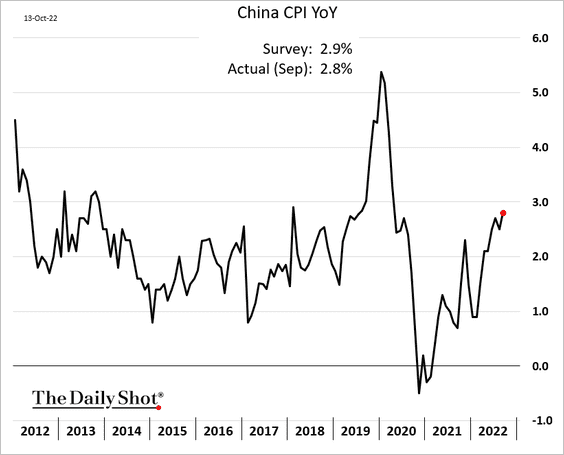
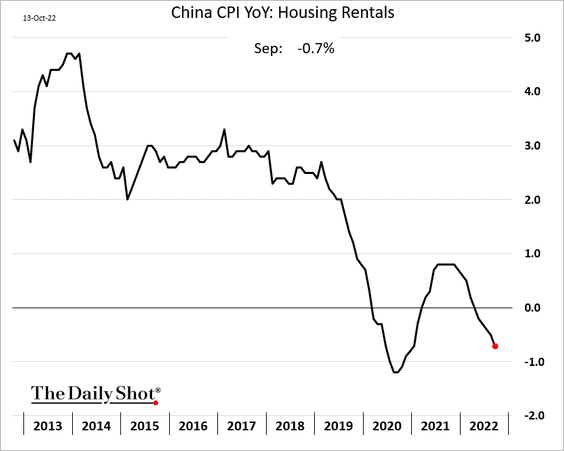
China
1. Inflation was a bit softer than expected in September.
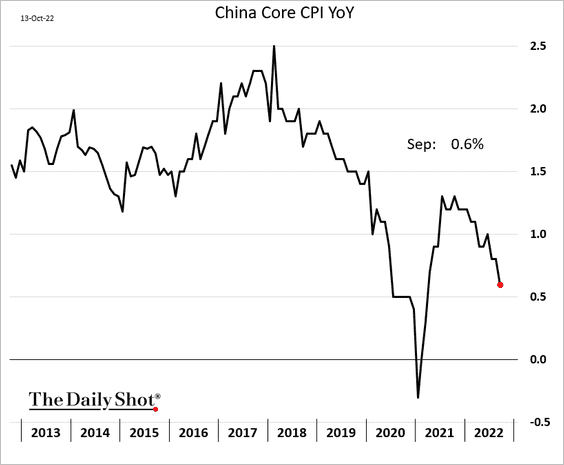
• The core CPI continues to move lower, in sharp contrast to the US.
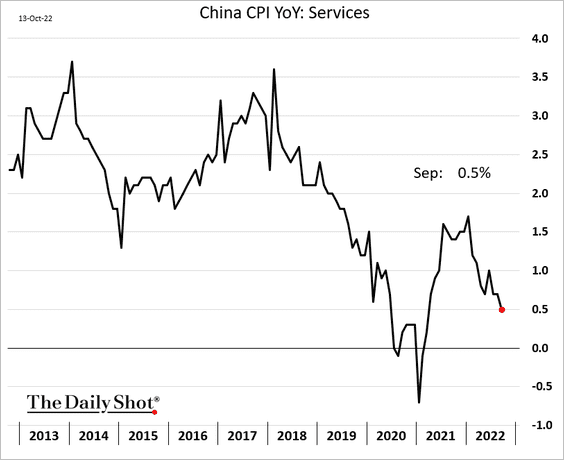
• Services inflation is easing.
• Here is rent inflation.
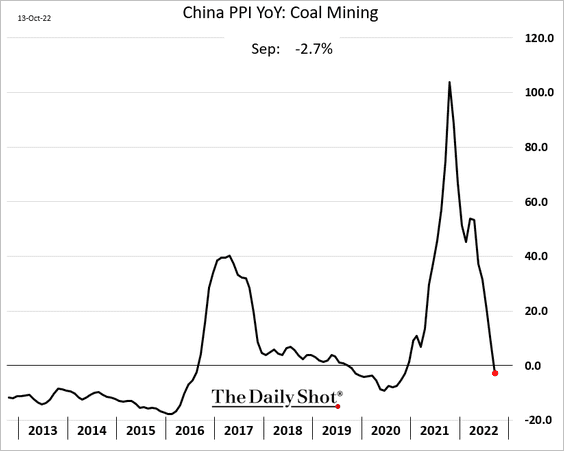
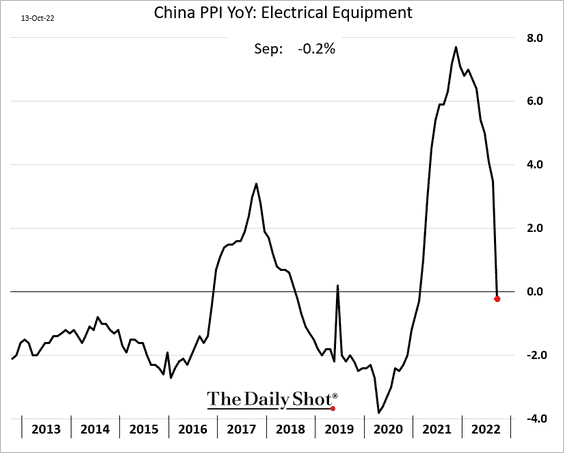
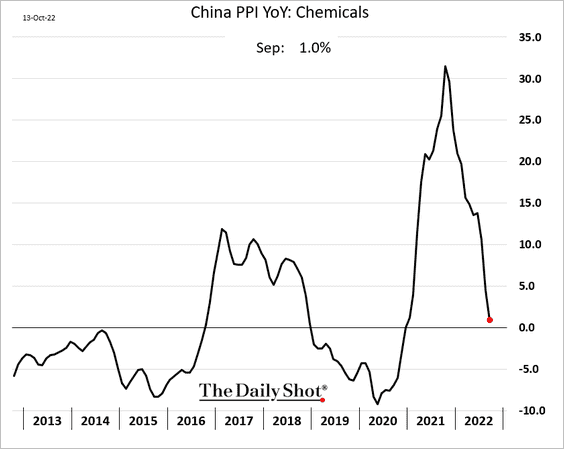
2. The PPI was also lower than expected.
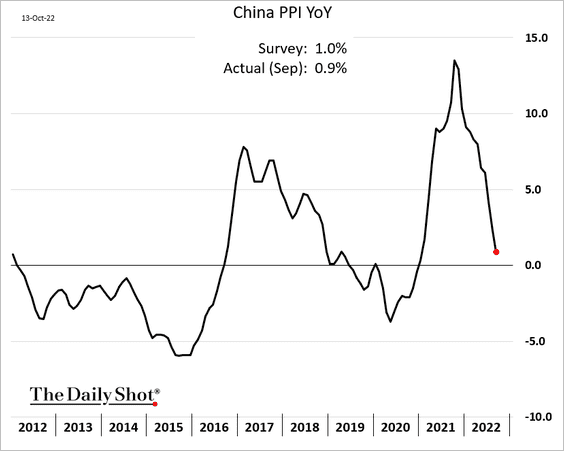
Below are some of the PPI components.
Steel prices keep moving lower.
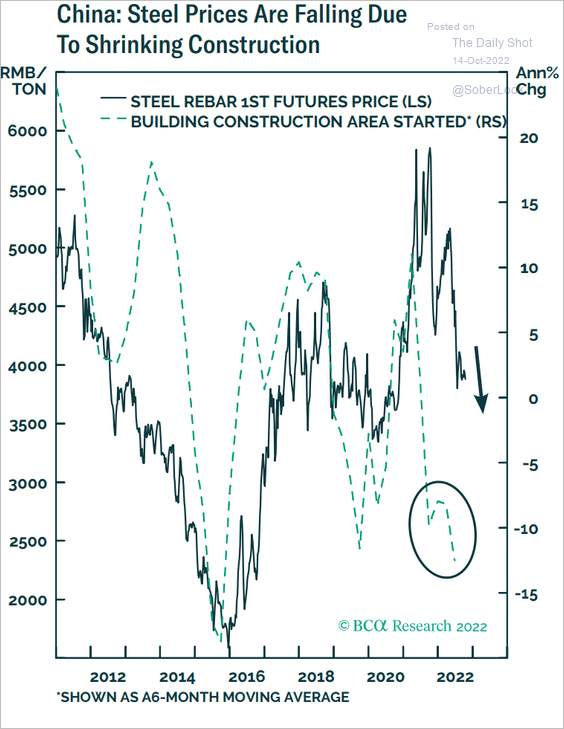 Source: BCA Research
——————–
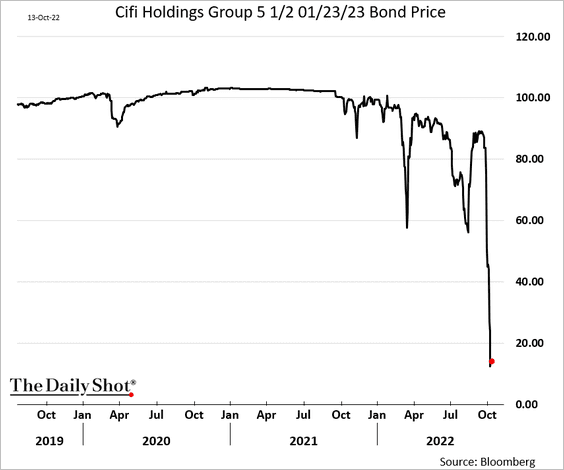
3. China’s property developers’ debt crisis continues.
 Source: South China Morning Post Read full article
——————–
4. Hong Kong stocks are breaking below long-term uptrend support.
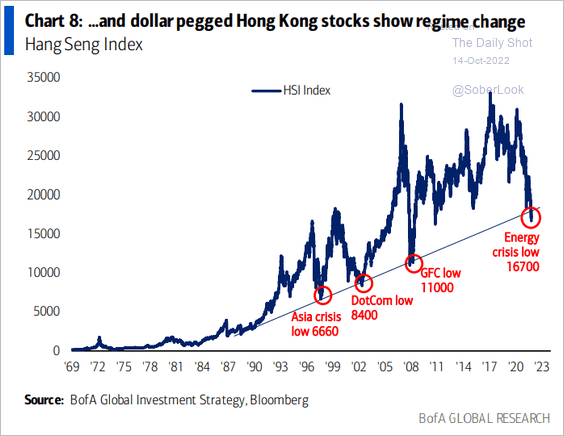 Source: BofA Global Research
Back to Index
Emerging Markets
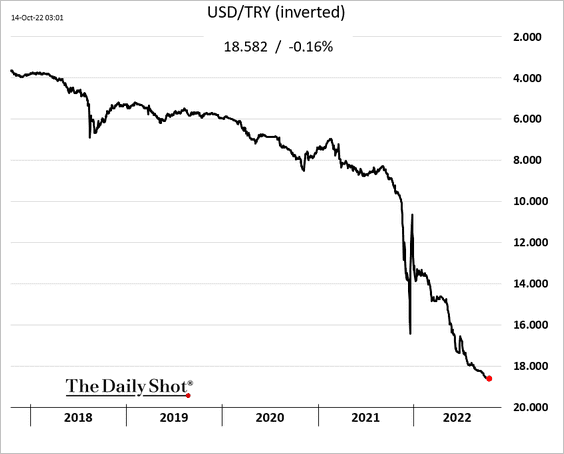
1. The Turkish lira continues to drift lower.
2. Mexican factory output has been holding up well.

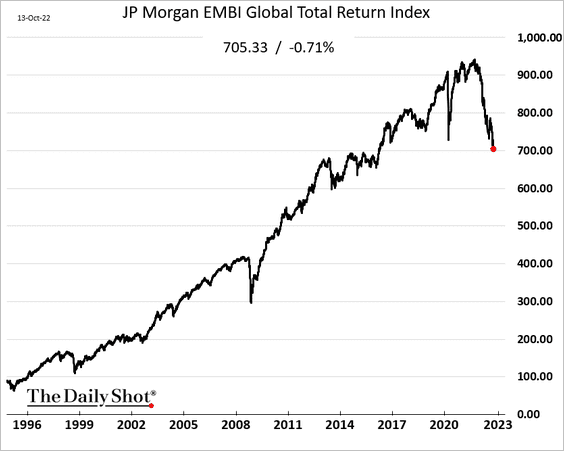
3. EM bond outflows have been severe, …
 Source: Deutsche Bank Research
… pressuring prices.
Back to Index
Commodities
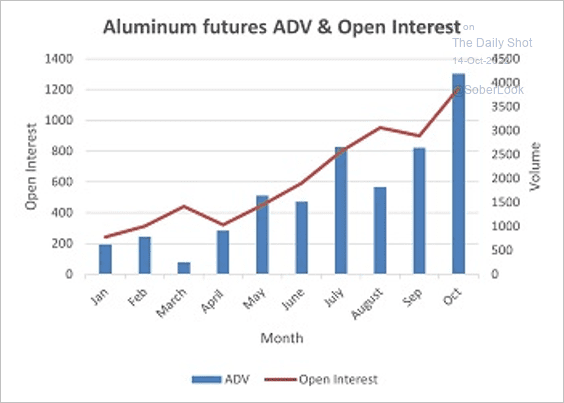
1. Average daily volume and open interest in aluminum futures have risen this year.
 Source: CME Group
2. European steel futures have also seen an increase in volume and open interest, possibly due to hedging demand.
 Source: CME Group
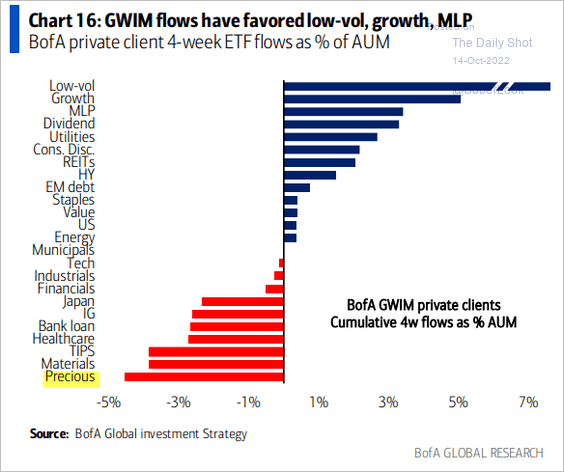
3. Merrill Lynch’s private clients have been cutting their precious metals exposure.
 Source: BofA Global Research
4. Coffee futures are tumbling.
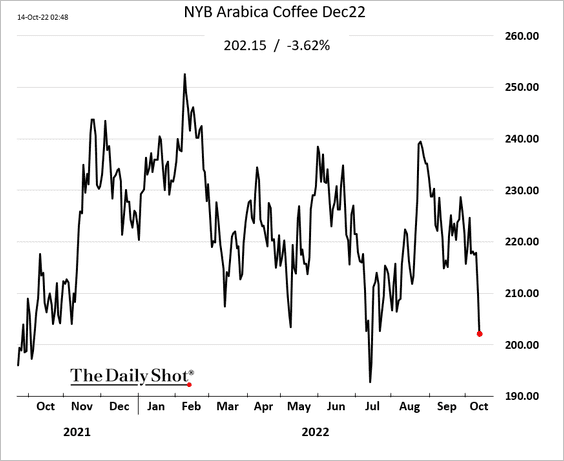
 Source: Nasdaq Read full article
Back to Index
Energy
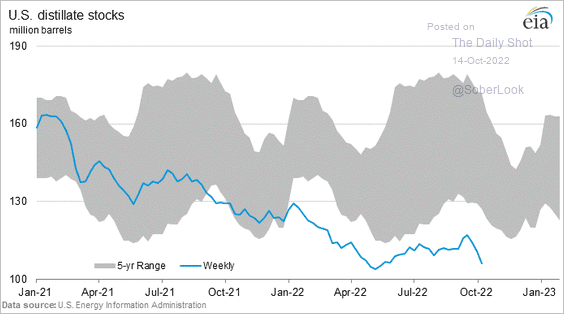
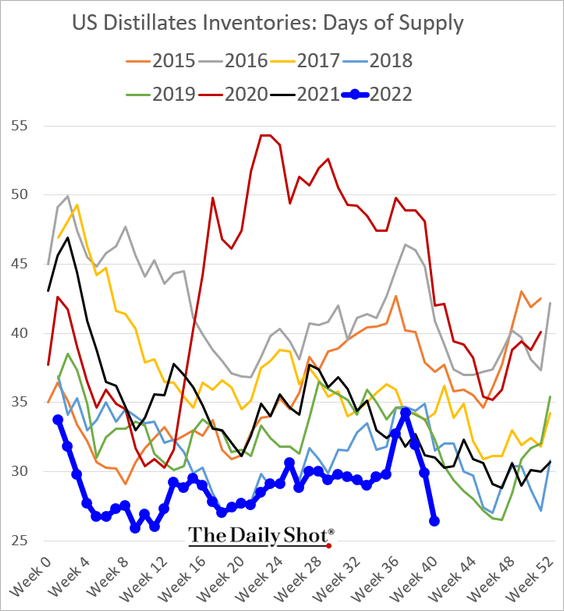
1. US diesel shortages are worsening.
• Inventory (in barrels):
• Days of supply:
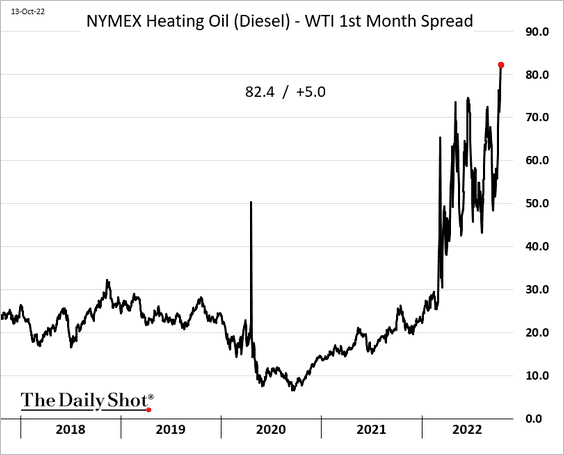
Diesel crack spreads continue to widen.
——————–
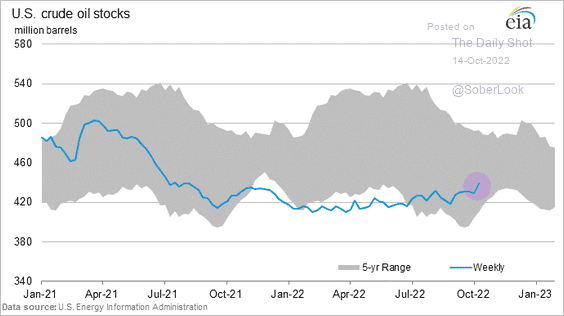
2. US oil inventories increased sharply last week.
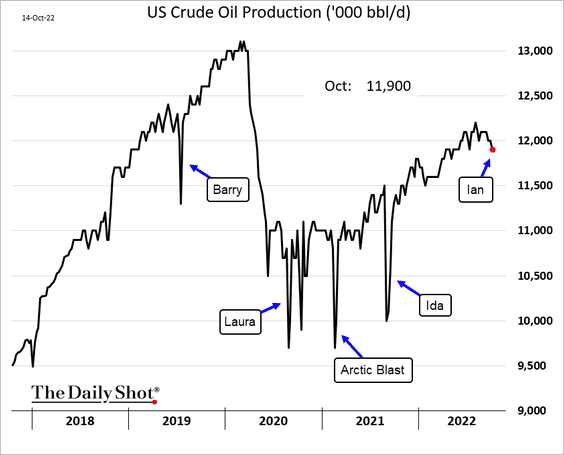
3. US oil production was lower due to Hurricane Ian.
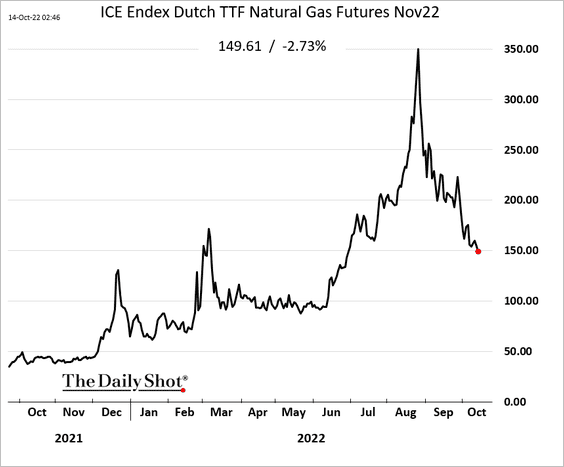
4. European natural gas prices continue to fall despite Russia’s attempts to squeeze the market.
Back to Index
Equities
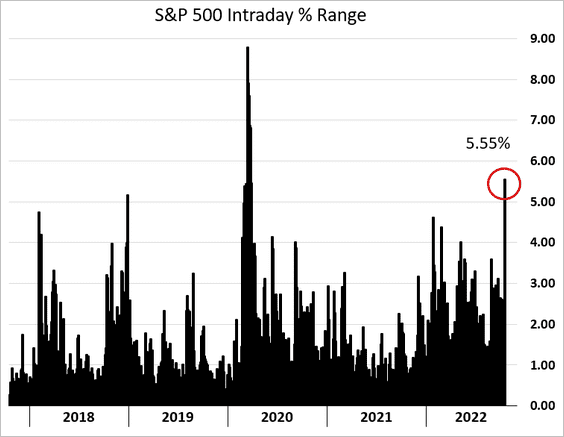
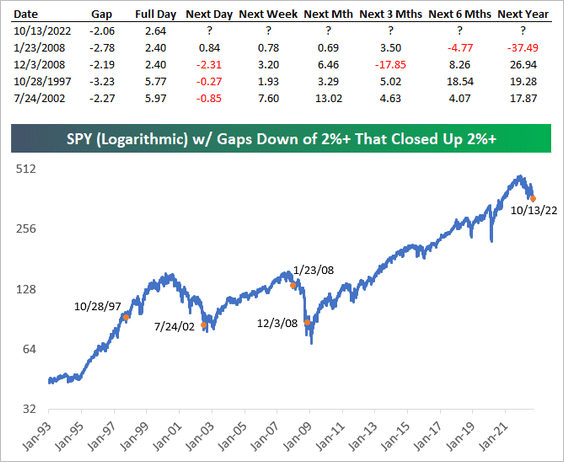
1. The intraday swing was massive on Thursday as the selloff turned into a rally amid short covering (which is likely to be short-lived).
Historically, the S&P 500 has pulled back before rallying after instances similar to yesterday.
 Source: @bespokeinvest
——————–
2. Stocks are oversold relative to bonds.
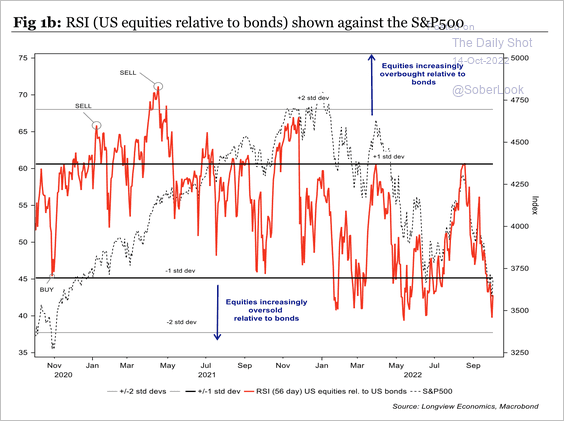 Source: Longview Economics
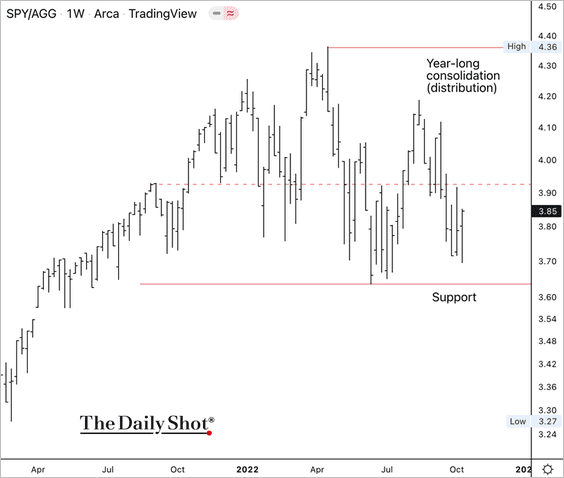
So far, the S&P 500 (SPY) is holding support relative to the US Aggregate Bond ETF (AGG), albeit within a year-long range.
——————–
3. The Russell 2,000 small-cap index has been outperforming the S&P 500.
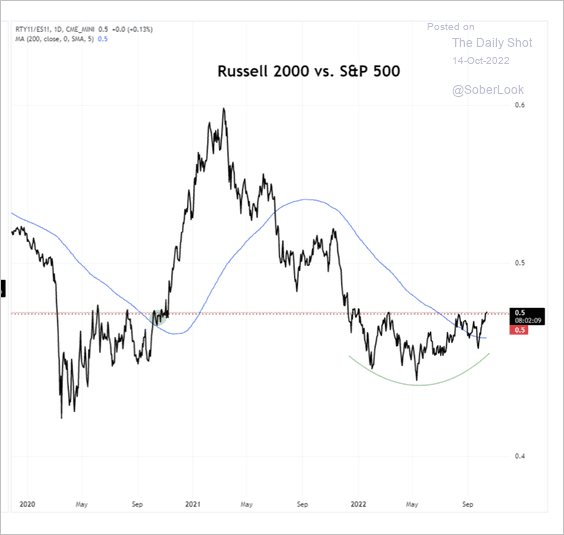 Source: Aazan Habib, Paradigm Capital
Small caps have been trading at significant discounts.
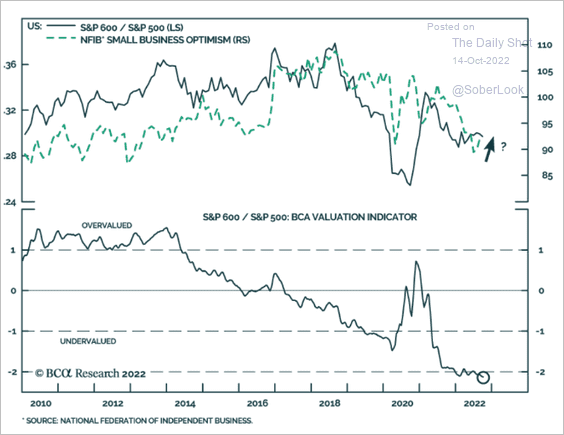 Source: BCA Research
——————–
4. What happens at the end of tightening cycles? The end, of course, is months away.
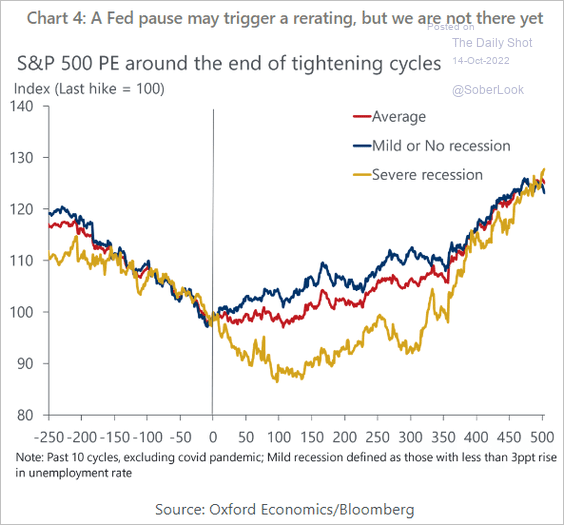 Source: Oxford Economics
5. Stocks have decoupled from economic surprises (the market is pricing a recession).
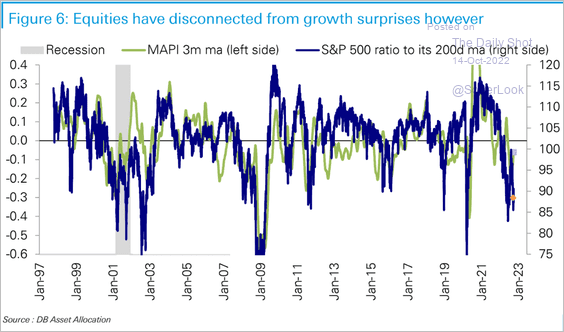 Source: Deutsche Bank Research
6. Global equity market sentiment is extremely bearish.
 Source: Longview Economics
7. Profit margins are heading lower.
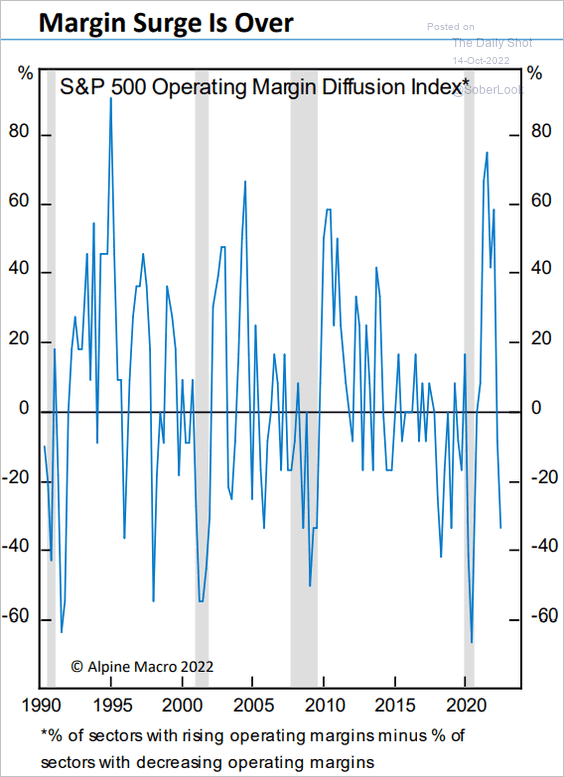 Source: Alpine Macro
8. This chart shows large-cap price-to-sales ratio changes since the end of last year.
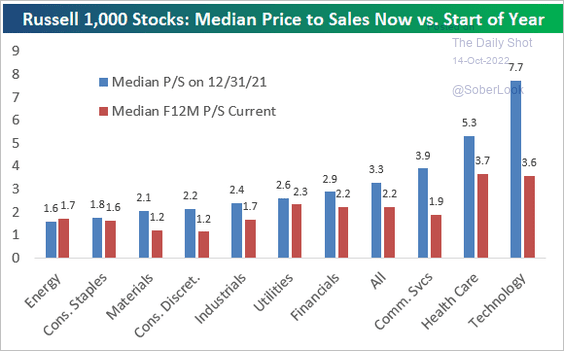 Source: @bespokeinvest Read full article
9. So far, the relative performance of US road and rail stocks has held up despite weakness in forward earnings.
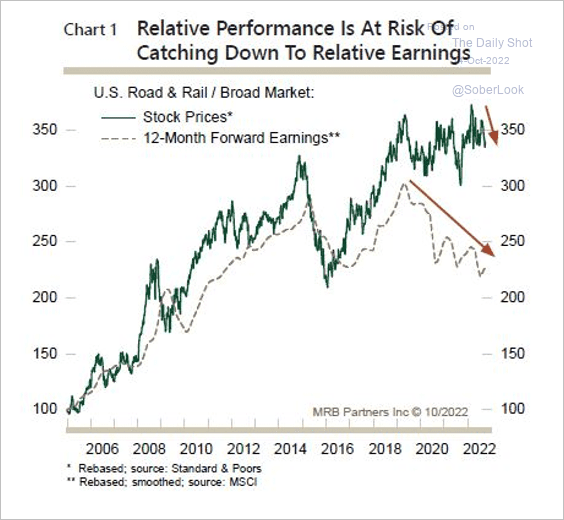 Source: MRB Partners
10. Which factors do companies report as having a negative impact on earnings?
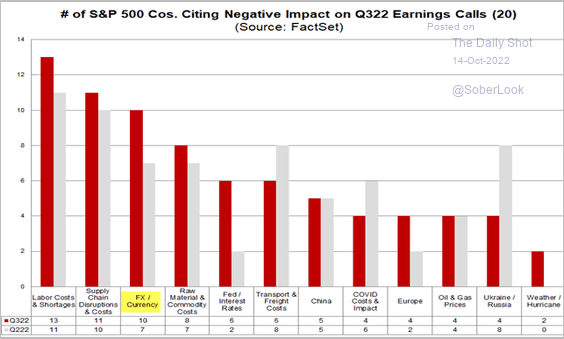 Source: @FactSet Read full article
Back to Index
Rates
1. The US inflation curve is increasingly inverted …
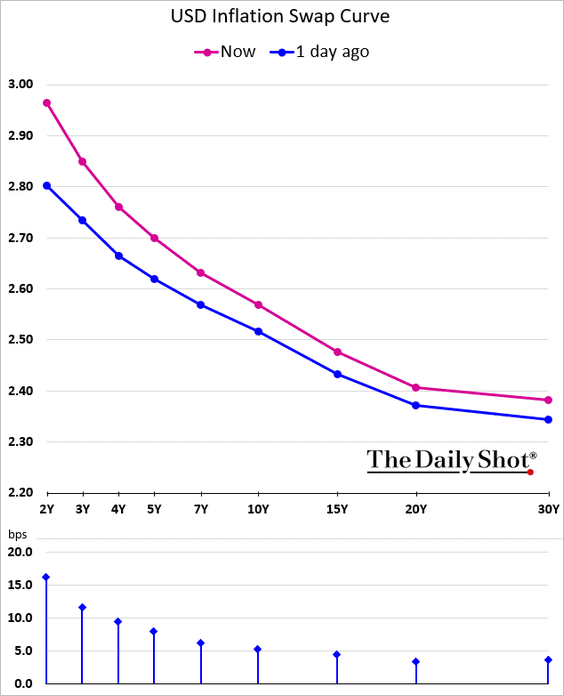
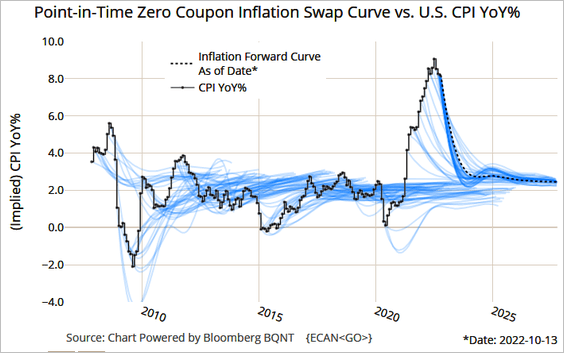 Source: @TheTerminal, Bloomberg Finance L.P.
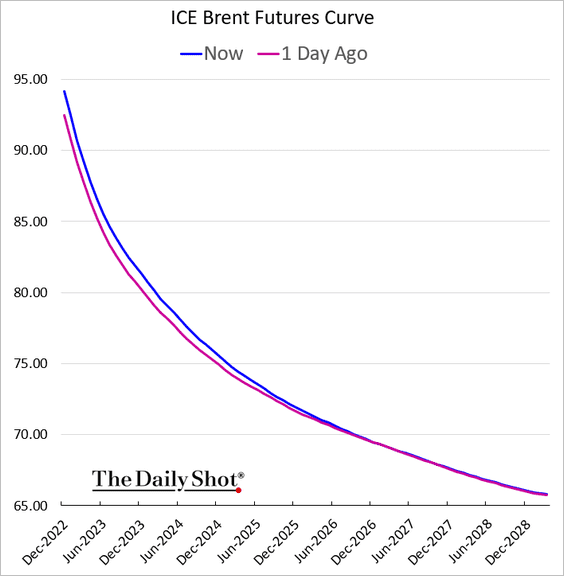
… partially driven by the oil curve backwardation.
——————–
2. Typically, the real rates curve inverts around the end of a tightening cycle. This time, the market is pricing in a highly restrictive Fed.
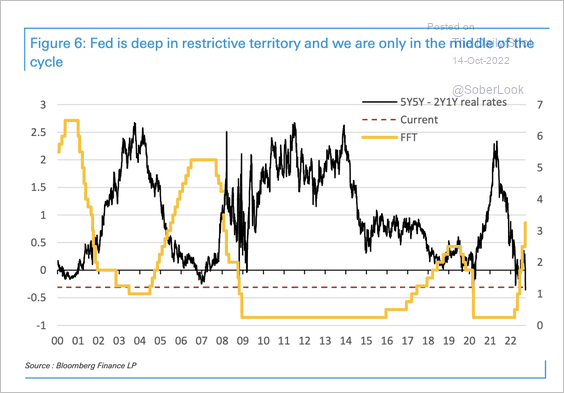 Source: Deutsche Bank Research
3. Rate markets implied volatility has been surging.
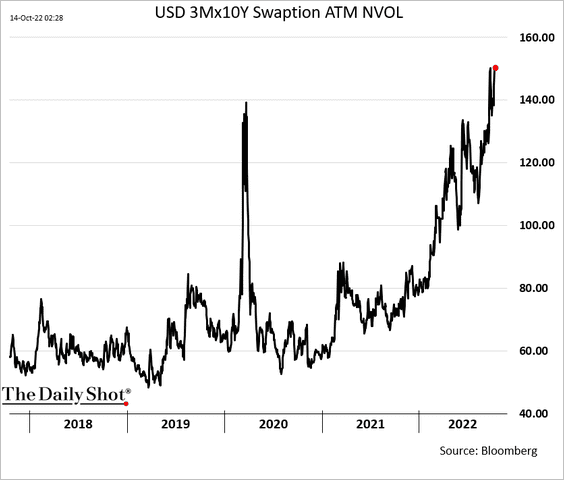
Treasury volatility used to decline during tightening cycles. Not anymore.
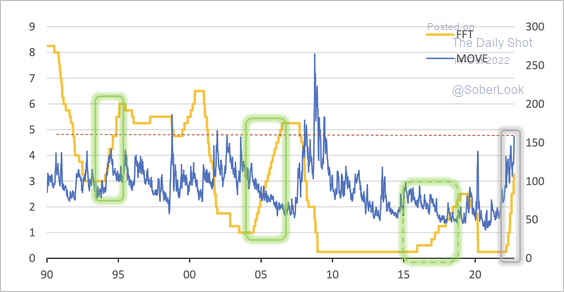 Source: Deutsche Bank Research
——————–
4. The 30-year bull market in government debt has ended.
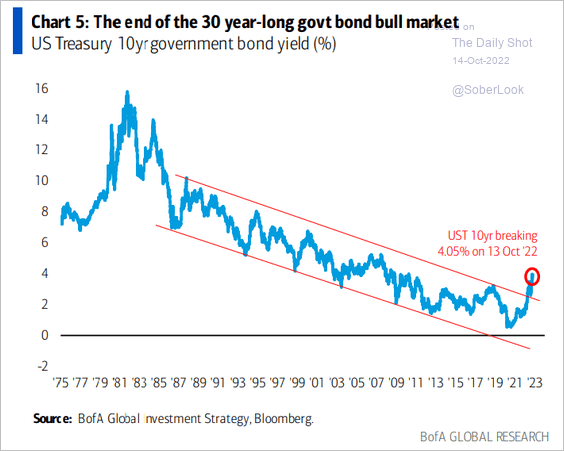 Source: BofA Global Research
Back to Index
Global Developments
1. Cross-asset correlation surged this year.
 Source: Barclays Research
2. This chart shows asset class performance in stagflationary and disinflationary environments.
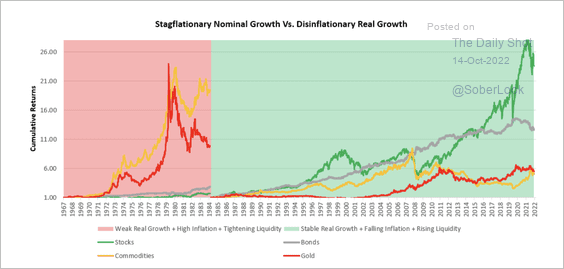 Source: Prometheus Research
3. The pace of the dollar’s appreciation has hit record levels.
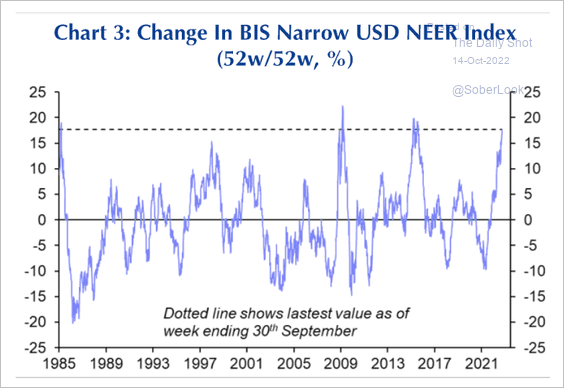 Source: Capital Economics
4. Which countries are most exposed to US dollar strength?
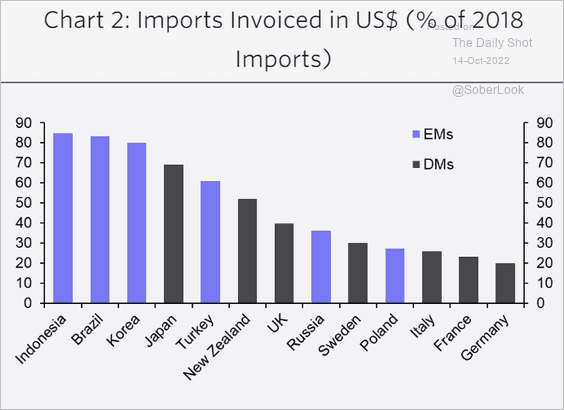 Source: Capital Economics
5. Next, we have the distribution of financial assets by region.
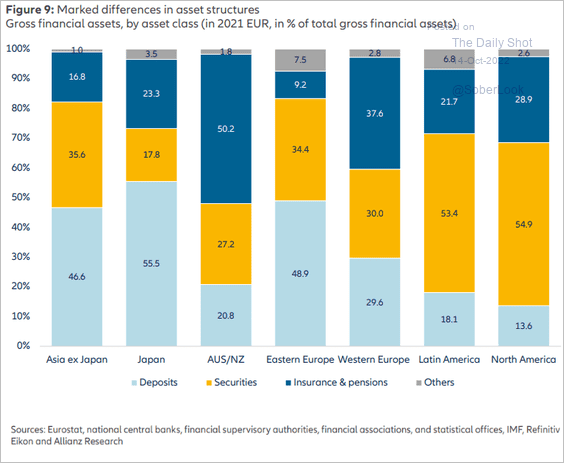 Source: Allianz Research
——————–
Food for Thought
1. Average online order value:
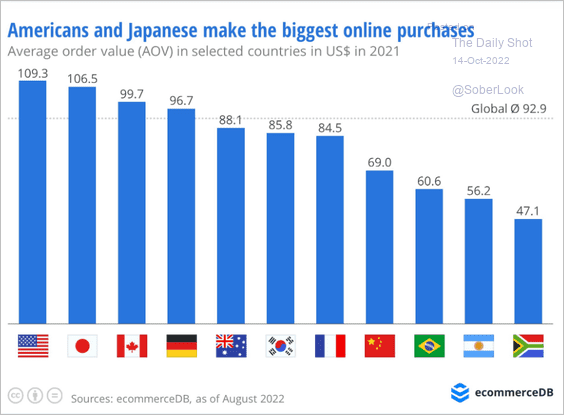 Source: ecommerceDB
2. Water efficiency:
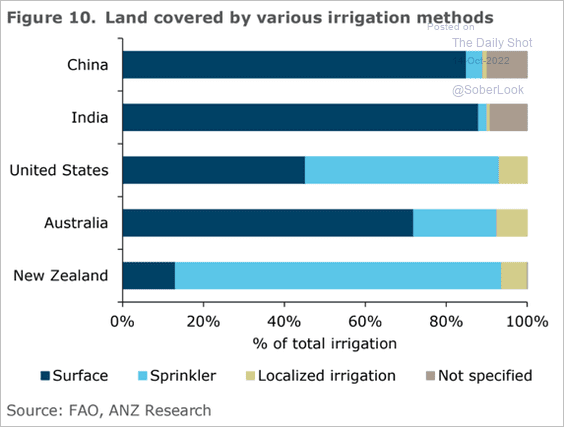 Source: @ANZ_Research
3. Gen-Z exercise preferences:
 Source: @CivicScience
4. Impeachment resolutions:
 Source: @axios Read full article
5. Uber’s second-quarter results:
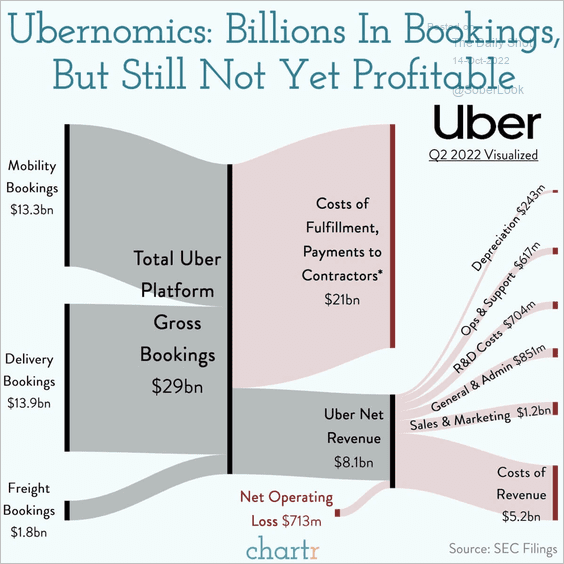 Source: @chartrdaily
6. Physical office occupancy:
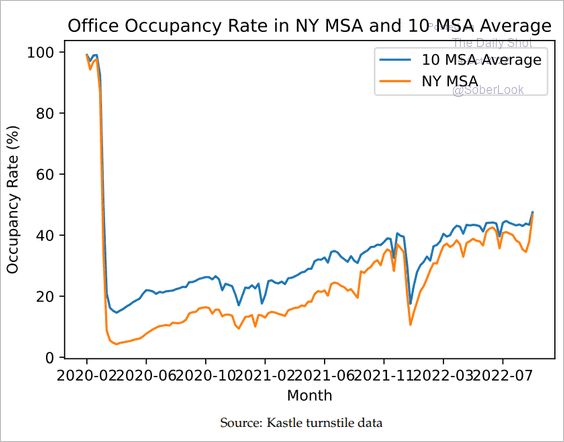 Source: NBER Read full article
7. Gen-Z cheat sheet for teachers:
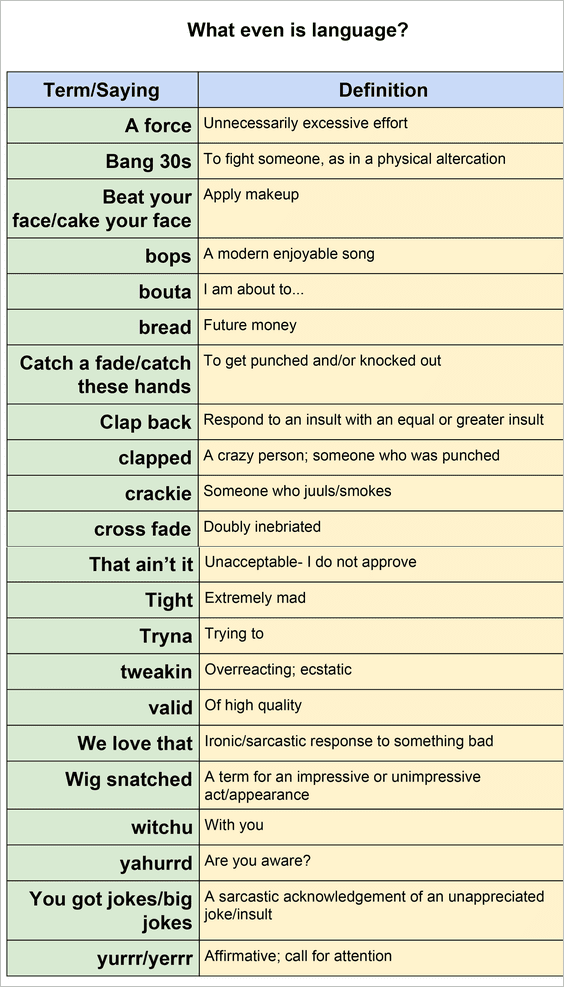 Source: James Callahan Read full article
——————–
Have a great weekend!
Back to Index