The Daily Shot: 18-Oct-22
• The United States
• Canada
• The United Kingdom
• The Eurozone
• Europe
• Asia – Pacific
• China
• Emerging Markets
• Cryptocurrency
• Energy
• Equities
• Credit
• Rates
• Global Developments
• Food for Thought
The United States
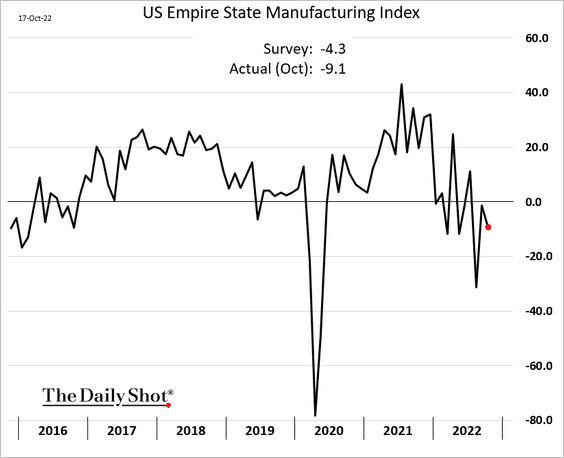
1. The first regional manufacturing report of the month shows slowing factory activity.
 Source: MarketWatch Read full article
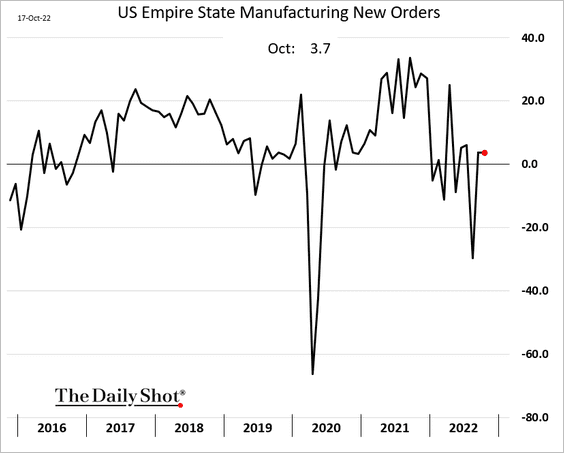
• The orders index held steady.
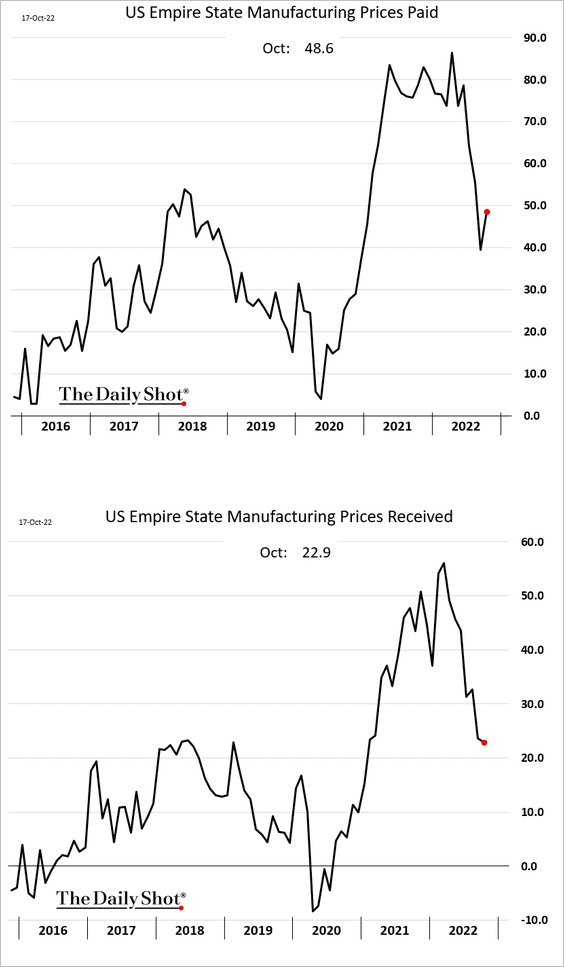
• Price pressures persist, with more companies reporting paying higher prices in October.
• Supplier bottlenecks have eased, …
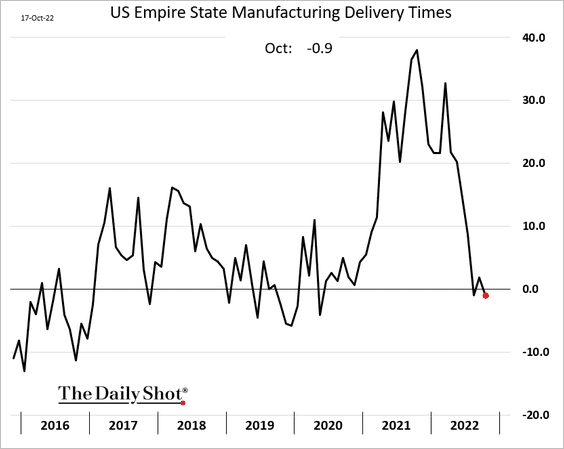
… signaling falling corporate margins.
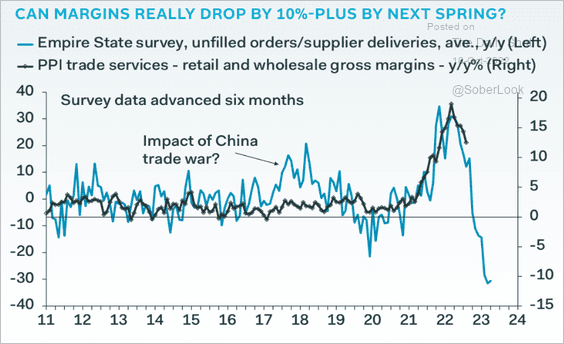 Source: Pantheon Macroeconomics
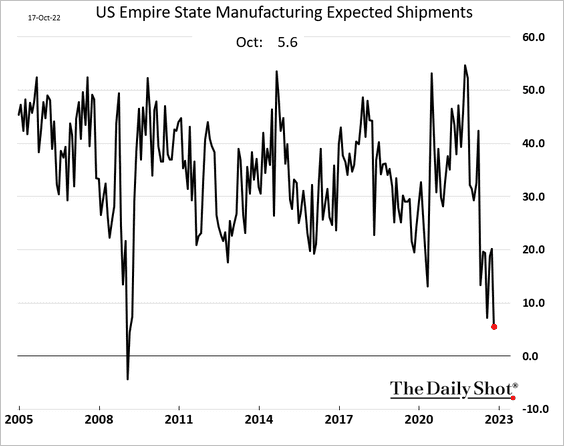
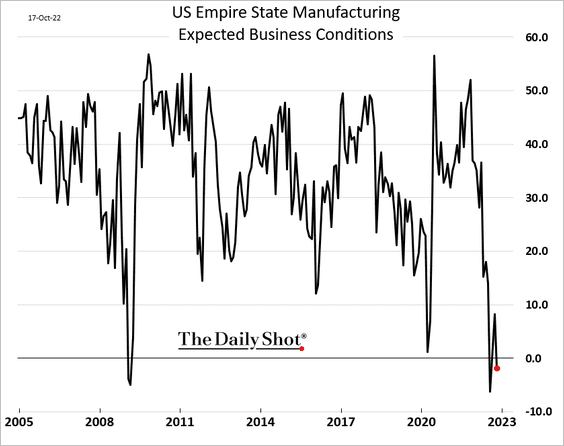
• Expectations indicators point to a gloomy outlook among the region’s manufacturers.
– Expected shipments:
– Expected business conditions:
——————–
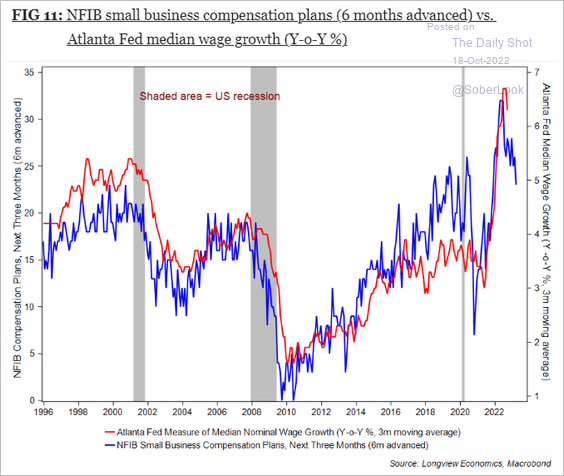
2. The Atlanta Fed’s wage growth tracker appears to have peaked.
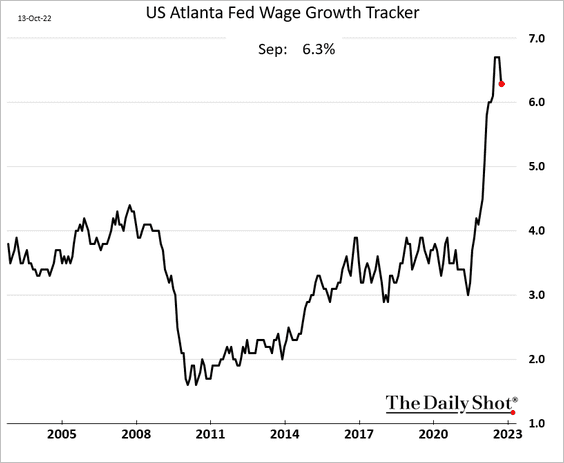
And the NFIB small business compensation plans index suggests that wage growth will continue to slow.
 Source: Longview Economics
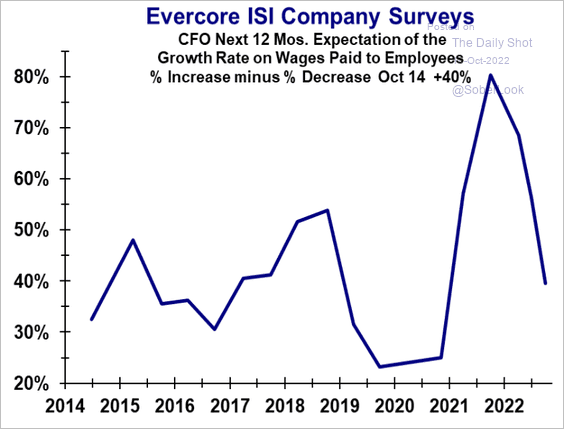
Corporate CFOs also see slower wage growth ahead.
 Source: Evercore ISI Research
——————–
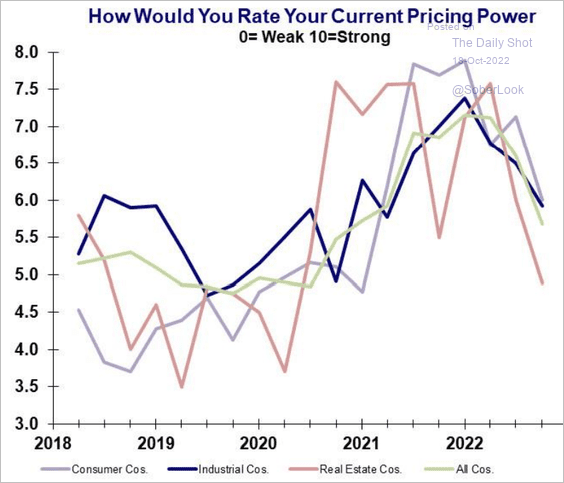
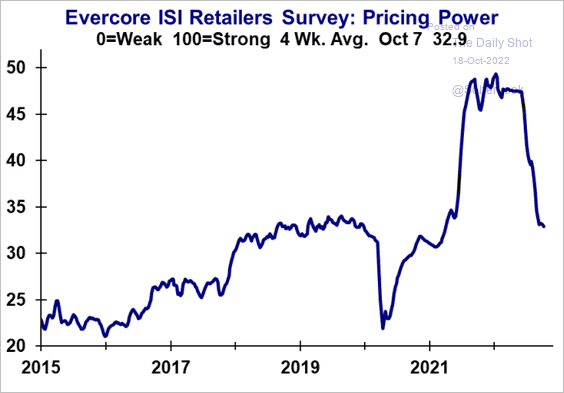
3. Business pricing power, while still elevated relative to pre-COVID levels, has been moderating …
 Source: Evercore ISI Research
… especially in retail, …
 Source: Evercore ISI Research
… as inventories recover.
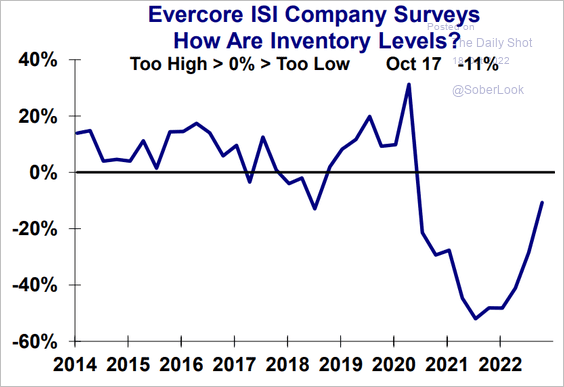 Source: Evercore ISI Research
——————–
4. CEO confidence has deteriorated, …
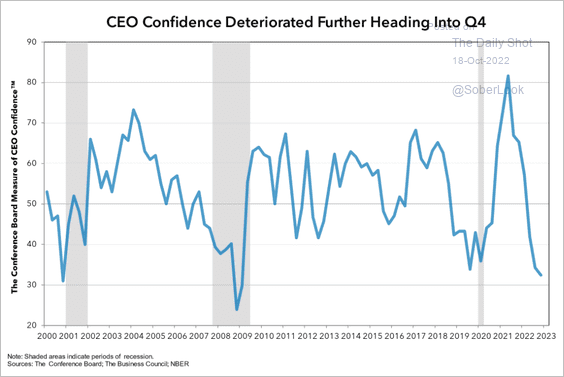 Source: The Conference Board
… as demand growth slows.
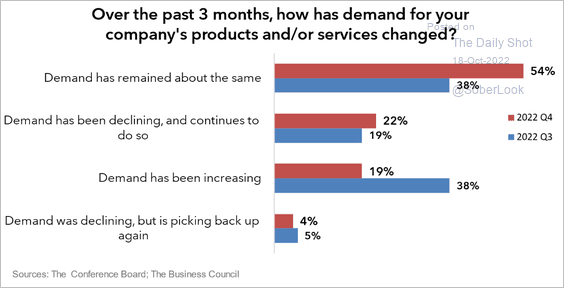 Source: The Conference Board
——————–
5. Business applications remain elevated relative to pre-COVID levels.
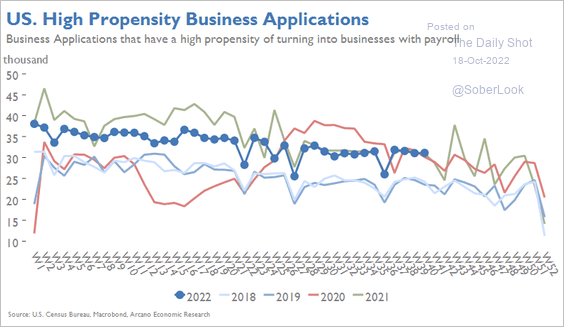 Source: Arcano Economics
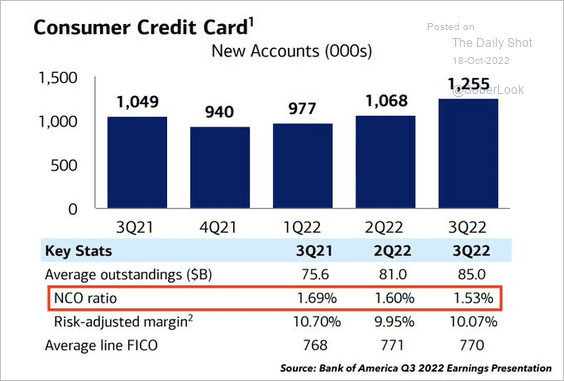
6. BofA’s quarterly results suggest that credit card demand remains robust while delinquencies are relatively low (for now).
 Source: @JackFarley96
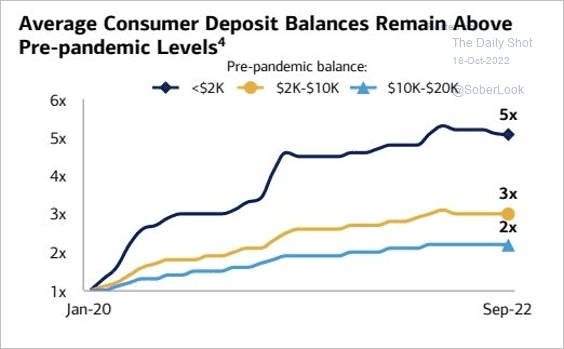
Savings remain elevated, which should provide a cushion as the economy slows.
 Source: @TheTranscript_
——————–
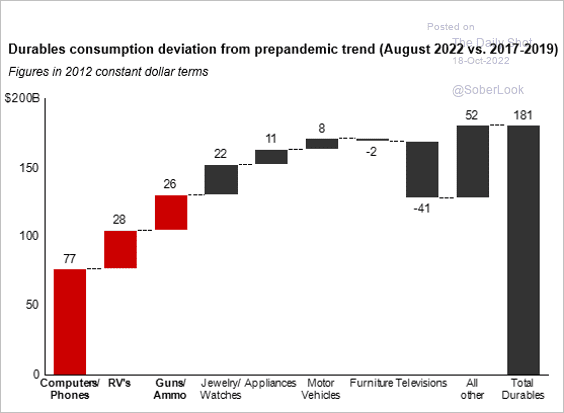
7. How has goods consumption changed from the pre-pandemic trend?
 Source: Bain & Company
Back to Index
Canada
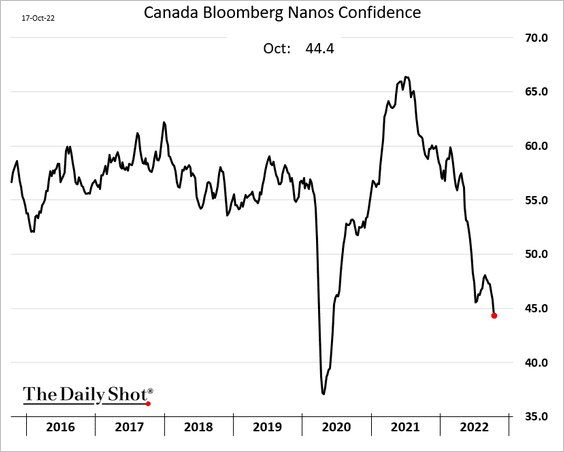
1. Consumer confidence continues to deteriorate.
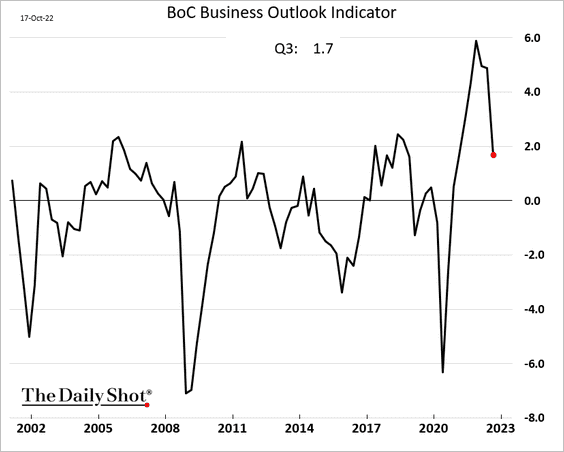
2. Business outlook declined sharply last quarter, according to the BoC’s survey.
 Source: Reuters Read full article
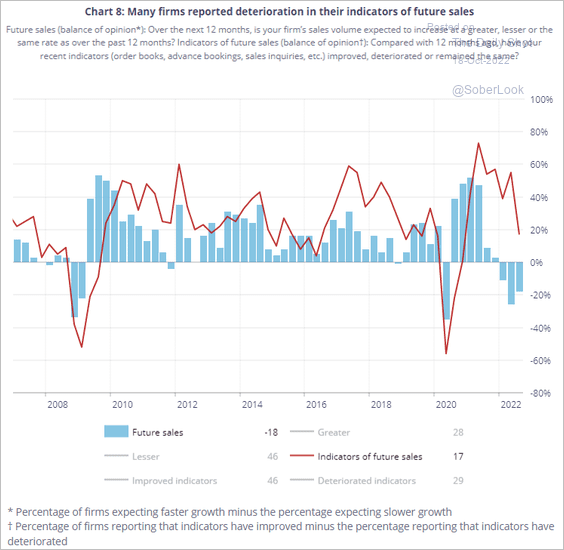
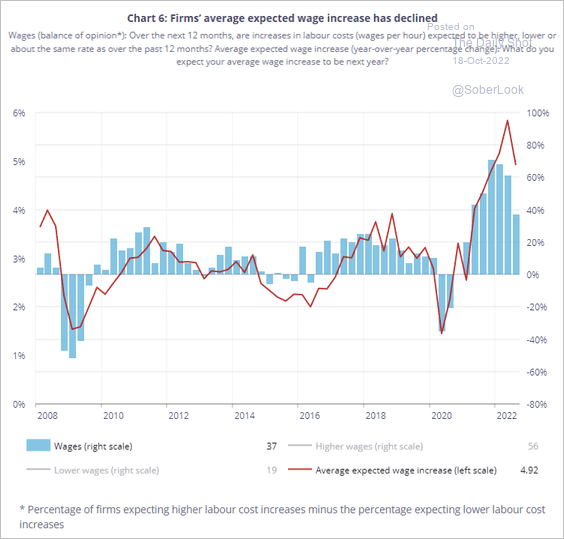
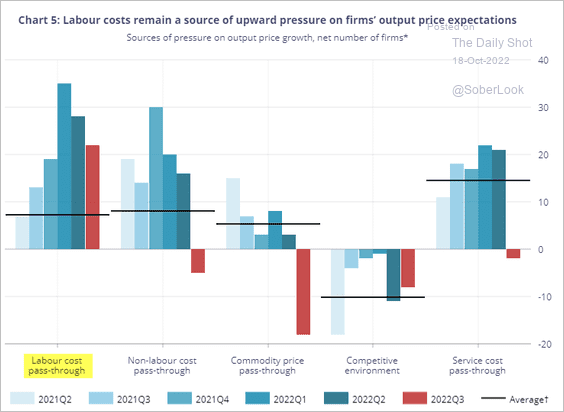
Here are some additional trends from the survey.
• Sales outlook:
 Source: BoC
• Wage gains expectations:
 Source: BofA Global Research
• Drivers of price expectations:
 Source: BoC
• Labor and supply bottlenecks:
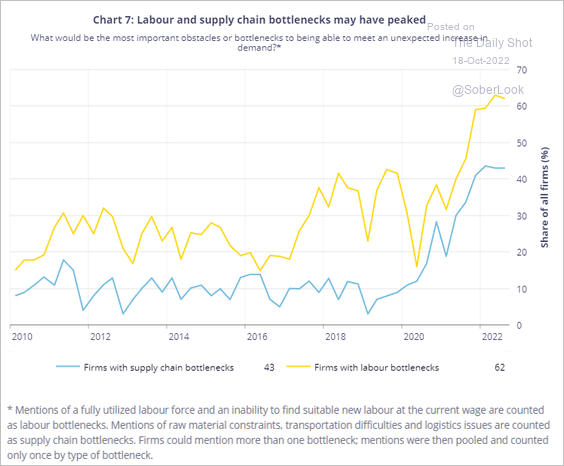 Source: BoC
• Input and output price expectations:
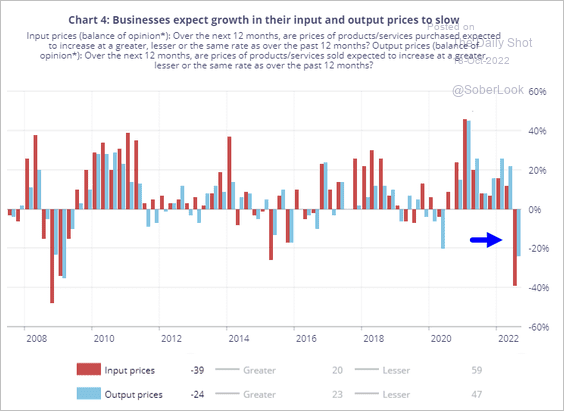 Source: BoC
• Inflation expectations:
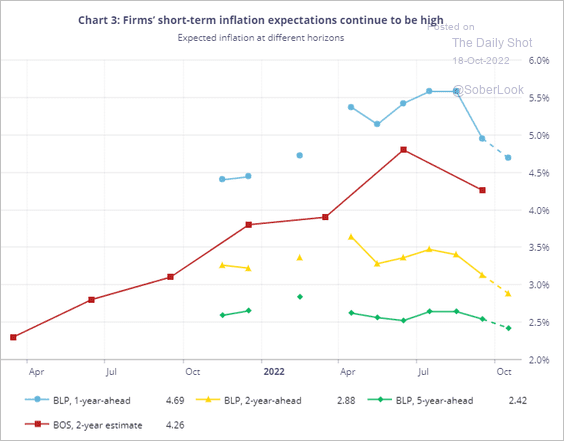 Source: BoC
• Home price appreciation:
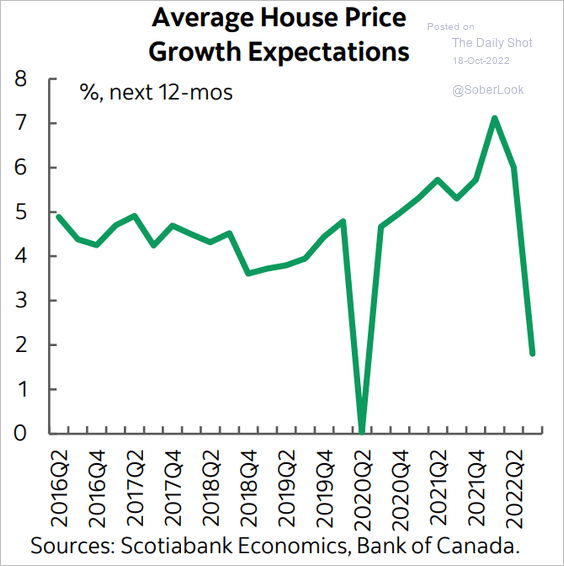 Source: Scotiabank Economics
Back to Index
The United Kingdom
1. The government is walking back most of the tax cuts.
 Source: NBC News Read full article
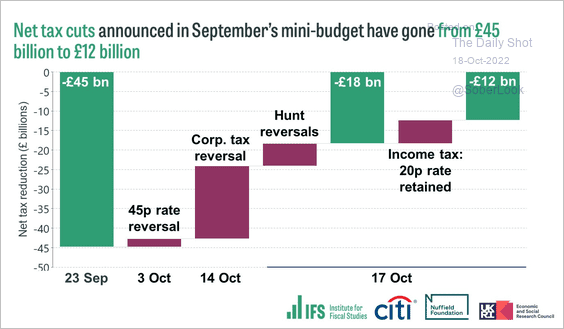 Source: @TheIFS
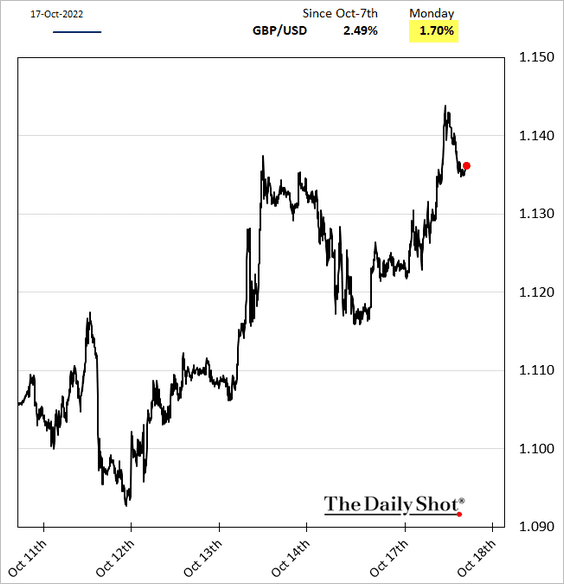
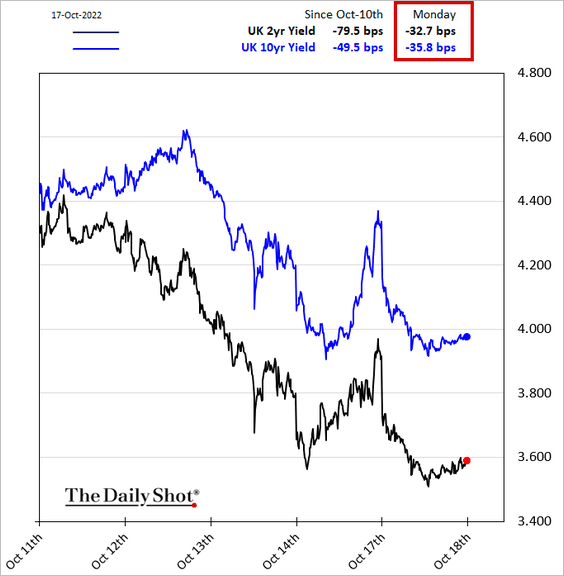
The pound and gilts jumped, boosting risk appetite globally.
——————–
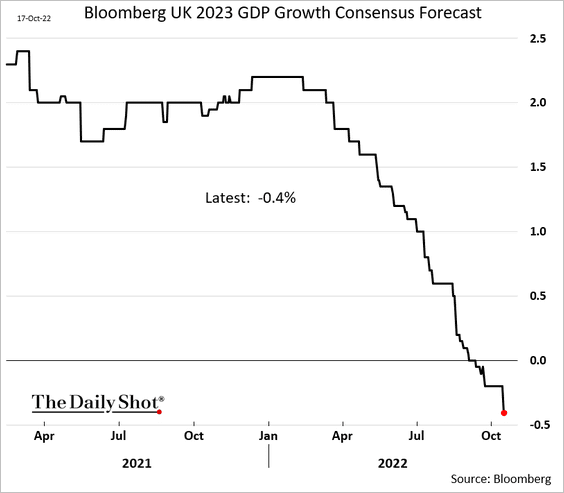
2. Economists increasingly expect the UK’s economy to contract in 2023.
3. Fund managers are very bearish on UK equities.
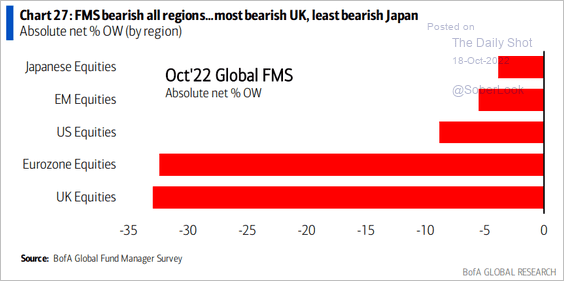 Source: BofA Global Research
4. On a separate note, this map shows EV charging stations in London.
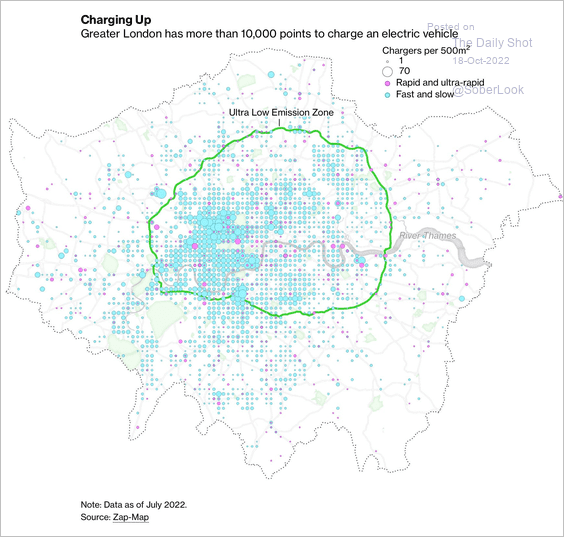 Source: @BBGVisualData Read full article
Back to Index
The Eurozone
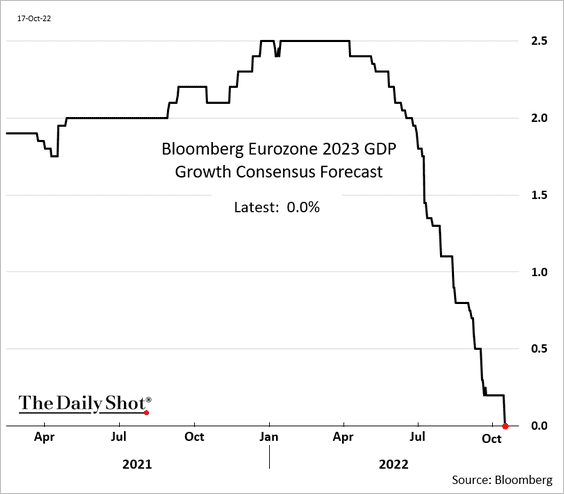
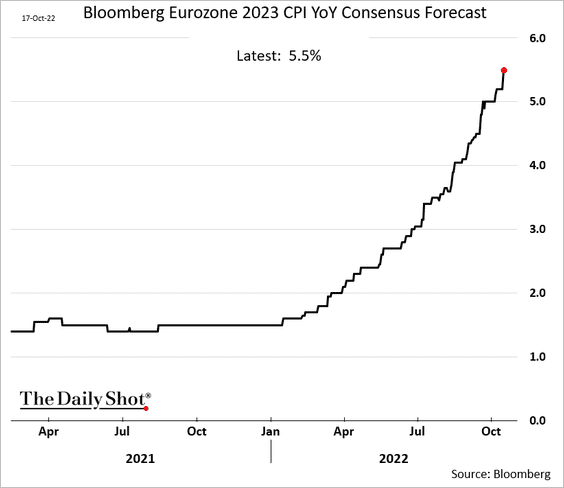
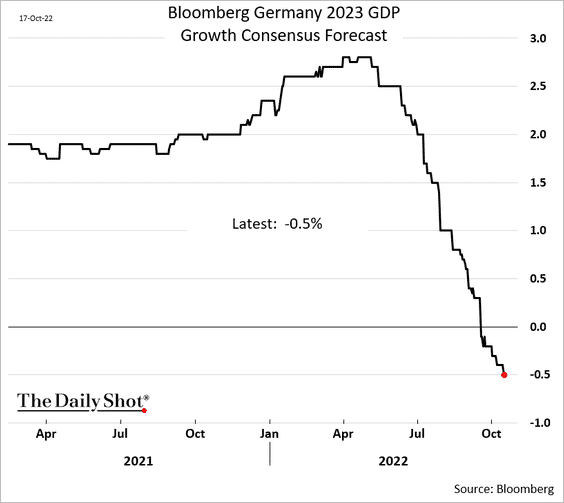
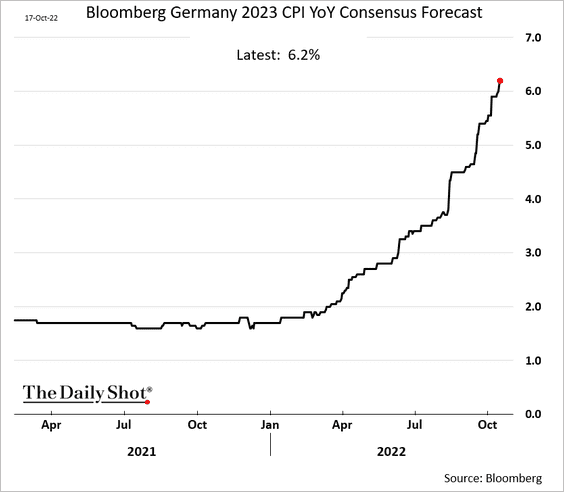
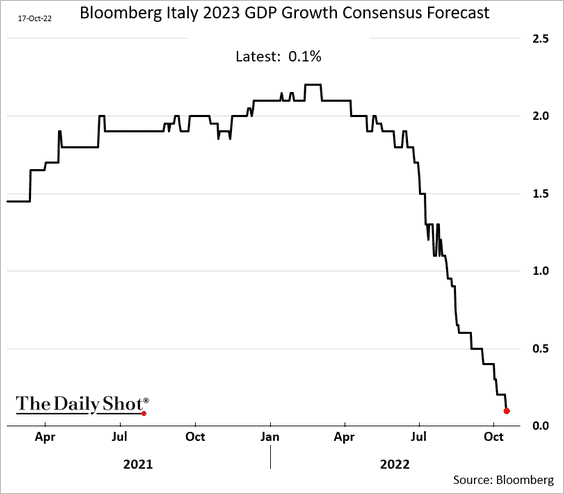
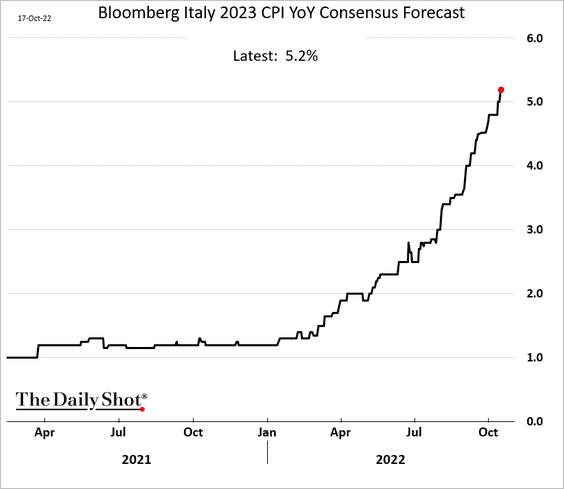
1. The Eurozone is facing stagflation next year. Here are the consensus forecasts.
• Growth:
• Inflation:
• Germany:
• Italy:
——————–
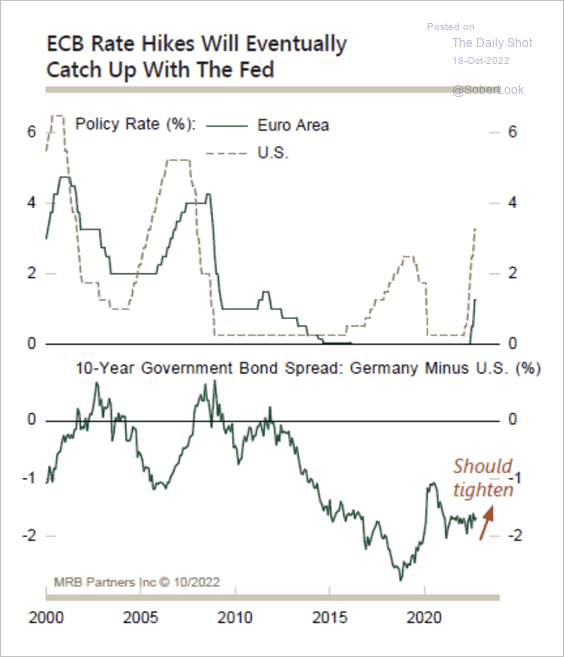
2. The ECB’s rate hikes will eventually catch up with the Fed, which should tighten yield differentials.
 Source: MRB Partners
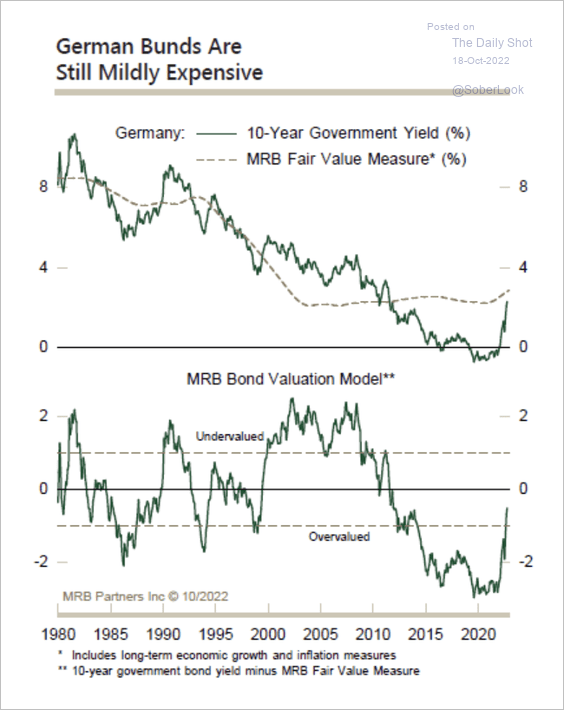
3. German 10-year bund valuations have normalized to some extent (relative to fair value), although we could see some additional upside in yields.
 Source: MRB Partners
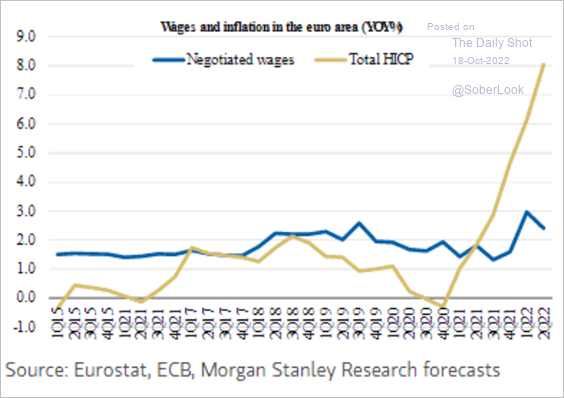
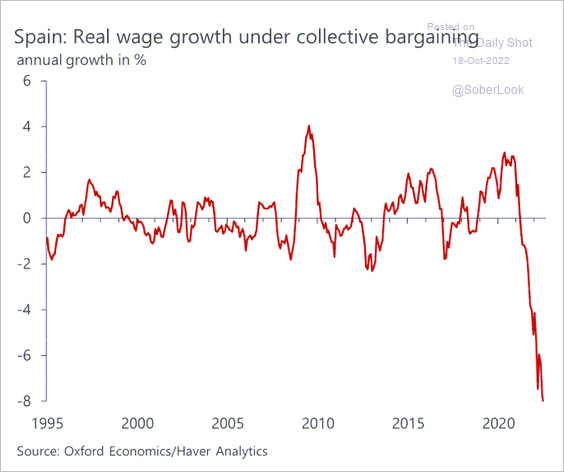
4. Real wages are moving deep into negative territory.
 Source: Morgan Stanley Research; III Capital Management
 Source: Oxford Economics
Back to Index
Europe
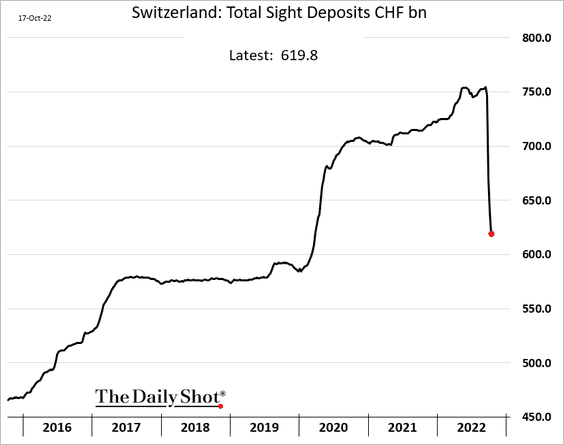
1. The amount of commercial bank cash held with the Swiss National Bank fell by another 20 billion Swiss francs last week as the SNB tightens monetary policy.
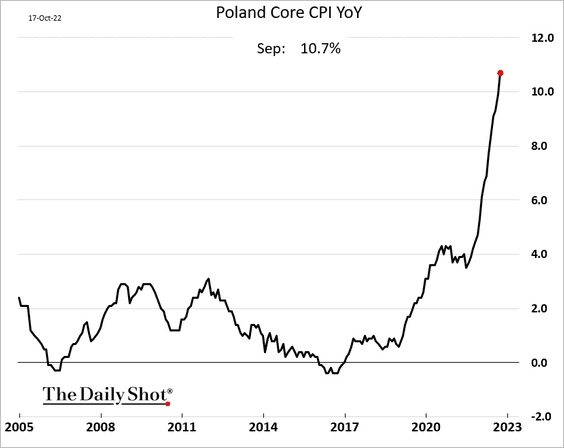
2. Poland’s core CPI continues to surge.
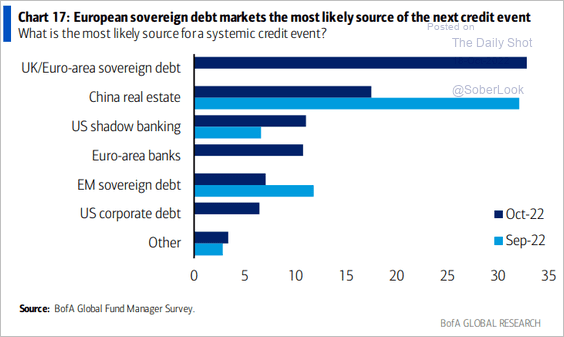
3. Fund managers are concerned about European sovereign debt risks.
 Source: BofA Global Research
Back to Index
Asia – Pacific
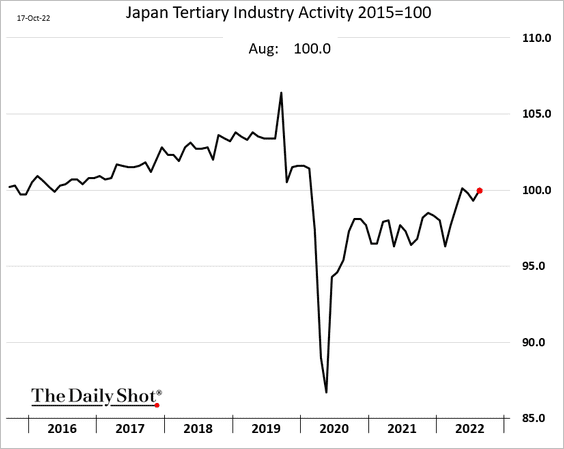
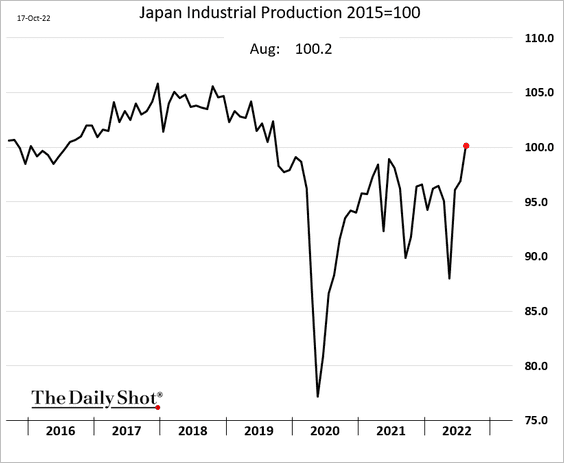
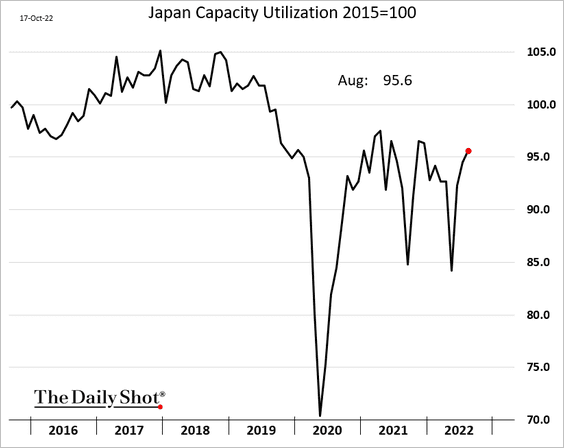
1. Japan’s economic activity firmed in August.
• Services:
• Industrial production:
• Capacity utilization:
——————–
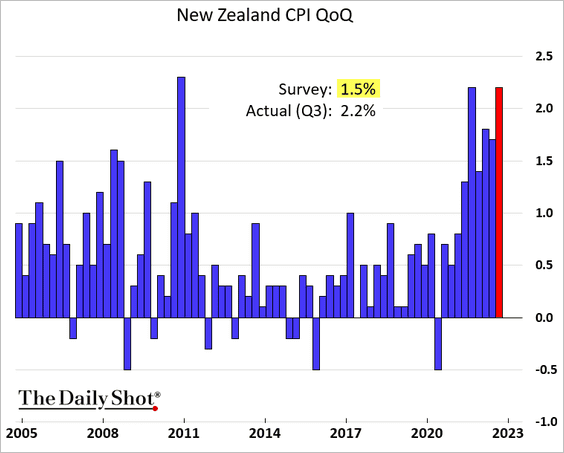
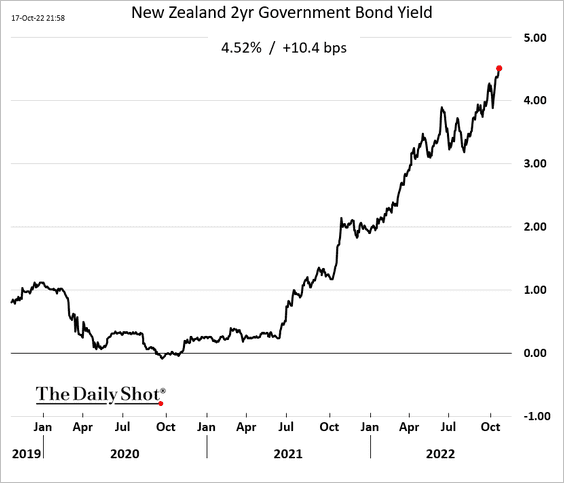
2. New Zealand’s inflation unexpectedly accelerated last quarter.
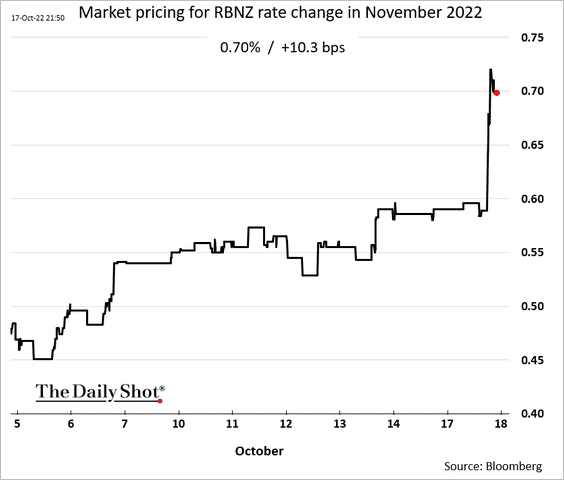
The November rate hike is now likely to be 75 bps (rather than 50 bps), according to markets.
Here is the 2yr bond yield.
Back to Index
China
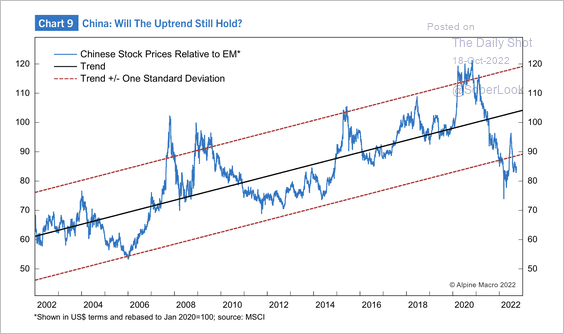
1. Will the long-term uptrend in Chinese equities relative to broader EM hold? Analysts are increasingly bullish on China’s stocks.
 Source: Alpine Macro
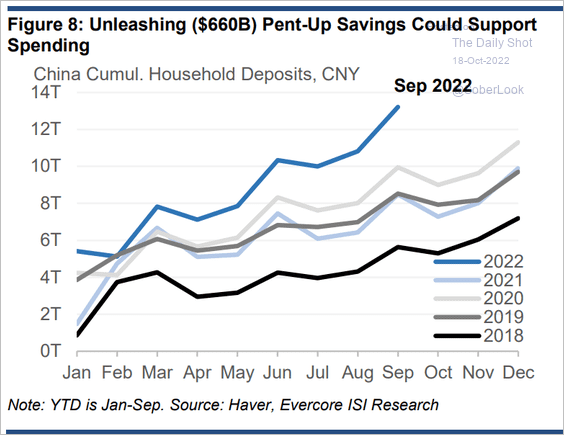
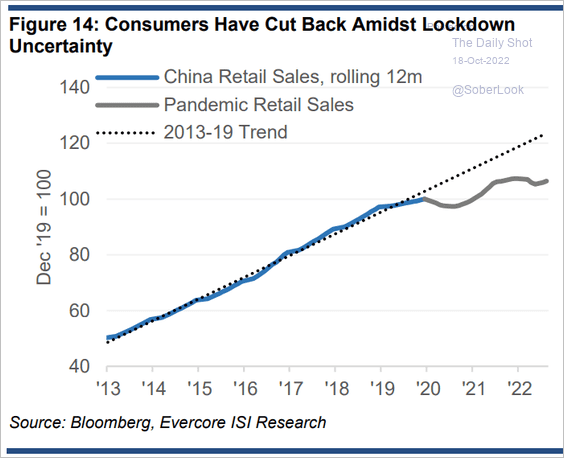
2. The 2022 deposit surge should support consumption next year.
 Source: Evercore ISI Research
 Source: Evercore ISI Research
——————–
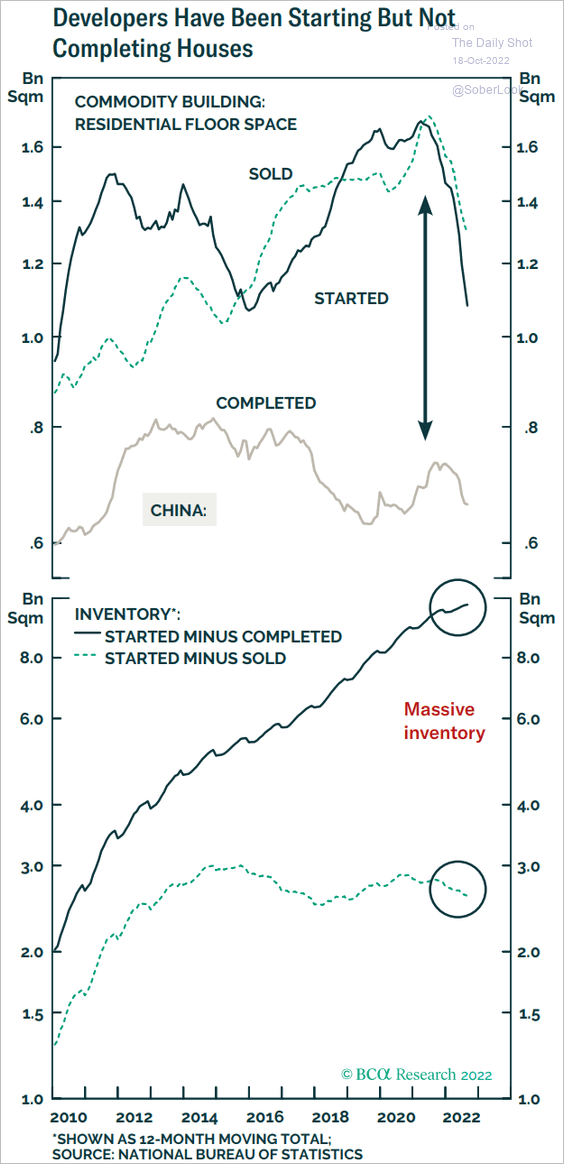
3. The inventory of unfinished properties remains elevated.
 Source: BCA Research
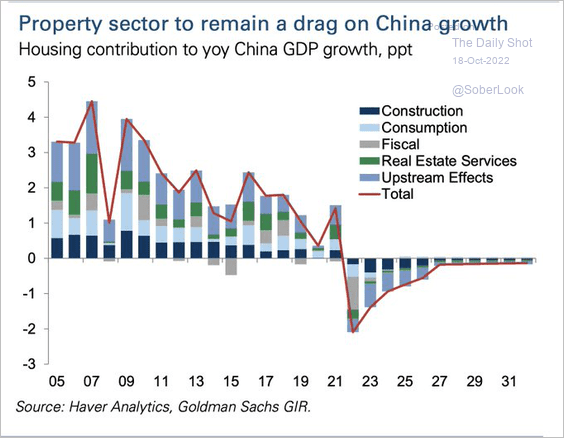
4. Housing will be a drag on growth.
 Source: @acemaxx, @GoldmanSachs
Back to Index
Emerging Markets
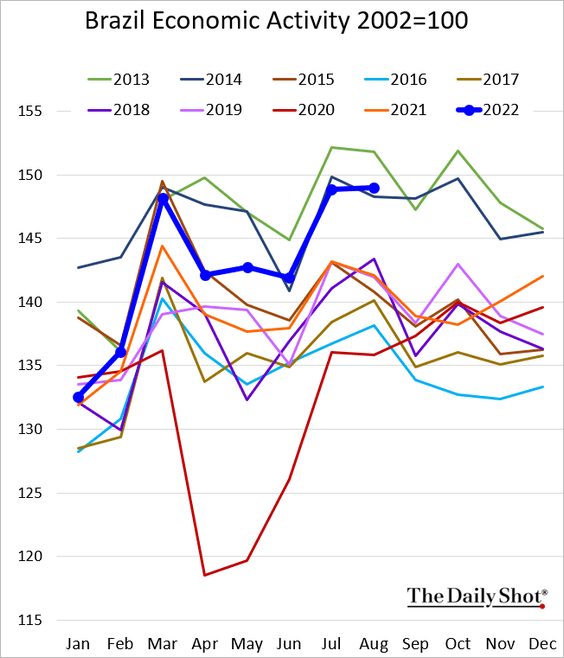
1. Brazil’s economic activity remains robust (note that the seasonally-adjusted figure reported elsewhere is misleading).
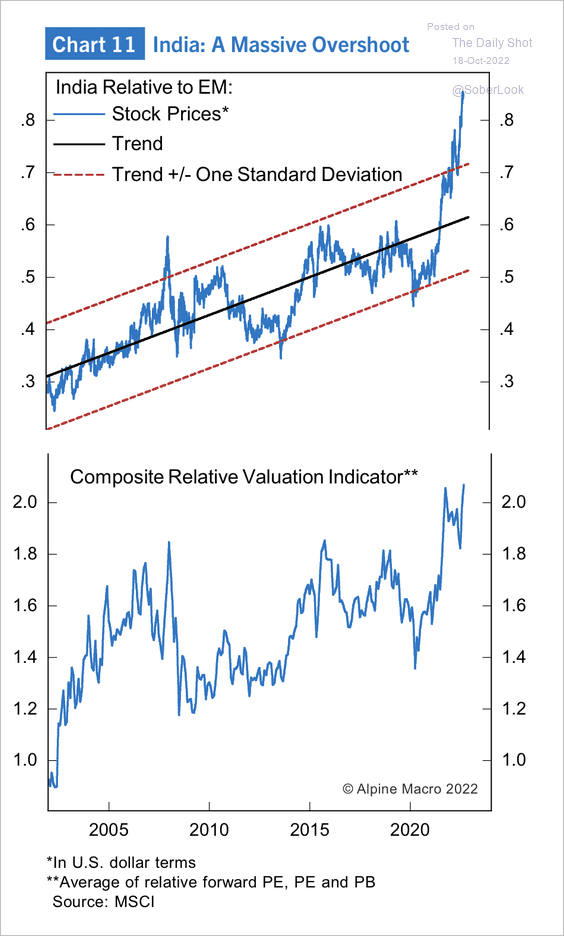
2. Indian equities appear overbought relative to broader EM, in dollar terms.
 Source: Alpine Macro
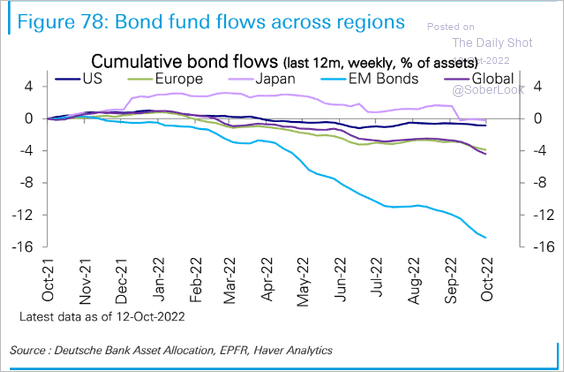
3. EM bond outflows continue.
 Source: Deutsche Bank Research
Back to Index
Cryptocurrency
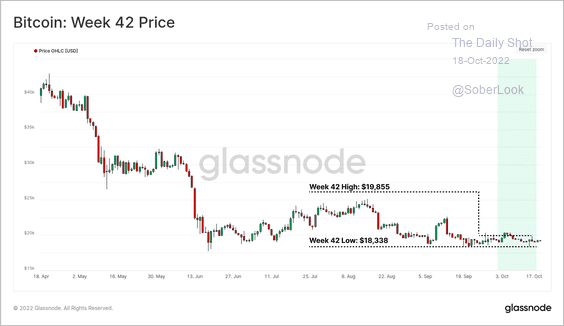
1. Bitcoin continues to trade in a tight range.
 Source: Glassnode Read full article
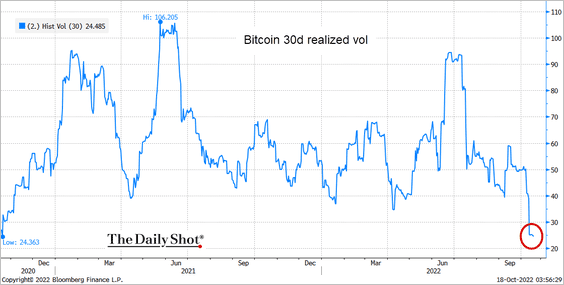
Here is the 30-day realized vol.
 Source: @TheTerminal, Bloomberg Finance L.P.
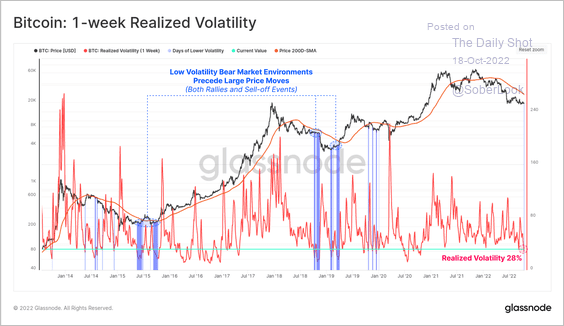
Prolonged periods of low volatility typically precede large price moves.
 Source: Glassnode Read full article
——————–
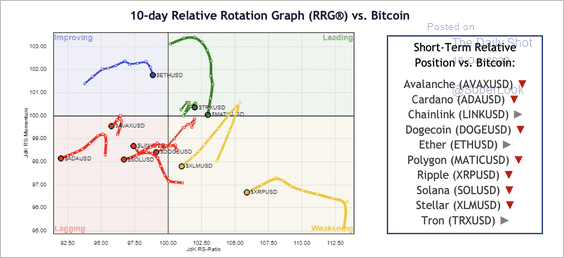
2. Most altcoins have weakened relative to bitcoin over the past ten days. The chart compares relative strength and momentum.
 Source: @StocktonKatie
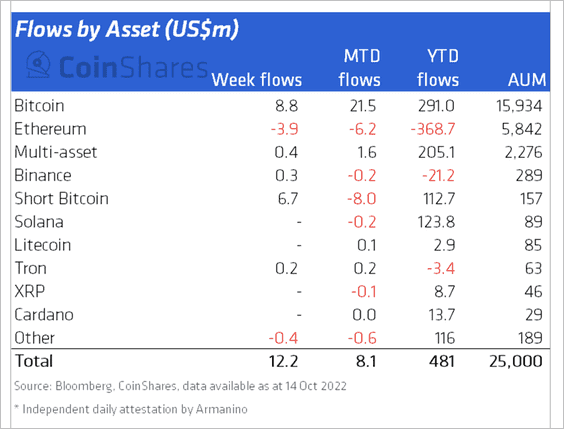
3. Crypto investment products saw minor inflows last week, driven by long and short bitcoin funds. That implies a neutral stance among investors.
 Source: James Butterfil, CoinShares Read full article
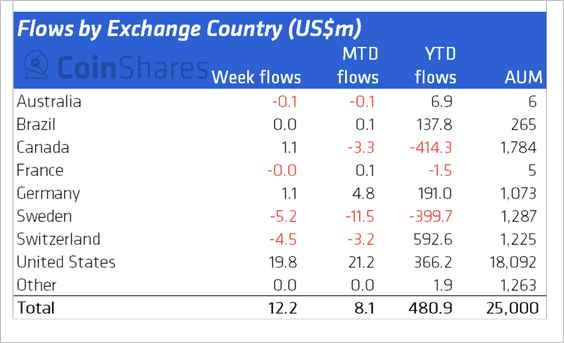
US crypto funds saw the largest inflows last week, while Sweden-based funds continued to see outflows.
 Source: James Butterfil, CoinShares Read full article
Back to Index
Energy
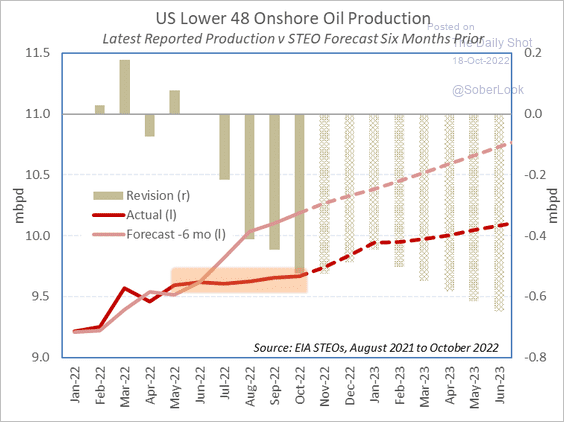
1. The COVID-era rebound in US oil production has been slower than expected.
 Source: Princeton Energy Advisors
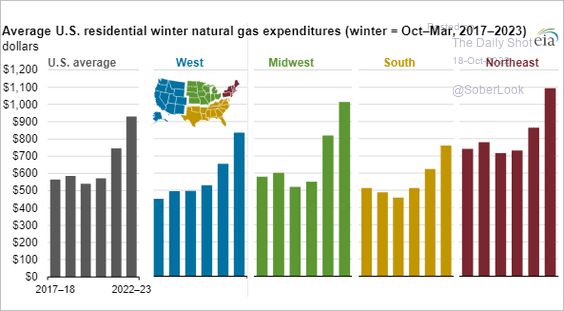
2. US natural gas bills will be much higher this winter.
 Source: @EIAgov, h/t @dailychartbook Read full article
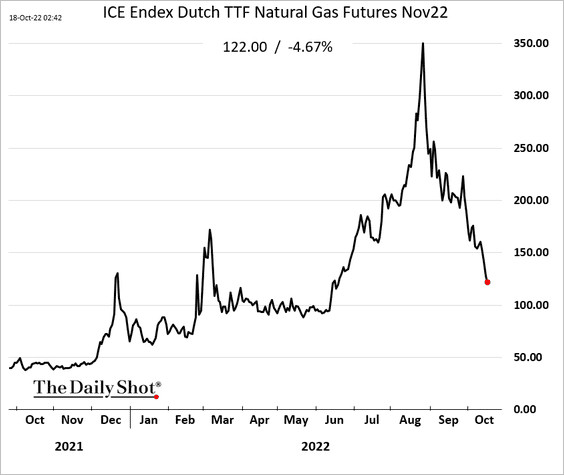
3. European natural gas futures continue to sink.
Back to Index
Equities
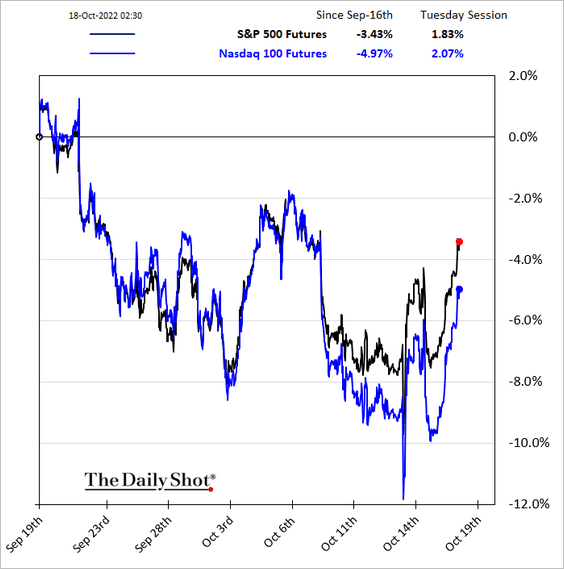
1. Stock futures are sharply higher as risk appetite returns. The fiscal u-turn in the UK helped ease global concerns.
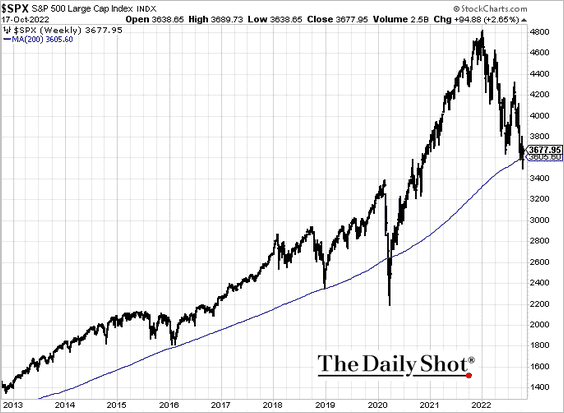
The S&P 500 closing above the 200-week moving average also helped.
——————–
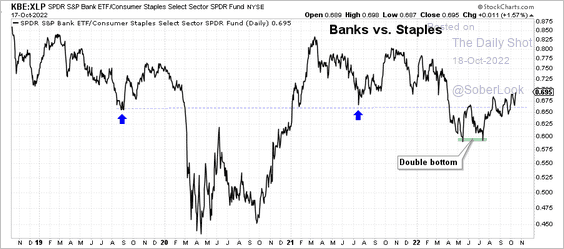
2. Bank stocks are starting to outperform staples, which is a risk-on development.
 Source: Aazan Habib, Paradigm Capital
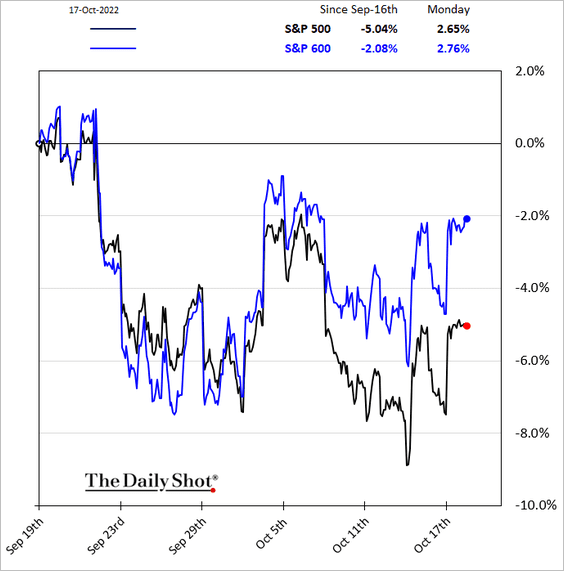
3. Small caps got a boost from the US dollar strength.
 Source: @WSJ Read full article
——————–
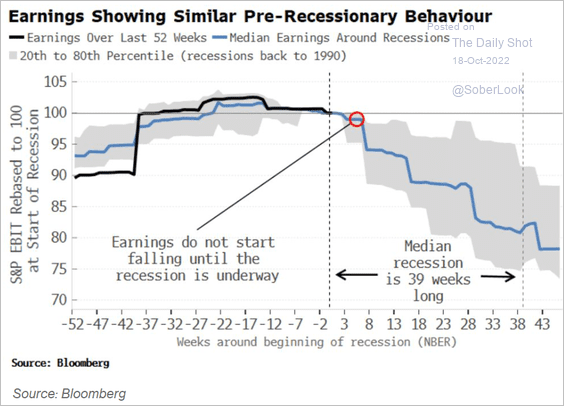
4. Deceleration in earnings will intensify in a recession scenario.
 Source: @LondonSW, @markets Read full article
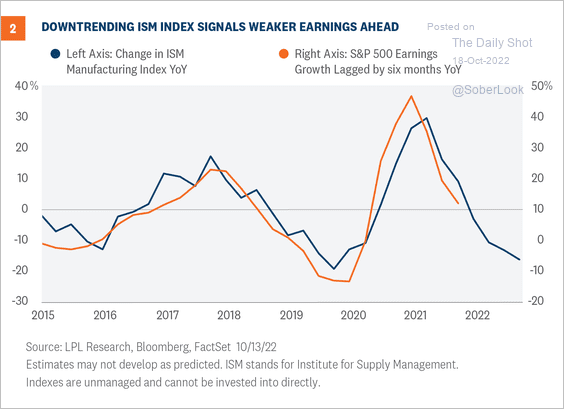
• Leading indicators continue to signal weaker earnings ahead.
 Source: LPL Research
• Q3 earnings downgrades have accelerated, …
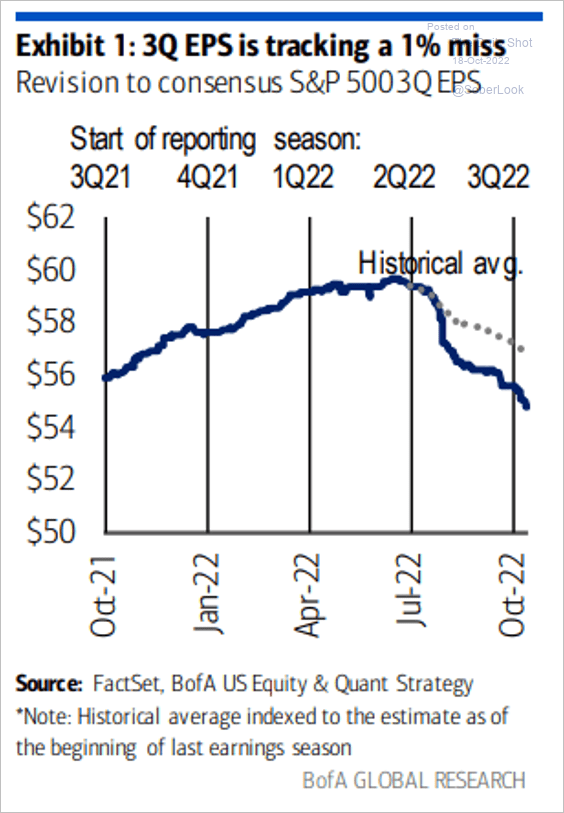 Source: BofA Global Research
… now showing minimal growth.
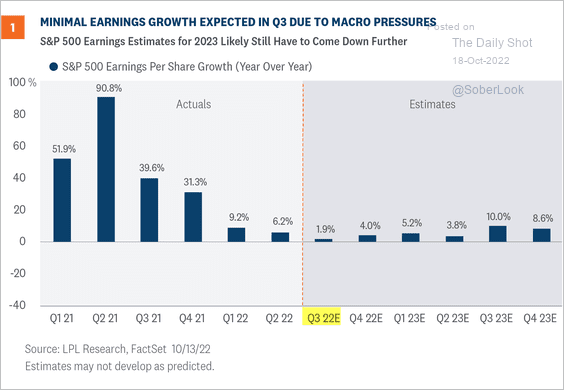 Source: LPL Research
——————–
5. Institutional investors kept selling stocks through the first week of the month. Will they get caught massively underinvested if the market turns?
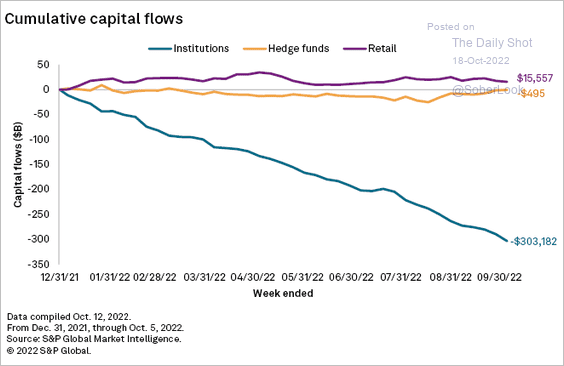 Source: S&P Global Market Intelligence
6. Fund managers are sitting on a lot of cash.
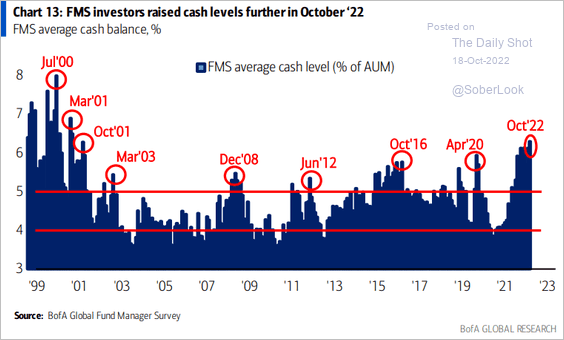 Source: BofA Global Research
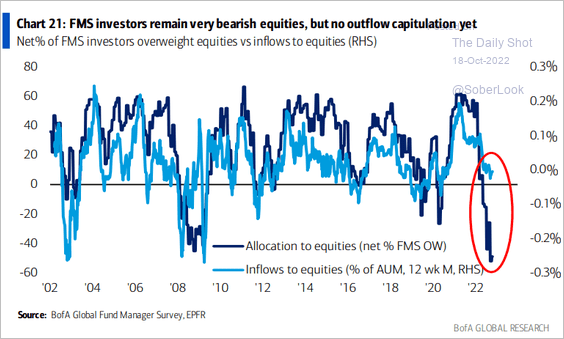
7. Fund managers’ extreme bearishness has not yet translated into outflow capitulation.
 Source: BofA Global Research
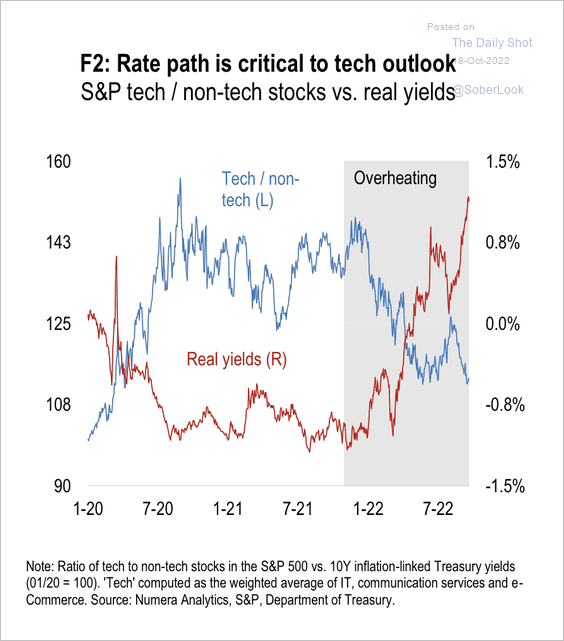
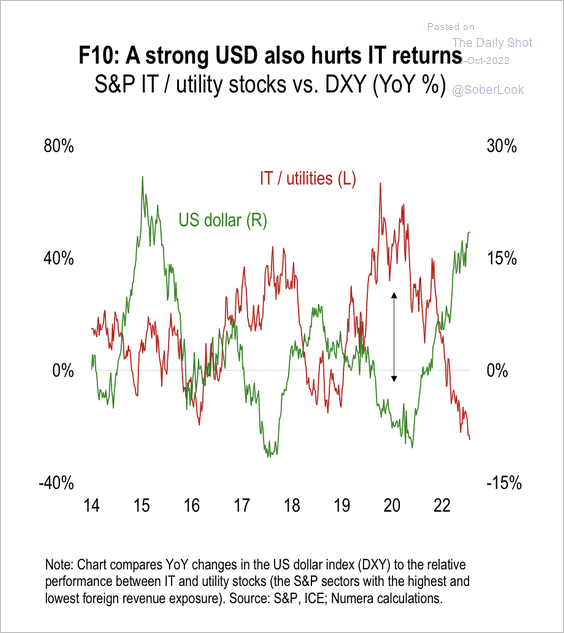
8. The rise in real yields and a strong dollar have weighed on tech stocks. Are we due for a pause? (2 charts)
 Source: Numera Analytics
 Source: Numera Analytics
——————–
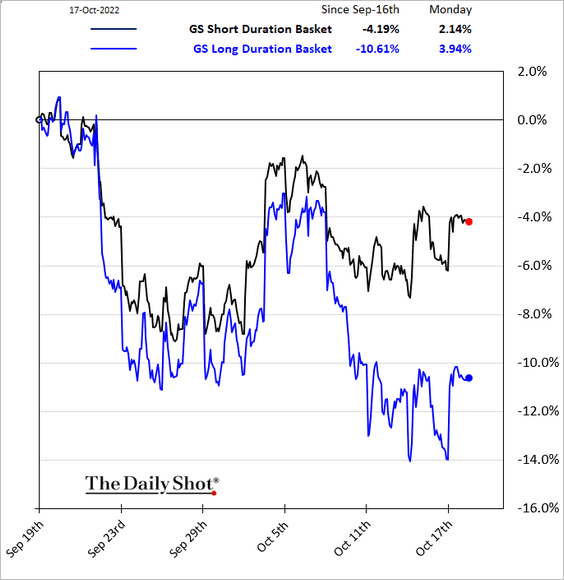
9. Long-duration equities have underperformed this month as yields surged.
Back to Index
Credit
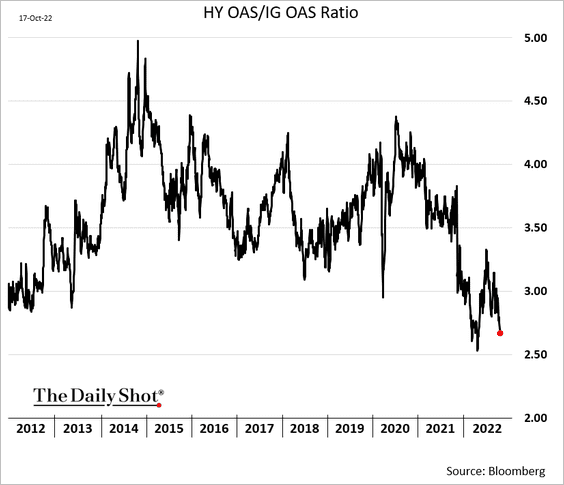
1. High-yield spreads are tight relative to investment grade.
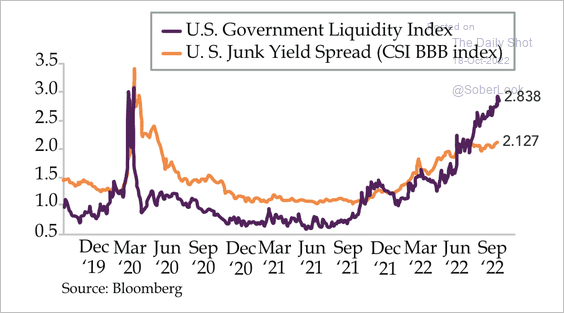
2. Tighter liquidity conditions point to wider junk bond spreads.
 Source: Quill Intelligence
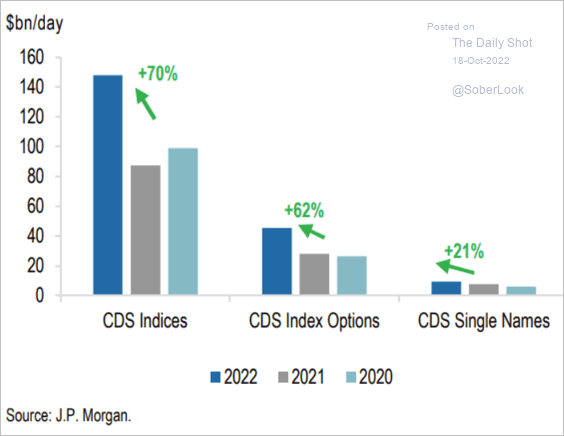
3. Credit default swap activity is up this year.
 Source: JP Morgan Research; III Capital Management
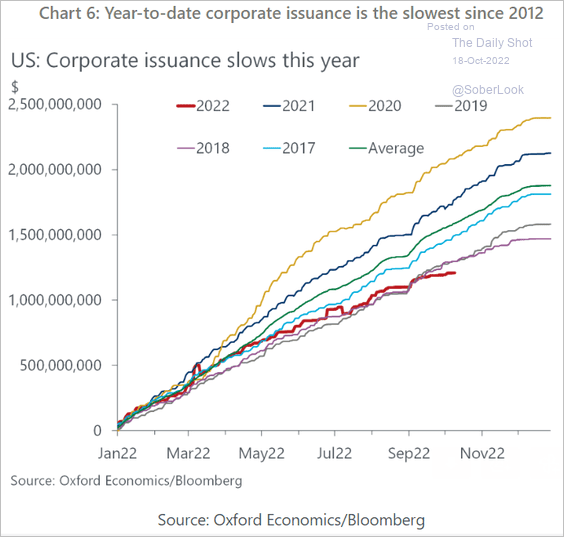
4. This year’s US corporate debt issuance is the slowest since 2012.
 Source: Oxford Economics
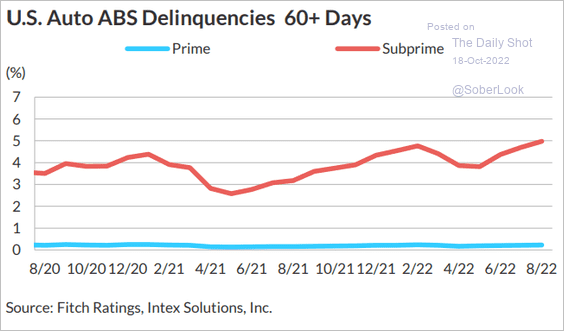
5. US subprime auto delinquencies have been grinding higher.
 Source: Fitch Ratings
Auto dealers are reporting that financing is becoming harder to get for buyers.
 Source: Evercore ISI Research
Back to Index
Rates
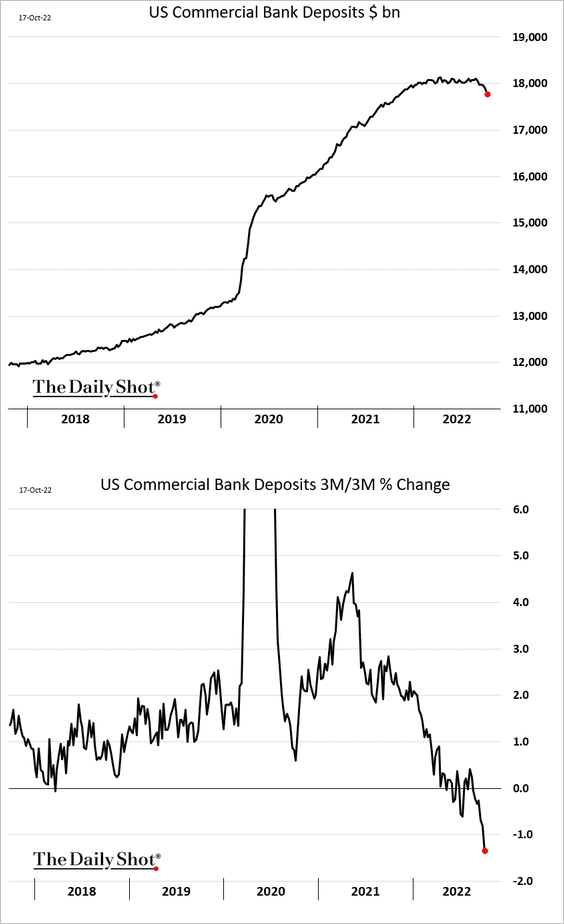
1. Commercial bank deposits have been shrinking. Financial media was quick to suggest that the decline is due to savers finding higher-interest options. That is wrong. Bank deposits are not impacted by depositor behavior and are instead driven by lending activity and the Fed.
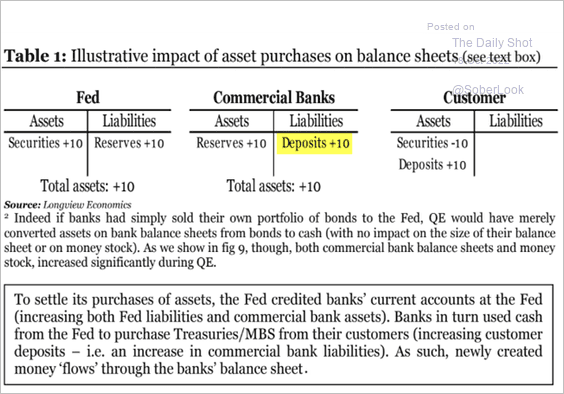
The diagram below illustrates how quantitative easing boosts deposits. We are now witnessing the reversal of this process.
 Source: Longview Economics
——————–
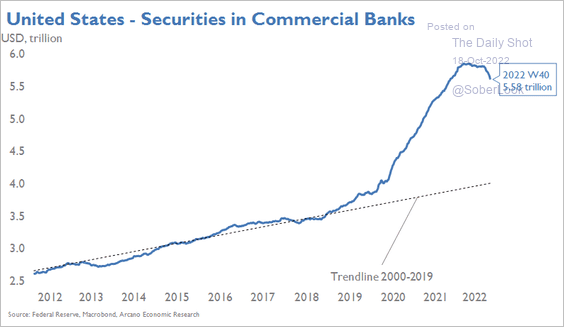
2. Banks’ securities holdings have been moving lower.
 Source: Arcano Economics
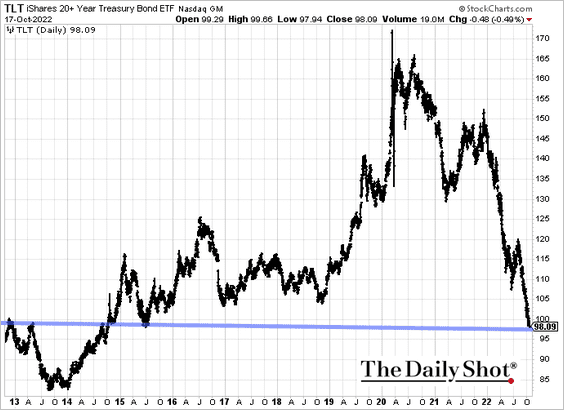
3. The iShares 20+ Year Treasury Bond ETF is at support.
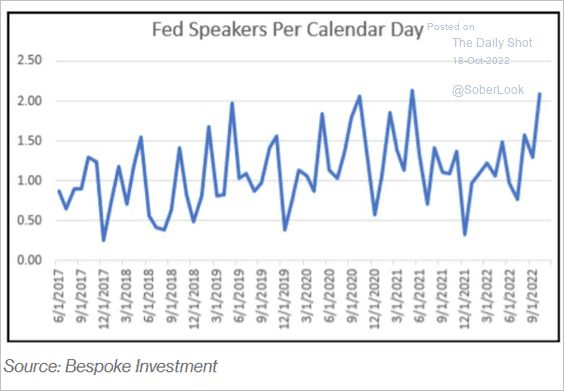
4. Fed officials have been more active in their communications recently.
 Source: @ayeshatariq
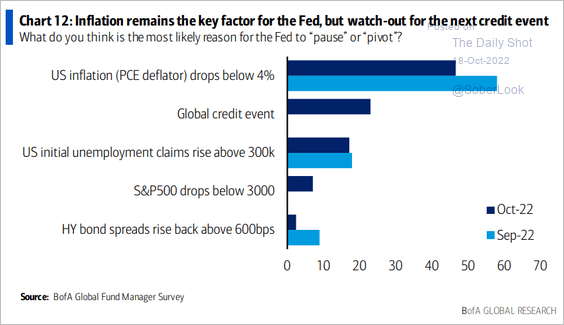
5. What will cause the Fed to pivot?
 Source: BofA Global Research
Back to Index
Global Developments
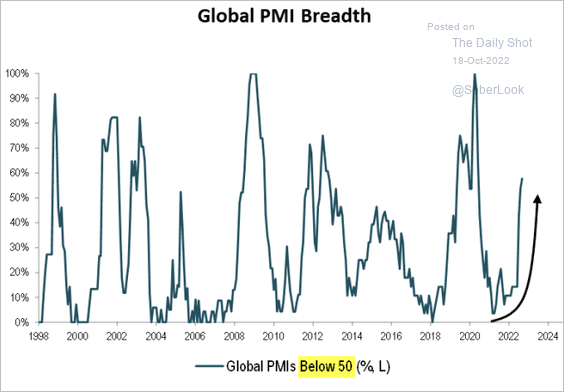
1. Business activity is now contracting in nearly 60% of the world’s economies.
 Source: Piper Sandler
2. Long US dollar is viewed as the most crowded trade.
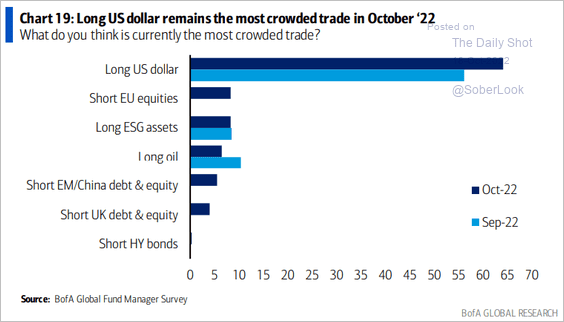 Source: BofA Global Research
3. This chart shows the unemployment rate deviation from pre-COVID levels in select economies.
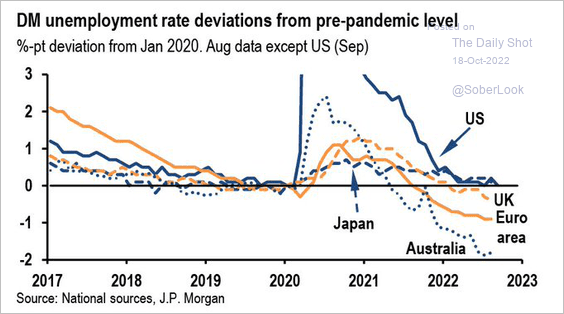 Source: JP Morgan Research; @carlquintanilla
Back to Index
Food for Thought
1. New leases signed for office space in the US:
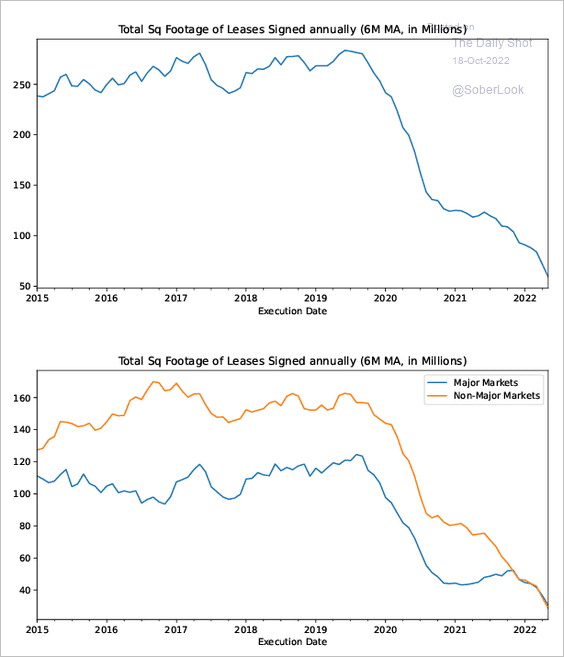 Source: NBER Read full article
2. Reasons people have or don’t have a financial advisor:
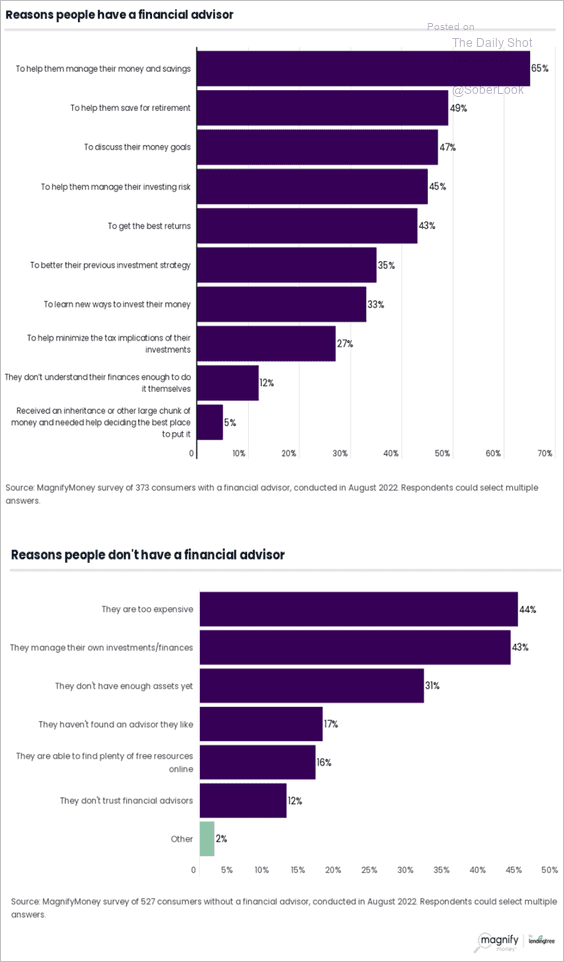 Source: MagnifyMoney Read full article
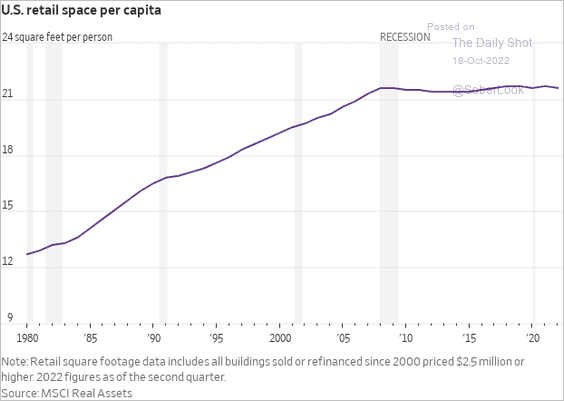
3. Retail space per capita:
 Source: @WSJ Read full article
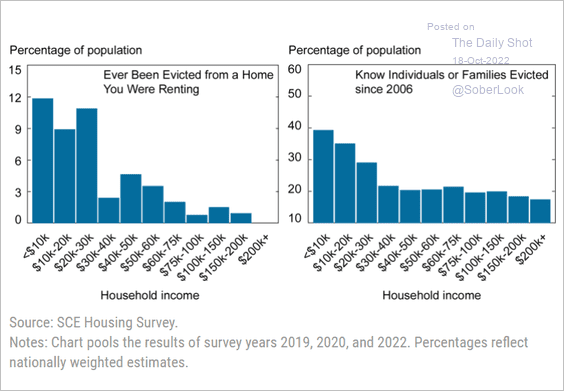
4. Eviction rates by household income:
 Source: Liberty Street Economics Read full article
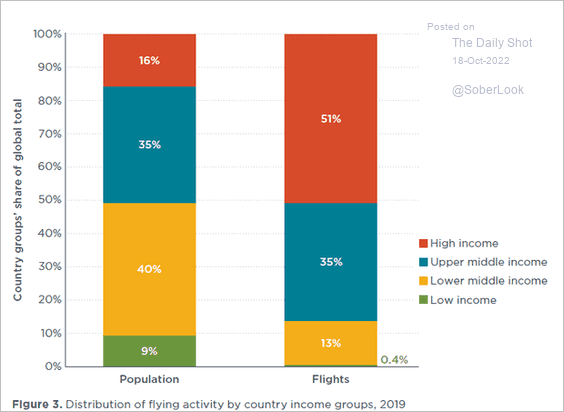
5. Global flying activity by income group:
 Source: @giulio_mattioli
6. The betting markets’ odds on which party will control the Senate:
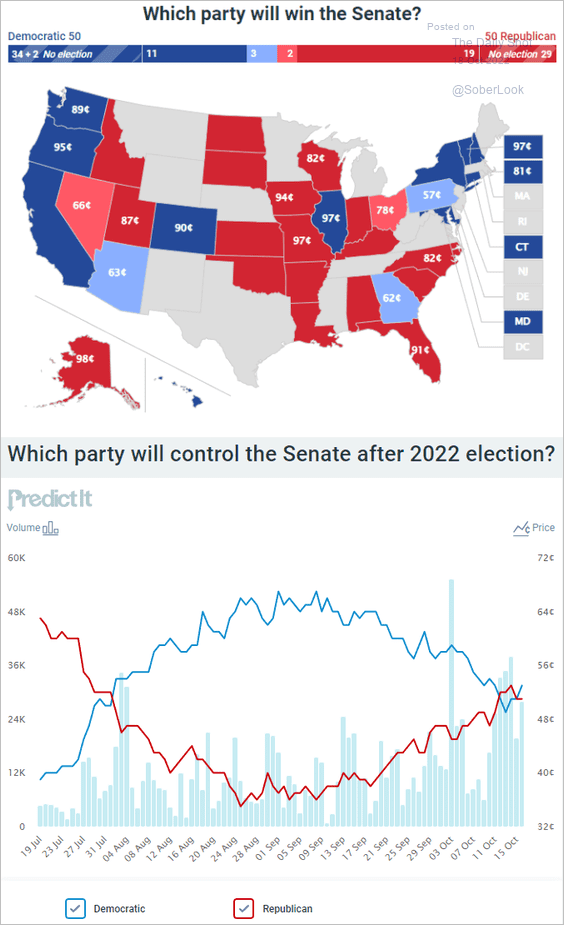 Source: @PredictIt
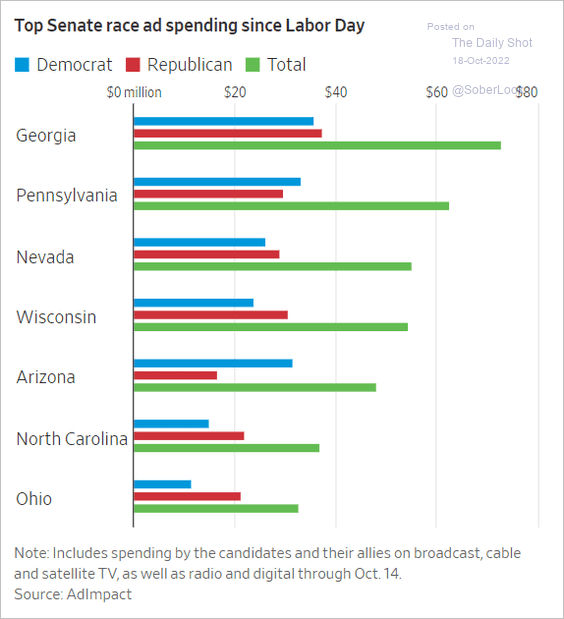
• Senate race ad spending:
 Source: @WSJ Read full article
——————–
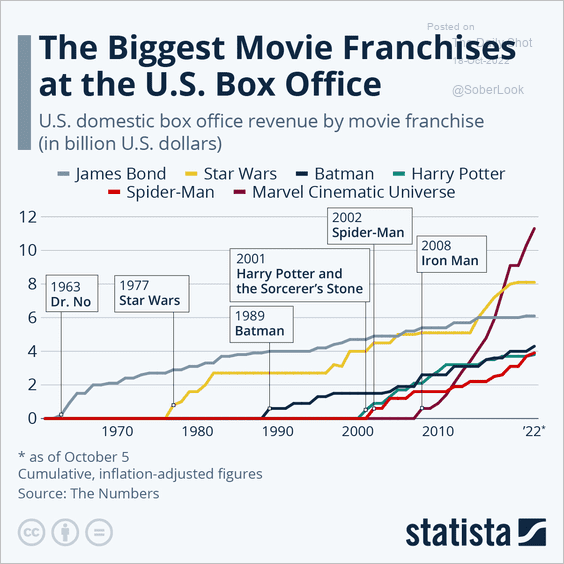
7. Biggest movie franchises:
 Source: Statista
——————–
Back to Index
