
The Daily Shot: 19-Oct-22
• The United States
• Canada
• The United Kingdom
• The Eurozone
• Japan
• China
• Emerging Markets
• Commodities
• Energy
• Equities
• Alternatives
• Rates
• Global Developments
• Food for Thought
The United States
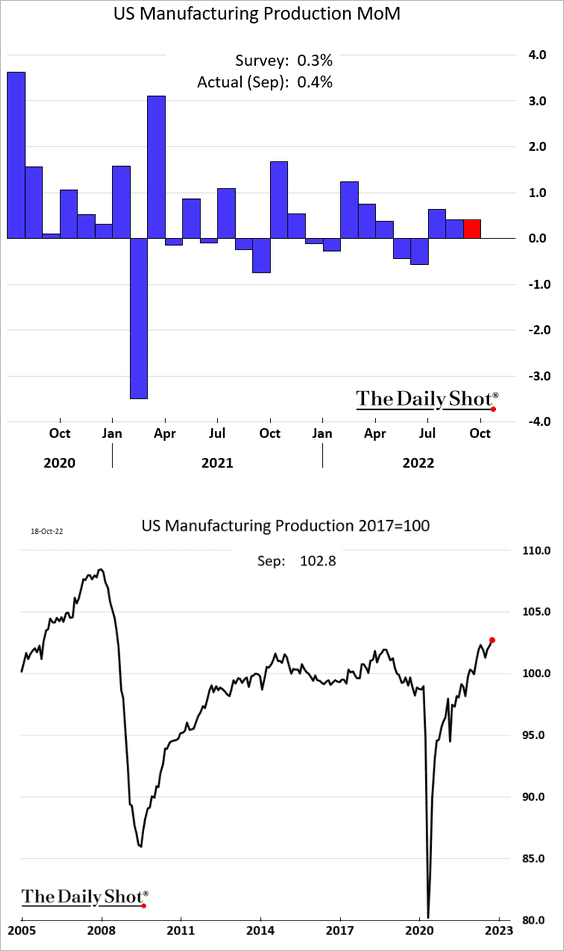
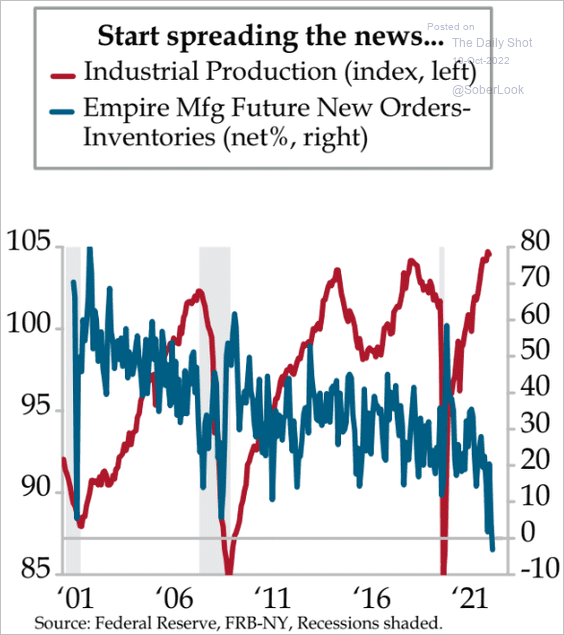
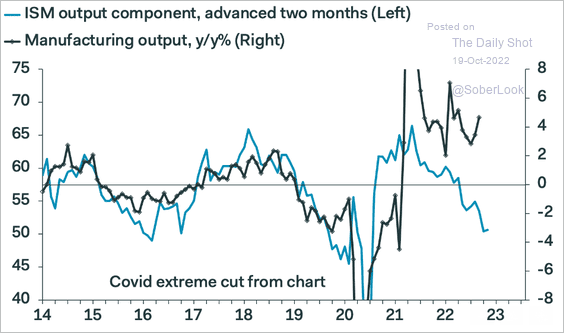
1. Despite persistently soft survey data, US manufacturing output continues to expand at a healthy clip.
• Here is the nation’s industrial production vs. the post-2008 recovery.
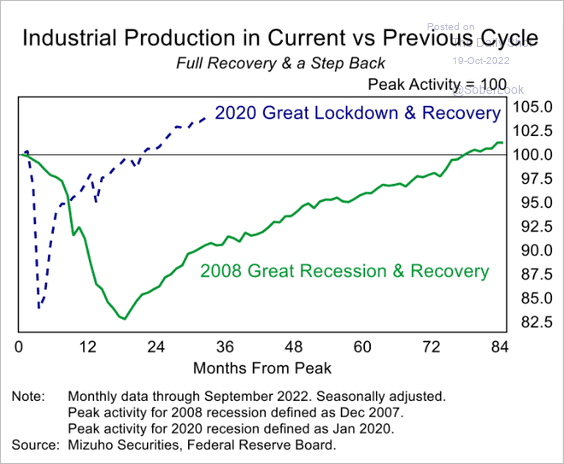 Source: Mizuho Securities USA
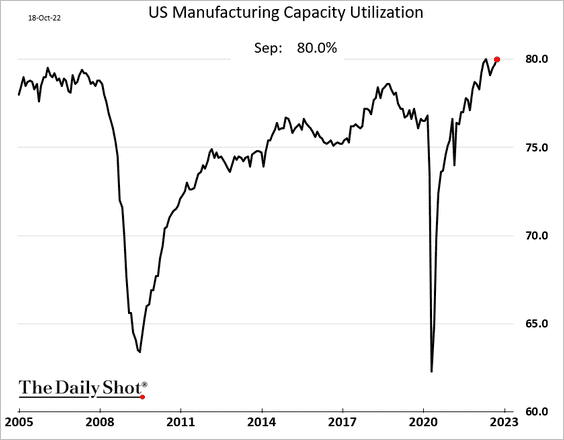
• Capacity utilization is at multi-year highs, which can keep prices and wages elevated.
• But survey-based indicators continue to signal weakness ahead in factory output.
– Empire Manufacturing (NY Fed):
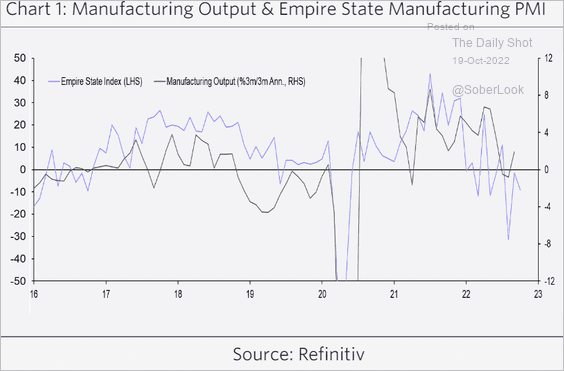 Source: Capital Economics
– Empire Manufacturing expectations of new orders vs. inventories:
 Source: Quill Intelligence
– ISM Manufacturing PMI (the output component):
 Source: Pantheon Macroeconomics
——————–
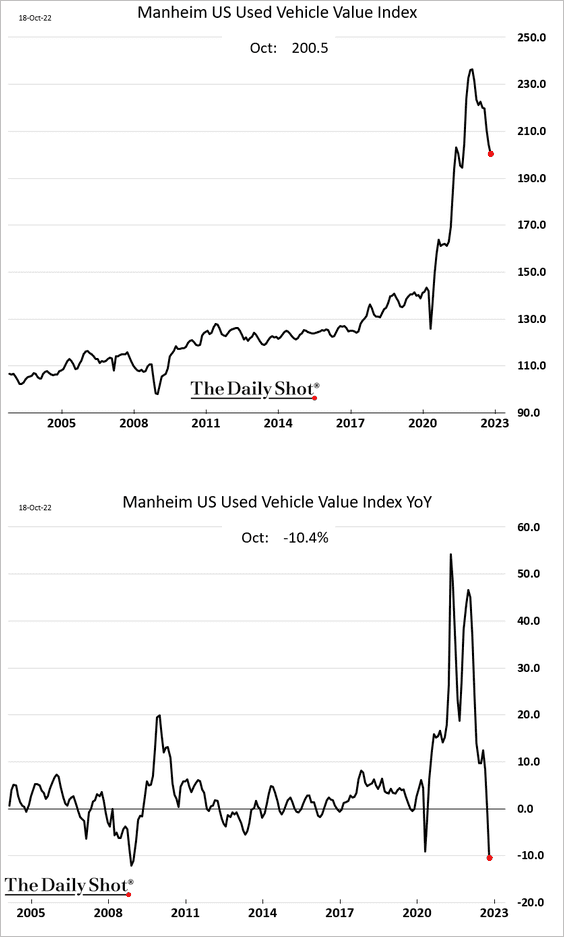
2. Used car prices (wholesale) are now down 10% year-over-year, the biggest decline since the financial crisis.
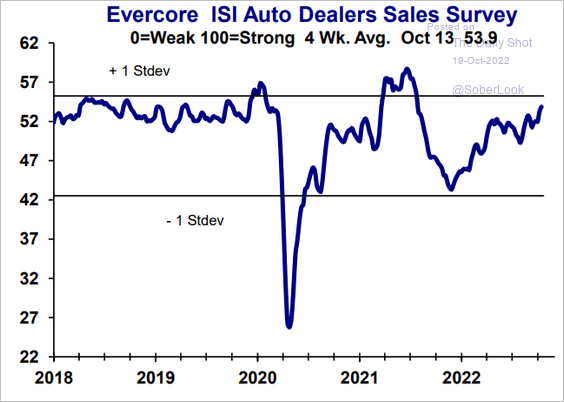
The Evercore ISI auto dealer survey has been surprisingly strong, given the rising inventoy-to-sales ratio.
 Source: Evercore ISI Research
——————–
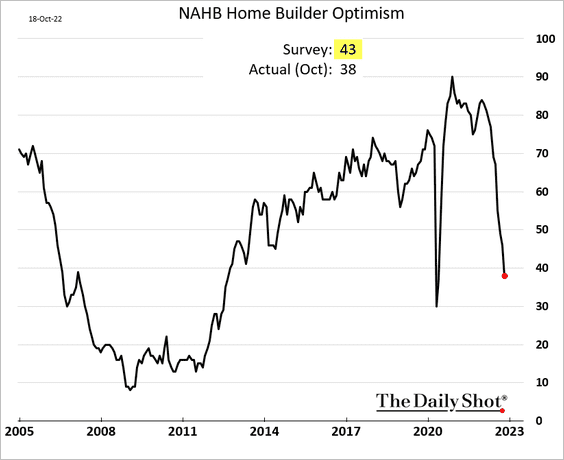
3. Next, we have some updates on the housing market.
• The NAHB homebuilder sentiment continues to deteriorate, with the October figures coming in below consensus.
Here is a similar survey from Evercore ISI.
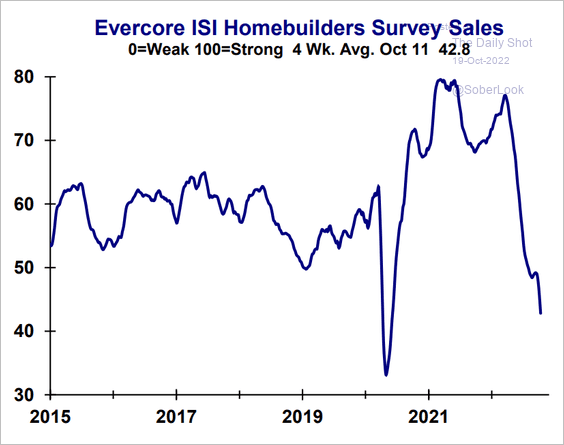 Source: Evercore ISI Research
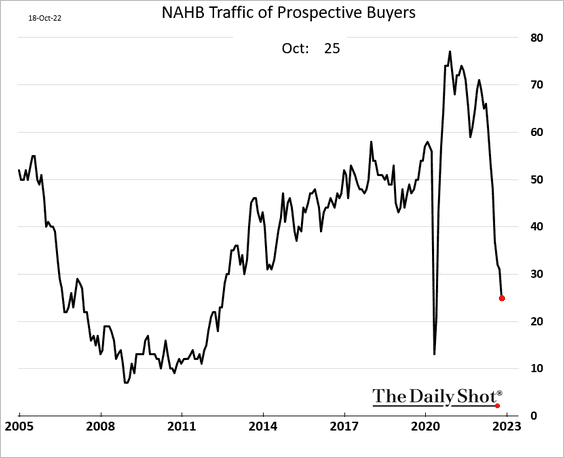
– Traffic of prospective buyers is crashing.
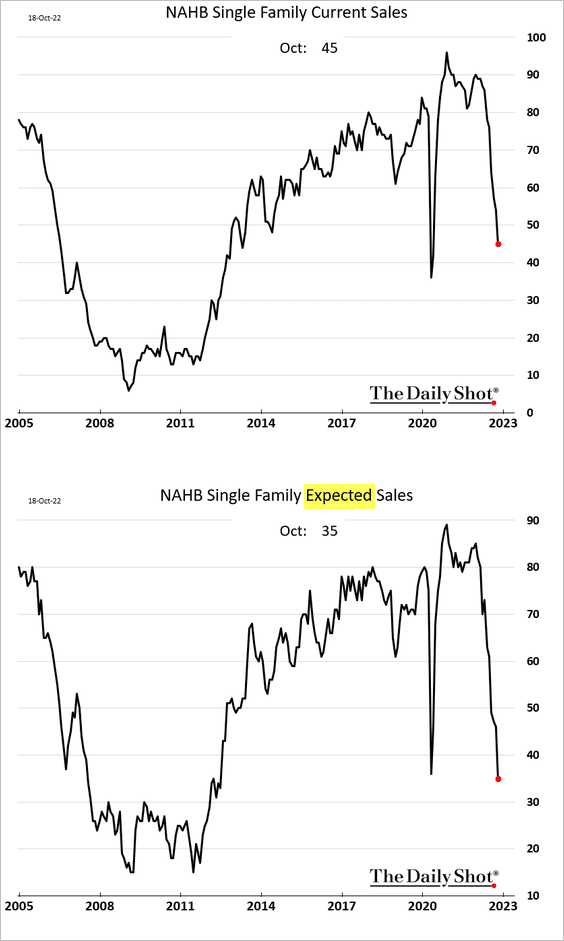
– The expected sales indicator hit the lowest level in a decade.
– What is the NAHB index telling us about residential construction (2 charts) …
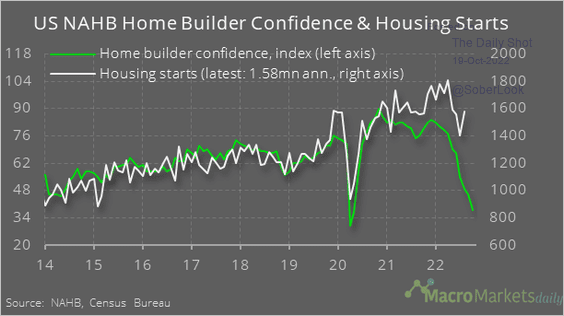 Source: @macro_daily
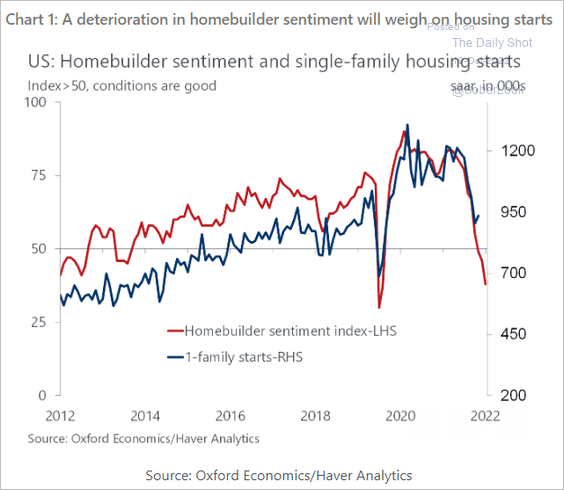 Source: Oxford Economics
… and new home sales?
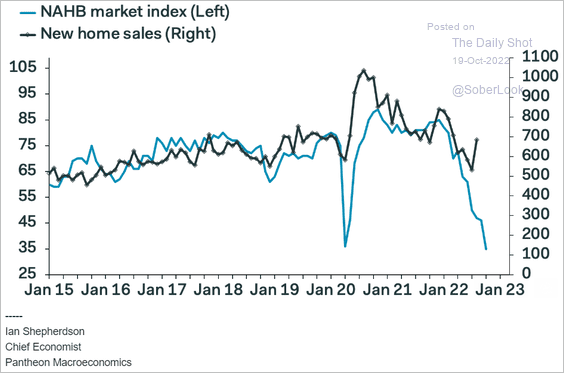 Source: Pantheon Macroeconomics
• Mortgage rates are now the highest in over two decades, …
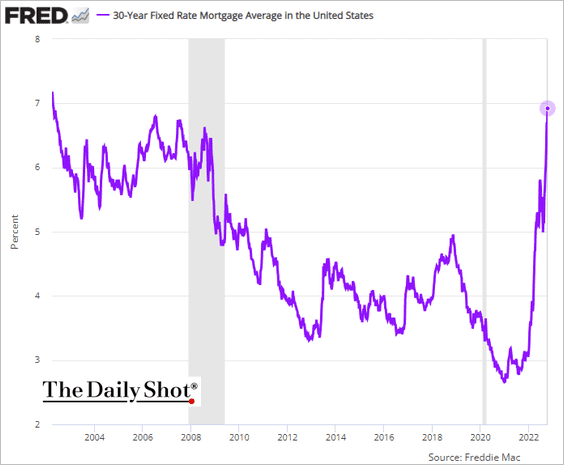
… driven by a surge in Treasury yields as well as spreads.
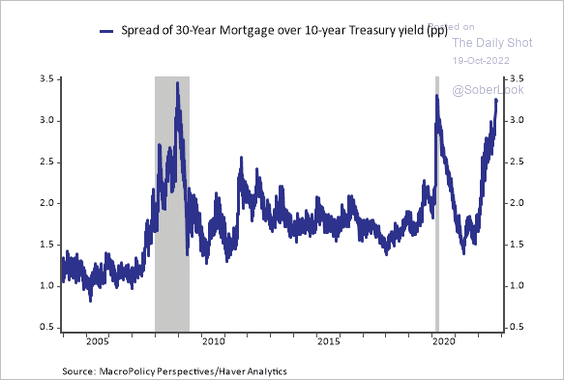 Source: @jc_econ
– The surge in payments on a new mortgage has been unprecedented.
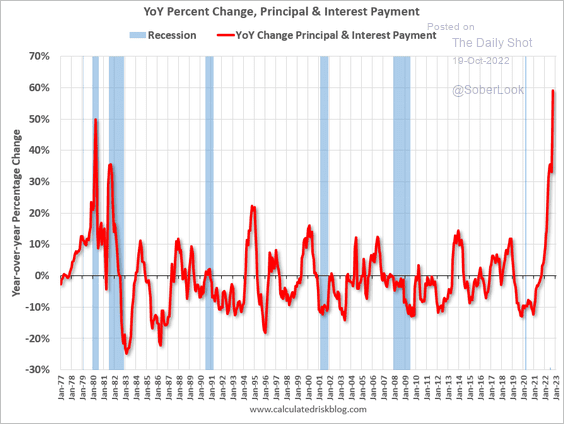 Source: Calculated Risk
– Housing valuations, measured in terms of the mortgage payment-to-income ratio, are hitting extreme levels.
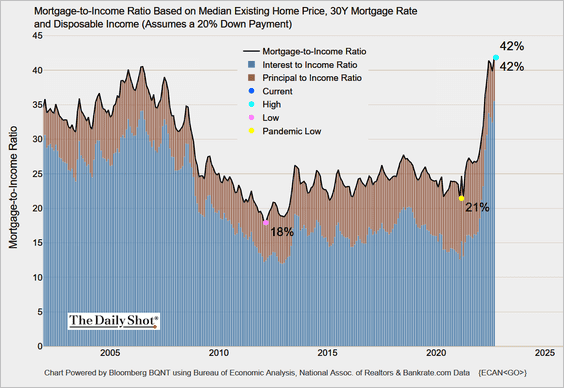 Source: @TheTerminal, Bloomberg Finance L.P.
• Capital Economics expects home prices to drop 8% on a year-over-year basis (year-over-year housing price declines are unusual).
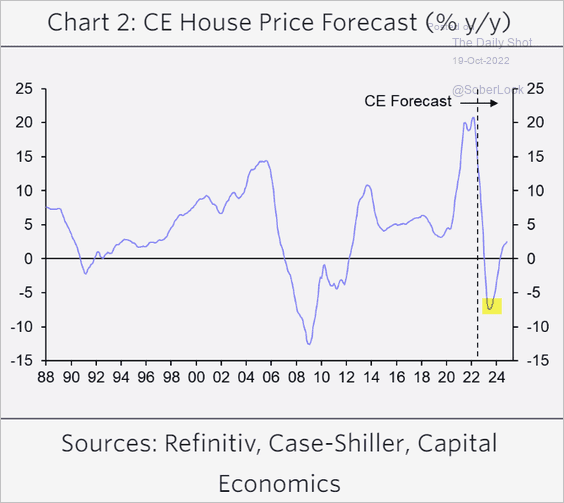 Source: Capital Economics
• Construction of new homes has not kept up with the formation of new households for the past 15 years, limiting the market downside.
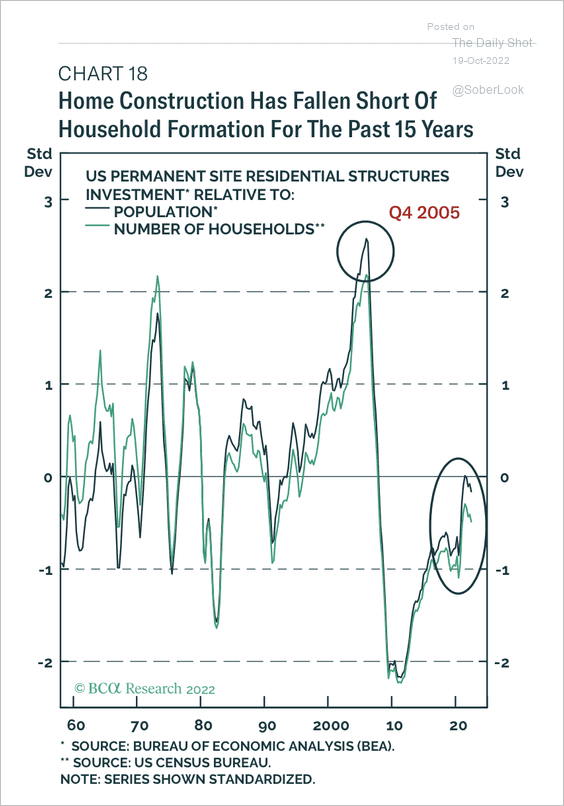 Source: BCA Research
• Pending sales are down 28% from last year, according to Redfin.
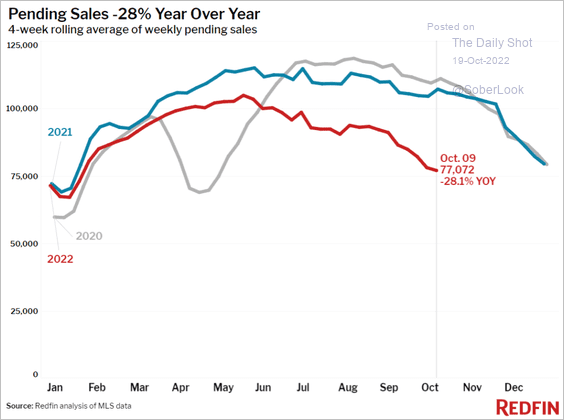 Source: Redfin
• The U. Michigan buying conditions for houses have collapsed.
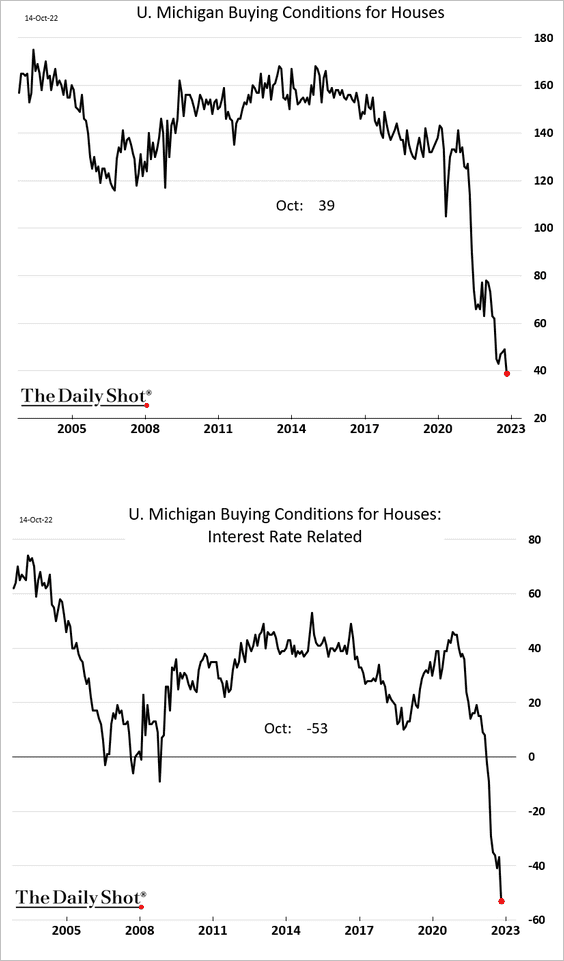
– And selling conditions are also moving lower.
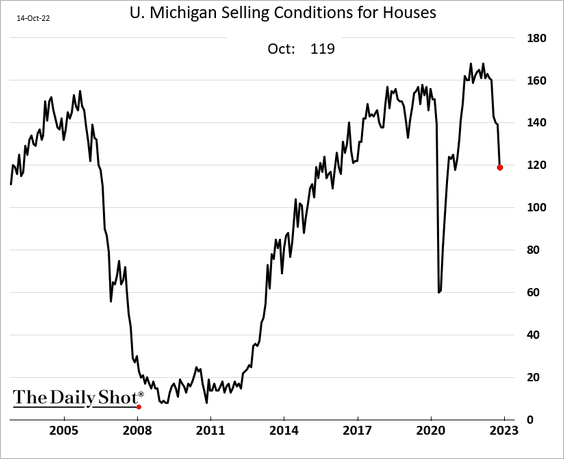
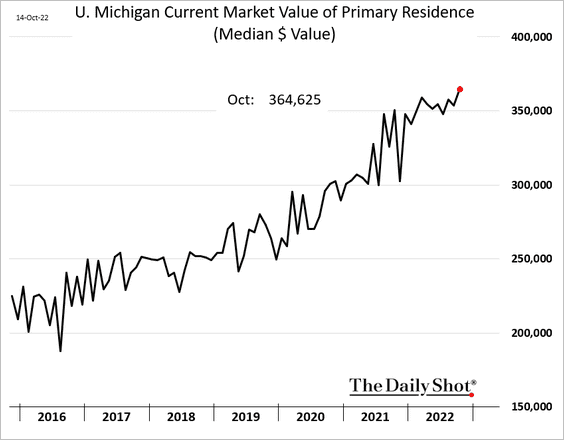
– Nonetheless, when it comes to their own homes, consumers don’t see price declines. Wishful thinking?
——————–
4. More states are seeing decreasing economic activity, although not as severe as in previous recessions.
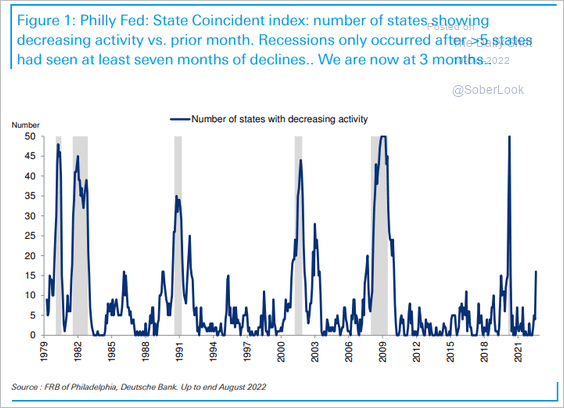 Source: Deutsche Bank Research
5. Holiday hiring among small businesses is down sharply this year.
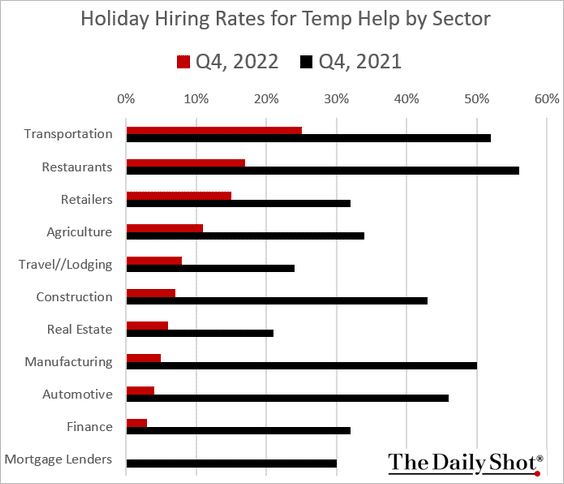 Source: Alignable Read full article
And many small businesses have put permanent hiring on hold.
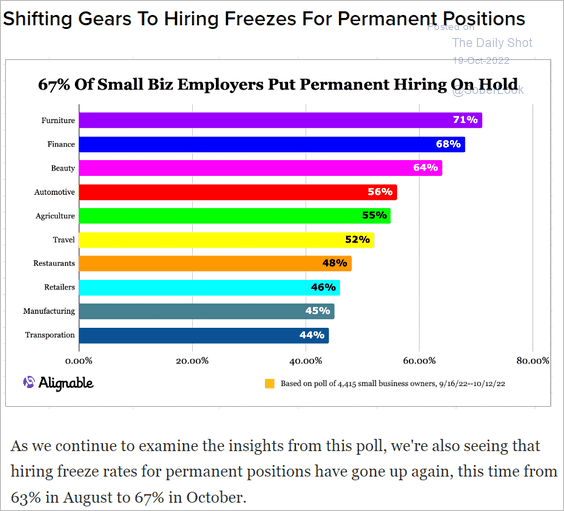 Source: Alignable Read full article
——————–
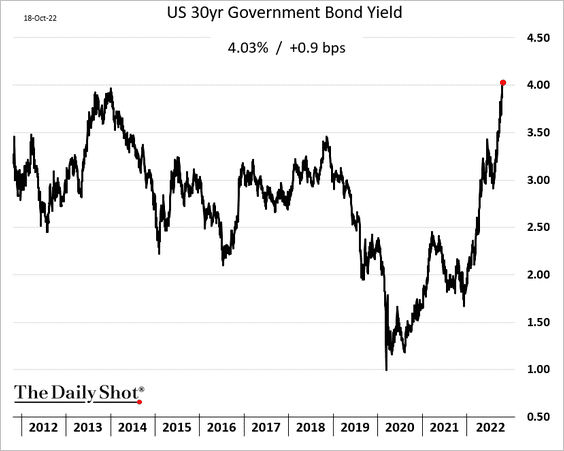
6. The 30-year bond yield continues to move higher.
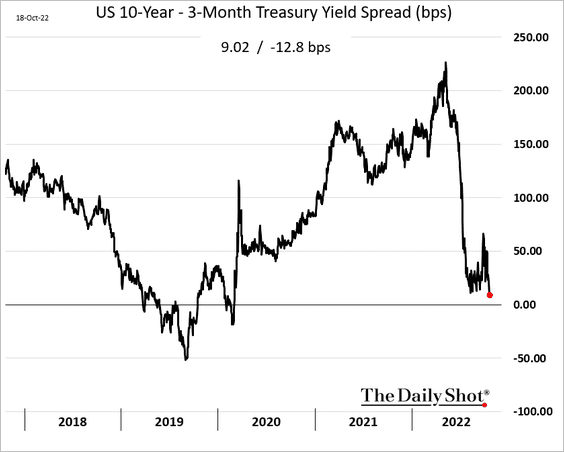
The 10-year/3-month Treasury spread is approaching inversion.
Back to Index
Canada
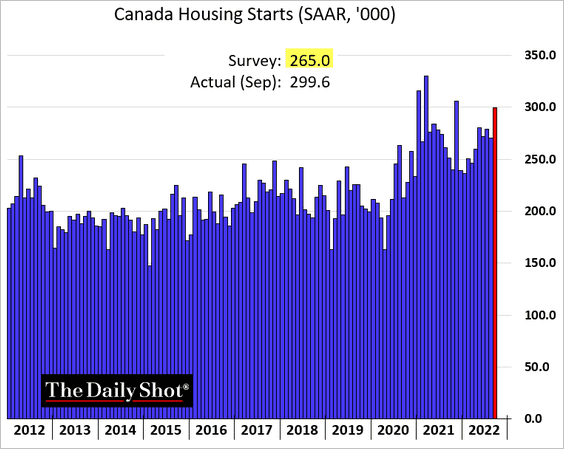
1. Housing starts surprised to the upside.
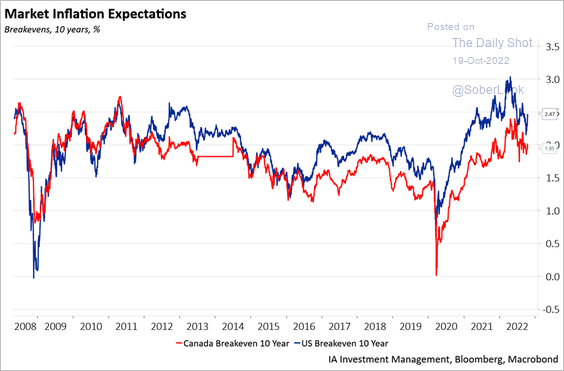
2. Canada’s market-based inflation expectations remain below the levels we see in the US.
 Source: Industrial Alliance Investment Management
3. Deteriorating business sentiment points to falling CapEx next year.
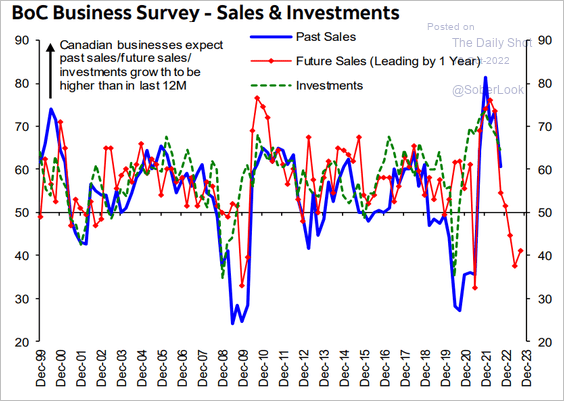 Source: Hugo Ste-Marie, Portfolio & Quantitative Strategy Global Equity Research, Scotia Capital
Back to Index
The United Kingdom
1. According to Pantheon Macroeconomics, the government still needs to find annual savings of about £40bn to place the fiscal trajectory on a sustainable path.
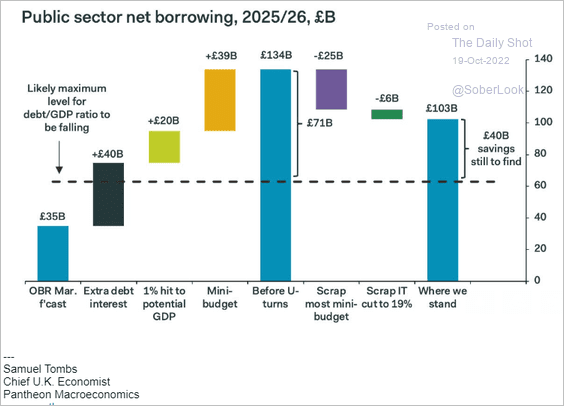 Source: Pantheon Macroeconomics
2. The pullback in energy price guarantees …
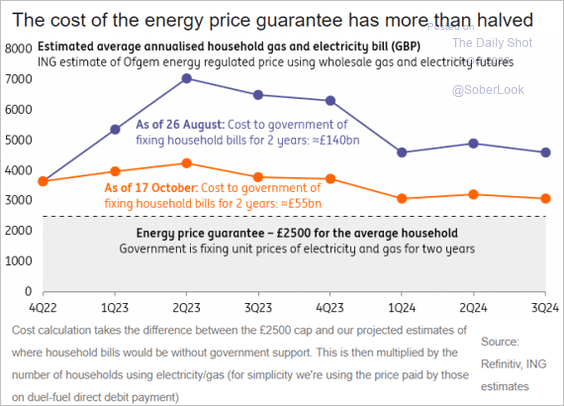 Source: ING
… will boost inflationary pressures.
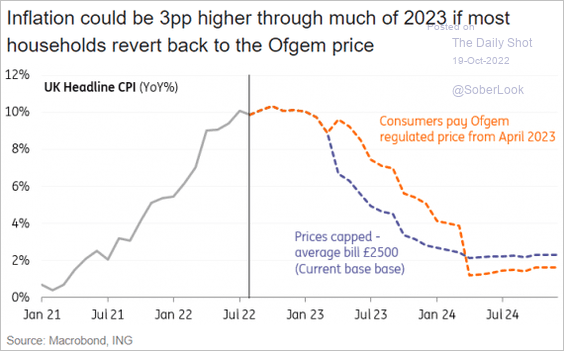 Source: ING
——————–
3. Government approval ratings have collapsed.
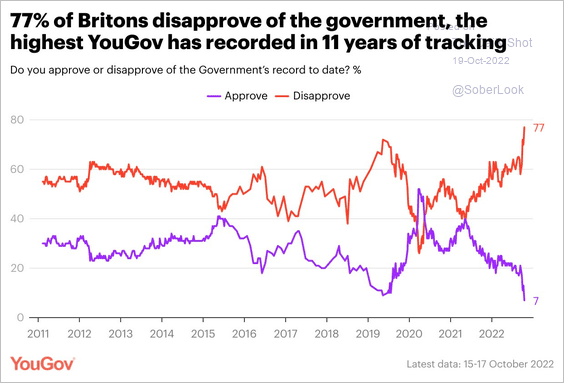 Source: @YouGov Read full article
Back to Index
The Eurozone
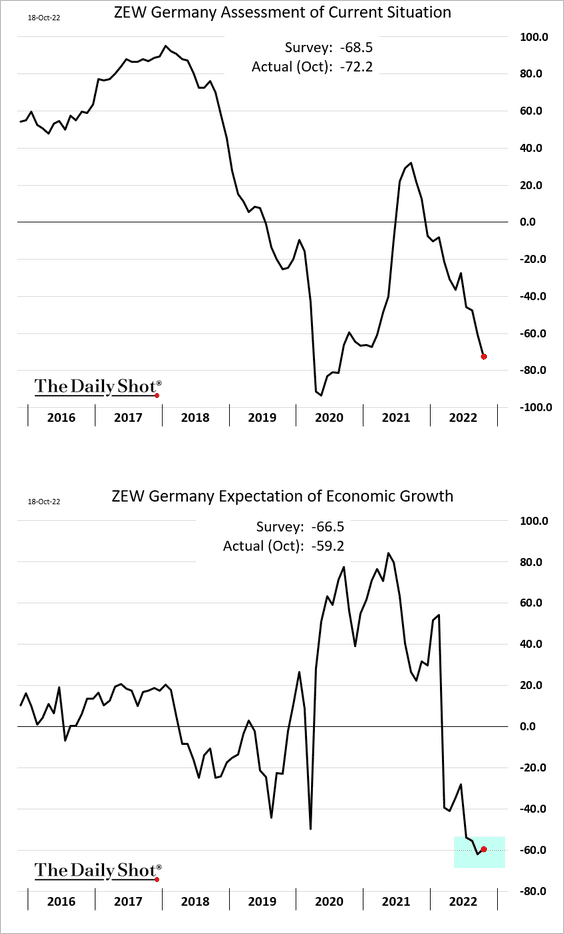
1. Germany’s ZEW expectations ticked higher but remain depressed.
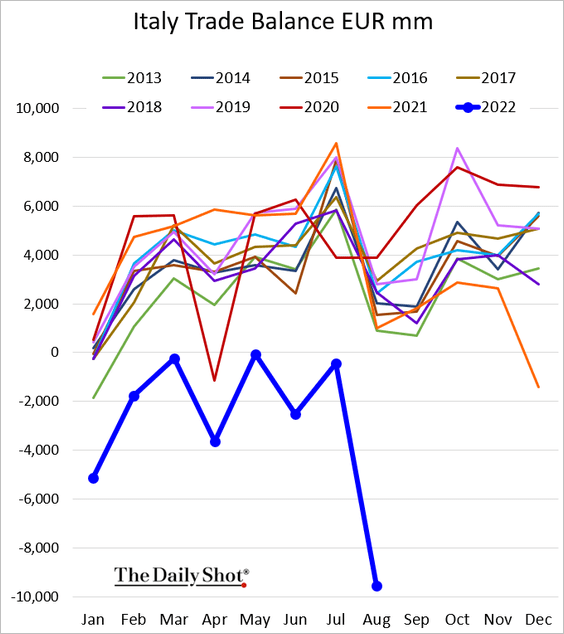
2. Italy’s trade deficit hit extreme levels.
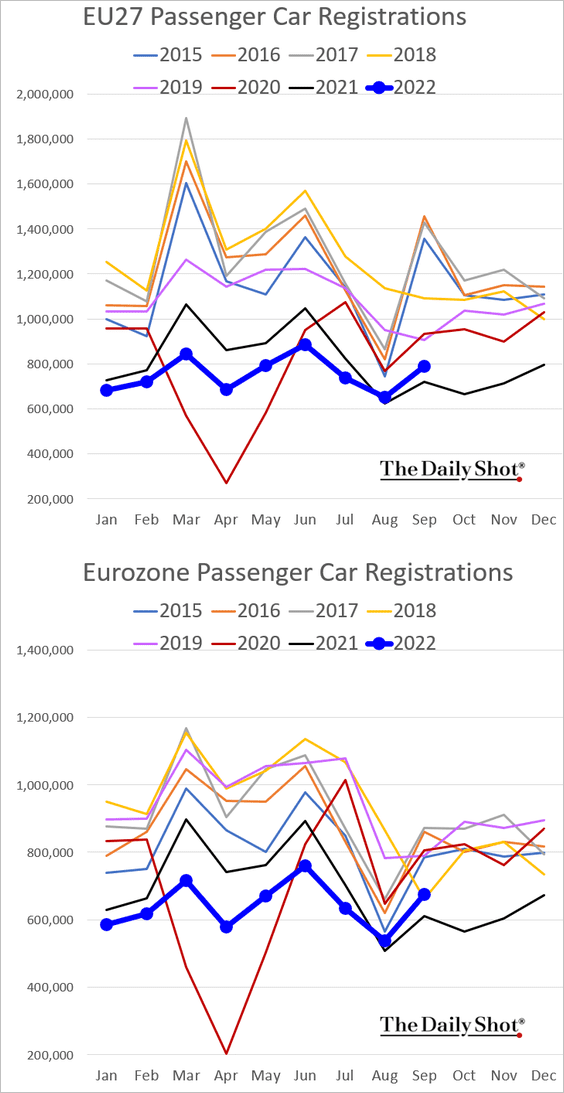
3. Car registrations have finally moved above last year’s level (which is not a great benchmark).
4. EUR/USD should be higher, given the rate differential.
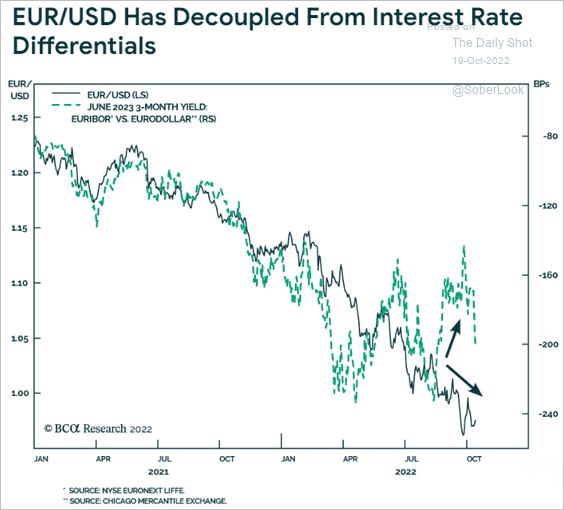 Source: BCA Research
Back to Index
Japan
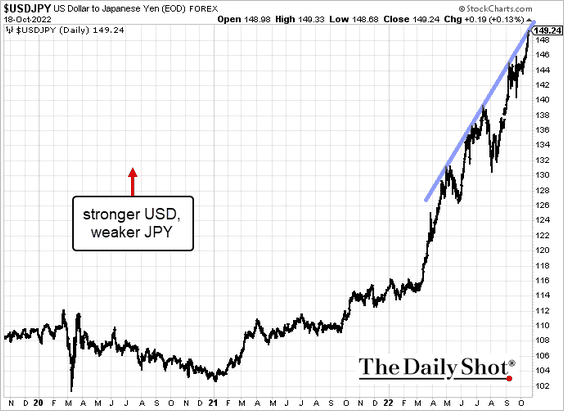
1. Dolar-yen is above 149 and is headed for 150.
2. Weak yen makes it challenging for Japan to participate in easing supply pressures.
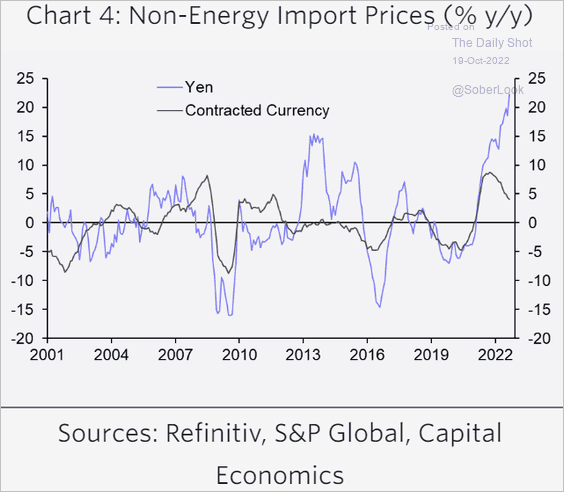 Source: Capital Economics
3. The core CPI will rise above 2%, according to Capital Economics.
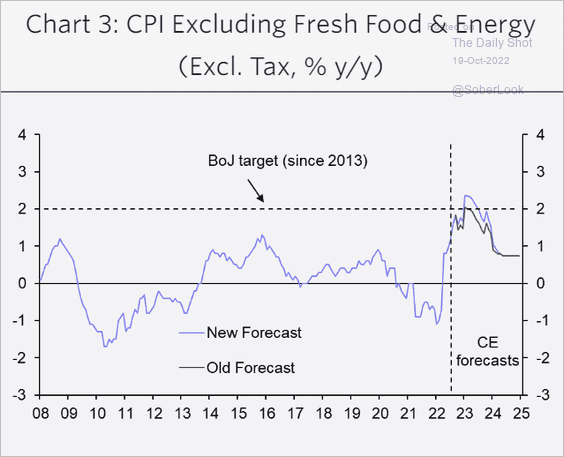 Source: Capital Economics
Back to Index
China
1. China delayed the release of the Q3 GDP report. The authorities apparently need time to “massage” the figures – not a good sign.
 Source: Reuters Read full article
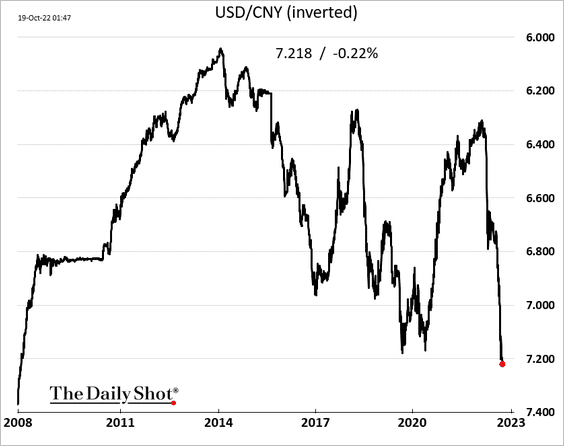
2. The renminbi hit the lowest level vs. USD since 2008.
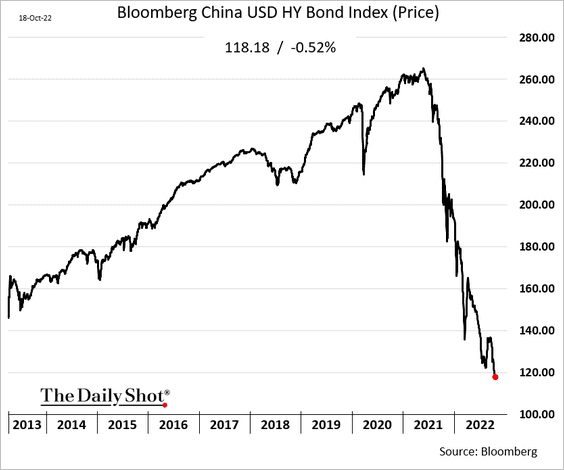
3. Dollar-denominated HY bond prices continue to sink as the property developer debt crisis persists.
4. Security, self-sufficiency, and socialism are in; economic growth and market reforms are out.
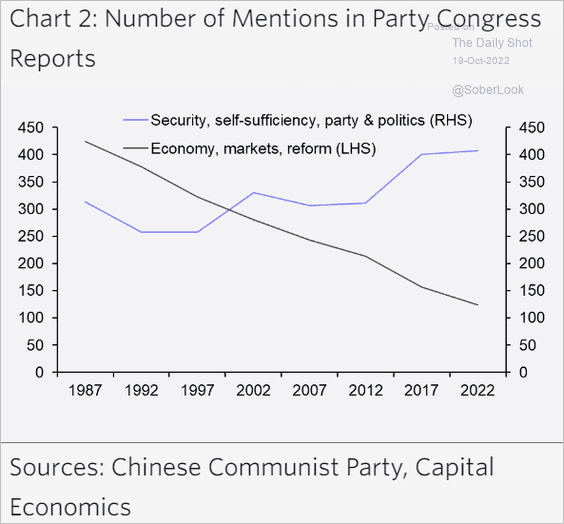 Source: Capital Economics
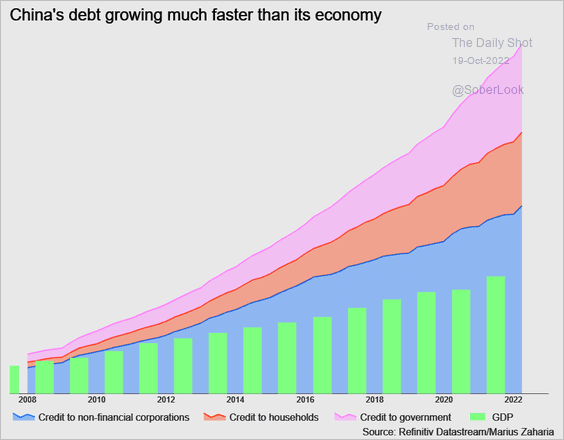
5. Debt has been growing much faster than GDP.
 Source: Reuters Read full article
Back to Index
Emerging Markets
1. 26% of constituents in the Bloomberg EM USD bond index are trading at distressed spread levels, up from about 5% prior to the pandemic.
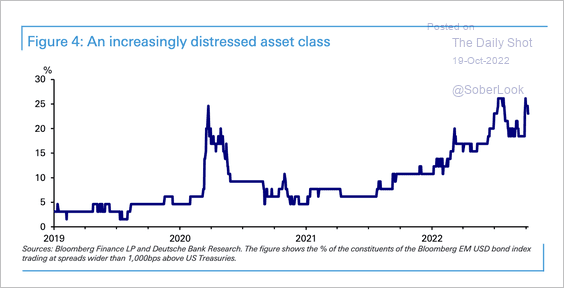 Source: Deutsche Bank Research
2. EM equities are expected to outperform.
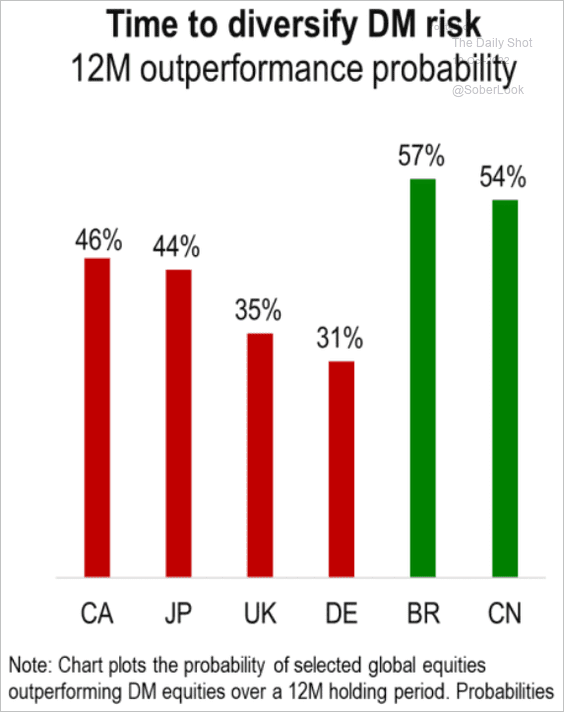 Source: Numera Analytics
3. This chart shows the expected policy rate trajectories from Morgan Stanley.
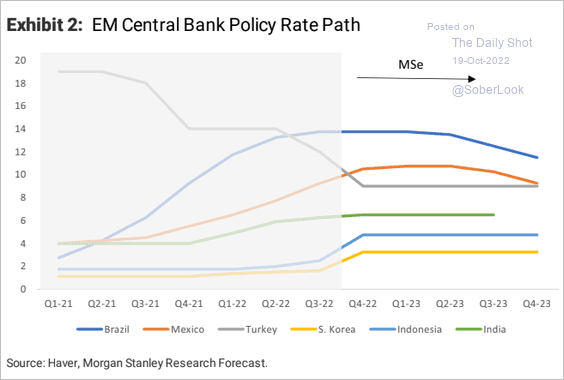 Source: Morgan Stanley Research
4. Polls have tightened sharply in Brazil, but Lula is still the likely winner. The campaign rhetoric has become increasingly nasty.
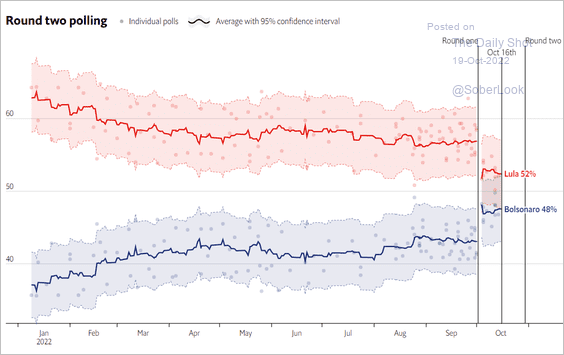 Source: The Economist Read full article
Here is what we see in the betting markets.
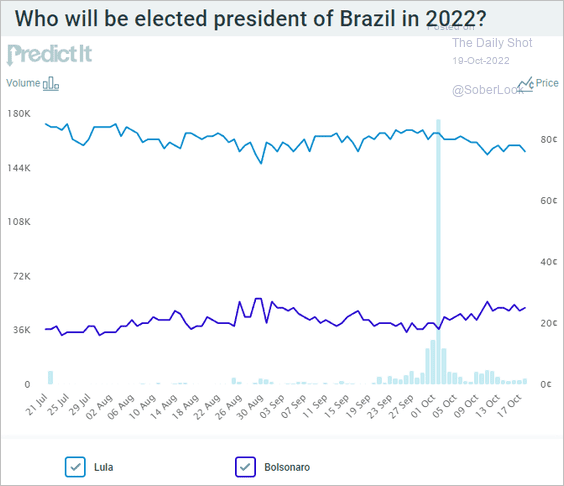 Source: @PredictIt
——————–
5. The Vietnamese dong drawdown vs. USD has accelerated.
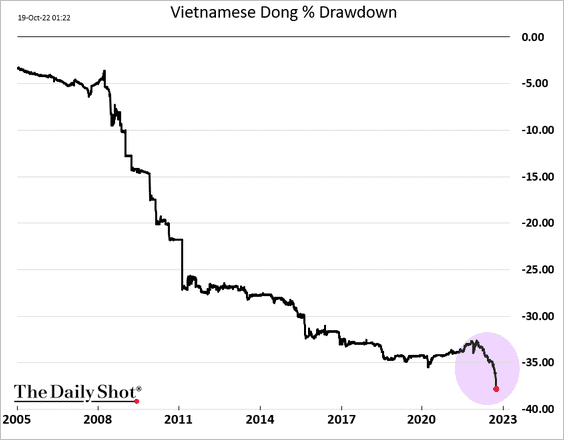
 Source: Bloomberg Read full article
——————–
6. Russia’s current account surplus will hit a record this year.
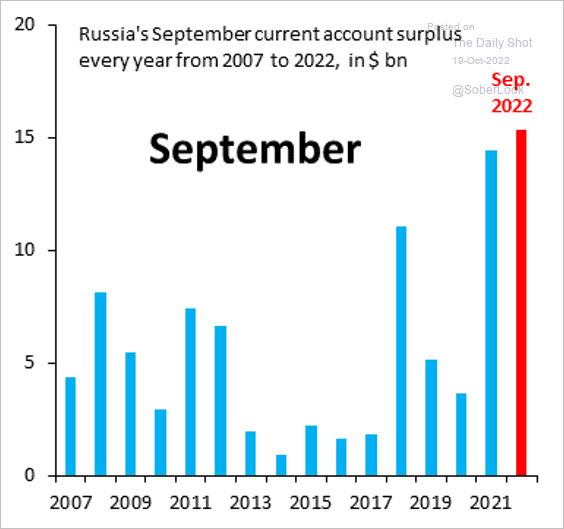 Source: @RobinBrooksIIF
7. Next, we have some data on China’s Belt & Road initiative.
• Most indebted countries:
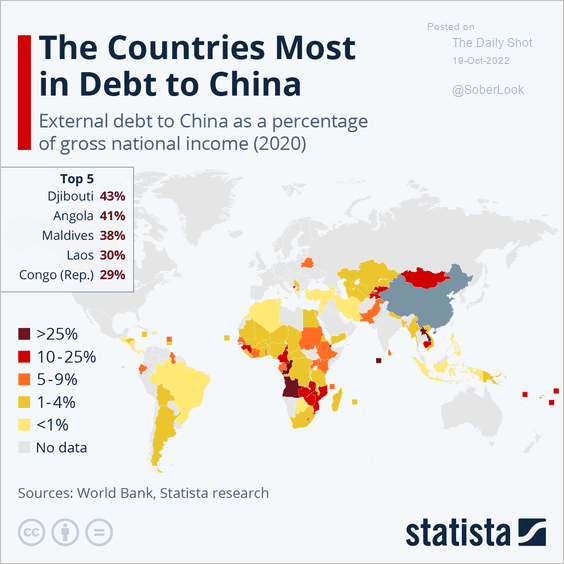 Source: Statista
• Loans to Africa:
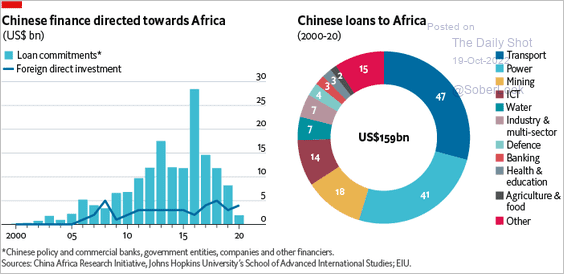 Source: The Economist Read full article
• Emergency loans:
 Source: @financialtimes Read full article
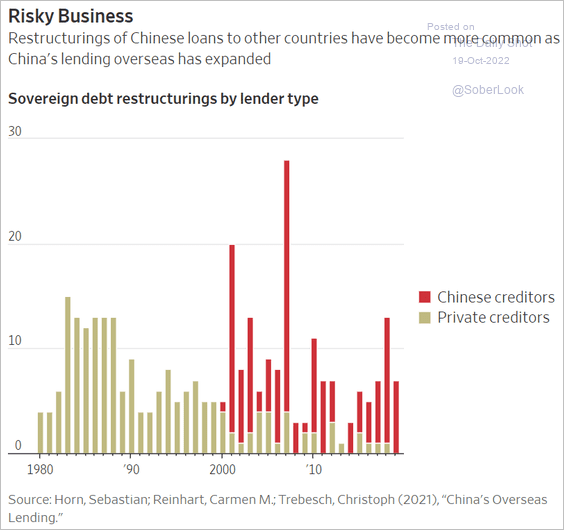
• Debt restructuring (2 charts):
 Source: @adam_tooze, The Economist Read full article
 Source: @WSJ Read full article
Back to Index
Commodities
1. The rebound in copper prices has faded.
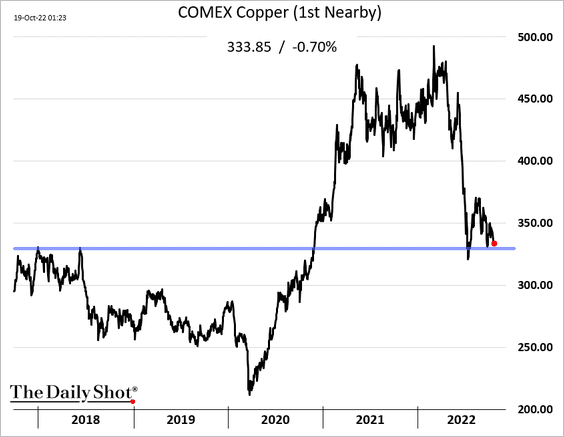
 Source: mining.com Read full article
——————–
2. Some commodity inventories remain below pre-COVID levels.
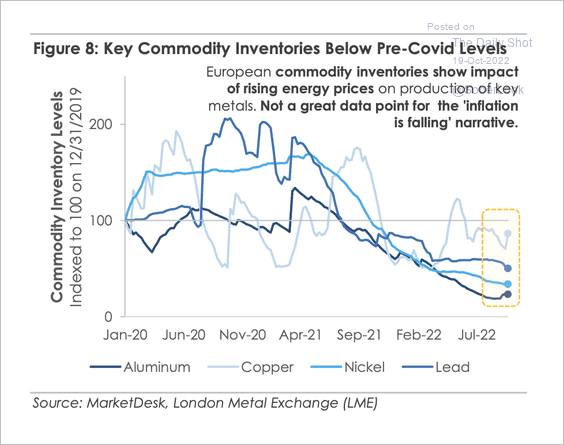 Source: MarketDesk Research
3. US orange juice prices are surging.
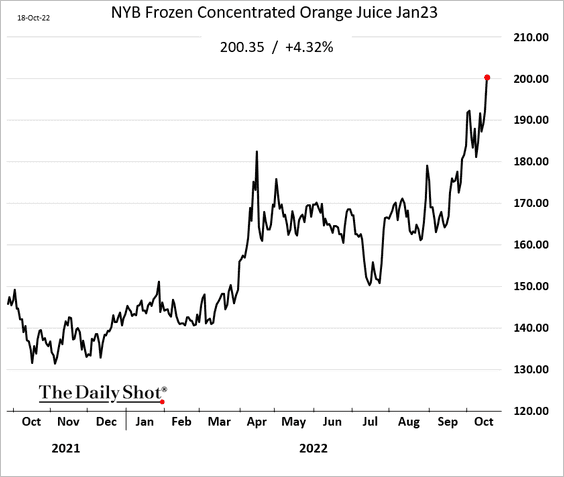
 Source: @WSJ Read full article
Back to Index
Energy
1. US diesel crack spreads have exploded amid shortages.
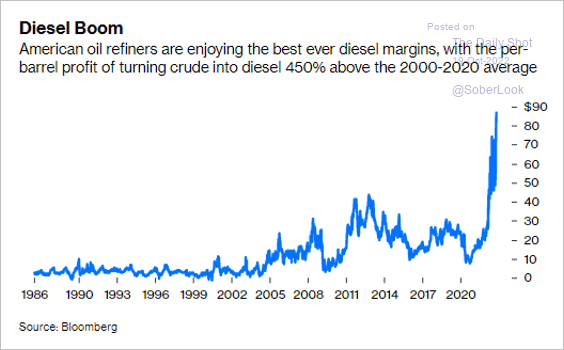 Source: @JavierBlas Read full article
2. Disruptions to Russian oil output have been milder than expected.
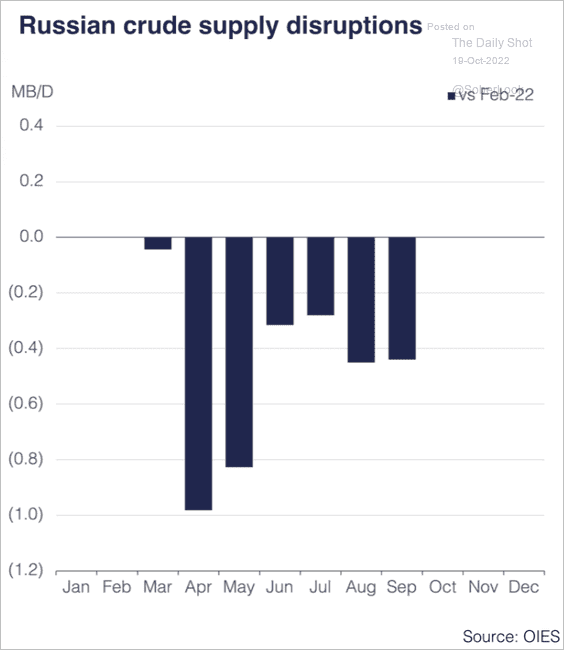 Source: Oxford Institute for Energy Studies
Here are the nation’s exports by destination.
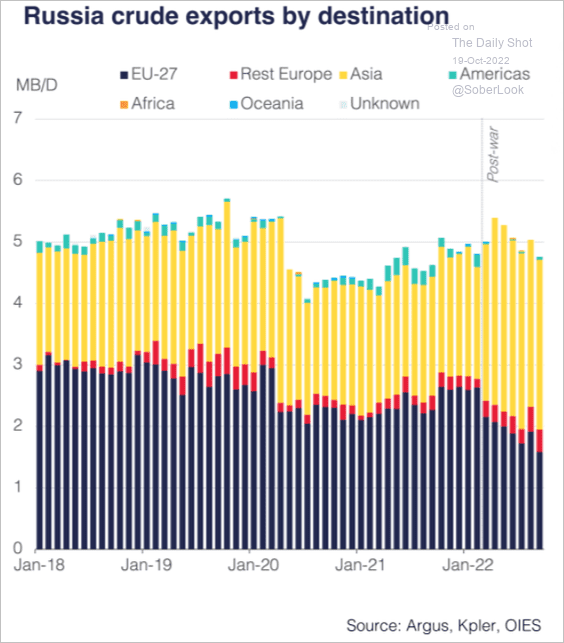 Source: Oxford Institute for Energy Studies
——————–
3. Next, we have upside and downside risks to the OIES oil price forecast.
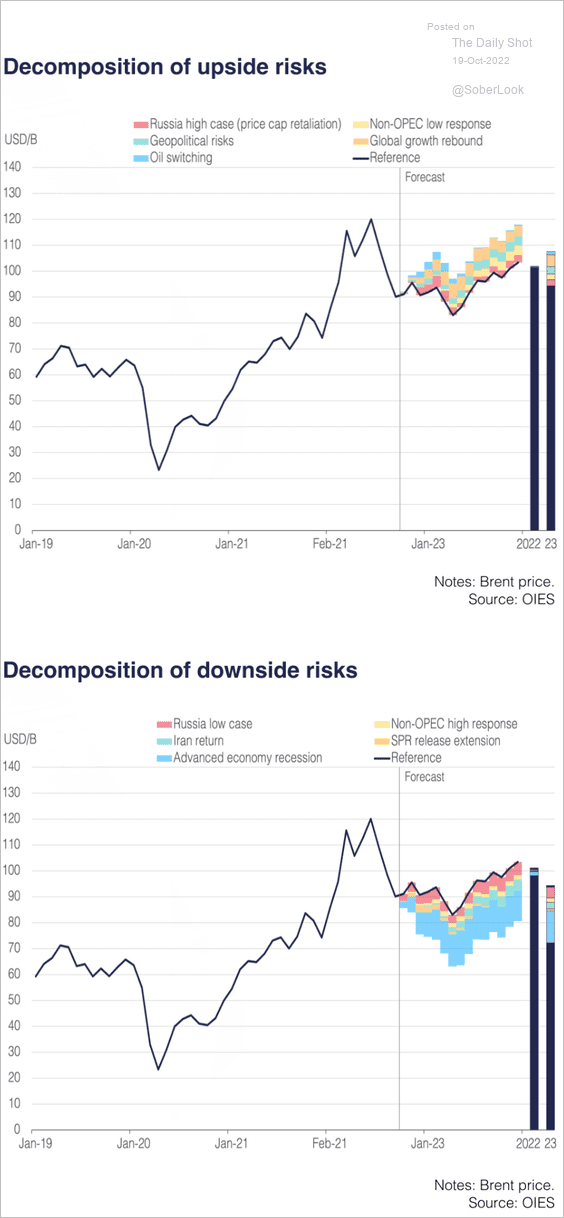 Source: Oxford Institute for Energy Studies
4. This chart shows Europe’s sources of natural gas.
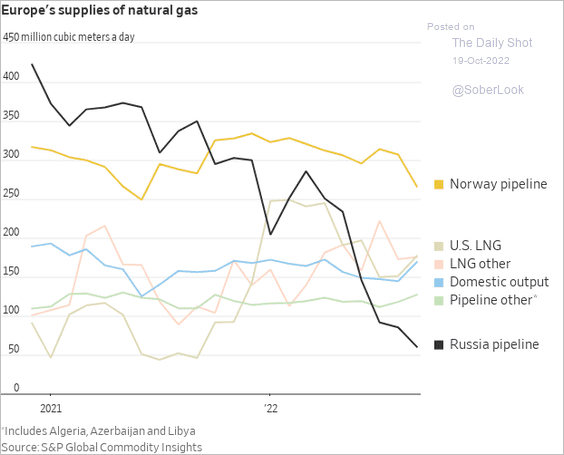 Source: @WSJ Read full article
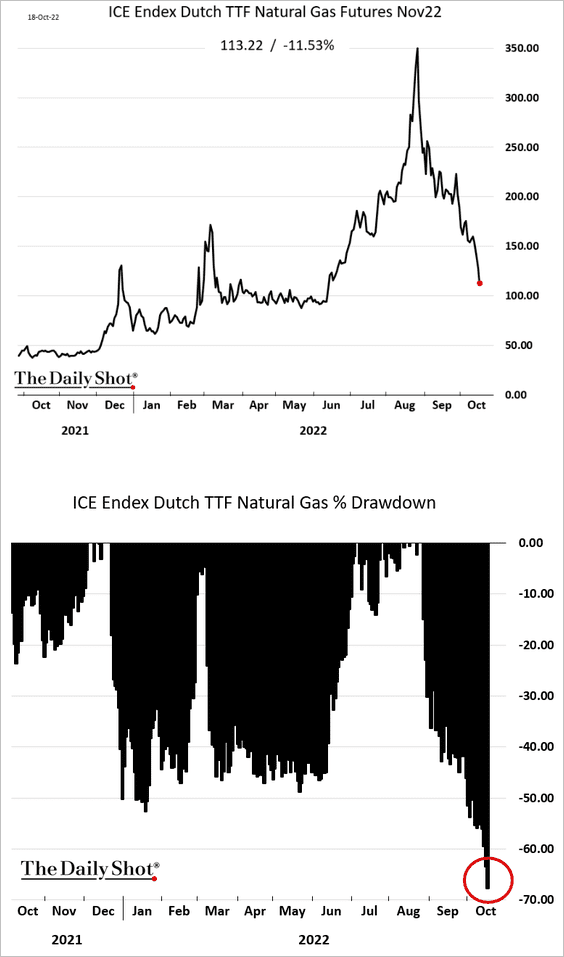
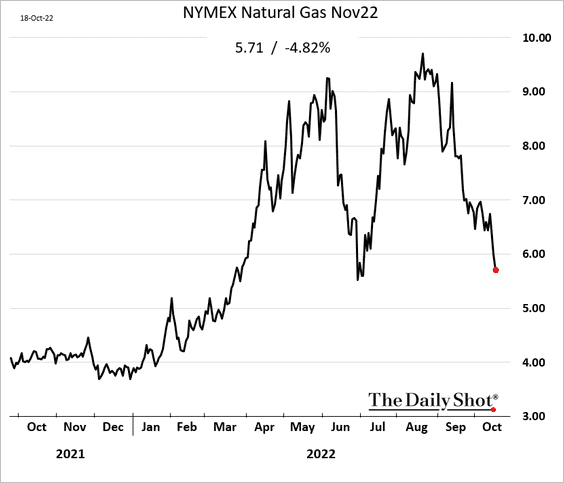
The good news is that natural gas futures are down nearly 70% from the peak.
——————–
5. US natural gas futures are back below $6.0/MMBtu.
Back to Index
Equities
1. Extreme bearish sentiment continues to indicate a bounce.
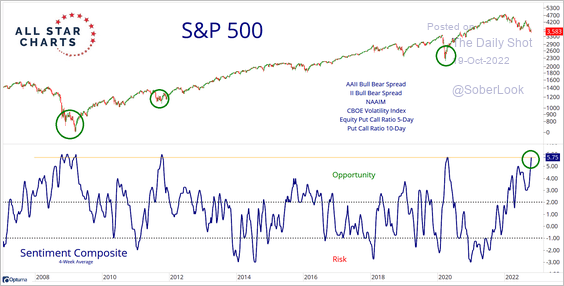 Source: @allstarcharts
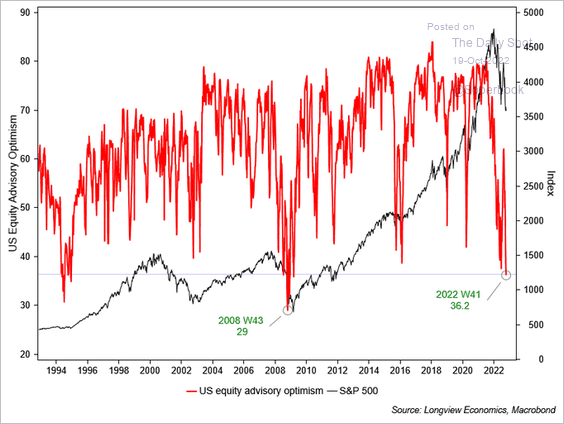 Source: Longview Economics
A tactical bounce? Fundamentals and macro developments continue to pose risks for a sustained rally.
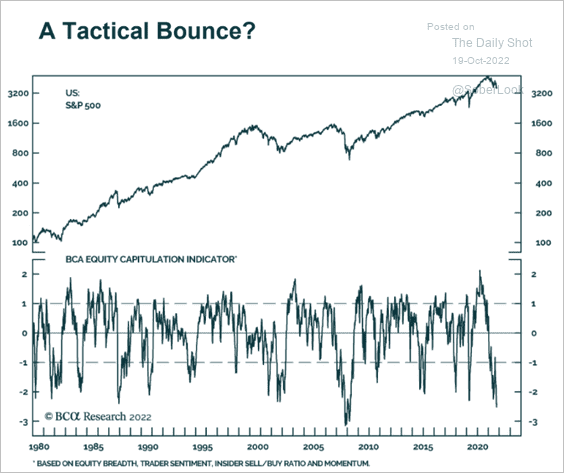 Source: BCA Research
——————–
2. Profitable companies are cheap on an EV-to-sales basis (EV = enterprise value).
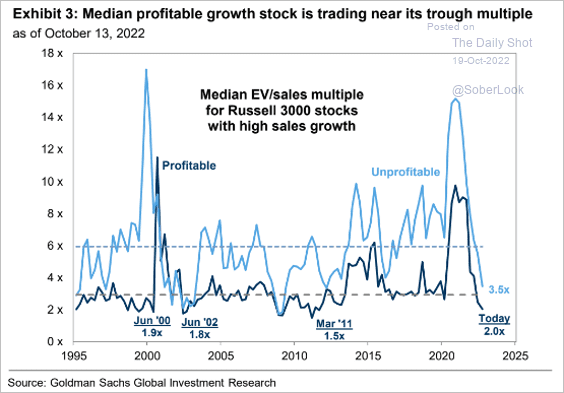 Source: Goldman Sachs; @MikeZaccardi
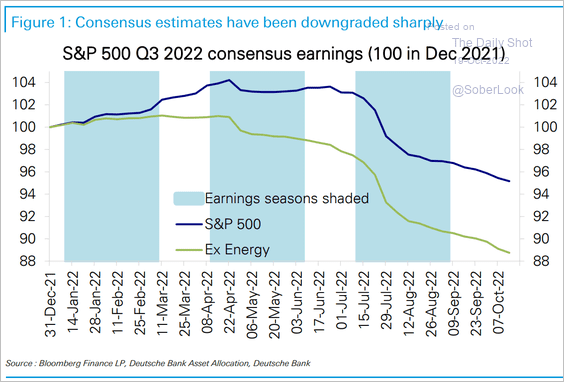
3. Beating Q3 earnings forecasts shouldn’t be overly challenging.
 Source: Deutsche Bank Research
4. Liquidity conditions have deteriorated.
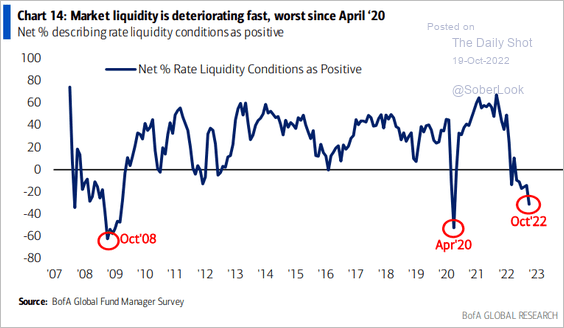 Source: BofA Global Research
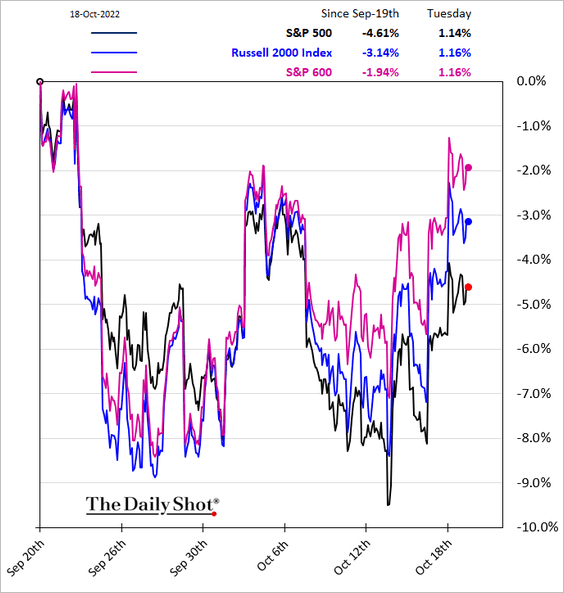
5. Small caps continue to outperform.
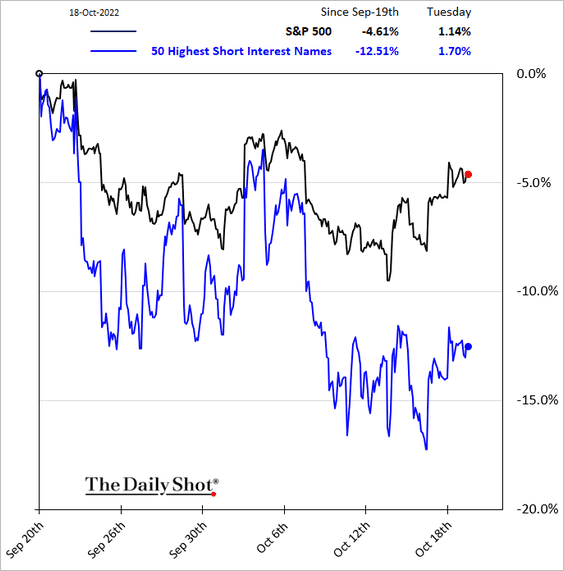
6. Most shorted stocks are still lagging.
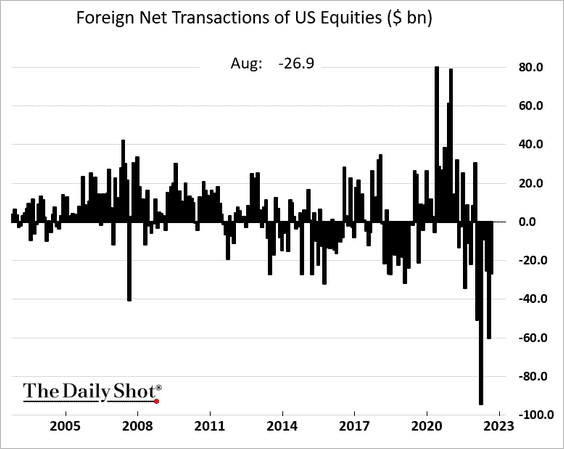
7. Foreigners continued to sell US stocks in August (8 months in a row).
8. The IPO bubble burst has been spectacular.
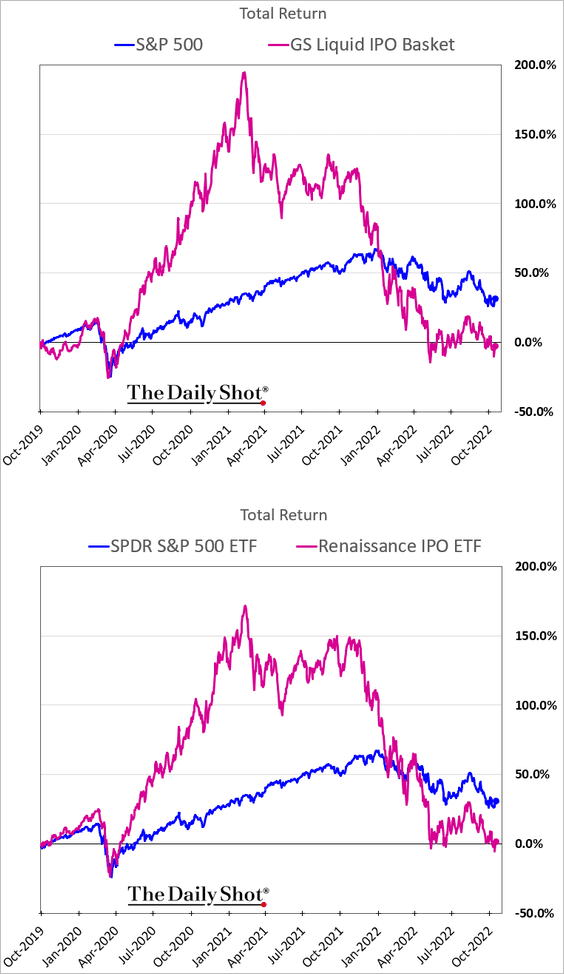
Three-quarters of US IPOs issued between 2019 and 2021 are underwater.
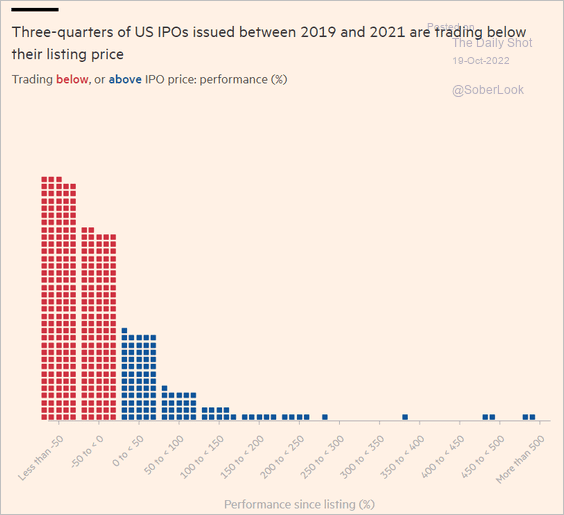 Source: @financialtimes Read full article
——————–
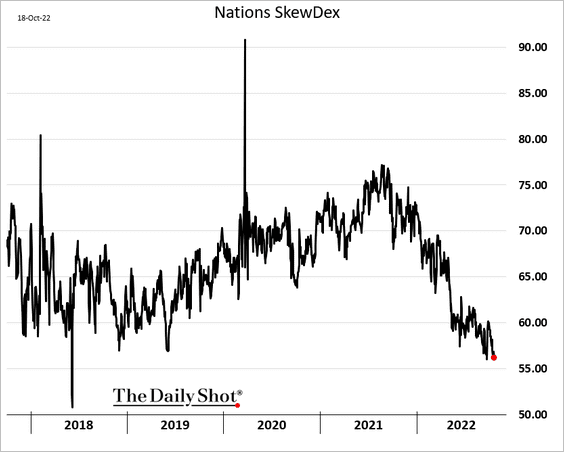
9. S&P 500 (SPY) skew remains depressed.
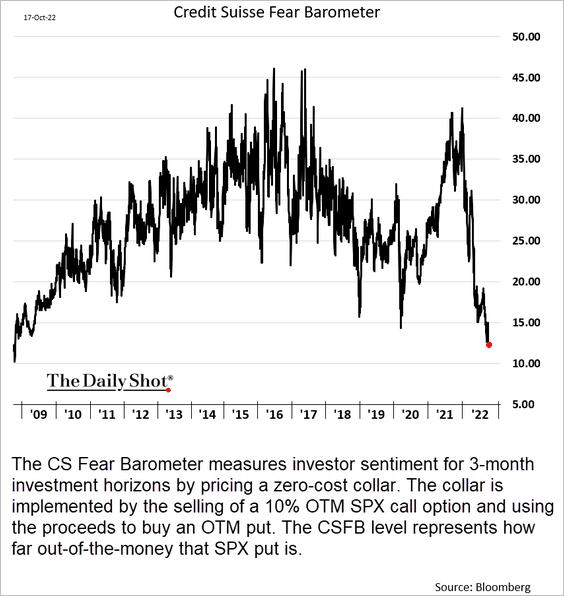
Put options are relatively cheap. Here is the Credit Suisse Fear Barometer, a zero-cost collar index (see definition below).
Back to Index
Alternatives
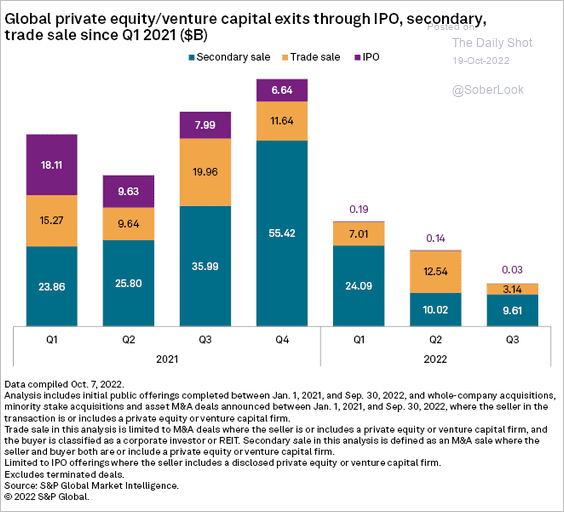
1. Let’s start with PE/VC exits by quarter.
 Source: S&P Global Market Intelligence
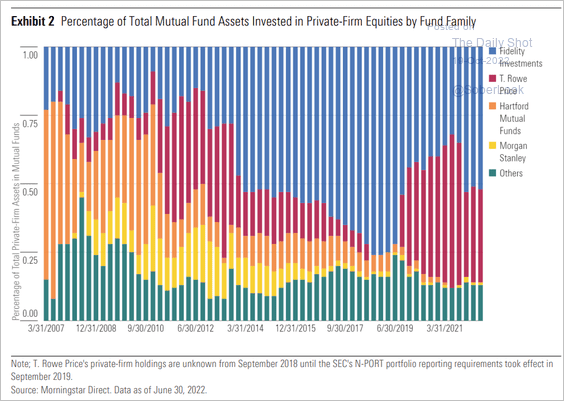
2. Here is the distribution of mutual funds’ investments in private firms (2 charts).
 Source: Morningstar
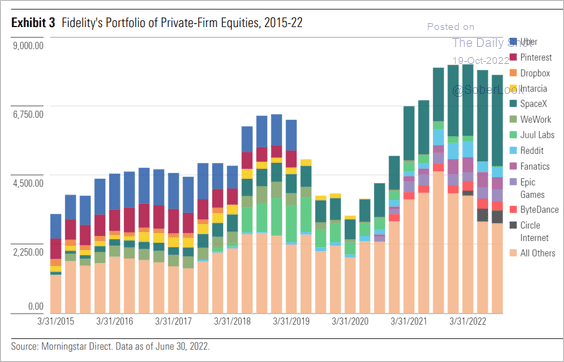 Source: Morningstar
——————–
3. So far, late-stage US venture capital valuations are back near 2020 full-year figures. PitchBook expects valuations to keep falling amid a difficult capital-raising environment.
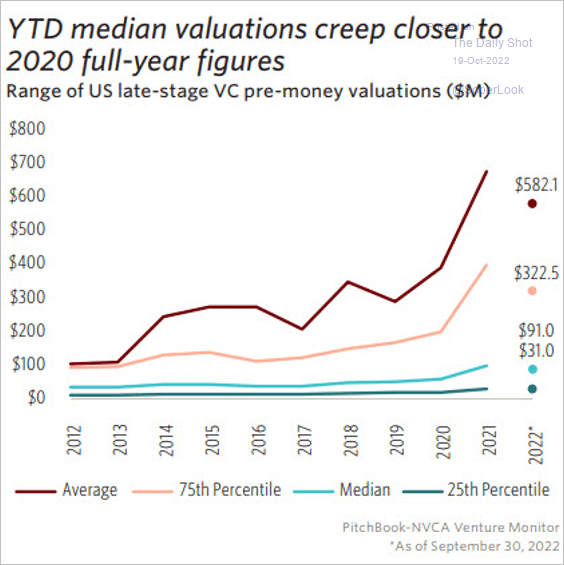 Source: PitchBook
4. As risk aversion rises, experienced firms increasingly dominate VC activity.
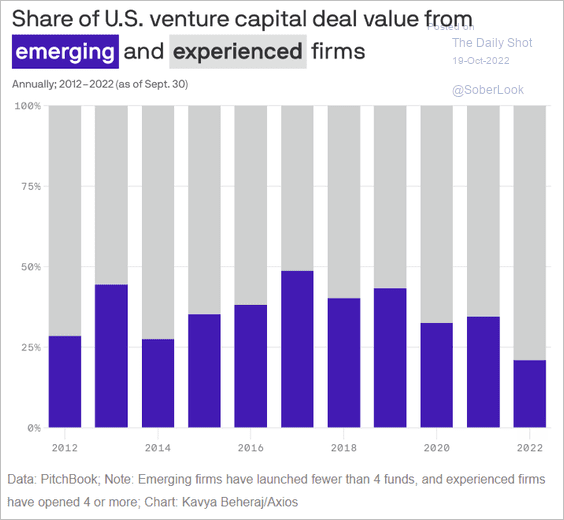 Source: @axios Read full article
5. Venture debt has become a big business.
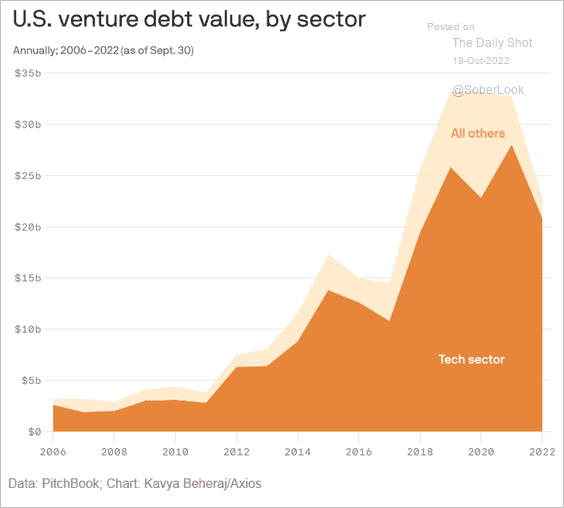 Source: @axios Read full article
Back to Index
Rates
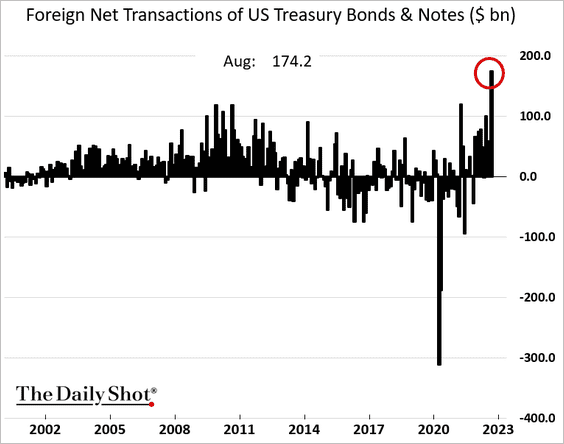
1. Foreign purchases of US Treasury notes and bonds surged in August.
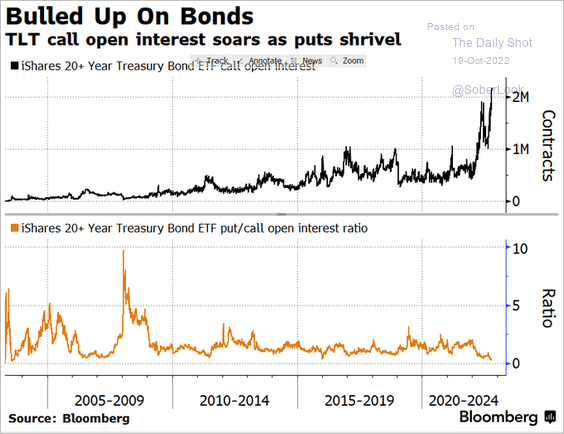
2. Call option activity on the iShares 20+ Year Treasury Bond ETF has been surging. The put/call ratio (2nd panel) is at multi-year lows.
 Source: @kgreifeld
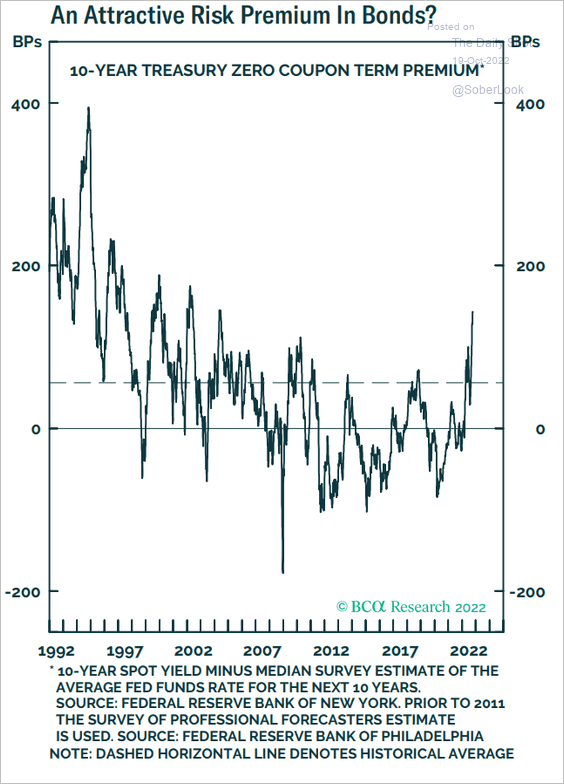
3. Treasury term premium has been climbing.
 Source: BCA Research
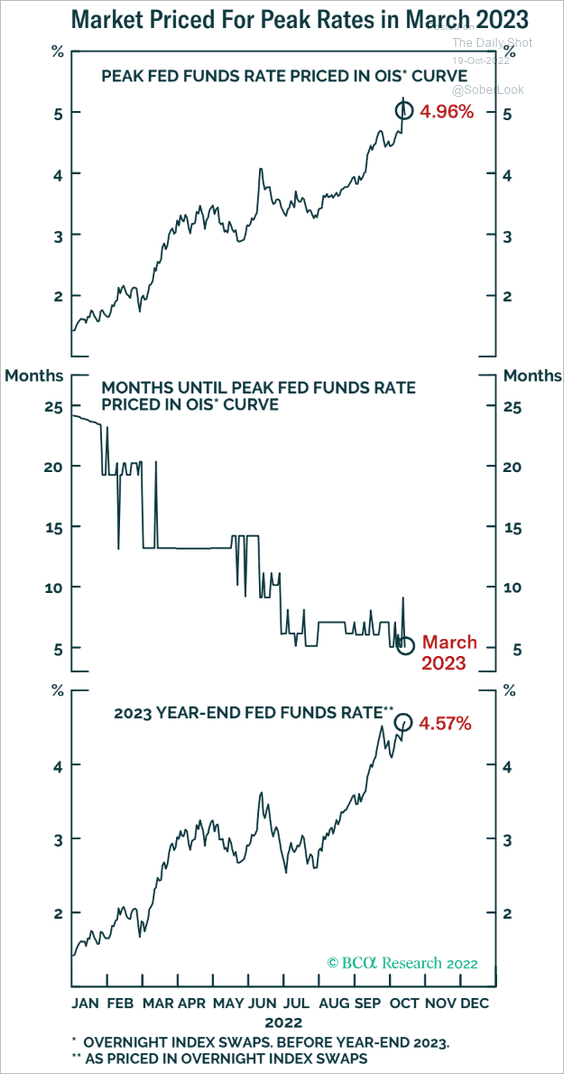
4. The market sees the fed funds rate peaking in March.
 Source: BCA Research
• How high will it get? Here is the BofA’s survey of fund managers.
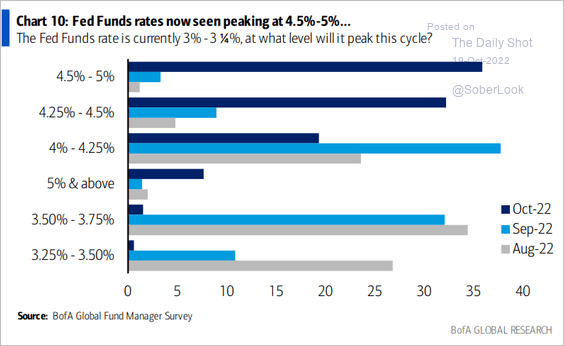 Source: BofA Global Research
• When will the rate hiking cycle end?
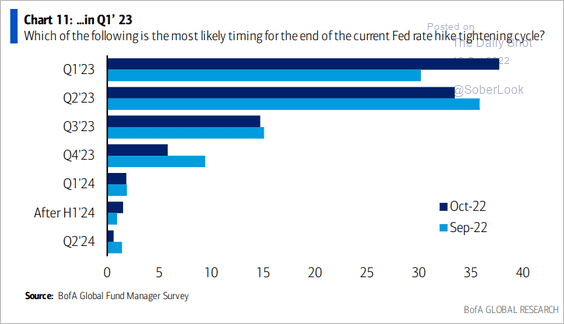 Source: BofA Global Research
• Rates are expected to stay higher for longer amid entrenched inflation.
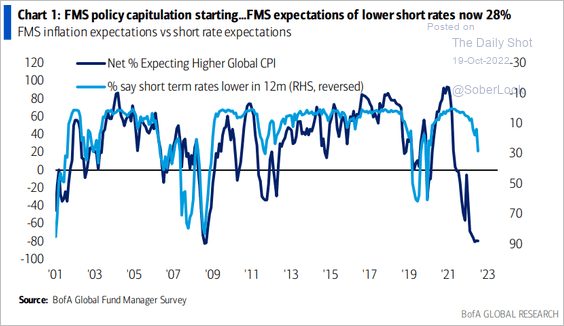 Source: BofA Global Research
——————–
5. R* (see definition) has been rising. Assuming long-term inflation at 2%, the current 3% fed funds rate is just starting to move into restrictive territory.
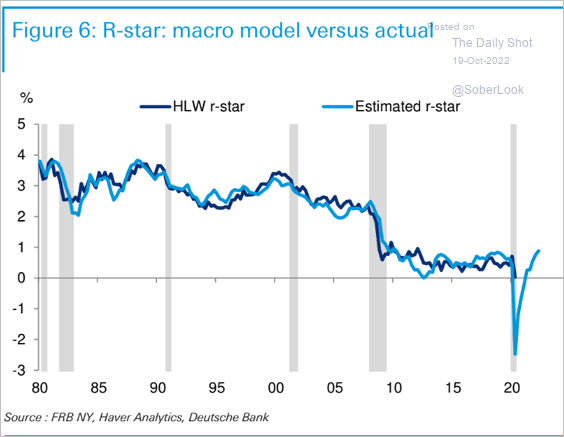 Source: Deutsche Bank Research
Back to Index
Global Developments
1. Global government debt/GDP remains elevated, funded in part by central banks. (2 charts)
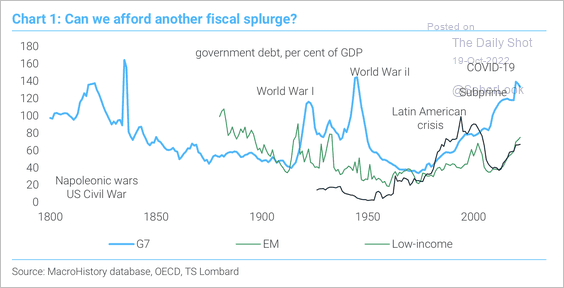 Source: TS Lombard
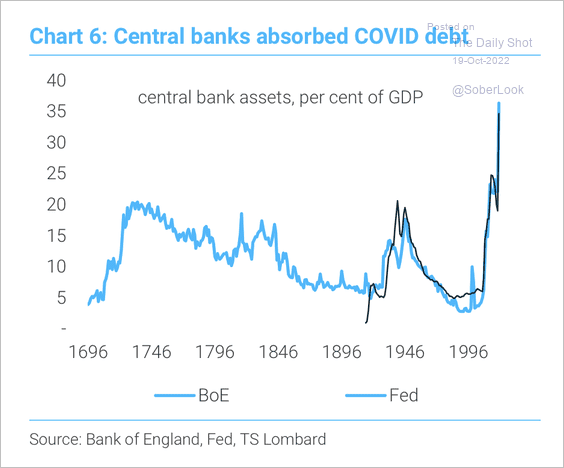 Source: TS Lombard
——————–
2. Fund managers see current risk levels near the GFC peak.
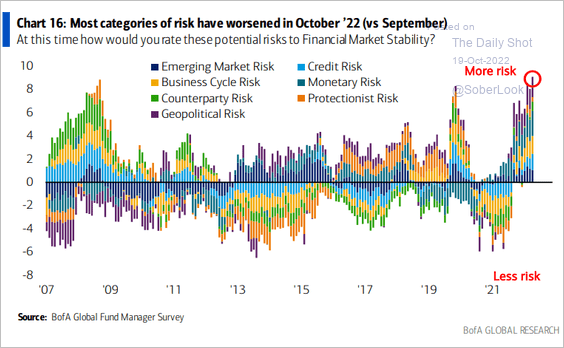 Source: BofA Global Research
Global risks have broadened.
 Source: Quill Intelligence
——————–
3. Oxford Economics disagrees with the IMF’s 2023 economic forecasts.
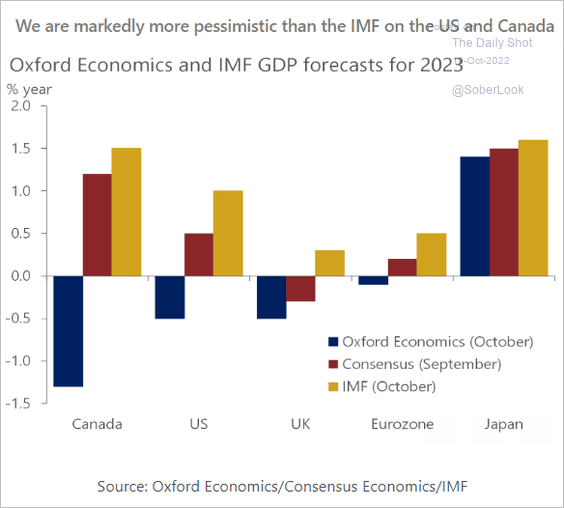 Source: Oxford Economics
Here is a forecast from Fitch Solutions.
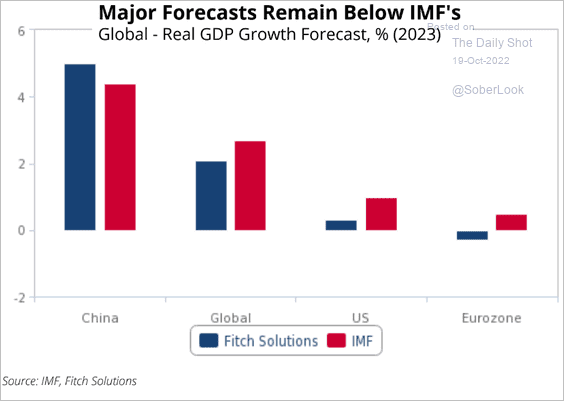 Source: Fitch Solutions Macro Research
——————–
Food for Thought
1. Worker burnout rates:
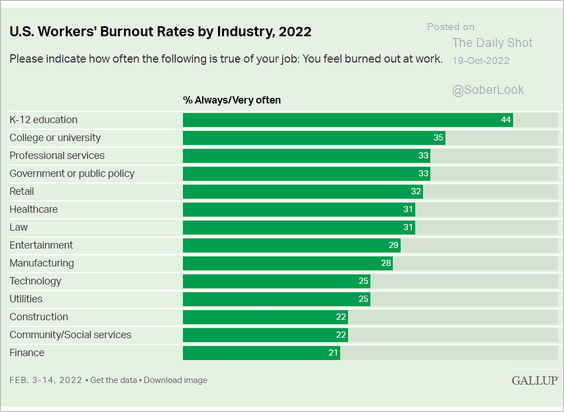 Source: Gallup Read full article
• Google search activity for work behavior buzzwords:
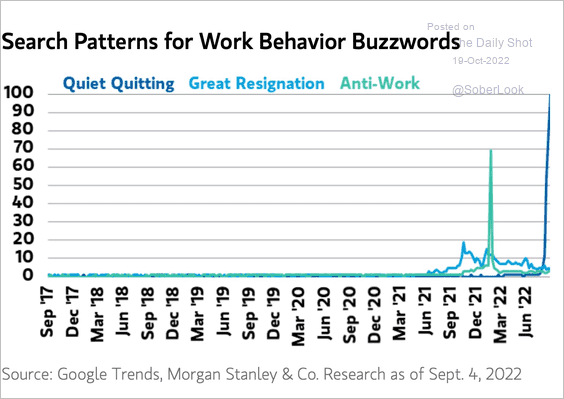 Source: @acemaxx, @MorganStanley
——————–
2. Child poverty rates:
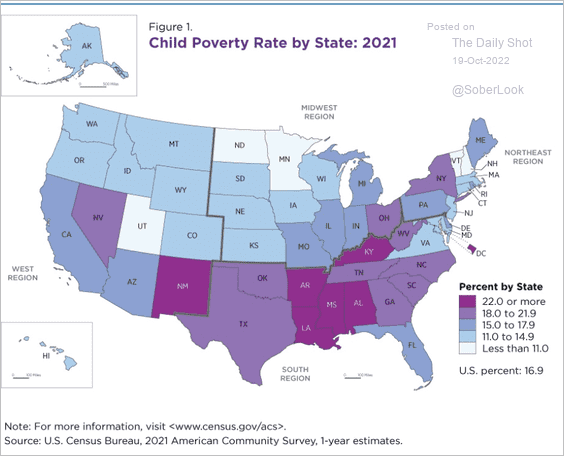 Source: US Census Read full article
3. Thwarted attempts to bring firearms on the plane:
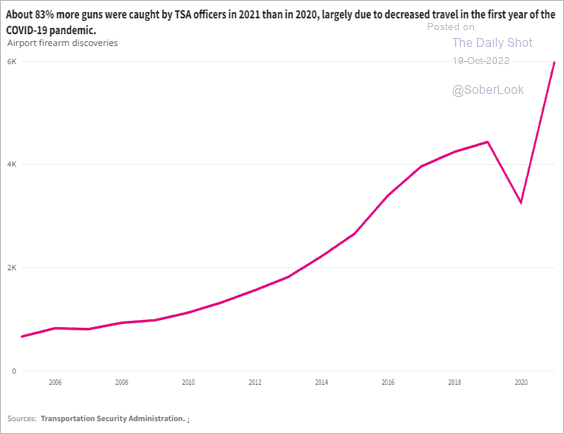 Source: USAFacts
4. Desire for a third major political party in the US:
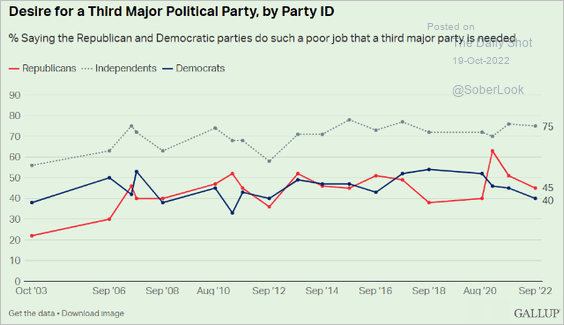 Source: Gallup Read full article
5. Women in need of contraceptive services:
 Source: @financialtimes Read full article
6. Discontent in Iran:
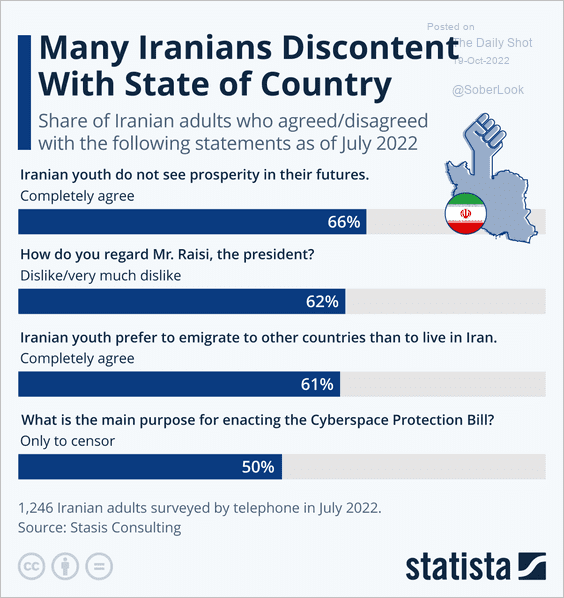 Source: Statista
7. Harvard students’ average GPA:
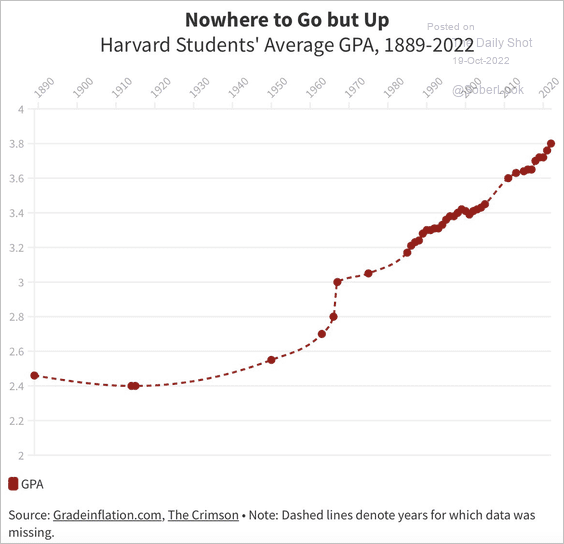 Source: @jasonfurman, @aden_barton Read full article
——————–
Back to Index